Article

Assessment of Quality in Osteoporotic Human Trabecular Bone and Its Relationship to Mechanical Properties

by
Gerardo Presbítero
1,*,†,
David Gutiérrez
2,*,†,
Wendy Ruth Lemus-Martínez
2,
José Félix Vilchez
3,
Pedro García
3 and
Ana Arizmendi-Morquecho
4
1
Centro de Ingeniería y Desarrollo Industrial (CIDESI), Sede Nuevo León, Apodaca 66600, Mexico
2
Centro de Investigación y de Estudios Avanzados (Cinvestav), Unidad Monterrey, Apodaca 66600, Mexico
3
Facultad de Medicina, Universidad Autónoma de Nuevo León (UANL), Monterrey 64460, Mexico
4
Centro de Investigación en Materiales Avanzados S. C. (CIMAV), Unidad Monterrey, Apodaca 66628, Mexico
*
Authors to whom correspondence should be addressed.
These authors contributed equally to this work.
Appl. Sci. 2021, 11(12), 5479; https://doi.org/10.3390/app11125479
Submission received: 25 May 2021 / Revised: 9 June 2021 / Accepted: 11 June 2021 / Published: 13 June 2021

Abstract

:
We propose an experimental technique for the estimation of quality parameters of post-mortem human bone samples with signs of osteoporosis. Since we were interested in characterizing bone microstructure by evaluating porosity, trabecular thickness, and space, we obtained reference values of those parameters for some of our samples through micro-computerized tomography (micro-CT). Nevertheless, as such technology is not widely available, here we used a 2D imaging approximation of those quality parameters. We based our estimation on simple digital microscopy and calibrated to ensure a percentage of similarity higher than 95% in comparison to those values achieved through micro-CT. Additionally, we subjected our samples to mechanical testing to obtain a complete characterization of our samples and to provide a preliminary assessment of the possible relationship between clinical tests of bone mineral density (BMD) and bone quality parameters. Our results show that BMD may have very low specificity in the assessment of the authentic microstructure of bone, then a broader analysis of quality parameters is required to enhance the reliability of future osteoporosis diagnosis technologies.

1. Introduction

Bones are living structures with high stiffness, but capable of transmitting compression, bending, and torsion loads. Additionally, they achieve all this with minimum weight and high efficiency [1]. At the macroscopic level, there are two forms of bone tissue: compact (cortical) and spongy (trabecular). Cortical bone is a dense solid material formed by microscopic canals, and it accounts for 80% of the skeleton. The remaining 20% corresponds to the trabecular bone, which has a complex microstructure comprised of a group of rods (trabeculae) forming a disorganized mesh. The principal characteristic of the trabecular bone is its porosity, which depends on pore size. Bone strength depends on its quantity and quality [2,3,4].
Bone quantity refers to factors such as bone mineral density (BMD) and porosity, while bone quality (specifically in the trabecular bone) is related to material composition and material properties, including microstructure and geometry, assessed in terms of trabecular space, mechanical properties such as fracture resistance, Young’s modulus, and trabecular thickness [5,6]. All these properties make trabecular bone a potential mechanical element designed to absorb energy from impacts transmitted through the joints.
The biomechanical competence of trabecular bone is dependent not only on the absolute amount of bone, but also on the trabecular microarchitecture [6]. See, for example, the Y-shaped structure that forms in the trabecular architecture of the dens in cases of odontoid process fractures [7]. This structure is the result of extensive stresses submitted at the first and second cervical vertebra, and its study provides new insights into biomechanical responses of C2 under physiological loading and traumatic conditions.
Here, we are interested in osteoporosis, which directly affects bone strength and increases the risk of fracture [8]. For its evaluation, BMD quantification is performed in elderly patients through bone densitometry tests, with the use of dual-energy X-ray absorptiometry (DXA) [9,10]. Specifically, this device measures the quantity of mineralization in different areas of the skeleton, but it is most often applied to lumbar spine and proximal femur (total femur and femoral neck), as these are the gold-standard zones accepted by the International Society of Clinical Densitometry. High BMD does not confirm low-risk fracture, as it does not consider the quality of bone, yet the evaluation of BMD through DXA has proved clinically useful in assessing osteoporotic tendencies [11]. Nevertheless, DXA does not confer fully accurate approximations towards fracture risk assessment [12,13,14,15], as DXA measures are insensitive to mechanical relevant alterations in bone quality [16].
An important consideration is that a relatively small reduction in BMD can result in a dramatic increase in the risk of fracture due to the non-linear relationship between bone density and strength [17]. Yet, only 60% of the variation in bone strength can be predicted by means of BMD assessment [18]. Although the assessment of BMD through the DXA technique gives general information about total bone mass, it does not provide information about the structural conditions of the trabecular bone. Hence, adding such structural information (bone geometry, cortical thickness, porosity, as well as trabecular bone morphology) to the osteoporosis diagnosis is key to increase reliability.
In addition to osteoporosis diagnosis, the study of bone quality has a broader clinical relevance, as congenital and hereditary factors also have an impact in trabecular conformations. For example, in [19], significant variations in structural composition of trabeculae were found among patients with adolescent idiopathic scoliosis (AIS) and age-matched congenital scoliosis (CS). Other studies interested in trabecular conformation are related to the treatment of congenital and acquired craniofacial deformities [20], congenital hypogonadotropic hypogonadism (CHH), Kallmann syndrome (KS) [21], and telomere dysfunction [22].
Although we orient our study to the analysis of trabecular regions, it is important to mention that several publications have extensively analyzed the cortical zones. For example, in [23], they used static pictures taken on transverse modality and found increased porosity with age, leading to cortical thinning. Other studies worth mentioning that studied the increase in the size of cortical pores with age and the associations of structural characteristics in cortical bone with fracture are [24,25,26].
Therefore, our study aims to contribute to the knowledge of bone quality parameters in bone with osteoporosis. Three-dimensional micro-imaging techniques accurately obtain such parameters. However, limited access to such technology makes it difficult for this analysis to become a widespread effort. Hence, there are no consistent databases of bone quality parameters for bone modeling or clinical studies. For this reason, our approach to the problem of bone quality assessment is through a 2D imaging approximation capable of attaining results comparable to those obtained with scarcely available and expensive technologies. Following on previous studies, our work here proposes a preliminary comparative analysis between parameters of quality and quantity of trabecular bone to get greater insight on their relation to those of bone resistance.

2. Materials and Methods

The Bone and Tissue Bank of the Autonomous University of Nuevo Leon (UANL) hospital provided thirteen samples corresponding to sections of femoral necks from seven cadavers. Each specimen was classified according to age as follows:
  • One bone sample from a 25 years old male donor, used as a reference for non-osteoporotic bone;
  • Three bone samples from 45, 52, and 68 years-old female donors used for test of osteoporotic condition;
  • Three bone samples from 50, 57, and 64 years-old male donors, also used for the examination of osteoporosis.
A freeze-drying process was induced to the samples to preserve the bone. Figure 1 shows two of the specimens donated, where the top figures belong to the 25 years-old male, while the bottom ones correspond to the 68 years-old female.

2.1. Machining Process

The machining process to be explained next, as well as the rest of the analysis process, was performed on an availability basis, meaning that not all samples were available at the same time nor in the same order as listed in the beginning of Section 2.
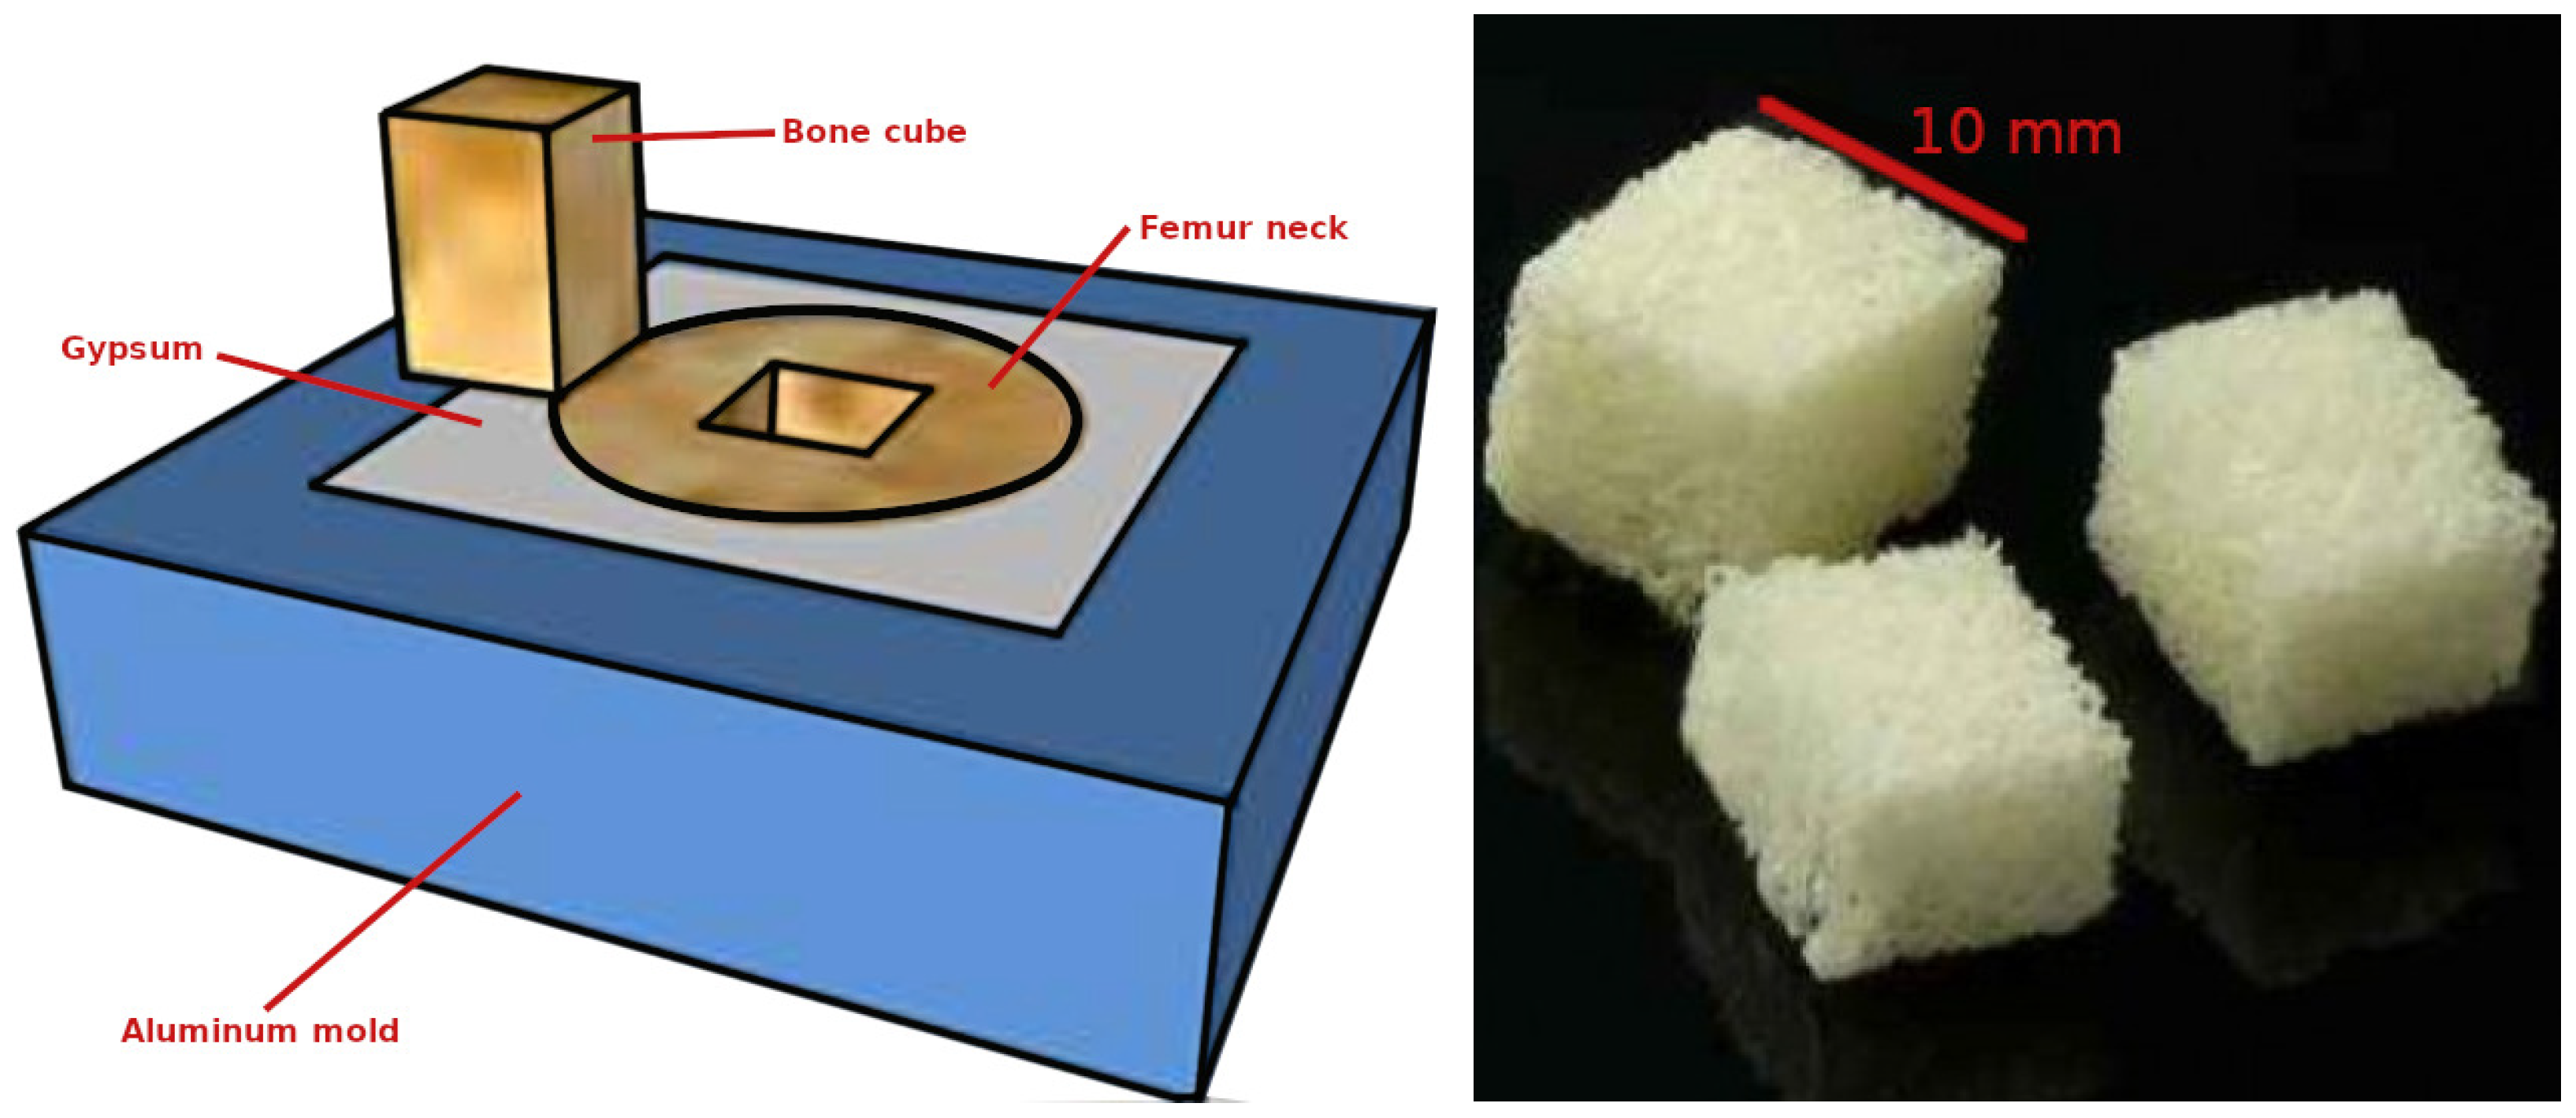
The samples underwent a machining process to obtain from them bone cubes. We prepared a gypsum and water mixture in a container and emptied it into an aluminum mold. While the compound was still fresh, a femoral neck section, placed directing the longitudinal orientation of the primary tensile trabeculae, was introduced into it. Then, the mixture with the bone inside was left to dry. Once the mixture dried, the bone was cut in the form of a cube, using the mold as a support and a computer numerically controlled (CNC) machine. The cubic shape of the samples was set to 10 mm per side. Note that, in some cases, we were able to obtain up to two bone cubes from a single femoral head, as its shape accommodated the required cuts to achieve it. A representation of the machining process and examples of the bone cubes obtained can be seen in Figure 2.

2.2. Bone Densitometry

Each of the bone cubes was analyzed by bone densitometry to know their level of mineralization and confirm osteoporosis in the donor. Densitometry tests were carried out through DXA, using equipment provided by the Osteoporosis Center of the UANL hospital. As a result, the obtained BMD values (g·cm−2) and T-score numbers determined the diagnosis of the patient. T-scores compare the BMD of patients (BMD P ) with the average BMD (BMD AVG ) of the corresponding population, i.e., T - score = ( BMD P BMD AVG ) / SD , where SD is the standard deviation. Classification is performed within one of the three diagnoses, depending on the T-scores: normal, osteopenia, or osteoporosis [15,27].

2.3. Assessment of Bone Micro-Architecture

The trabecular bone micro-architecture was assessed with imaging techniques, in particular the porosity, trabecular thickness (denoted as Tb.Th), and trabecular space (denoted as Tb.Sp). In our case, X-ray micro-computerized tomography (micro-CT) was the gold standard for those measurements. Due to the scarce availability of such equipment, we used an alternative 2D imaging approximation for the analysis of porosity, calibrated to provide minimum error when comparing measurements of different porous materials through both the gold standard and our 2D estimation.

2.3.1. Micro-CT Analysis and 3D Estimation of Porosity

Under those conditions, our gold-standard measurements were performed with a benchtop micro-CT built at the Physics Institute (IF) of the National Autonomous University of Mexico (UNAM), as well as with the use of a patented CT equipment (twinned orthogonal adjustable tomography -TORATOM-, EP 2835631):
  • The device at IF-UNAM [28] is an Oxford Instruments Apogee XTG5011 tungsten anode X-ray tube with a nominal focal spot size of 35 µm, coupled to a Rad-icon Shad-o-Box 2048 flat panel detector (Teledyne DALSA Incorporated, Waterloo, ON, Canada). The collection of the projection image data were at 50 kVp, 1 mA with an integration time of 500 ms per frame and 360 orbit in 1 steps.
  • TORATOM has a specific geometry movable to attain magnifications between 1.2 and 150 and comprises of two X-ray tube-detectors with accelerating voltage between 20 and 240 kV, maximum power of 260 W, and minimum spot size between 0.8 and 5 µm. TORATOM included as well one Dexela 1512CL X-ray detector (XWT-160-TCHR, X-ray WorX, Garbsen, Germany), with a sensitive area of 145.4 × 114.9 mm, and resolution of 1944 × 1536 mm pixels and pixel size of 74.8 µm; and a flat panel detector XRD 1622 AP 14 (Perkin Elmer, Waltham, MA, USA) with an active area of 409.6 × 409.6 mm, resolution of 2048 × 2048 pixels and pixel size of 200 µm.
Four of our testing bone cubes were analyzed through micro-CT with the device at IF-UNAM. Additionally, we were able to use TORATOM to study samples of various materials: trabecular bone sample [29], alkaline activated composite, concrete glass, and sandstone. The purpose of using these materials, together with the bone cubes, was to have enough reference values to compare against to calibrate our proposed 2D imaging approximation of porosity. Next, we describe both the micro-CT 3D analysis and the 2D imaging approximation for the assessment of porosity.
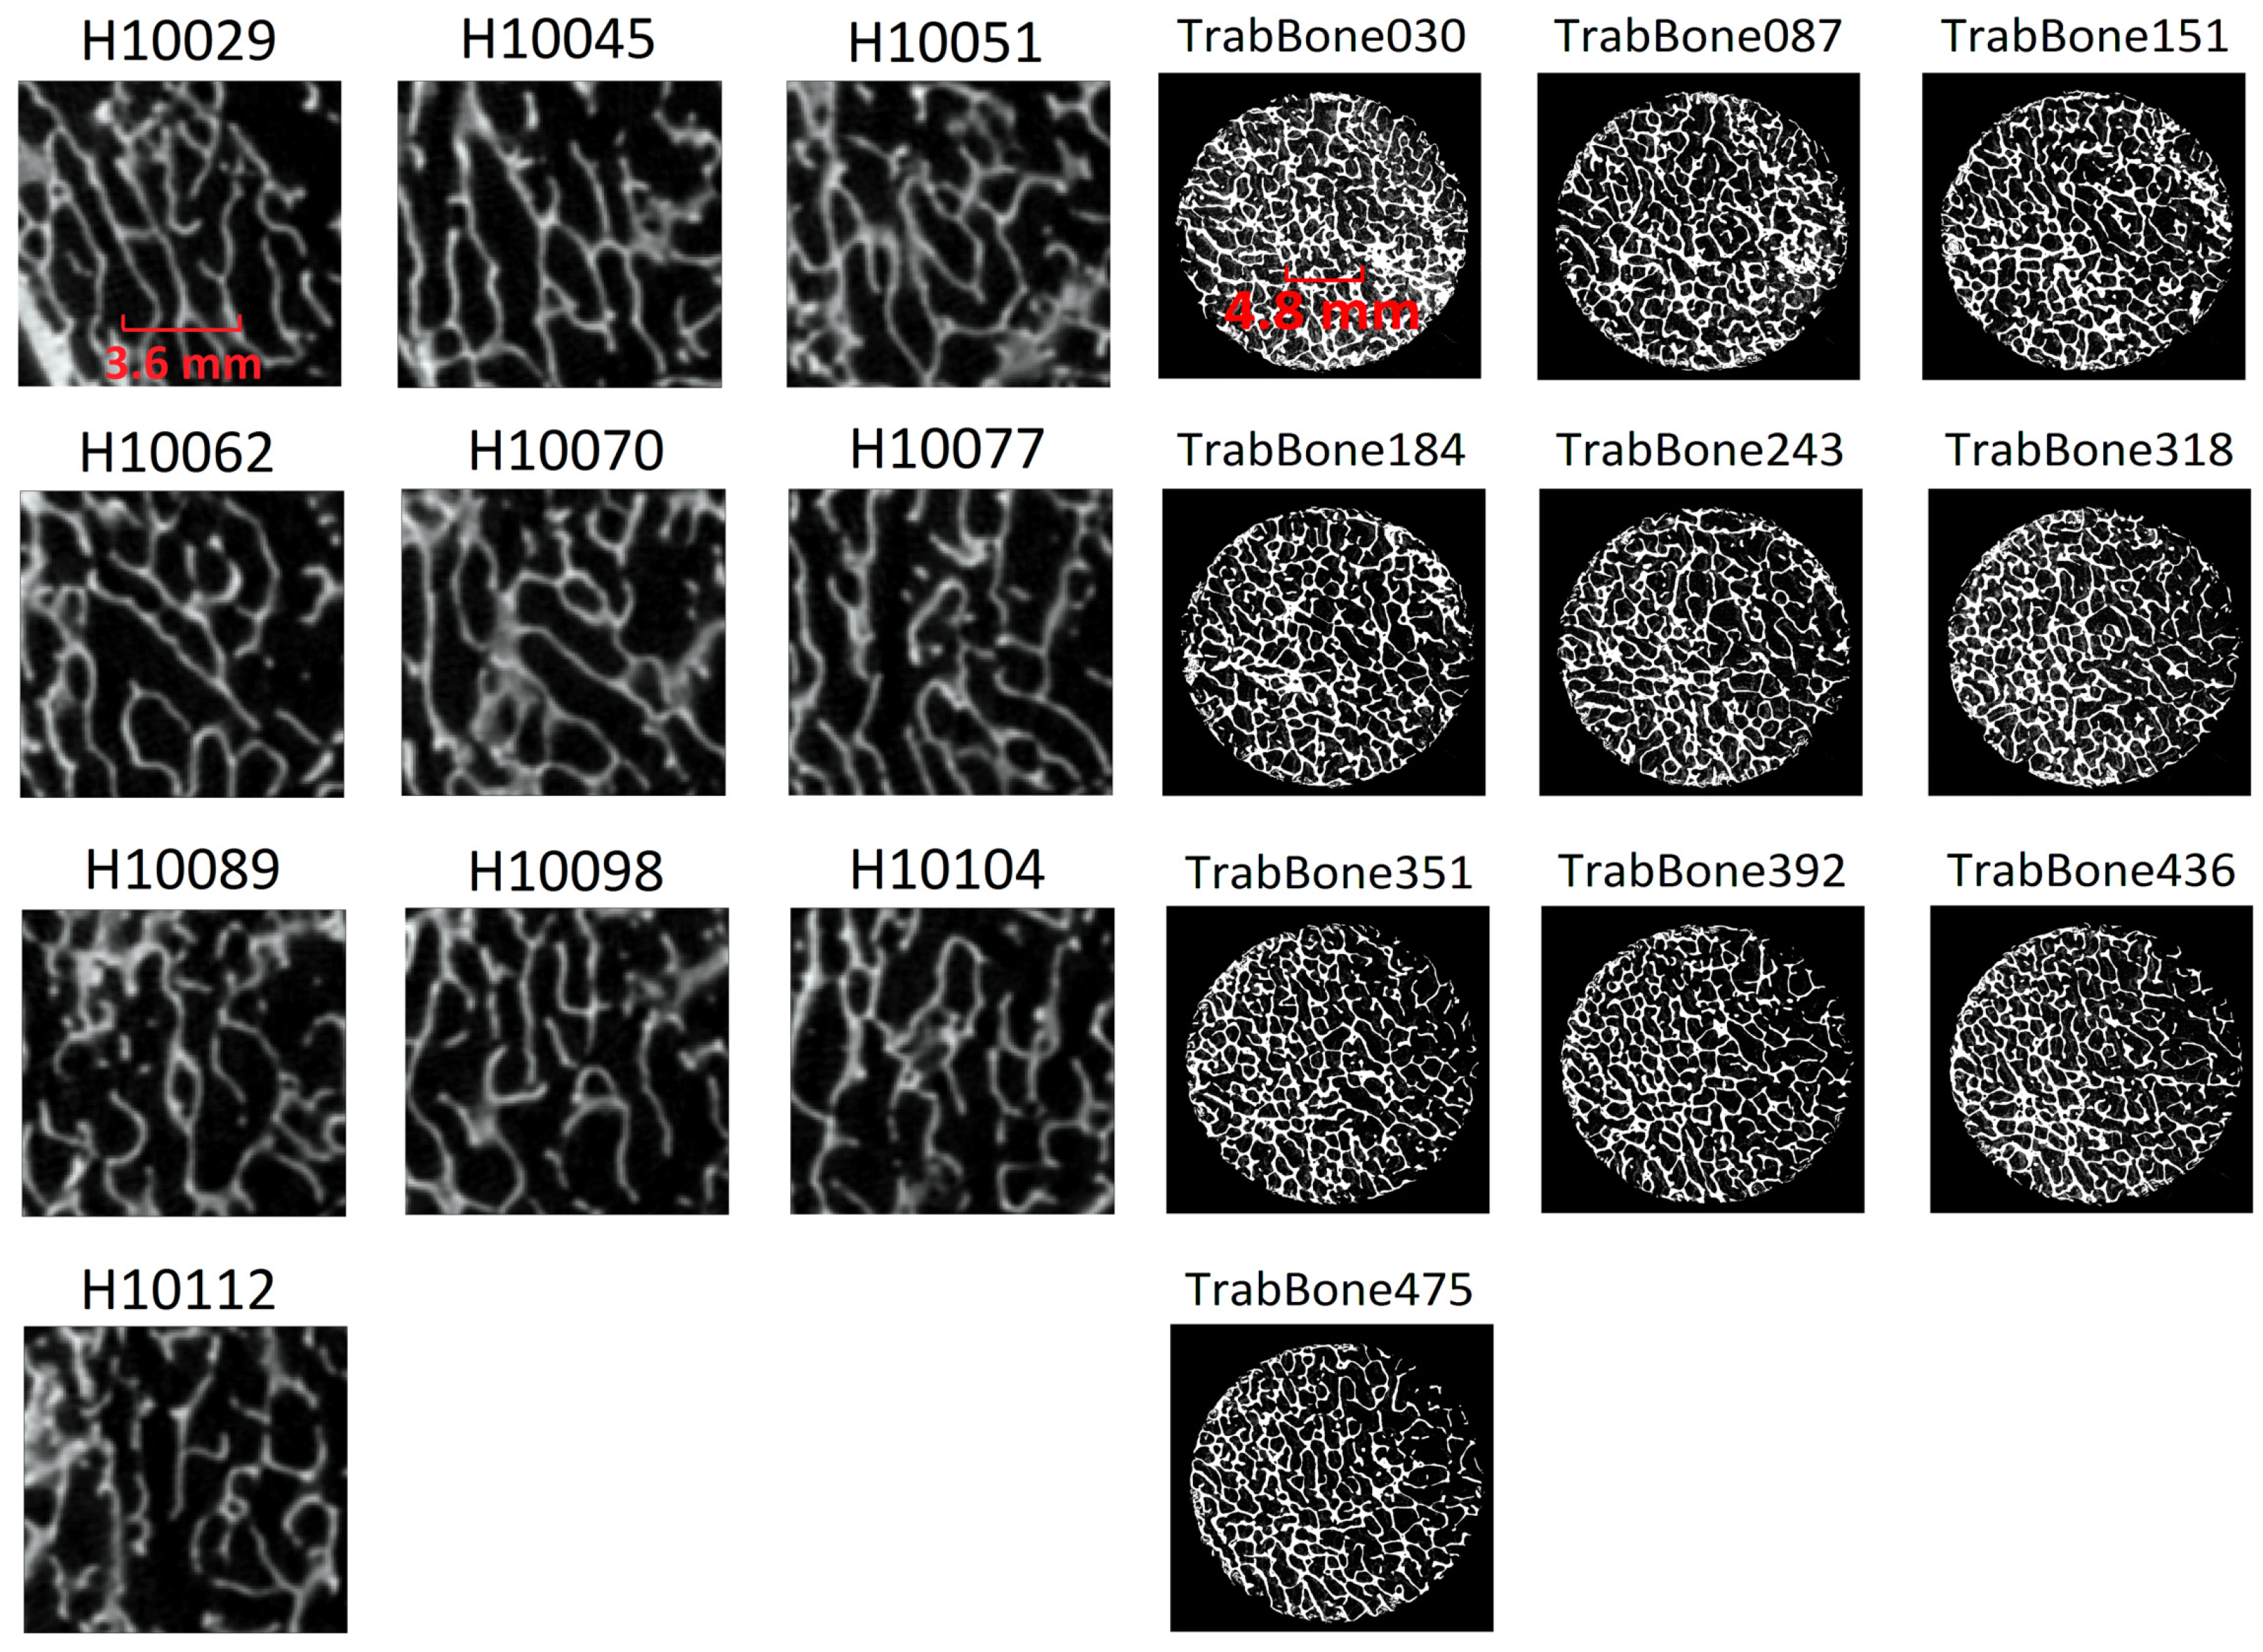
Micro-CT images allowed us to create virtual 3D models of our bone cubes with a high resolution. For proper filtering and thresholding of the images, we used the software packages Fiji [30] and ImageJ2 [31]. Furthermore, the software toolbox Pore3D [32] was used to filter and segment the images, as well as for appropriate selection and quantification of pores, attaining images of ten consecutive longitudinal and equally spaced slices of each sample from those models. Figure 3 shows examples of those images for one of our cubic bone sample and the sample of trabecular bone. For each of the samples, an isolation and quantification procedure of pores followed the corresponding micro-CT and their reconstructions.

2.3.2. 2D Imaging Estimation of Bone Structure

For the estimation of the porosity of our bone cubes, we used a 2D imaging technique based on a digital microscope. Hence, the six faces of the bone cubes were dyed in black to create contrast at its surface between trabeculae and pores. Next, the AF4515ZTL Dino-Lite microscope (https://www.dino-lite.com/, accessed 12 Jun 2021) helped to obtain photographs of each face. Each image was binarized to get areas of pores (white pixels in the binary image), the bone area (black pixels), and the total image area. Porosity is given in percentage, an it is calculated as the ratio of the pore area and the total area. Figure 4 shows an example of such a process. For the case of trabecular thickness and trabecular space, we calculated them based on the local thickness method [33], in which the thickness at a given point on the structure is defined as the maximum diameter of a circle drawn within the structure.

2.3.3. Comparing Porosity Values

From all images obtained through the processes explained in the Section 2.3.1 and Section 2.3.2, a porosity value is calculated as the ratio of black pixels to the total number of pixels in the image. In the case of the 2D imaging technique, a single estimated porosity value is obtained by averaging the porosity obtained from the 2D images of the six faces of a bone cube. Next, the bias (absolute difference in percentage) between the calculated porosity of each image obtained through the 3D technique and the estimated porosity is calculated for each bone cube. Given that the 3D imaging technique provides images of at least ten longitudinal slices, mean and standard deviation of the bias can be obtained for each bone cube.

2.4. Mechanical Testing

The AG-X SHIMADZU universal testing machine, located at the Center for Research in Advanced Materials (CIMAV), Monterrey’s Unit, was used for the compression testing in the total number of specimens. Stress–strain diagrams helped to acquire the following mechanical properties, after carrying out the tests under a speed of 1 mm/min:
  • Ultimate stress ( σ max ), which is the maximum stress attained in the stress–strain diagram;
  • Yield stress ( σ y ), which is the amount of stress required towards the permanent deformation;
  • Young’s modulus (E), which is the relationship between stress (force per unit area) and strain (proportional deformation) within the linear region in the uniaxial deformation.
The trabecular bone sections were positioned in the machine to direct the longitudinal orientation of the human femoral neck to its primary tensile trabeculae [34].

3. Results

3.1. Porosity Assessment through Micro-CT

Table 1 details the main characteristics of each bone cube obtained from our samples (donor, gender, age, and name of the sample cube), as well as the value of porosity obtained through micro-CT when available. Note that for donors 3, 4, and 5, we had both the left and right femur heads. In most cases, we were able to obtain two bone cubes out of a single femur head through the machining process described in Section 2.1. Furthermore, note that we analyzed four bone cubes through micro-CT, as those were the only available at the time we had reserved the micro-CT machine for our study. Hence, we were able to survey the porosity of three of the seven available bone donors through our gold-reference, as well as other reference materials: trabecular bone (shown in Figure 3), alkaline composite, concrete glass, and sandstone.

3.2. Comparison of Estimated Porosity against Gold-References

Applying the comparison process described in Section 3.2, we were able to assess the bias of our estimates and determine the overall best biased estimate of porosity that provides the lowest error when compared against gold-references. Hence, we found that the best biased estimate of porosity was one standard deviation below the maximum bias. Based on that, the error between the gold-references and such best approximation was always between 0.42% and 4.32% for our bone samples and the trabecular bone sample from [29]. For sandstone, concrete glass, and alkaline activated composite, the bias was 1.66%, 14.63%, and 24.77%, respectively. Note that, for the most porous materials, our estimations were always below 5% error and bias values were never farther than 1.5 standard deviations away from the mean value.

3.3. Percentage of Porosity in 2D

The percentage of porosity obtained from our 2D imaging estimation for all our samples is shown in Figure 5. There, we did not see a significant difference in porosity among Donor 1 and 2, although there was a difference of 5 years between them. Hence, the absence of difference could be attributable to gender, as the female population is known to be more vulnerable to osteoporosis. Furthermore, the porosity of samples of Donor 3 were within the range of 61% to 68% and there was a difference of two years in comparison to Donor 2. Again, the slightly increased value might be gender-related. Finally, even though the age of the male donor of samples Donor 4 was considerably higher than the age of the previous donor, it seemed to be no porosity difference between both of them. The same observation applies to the porosity of Donor 5, whose values did not increase significantly regardless of the age difference.

3.4. Bone Densitometry

We obtained BMD and T-score values through DXA, as shown in Figure 6. There, organized by age in the horizontal axes, the values obtained for all donor samples are observed in the same order as in Table 1. Note that T-score in Donors 1 to 6 shows values equal or under −6.9, which indicates their classification into the osteoporosis group. Furthermore, note that BMD values of the Donors 1 to 5 are within 0.13 and 0.29 g·cm−2, while some inter-individual variations were observed in the sample cubes from the same donors and even from the same femoral neck.

3.5. Trabecular Thickness and Space

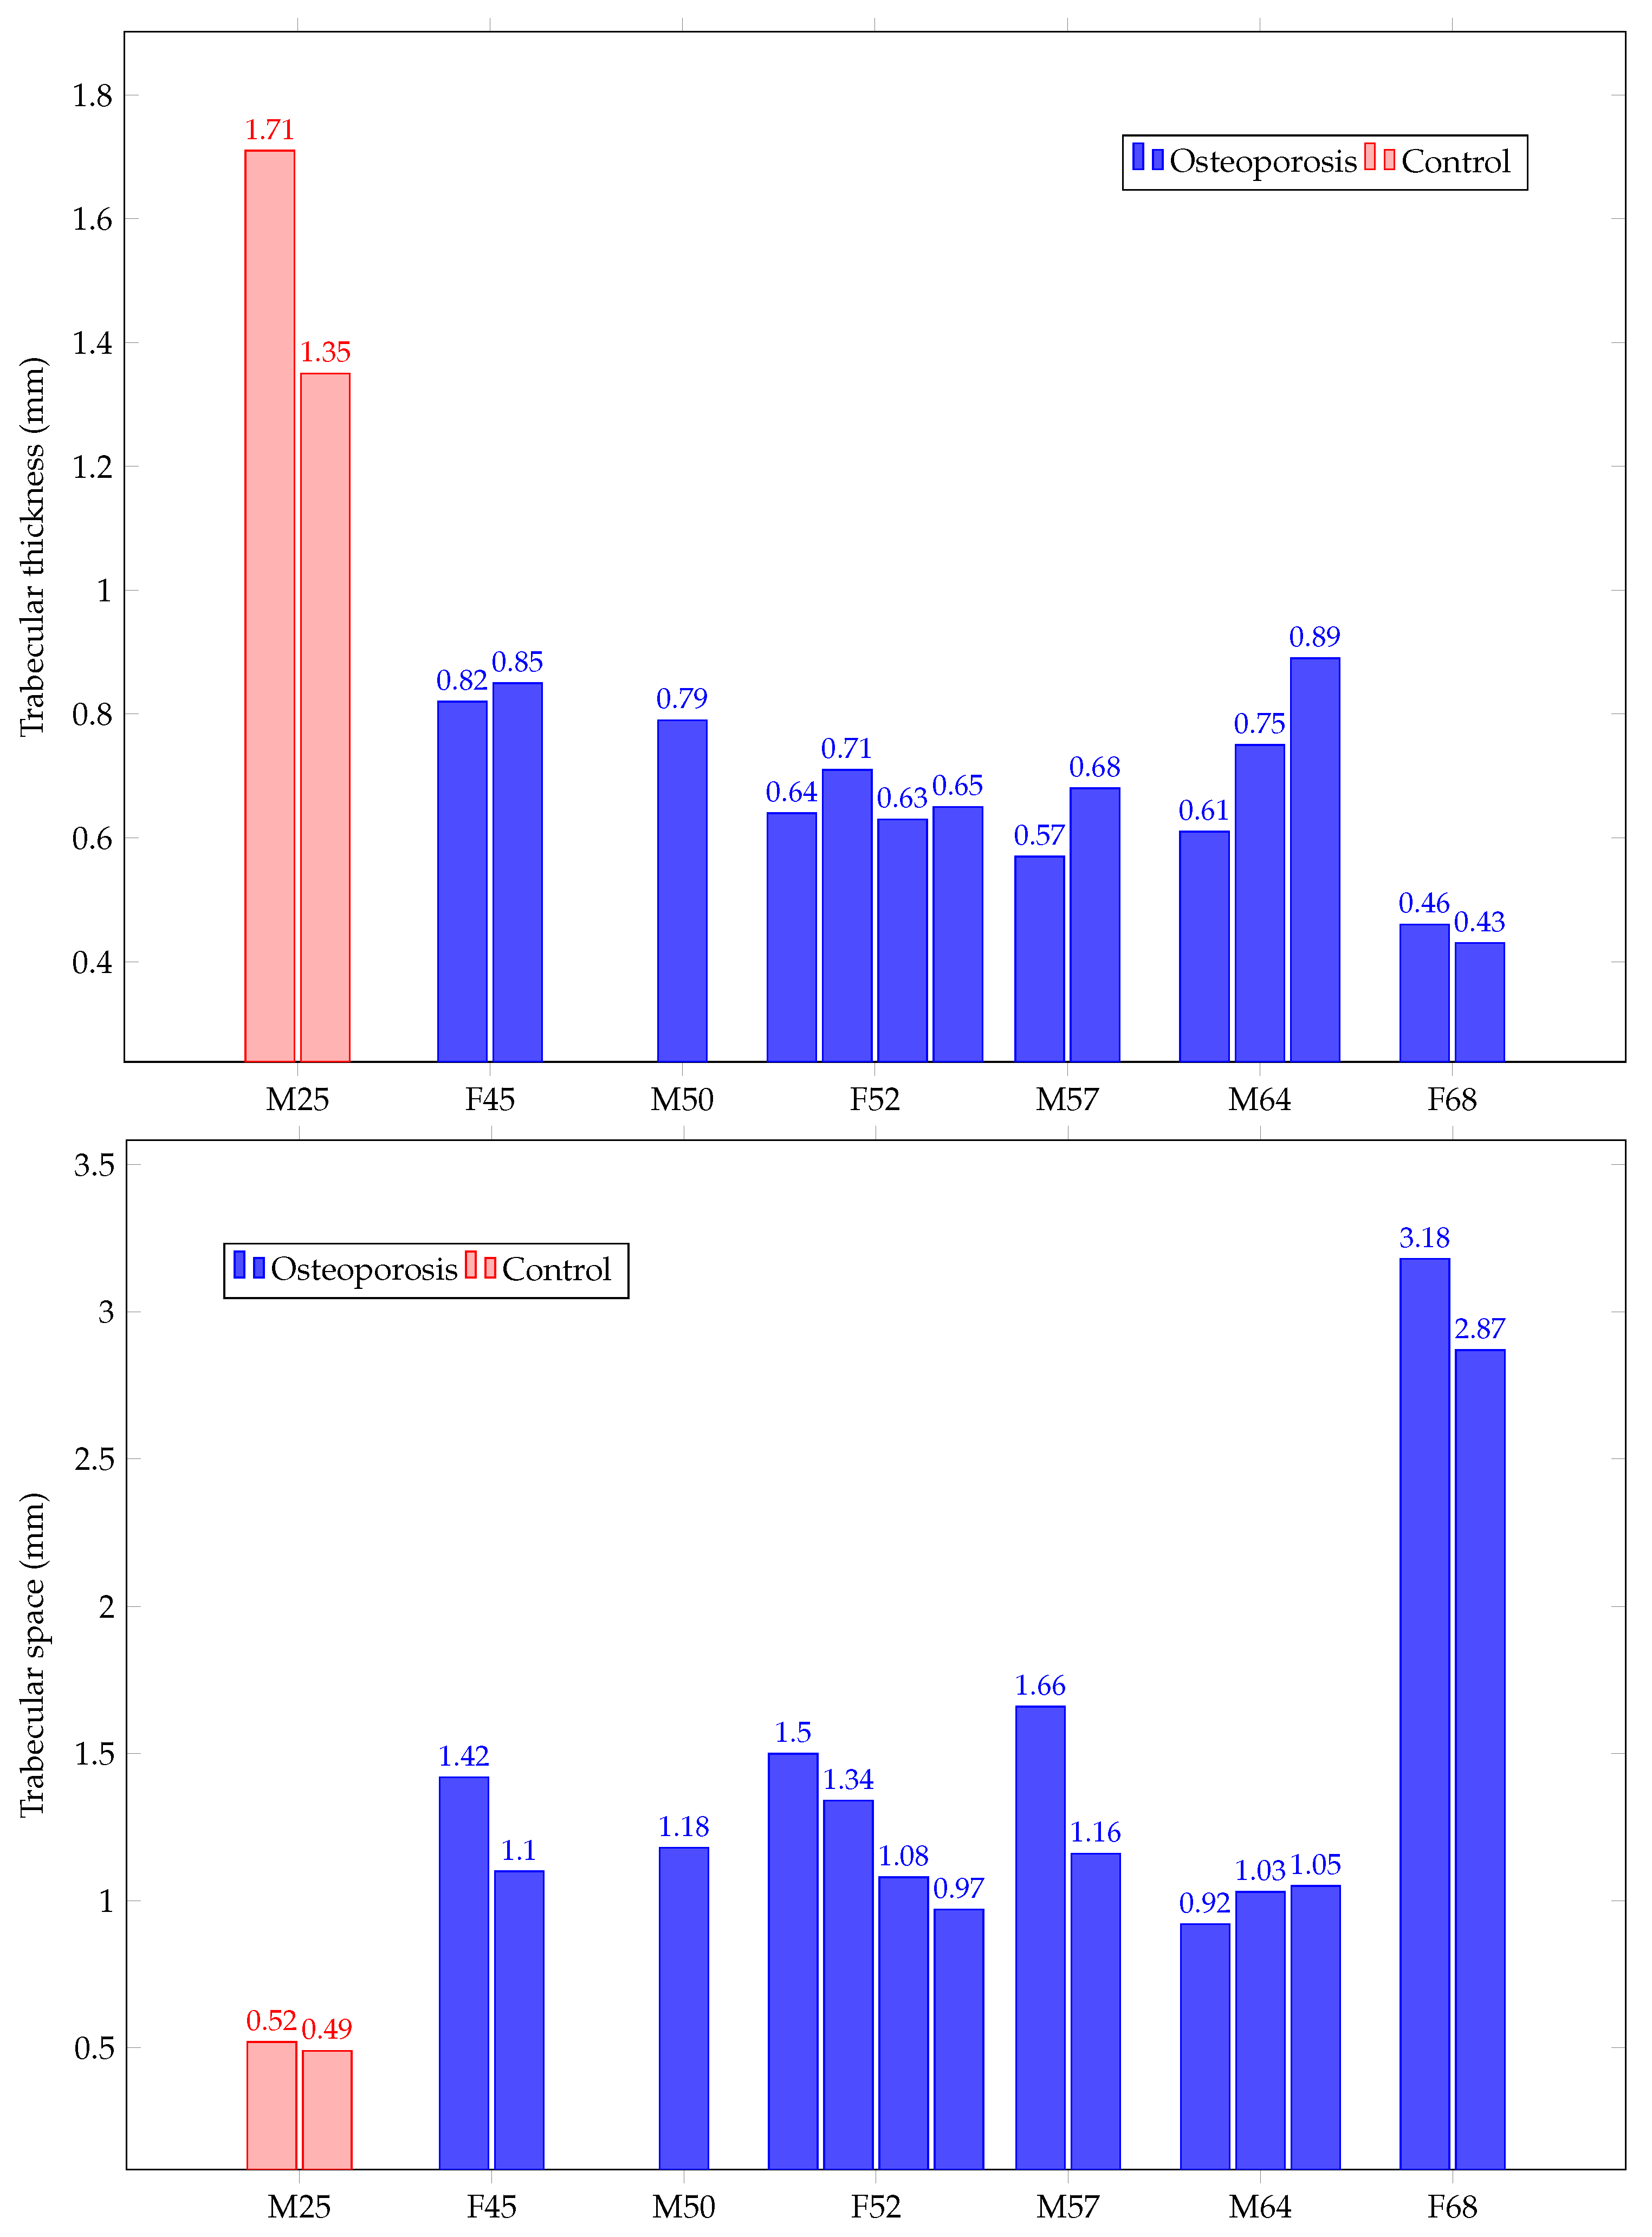
The results for trabecular thickness and space for our samples are summarized in Figure 7. The trabecular thickness for the Donors 1, 3, 4 and 6 showed similar values for each of their corresponding samples. However, for Donor 5, those values corresponding to its left femoral neck (first and second bars), seemed to have different values in comparison to the one corresponding to the right femoral head (third bar). Concerning trabecular space, the control values were significantly smaller than the rest of the samples, as expected. On the other hand, little differences existed in donors between 45 and 64 years old, as they remained with values of Tb.Sp, within a range of 0.8 to 1.7 mm.

3.6. Compression Tests

The sixteen bone cubes were subjected to compression tests to obtain their stress–strain characterization. Table 2 shows a summary of that in terms of our parameters of interest: ultimate stress ( σ max ), yield stress ( σ y ), and Young’s modulus (E). Hence, we noticed that our results followed what was expected for normal bone (large values in all our parameters for control samples) as well as for most of our osteoporotic specimens (average values decreasing with age). Yet, some inter-individual variations were found, especially in E. In particular, Donor 1 had an average value of E lower than the following older donor, which again can be credited to gender. On the other hand, Donor 4 had mean σ max , σ y , and E values lower than expected for their age. Yet, this might be a result of mechanical tests for Donor 4 being outliers.

4. Discussion

Even though the estimation of quality parameters of our human bone samples was based on a 2D imaging technique, the calibration through the gold-reference measurements in both bone an a sample of porous material (such as sandstone) allowed to achieve a low bias in the estimation (below 5%). We believe this is important, as the cost-benefit of these studies has to be pondered between having accurate porosity values through equipment with limited access, against estimated values obtained through low-cost technology that can be calibrated to minimize error, then allowing a more all-inclusive characterization of bone samples.
Given its low bias, our approximations of porosity values using 2D images are valid estimators and can be used for further analyzing our bone samples (as well as other porous materials), the reason for which we decided to put our results in terms of those estimated values and proceeded with a comparison between quality and quantity parameters of our samples. However, a similar approximation for less porous materials is not possible due to the known non-linear relationship between specific surface and porosity. In [35], such behavior is represented as a parabolic curve that comprises the range from very compact to least dense material, showing a maximum in medium porosity levels. In our case, due to osteoporosis, all samples belong to the right-tail of such curve (least dense and more porous bone) in which the behavior can be well approximated as a linear function that models a rapid decay of the specific surface of the bone as porosity increases. More details on this can be found in [36].
Our work adds up to previous studies regarding the comparison among bone-specific surface (BS/TV) against the bone volume fraction (BV/TV). For example, [35] initially proposed a “dome-shaped” curve behavior within a fifth-order polynomial. Later, other studies improved the approximation on the relationship among those variables, for example, by analyzing 3D images of cortical femurs with synchrotron radiation [37], or through the development of a computational model of bone remodeling that integrates bone cell interactions based on bone porosity and stiffness [38]. Another example is the work of [39], where bone remodeling equations are proposed for the evaluation of the existing risks of osteoporosis fractures by taking into consideration the microstructure and magnitude of a specific surface. In that context, our work highlights the effectiveness of a comparison between two-dimensional and three-dimensional modalities in bone tissue. We show that it is possible to analyze two-dimensional images in trabecular sections through a binarization process and with comparable results as those obtained through technologies such as X-ray computed microtomography. More details on our preliminary findings are discussed next.

4.1. Bone Densitometry

Control samples (male, 25 years old) had the highest BMD values, unlike the specimens of Donor 6 (female, 68 years old), which were surprisingly low. The T-score for the control sample was found in the osteopenia classification, although its age was 25 years old. Nevertheless, it was not as low as the rest of the donors. Therefore, it is safe to say that all donors, except the one used as a control, show clear signs of osteoporosis.
It must be noted that, in clinical analyses, trabecular bone is not solely evaluated, but also an area of the skeleton that contains additional cortical bone. Cortical tissue is denser, so the sum of the mineralization of the cortical bone, plus that of the trabecular tissue, increases the T-score values up to those usually obtained in the clinic. Hence, as DXA does not differentiate between a compact (cortical) and cancelous (trabecular) tissue, BMD and T-scores appear to be underestimated in our results. Therefore, our results provide the true BMD of trabecular tissue, and this is an important assessment, as this tissue is the most affected part of bone by osteoporosis.

4.2. Trabecular Thickness and Space

In general, our results showed an average tendency to confirm the expected due to the osteoporotic condition of our samples: age affects Tb.Th and Tb.Sp, making the former lower and the latter higher. Although presenting inter-individual variations, these can be overcome with a larger donor sample to obtain a characterization capable of providing reliable information about osteoporosis based on age and gender.

4.3. Comparing Clinical Versus Trabecular BMD

Here we provide additional clinical data to confer a sense of how our obtained BMD values compare against those in clinical practice. Three intervals of BMD values are used for diagnosis purposes: normal within a BMD interval of 0.97 to 1.28 g·cm−2, osteopenia with a BMD interval of 0.70 to 0.85 g·cm−2, and osteoporosis when BMD was lower than 0.65 g·cm−2.
Under those conditions, Figure 8 shows two horizontal graphs that compare the BMD obtained from clinical trials on whole bones from different patients (top graph) and BMD values obtained at the trabecular level from our samples (bottom graph). Scales show the corresponding ranges of values between lower and higher results in each modality to facilitate comparisons. For clinical values, a range of ages and genders were chosen as a sample of typical osteopenic and osteoporotic patients. As can be noted, BMD at the trabecular level seems to have very low specificity, as most of our osteoporotic cases are clustered together, far away in the scale from our control case.

4.4. Comparison of Quality and Mechanical Tests

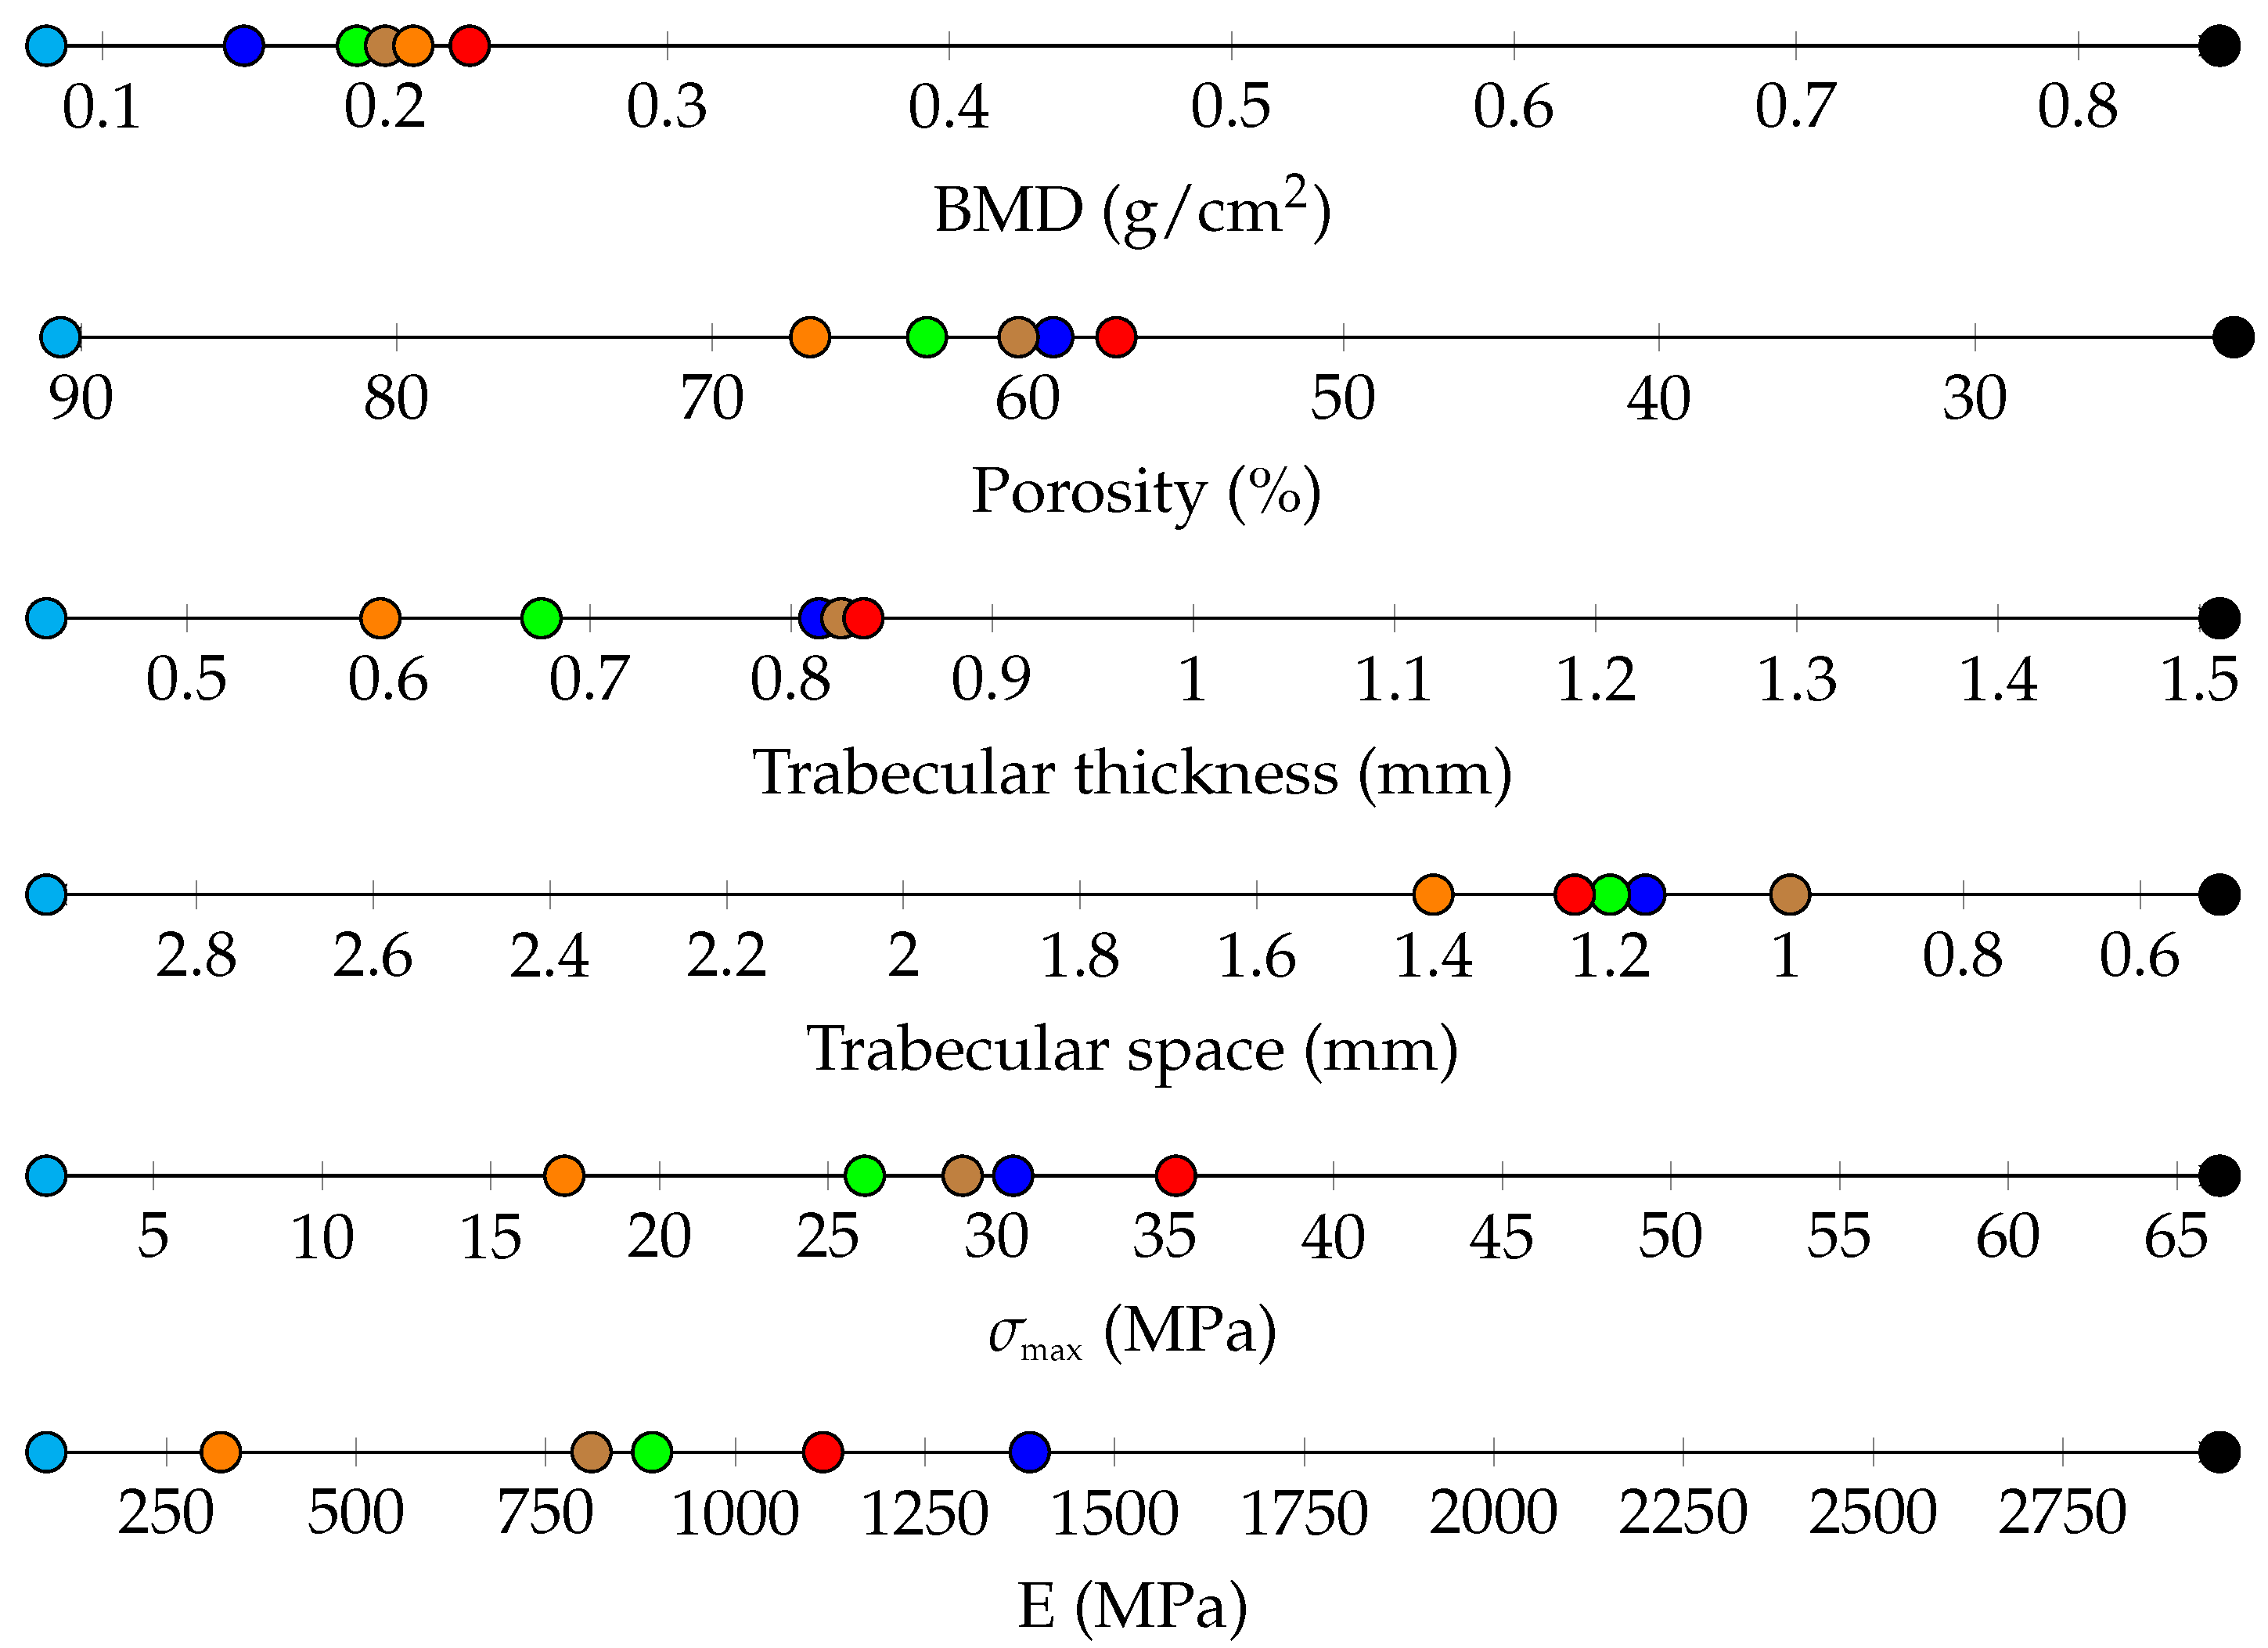
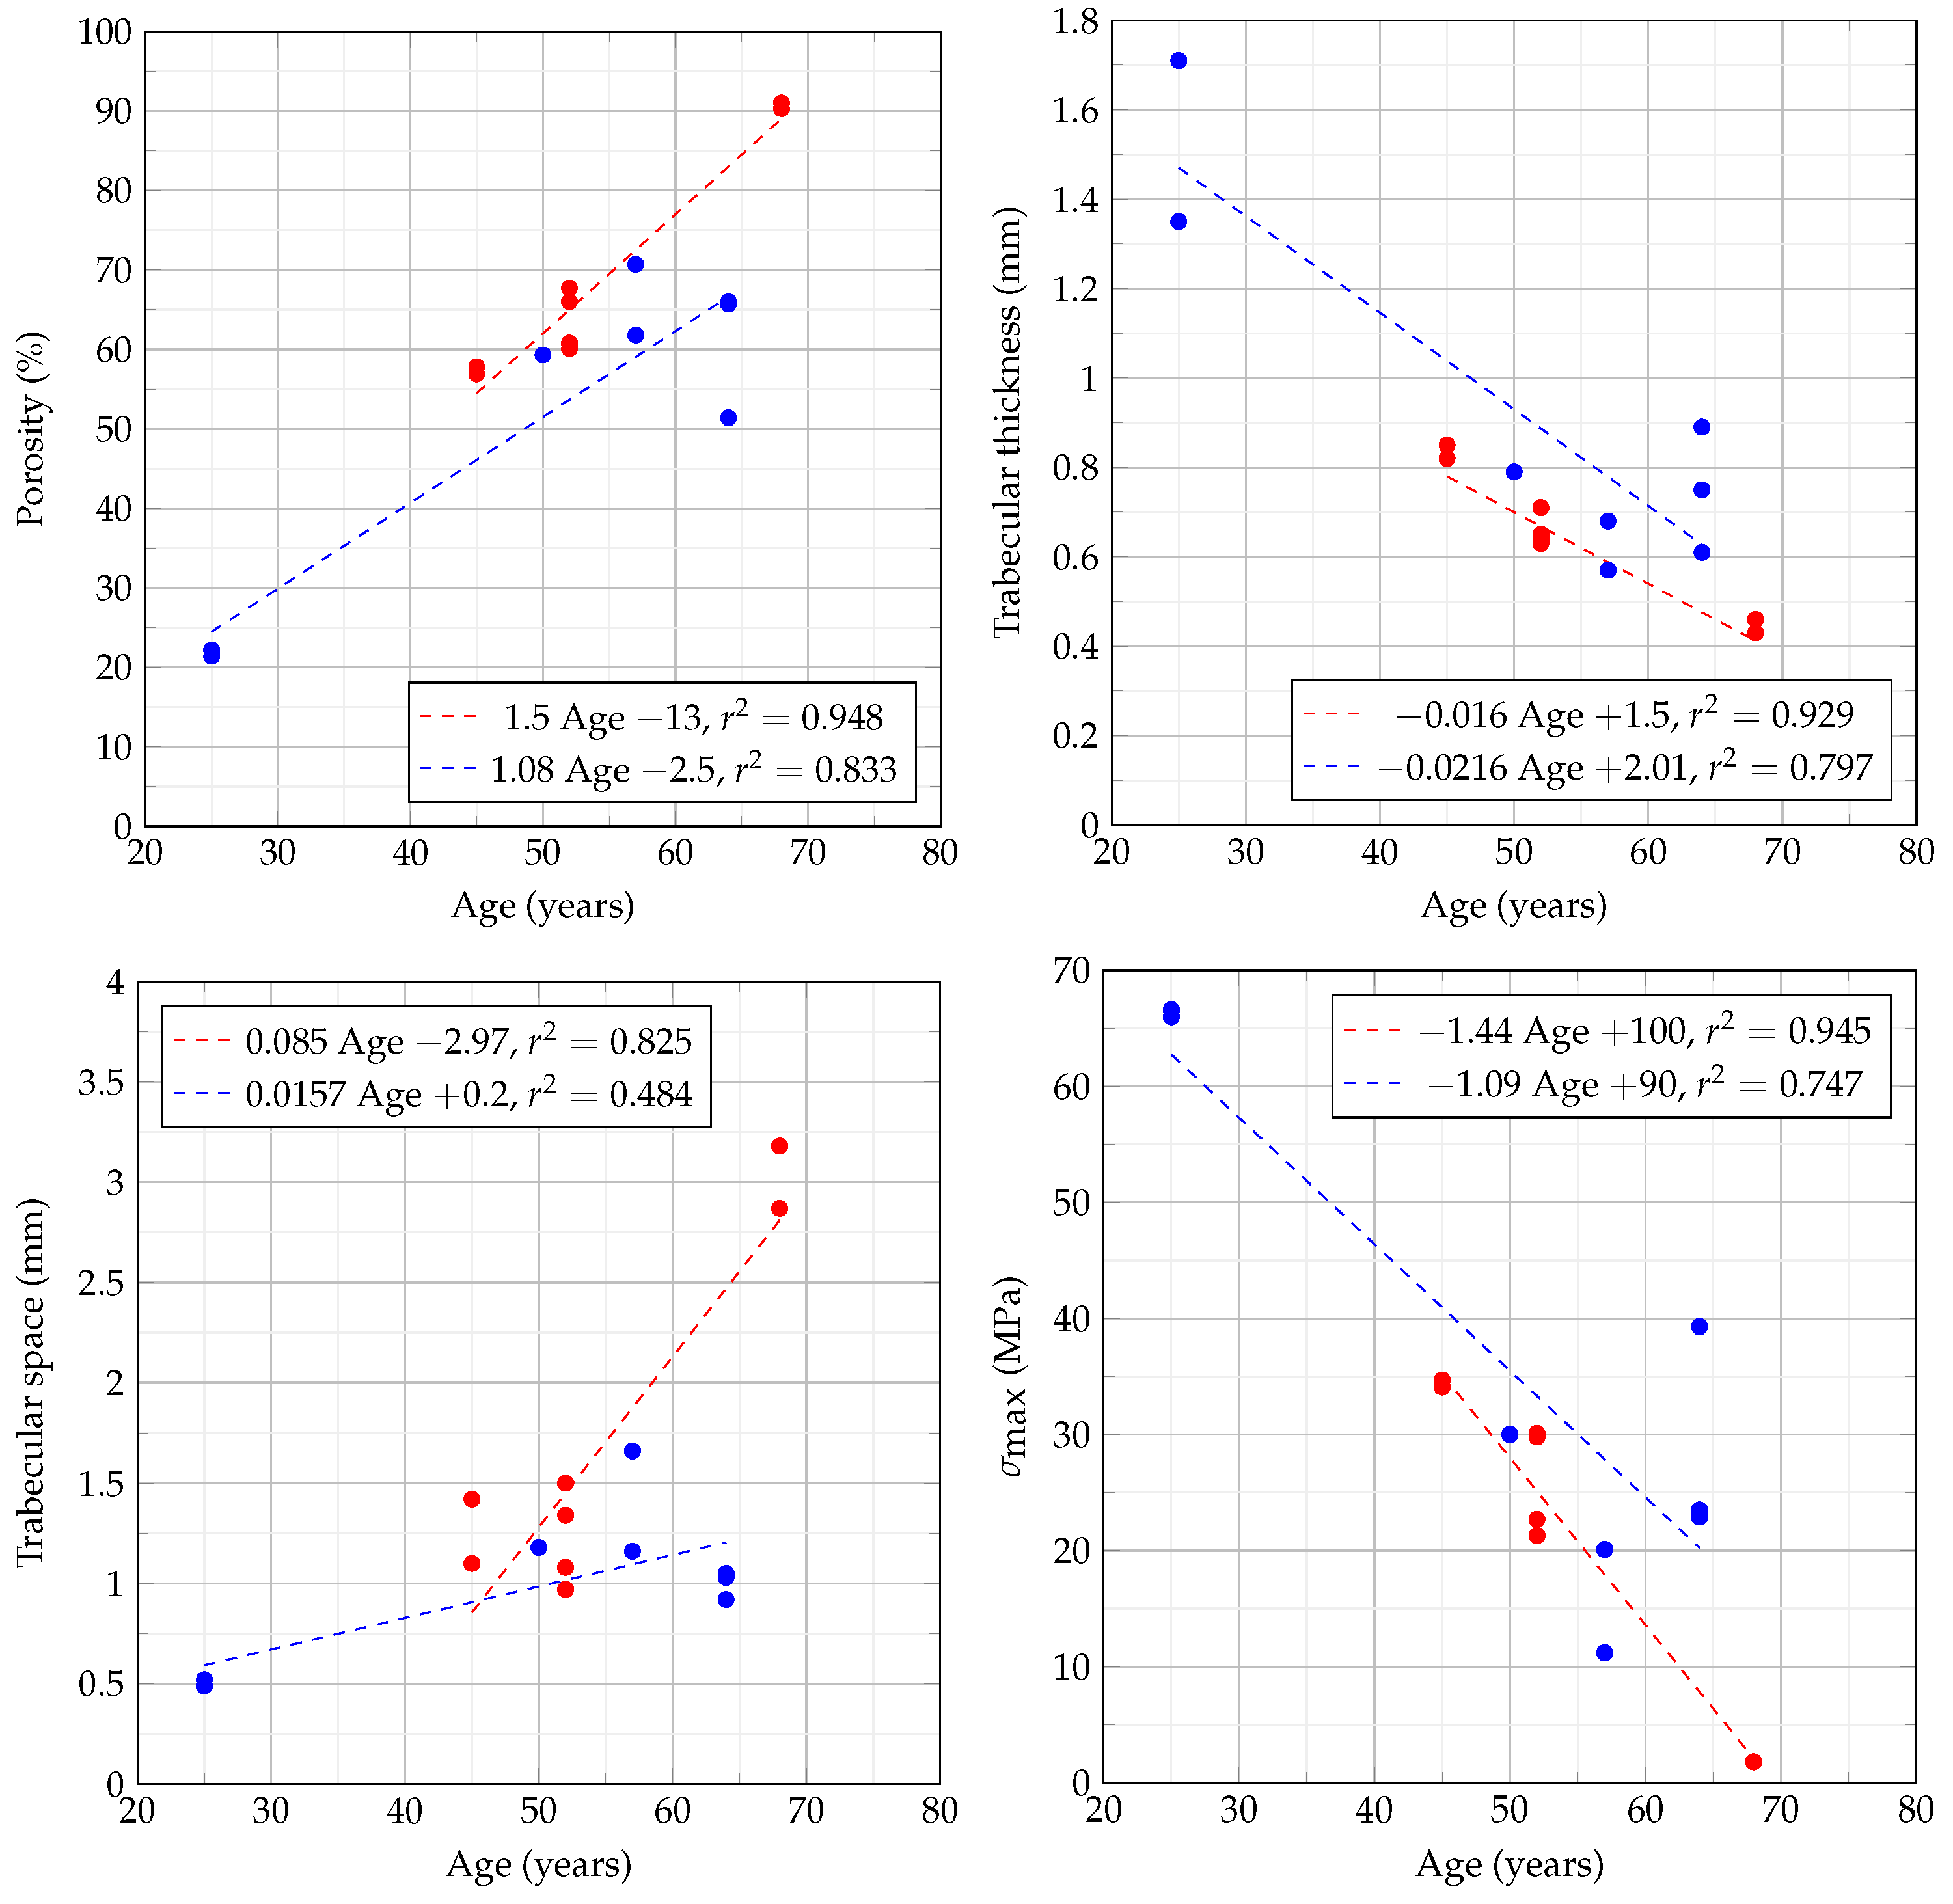
Figure 9 compares all our results on the cube samples: BMD, porosity, Tb.Th, Tb.Sp, σ max , σ y , and E. In Figure 10, we show the quality parameters compared against age and gender. Again, all scales are spanned by their corresponding lower and higher values to facilitate comparisons. Moreover, the values for these parameters fall within the range of published human values (see, e.g., [40,41,42]).
From our results, we can note that BMD for the 57-year-old male donor (Donor 4 shown in orange) got one of the highest values for our osteoporotic donors, but its porosity was also the second-highest, only placed after our oldest donor. On the other hand, the porosity of the 50-year-old male donor (Donor 2 displayed in navy-blue), whose BMD was one of the lowest, does not show a dramatically high porosity. These results seem counter-intuitive and suggest that BMD could not be considered as the sole criteria for defining the bone strength. In that sense, studying bone quality in more extensive detail could prove complementary in bone assessment for clinical applications.
Even when our results put our control sample in the osteopenia group, we have to remember that clinical diagnosis criteria consider total bone, which contains not only trabecular bone, but also the denser and more compact cortical bone. Based on this, our BMD values were expected to be lower; hence, we consider our control donor to be healthy.
The stiffness is related to the bone mineralization or the BMD value. This relationship can be examined more deeply by comparing BMD and E. In that sense, E showed a higher dispersion over the minimum–maximum range. This behavior in E allows for better discrimination of our sample cubes based on mineralization. Such an enhanced capacity of discrimination could be an important asset in the development of future diagnosis techniques.
Our inter-individual variations show the need for performing a larger number of experiments to generate consistent statistics of the quality parameters before these can be used in other areas such as mathematical modeling or future clinical diagnosis. Nevertheless, the results obtained up to this point show promising potential, especially when compared to other studies such as [40], in which the trabecular thickness and space remained fairly constant despite the strength of the bone, hence leading to the conclusion that trabecular data were poor indicators of bone quality. Here, we show that Tb.Th and Tb.Sp are inversely correlated (as expected) while the first one is directly correlated to σ max and E. Therefore, we show that trabecular data may be used as indicators of bone quality, especially when signs of osteoporosis are present.

5. Conclusions

Our proposed 2D imaging estimation of quality parameters proved to be reliable, low-cost, and it provided further insight regarding the current assessment of osteoporosis. Our proposed methodology significantly reduced the dependence on expensive equipment. However, it did not add a significant error in the evaluation of porous materials. Hence, it allowed us to analyze relationships between bone quality parameters and their mechanical properties. Together, our results on bone densitometry, microarchitecture, and mechanical tests gave us a closer look into the vast relationships of all their parameters with osteoporosis. Finally, despite not being part of our original aim, our results also provide the true BMD of trabecular tissue, which is an important piece of information in the assessment of osteoporosis.
Future work will include further testing as new donations of bone are available, as well as a more detailed assessment of the bone mechanical properties, including microdamage distribution [43].

Author Contributions

Conceptualization, G.P. and D.G.; methodology, G.P. and D.G.; software, G.P. and W.R.L.-M.; validation, G.P., W.R.L.-M., J.F.V., P.G. and A.A.-M.; formal analysis, G.P., D.G., and W.R.L.-M.; investigation, G.P., D.G., and W.R.L.-M.; data curation, G.P., D.G., and W.R.L.-M.; writing—original draft preparation, G.P.; writing—review and editing, G.P. and D.G. All authors have read and agreed to the published version of the manuscript.

Funding

The work of W.R.L.M. was sponsored by the Mexican Council of Science and Technology (CONACyT) through the graduate school scholarship no. 394408.

Institutional Review Board Statement

The research protocol and the allocation of bone samples to our research was approved by the ethical committee of UANL hospital.

Informed Consent Statement

Donors provided consent for usage of their bones according to organ and tissue donation laws applicable in Mexico.

Data Availability Statement

The datasets generated for this study are available on request to the corresponding author.

Acknowledgments

We are grateful to the following institutions, for generously allowing the use of their facilities for the proper development of the research: Banco de Hueso y Tejidos, UANL; CIMAV Monterrey; Centro de Osteoporosis, Hospital Universitario, UANL; Academy of Sciences of the Czech Republic, Institute of Theoretical and Applied Mechanics, Centre Telč. Additionally, we are grateful to the following researchers: Ana Belinda Martínez-Leñero, intern of the Laboratory of Biomedical Signal Processing at Cinvestav Monterrey, for her assistance in the section corresponding to the approximation and validation of the 2D assessment of porosity; Alejandro Rentería-Cano, from the Bone and Tissue Bank of the Autonomous University of Nuevo León, for providing the human femoral necks; Ivana Kumpová, Michal Vopálenský, and Alberto Viani, from Academy of Sciences of the Czech Republic, Institute of Theoretical and Applied Mechanics, Centre Telč, Czech Republic, for generously providing us with images acquired with TORATOM, as well as for allowing the use of Pore3D software; Arnulfo Martínez-Dávalos, Instituto de Física, Universidad Nacional Autónoma de México, for kindly allowing the use of the FI-UNAM micro-CT system.

Conflicts of Interest

The authors declare no conflict of interest.

References

  1. Cowin, S.C. Bone Mechanics Handbook; CRC Press: Boca Raton, FL, USA, 2001. [Google Scholar]
  2. Acevedo, C.; Stadelmann, V.A.; Pioletti, D.P.; Alliston, T.; Ritchie, R.O. Fatigue as the missing link between bone fragility and fracture. Nat. Biomed. Eng. 2018, 2, 62–71. [Google Scholar] [CrossRef] [PubMed]
  3. Kanis, J.; Gluer, C.C. An update on the diagnosis and assessment of osteoporosis with densitometry. Osteoporos. Int. 2000, 11, 192–202. [Google Scholar] [CrossRef]
  4. Schmidt, F.N.; Zimmermann, E.A.; Walsh, F.; Plumeyer, C.; Schaible, E.; Fiedler, I.A.; Milovanovic, P.; Rößle, M.; Amling, M.; Blanchet, C.; et al. On the origins of fracture toughness in advanced teleosts: How the swordfish sword’s bone structure and composition allow for slashing under water to kill or stun prey. Adv. Sci. 2019, 6, 1900287. [Google Scholar] [CrossRef] [PubMed] [Green Version]
  5. Van Der Linden, J.C.; Verhaar, J.; Weinans, H. A three-dimensional simulation of age-related remodeling in trabecular bone. J. Bone Min. Res. 2001, 16, 688–696. [Google Scholar] [CrossRef] [PubMed] [Green Version]
  6. Legrand, E.; Chappard, D.; Pascaretti, C.; Duquenne, M.; Krebs, S.; Rohmer, V.; Basle, M.F.; Audran, M. Trabecular bone microarchitecture, bone mineral density, and vertebral fractures in male osteoporosis. J. Bone Min. Res. 2000, 15, 13–19. [Google Scholar] [CrossRef]
  7. Montemurro, N.; Perrini, P.; Mangini, V.; Galli, M.; Papini, A. The Y-shaped trabecular bone structure in the odontoid process of the axis: A CT scan study in 54 healthy subjects and biomechanical considerations. J. Neurosurg. Spine 2019, 30, 585–592. [Google Scholar] [CrossRef]
  8. Genant, H.K.; Cooper, C.; Poor, G.; Reid, I.; Ehrlich, G.; Kanis, J.; Nordin, B.C.; Barrett-Connor, E.; Black, D.; Bonjour, J.; et al. Interim report and recommendations of the World Health Organization task-force for osteoporosis. Osteoporos. Int. 1999, 10, 259. [Google Scholar] [CrossRef]
  9. Blake, G.M.; Fogelman, I. The role of DXA bone density scans in the diagnosis and treatment of osteoporosis. Postgrad. Med. J. 2007, 83, 509–517. [Google Scholar] [CrossRef] [Green Version]
  10. Kanis, J.A. Diagnosis of osteoporosis and assessment of fracture risk. Lancet 2002, 359, 1929–1936. [Google Scholar] [CrossRef]
  11. Schott, A.; Cormier, C.; Hans, D.; Favier, F.; Hausherr, E.; Dargent-Molina, P.; Delmas, P.; Ribot, C.; Sebert, J.; Breart, G.; et al. How hip and whole-body bone mineral density predict hip fracture in elderly women: The EPIDOS Prospective Study. Osteoporos. Int. 1998, 8, 247–254. [Google Scholar] [CrossRef]
  12. Leali, P.T.; Muresu, F.; Melis, A.; Ruggiu, A.; Zachos, A.; Doria, C. Skeletal fragility definition. Clin. Cases Min. Bone Metab. 2011, 8, 11. [Google Scholar]
  13. Sornay-Rendu, E.; Munoz, F.; Garnero, P.; Duboeuf, F.; Delmas, P.D. Identification of osteopenic women at high risk of fracture: The OFELY study. J. Bone Min. Res. 2005, 20, 1813–1819. [Google Scholar] [CrossRef]
  14. Liu, Z.; Piao, J.; Pang, L.; Qing, X.; Nan, S.; Guo, Y.; Wang, X.; Li, F.; Liu, J.; Cheng, X.; et al. The diagnostic criteria for primary osteoporosis and the incidence of osteoporosis in China. J. Bone Min. Metab. 2002, 20, 181–189. [Google Scholar] [CrossRef] [PubMed]
  15. Kanis, J.; Johnell, O.; Oden, A.; De Laet, C.; Mellstrom, D. Diagnosis of osteoporosis and fracture threshold in men. Calcif. Tissue Int. 2001, 69, 218–221. [Google Scholar] [CrossRef]
  16. Kazakia, G.J.; Burghardt, A.J.; Link, T.M.; Majumdar, S. Variations in morphological and biomechanical indices at the distal radius in subjects with identical BMD. J. Biomech. 2011, 44, 257–266. [Google Scholar] [CrossRef] [PubMed] [Green Version]
  17. Bouxsein, M.L. Mechanisms of osteoporosis therapy: A bone strength perspective. Clin. Cornerstone 2003, 5, S13–S21. [Google Scholar] [CrossRef]
  18. Ammann, P.; Rizzoli, R. Bone strength and its determinants. Osteoporos. Int. 2003, 14, 13–18. [Google Scholar] [CrossRef] [PubMed]
  19. Zhu, F.; Qiu, Y.; Yeung, H.Y.; Lee, K.M.; Cheng, C.y.J. Trabecular bone micro-architecture and bone mineral density in adolescent idiopathic and congenital scoliosis. Orthop. Surg. 2009, 1, 78–83. [Google Scholar] [CrossRef] [PubMed]
  20. Ginini, J.G.; Maor, G.; Emodi, O.; Shilo, D.; Gabet, Y.; Aizenbud, D.; Rachmiel, A. Effects of extracorporeal shock wave therapy on distraction osteogenesis in rat mandible. Plast. Reconstr. Surg. 2018, 142, 1501–1509. [Google Scholar] [CrossRef]
  21. Ostertag, A.; Papadakis, G.E.; Collet, C.; Trabado, S.; Maione, L.; Pitteloud, N.; Bouligand, J.; De Vernejoul, M.C.; Cohen-Solal, M.; Young, J. Compromised Volumetric Bone Density and Microarchitecture in men with Congenital Hypogonadotropic Hypogonadism. J. Clin. Endocrinol. Metab. 2021. [Google Scholar] [CrossRef]
  22. Brennan, T.A.; Egan, K.P.; Lindborg, C.M.; Chen, Q.; Sweetwyne, M.T.; Hankenson, K.D.; Xie, S.X.; Johnson, F.B.; Pignolo, R.J. Mouse models of telomere dysfunction phenocopy skeletal changes found in human age-related osteoporosis. Dis. Model. Mech. 2014, 7, 583–592. [Google Scholar] [CrossRef] [Green Version]
  23. Thomas, C.D.L.; Feik, S.A.; Clement, J.G. Increase in pore area, and not pore density, is the main determinant in the development of porosity in human cortical bone. J. Anat. 2006, 209, 219–230. [Google Scholar] [CrossRef]
  24. Ahmed, L.A.; Shigdel, R.; Joakimsen, R.M.; Eldevik, O.P.; Eriksen, E.F.; Ghasem-Zadeh, A.; Bala, Y.; Zebaze, R.; Seeman, E.; Bjørnerem, Å. Measurement of cortical porosity of the proximal femur improves identification of women with nonvertebral fragility fractures. Osteoporos. Int. 2015, 26, 2137–2146. [Google Scholar] [CrossRef] [Green Version]
  25. Krause, M.; Hubert, J.; Deymann, S.; Hapfelmeier, A.; Wulff, B.; Petersik, A.; Püschel, K.; Amling, M.; Hawellek, T.; Frosch, K.H. Bone microarchitecture of the tibial plateau in skeletal health and osteoporosis. Knee 2018, 25, 559–567. [Google Scholar] [CrossRef]
  26. Bala, Y.; Zebaze, R.; Seeman, E. Role of cortical bone in bone fragility. Curr. Opin. Rheumatol. 2015, 27, 406–413. [Google Scholar] [CrossRef]
  27. Siris, E.S.; Miller, P.D.; Barrett-Connor, E.; Faulkner, K.G.; Wehren, L.E.; Abbott, T.A.; Berger, M.L.; Santora, A.C.; Sherwood, L.M. Identification and fracture outcomes of undiagnosed low bone mineral density in postmenopausal women: Results from the National Osteoporosis Risk Assessment. JAMA 2001, 286, 2815–2822. [Google Scholar] [CrossRef] [PubMed] [Green Version]
  28. Martínez-Dávalos, A. An Overview of the Development and Evaluation of a Benchtop microCT Scanner. AIP Conf. Proc. 2010, 1310, 7–11. [Google Scholar]
  29. Doktor, T.; Kumpová, I.; Wroński, S.; Śniechowski, M.; Tarasiuk, J.; Forte, G.; Kytýř, D. Influence of printing and loading direction on mechanical response in 3d printed models of human trabecular bone. Acta Polytech. CTU Proc. 2018, 18, 24–27. [Google Scholar] [CrossRef]
  30. Schindelin, J.; Arganda-Carreras, I.; Frise, E.; Kaynig, V.; Longair, M.; Pietzsch, T.; Preibisch, S.; Rueden, C.; Saalfeld, S.; Schmid, B.; et al. Fiji: An open-source platform for biological-image analysis. Nat. Methods 2012, 9, 676–682. [Google Scholar] [CrossRef] [PubMed] [Green Version]
  31. Rueden, C.T.; Schindelin, J.; Hiner, M.C.; DeZonia, B.E.; Walter, A.E.; Arena, E.T.; Eliceiri, K.W. ImageJ2: ImageJ for the next generation of scientific image data. BMC Bioinform. 2017, 18, 529. [Google Scholar] [CrossRef] [PubMed]
  32. Brun, F.; Mancini, L.; Kasae, P.; Favretto, S.; Dreossi, D.; Tromba, G. Pore3D: A software library for quantitative analysis of porous media. Nucl. Instrum. Meth. A 2010, 615, 326–332. [Google Scholar] [CrossRef]
  33. Hildebrand, T.; Ruegsegger, P. A new method for the model-independent assessment of thickness in three-dimensional images. J. Microsc. 1997, 185, 67–75. [Google Scholar] [CrossRef]
  34. Frost, H.M. Wolff’s Law and bone’s structural adaptations to mechanical usage: An overview for clinicians. Angle Orthod. 1994, 64, 175–188. [Google Scholar] [PubMed]
  35. Martin, R.B. Porosity and specific surface of bone. Crit. Rev. Biomed. Eng. 1984, 10, 179–222. [Google Scholar] [PubMed]
  36. Berli, M.; Borau, C.; Decco, O.; Adams, G.; Cook, R.B.; Garcia Aznar, J.M.; Zioupos, P. Localized tissue mineralization regulated by bone remodelling: A computational approach. PLoS ONE 2017, 12, e0173228. [Google Scholar] [CrossRef]
  37. Lerebours, C.; Thomas, C.; Clement, J.; Buenzli, P.; Pivonka, P. The relationship between porosity and specific surface in human cortical bone is subject specific. Bone 2015, 72, 109–117. [Google Scholar] [CrossRef]
  38. Pivonka, P.; Buenzli, P.R.; Scheiner, S.; Hellmich, C.; Dunstan, C.R. The influence of bone surface availability in bone remodelling—A mathematical model including coupled geometrical and biomechanical regulations of bone cells. Eng. Struct. 2013, 47, 134–147. [Google Scholar] [CrossRef] [Green Version]
  39. Rouhi, G.; Epstein, M.; Sudak, L.; Herzog, W. Free surface density and microdamage in the bone remodeling equation: Theoretical considerations. Int. J. Eng. Sci. 2006, 44, 456–469. [Google Scholar] [CrossRef]
  40. Ciarallo, A.; Barralet, J.; Tanzer, M.; Kremer, R. An approach to compare the quality of cancellous bone from the femoral necks of healthy and osteoporotic patients through compression testing and microcomputed tomography imaging. McGill J. Med. MJM 2006, 9, 102. [Google Scholar]
  41. Le Corroller, T.; Pithioux, M.; Chaari, F.; Rosa, B.; Parratte, S.; Maurel, B.; Argenson, J.N.; Champsaur, P.; Chabrand, P. Bone texture analysis is correlated with three-dimensional microarchitecture and mechanical properties of trabecular bone in osteoporotic femurs. J. Bone Miner. Metab. 2013, 31, 82–88. [Google Scholar] [CrossRef]
  42. Souzanchi, M.F.; Palacio-Mancheno, P.; Borisov, Y.A.; Cardoso, L.; Cowin, S.C. Microarchitecture and bone quality in the human calcaneus: Local variations of fabric anisotropy. J. Bone Miner. Res. 2012, 27, 2562–2572. [Google Scholar] [CrossRef] [PubMed] [Green Version]
  43. Presbítero, G.; Hernandez-Rodríguez, M.A.; Contreras-Hernandez, G.R.; Vilchez, J.F.; Susarrey, O.; Gutiérrez, D. Microdamage distribution in fatigue fractures of bone allografts following gamma-ray exposure. Acta Bioeng. Biomech. 2017, 19, 43–53. [Google Scholar]
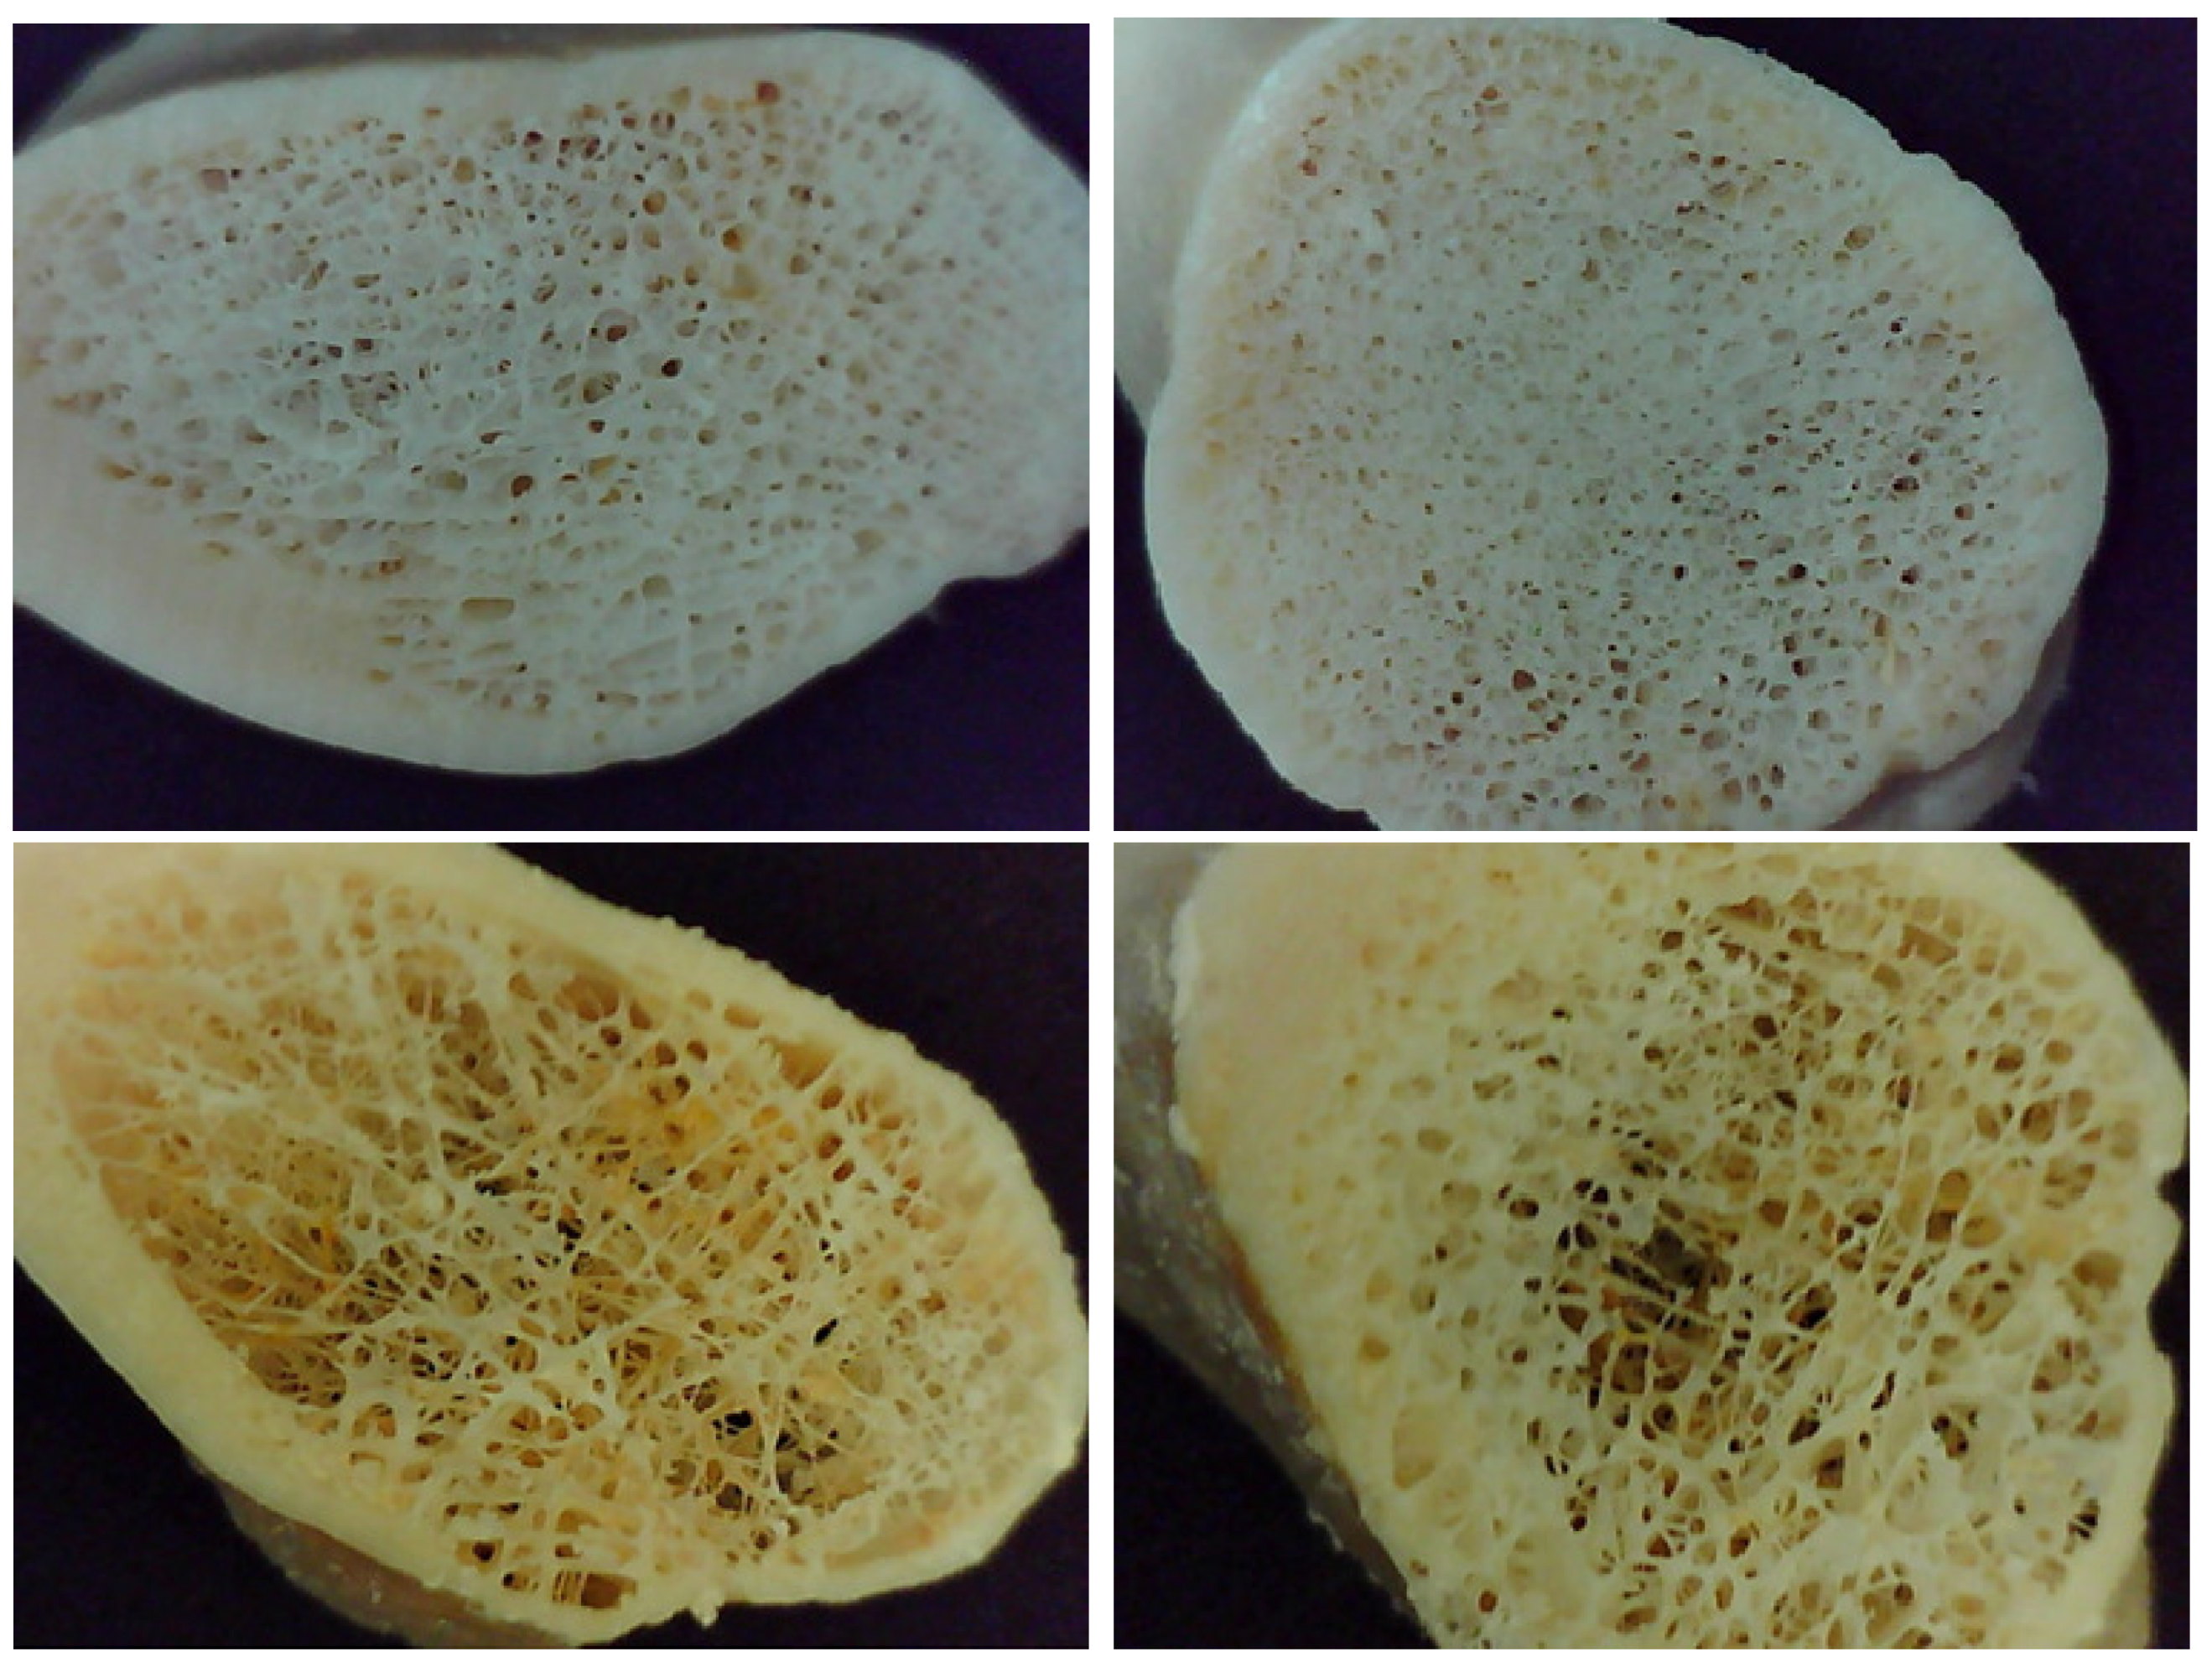
Figure 1. Proximal (left) and distal (right) cross-sections of femur neck. Top row correspond to 25 years-old male donor, while bottom are from 68 years-old female.
Applsci 11 05479 g001
Figure 2. Representation of the machining process (left) and examples of the bone cubes (right). Note that only those bone cubes with 10 mm per side were used in this study, but smaller cubes were set aside for future studies.
Applsci 11 05479 g002
Figure 3. Micro-CT images of bone samples: (left) longitudinal slices of one of our bone cubes (male donor of 57 years-old), and (right) trabecular bone sample from Doktor et al. [29].
Applsci 11 05479 g003
Figure 4. 2D imaging approximation for porosity assessment: (left) binary image of a face of one bone cube sample, (center) Tb.Th color map which contains circles that were found in the area that represents bone, and (right) Tb.Sp color map showing circles that represent pores.
Applsci 11 05479 g004
Figure 5. Porosity of each sample.
Applsci 11 05479 g005
Figure 6. BMD and T-score values for each neck femur sample cube.
Applsci 11 05479 g006
Figure 7. Summary of results for Tb.Th (top) and Tb.Sp (bottom).
Applsci 11 05479 g007
Figure 8. Comparison of the distribution of BMD values (g·cm2): (top) clinical BMD for different patients whose gender (F or M, for female or male, respectively) and age is indicated above the corresponding value; (bottom) average trabecular BMD of our samples.
Applsci 11 05479 g008
Figure 9. Comparison of all the measurements made on our cube samples. Color coding is the same as in Figure 8. Note that scales in porosity and Tb.Sp go in opposite direction with respect to others (decreasing from left to right) for comparison purposes.
Applsci 11 05479 g009
Figure 10. Comparison of quality parameters against age and gender. All graphs show raw data from female donors in red dots and those from male donors in blue. Dashed lines correspond to the linear regression of the corresponding data. Significant differences among genders were found in the case of trabecular space (t-test, p = 0.0017 ).
Applsci 11 05479 g010aApplsci 11 05479 g010b
Table 1. Specifications of sample cubes, as well as porosity values obtained through micro-CT (n/a indicates those samples that were not assessed with this technique).
DonorGenderAge (Years)Sample Cube(s)Porosity (%)
ControlMale25# 1
# 2
n/a
n/a
1Female45# 1
# 2
n/a
n/a
2Male50# 1n/a
3Female52# 1 (left)
# 2 (left)
# 1 (right)
# 2 (right)
71.6
n/a
n/a
n/a
4Male57# 1 (left)
# 1 (right)
64.4
75.8
5Male64# 1 (left)
# 2 (left)
#1 (right)
70.1
n/a
n/a
6Female68# 1
# 2
n/a
n/a
Table 2. Results of mechanical tests for each sample cube.
Sample σ max (MPa) σ y (MPa)E (MPa)
M2566.657.92994.9
6648.12918.5
F4534.724.21764.3
34.126.5557.1
M503021.61391.4
F5229.823.31052.2
22.721.4282.7
21.316.5865.1
30.227.11444
M5711.29.6174.4
20.115.6541
M6423.520.1460.7
22.919.5762.7
39.327.41429.6
F681.81.4127.6
1.81.456
Publisher’s Note: MDPI stays neutral with regard to jurisdictional claims in published maps and institutional affiliations.