Article

Ohmic Baking of Gluten-Free Bread: Role of Starch and Flour on Batter Properties

1
Department of Food Science and Technology, BOKU—University of Natural Resources and Life Sciences Vienna, Muthgasse 18, 1190 Vienna, Austria
2
Department of Agricultural Product Technology, Brawijaya University, Malang 65141, Indonesia
*
Author to whom correspondence should be addressed.
Appl. Sci. 2021, 11(14), 6567; https://doi.org/10.3390/app11146567
Submission received: 2 July 2021 / Revised: 14 July 2021 / Accepted: 15 July 2021 / Published: 16 July 2021

Abstract

:
The viscosity of gluten-free (GF) batter significantly influences GF bread quality. This study attempts to understand how the rheological properties of GF batter are affected by the type of starch and the amount of water and how they influence GF bread properties when baked with two methods (conventional oven, ohmic heating). For this purpose, the physical and chemical properties of different starches (corn, wheat, potato, cassava) and GF flours (rice, buckwheat) were evaluated. Rheological behavior of GF batter was not only influenced by the starch:water ratio, but also greatly by the starch source and structure, which influenced its physical properties (e.g., water holding capacity, swelling power, solubility, starch damage, and pasting properties). All batters consistently exhibited shear-thinning and dominant viscous behavior. Between viscosity and ohmic-heated bread properties, a non-linear relationship was observed. Two categories of required water content or viscosity ranges were defined for estimating final GF bread properties: low water content with a viscosity range of 47.12–56.20 Pa·s for B-type starches, and medium water content with a low to medium viscosity range of 2.29–15.86 Pa·s for A-type starches. This finding could be useful for further research to design GF batter viscosities for tailored bread quality.

1. Introduction

GF bread formulations have been continuously developed to overcome most of the problems that arise due to the absence of gluten, such as low bread volume, friable crumb, and poor mouthfeel. The most recent approach to improve GF bread quality is applying a non-conventional baking technology: ohmic heating. Ohmic heating is a volumetric heating method that passes an electrical current through food, resulting in fast and uniform heating [1]. Recently, this technology has been successfully applied for baking GF bread, improving bread volume and pore properties [2]. However, fundamental knowledge of how each ingredient contributes to increasing GF bread quality using ohmic heating is still missing.
It is known that the structure and, therefore, quality of GF bread is mainly controlled by starch, which has a significant effect on the batter viscosity and stability [3,4]. Since starch is the main component in a GF formulation, the GF batter commonly requires more water compared to wheat bread. Schoenlechner et al. [5] highlighted that water content in GF bread controlled the starch gelatinization, which significantly affected gas retention. Prior studies investigated the influence of water on GF bread quality in various ranges [5,6,7]. Results indicated that water content dramatically influenced the rheological behavior of GF batter. However, an inadequate consensus on determining suitable rheological properties to obtain an optimal GF bread quality has been observed, as research so far has found contradicting and unclear effects.
Viscosity is one of the rheological properties that significantly influences GF bread quality. In particular, it is positively correlated to bread volume [8,9], which is usually attributed to a higher gas holding capacity and foam stability of the batter. However, an exceeding viscosity will limit the gas expansion ability of the batter during proofing. Similarly, low viscosity cannot retain the gas cells in the batter due to easy dissipation, resulting in low bread volume [10,11]. Previous studies have not been able to indicate an adequate range of batter viscosities that are required to obtain high-quality GF bread.
If bread was to be baked using ohmic heating, detailed knowledge about the rheological behavior of GF batter is crucial. Ohmic heating relies on the ability of ions to move within the food matrix, which in turn is affected by the viscosity of the batter. This has been seen in previous studies before, as high viscosities have led to lower heating rates [12,13]. Since the rheological behavior of GF batter is majorly influenced by the starch properties and water content [6,7,8], this study aimed to investigate the role of GF starch (and flour) from different sources (tuber and cereal), as well as the rheological behavior of GF batter and the final bread quality after baking with ohmic heating. The attempt was to thoroughly understand the interaction between the rheological properties and ohmic baking and to define a suitable viscosity range for this processing approach.

2. Materials and Methods

2.1. Materials

The cereal starches used in this study were corn starch (Maisita 21.001, Agrana Beteiligungs-AG, Vienna, Austria) and wheat starch (Sanostar-Hermann Kroner GmbH, Ibbenbüren, Germany). The tuber starches were potato starch (Starkina 20.000, Agrana Beteiligungs-AG, Vienna, Austria) and cassava starch (cock brand, Thai world import and export Co., Ltd., Bangkok, Thailand). Regarding the GF flours from cereal source, rice flour (Bio Reis, Caj. Strobl Naturmühle Gesmbh, Linz-Ebelsberg, Austria) and buckwheat flour (Caj. Strobl Naturmühle GmbH, Linz-Ebelsberg, Austria) were used. The chemical composition of the starches and flours provided by the manufacturers are presented in Table S1 (Supplementary Material).
For baking trials, hydroxypropyl methylcellulose (HPMC; Metolose®, Shin Etsu Chemical Col, Ltd., Tokyo, Japan) was donated from HARKE Services GmbH (Muelheim an der Ruhr, Germany). Egg albumen and vegetable fat powder (REVEL®) were purchased from Enthoven-Bouwhuis Eiprodukten B.V. (Raalte, The Netherlands) and Loders Croklaan B.V. (Wormerveer, The Netherlands), respectively. The emulsifier used was a mixture of three parts diacetyl tartaric acid ester of monoglyceride (Panodan-DATEM A2020, DuPont Nutrition and Health, Grindsted, Denmark) and five parts distilled monoglyceride (Dimodan PH 100, NS/B, DuPont Nutrition and Health, Grindsted, Denmark). Instant dry yeast (Lesaffre yeast, Marq-en-Bareoul, France), iodized salt (Salinen Austria AG, Ebensee, Austria), and sugar (Agrana Beteiligungs-AG, Vienna, Austria) were purchased from local suppliers.

2.2. Raw Material Characterization

Starches and flours were characterized in regard to their chemical and physical properties. Starch damage and amylose content were characterized using the Megazyme starch damage (K-SDAM) and Amylose-Amylopectin Assay Kit (K-AMYL) (Megazyme Ltd., Co., Wicklow, Ireland), respectively. Particle size was measured with a laser diffraction particle size analyzer (Mastersizer 3000, Malvern Instruments Ltd., Worcestershire, UK). The mean diameter of equivalent volume d (4.3), which indicates the central point of the volume distribution, was recorded. Water holding capacity (WHC), defined as the amount of water retained by the starch at ambient temperature (25 ± 2 °C) after being subjected to centrifugation, was measured as described in AACC method 56-30.01. The swelling power was determined by heating starch or flour until 85 °C, centrifugating and evaporating the supernatant. At the same time, the solubility index was determined as the ratio of weight of dried supernatant and weight of the initial sample [14]. The pasting profile of starch or flour was carried out using a rapid visco analyzer (RVA 4500, PerkinElmer, Hägersten, Sweden) according to ICC standard method No. 162. All characterizations were replicated at least three times and the results were shown as mean values.

2.3. GF Batter Preparation

Batters were prepared using a starch (or flour) to water ratio of 1:0.9, 1:1.3, and 1:1.7, except for buckwheat. In this case, higher water ratios of 1:1, 1:1.5, and 1:2 were used as the batter significantly absorbed more water, probably due to its higher protein content. The starch to water ratios were established based on preliminary research. For batter preparation, starch (or flour) was mixed with HPMC 3% (based on starch or flour weight, fw), yeast 3% (fw), egg albumen 2% (fw), fat 2% (fw), salt 1.8% (fw), sugar 1.5% (fw), emulsifier 0.5% (fw) and water. All ingredients were homogenized with a laboratory dough mixer (Teddy Varimixer, Varimixer A/S, Brøndby, Denmark) using a stainless-steel beater at low speed (speed 1 of 5) for 2 min. After the first mixing, the batter was scraped down to the bowl bottom using a spatula. A second mixing continued at high speed (speed 4 of 5) for 4 min.
The batter was divided into three portions. Two batter portions of 300 g were placed in an ohmic chamber, and one batter portion of 300 g was placed in a conventional baking tin. The dimensions of the baking tin were (L × W × H) 15 × 11 × 7 cm (bottom dimension of tin) and 13 × 9 × 7 cm (top dimension of tin), while the ohmic chamber dimensions were 15.4 × 9 × 10.7 cm. Afterward, the batter was proofed in a fermentation chamber (Model 60/rW, MANZ Backtechnik GmbH, Creglingen, Germany) at 30 °C and 85% RH (relative humidity) for 10 min. After proofing, the batter in each ohmic chamber/baking tin was gently mixed with a spatula to distribute the gas cells within the batter evenly (in wheat dough this step would correspond to rounding), followed by a second fermentation at 30 °C and 85% RH for 40 min.
For rheological analysis, the batter was prepared without yeast. The batter was immediately loaded after mixing into a 50 mL closed plastic container to avoid evaporation and rested for 20 min before analysis.

2.4. Breadmaking

Conventional bread was baked as a control in a deck oven (Model 60/rW, MANZ Backtechnik GmbH, Creglingen, Germany) at 180 °C (top and bottom heat) for 40 min.
For breads baked by ohmic baking, parameters were adapted from a previous study [2] with slight modifications. A pilot-scale ohmic heating unit (German Institute of Food Technologies, Quakenbrück, Germany) was used with a frequency of 12 kHz and a maximum voltage of 1000 V. The ohmic chamber resembled the conventional baking tin with stainless steel electrodes that were 3 mm thick and 15.4 cm apart. The electrical conductivity of the batter was analyzed using a portable conductivity meter (FiveGo™ F3 Series, Mettler Toledo, Switzerland) before baking. The bread was baked using a three-step heating profile (5 kW for 15 s, 1 kW for 10 s, and 0.3 kW for 80 s).
After baking, breads were cooled and stored in a climate chamber (Climacell® EVO, MMM Gmbh, München, Germany) at 20 °C and 50% RH for 18 h before analysis. Baking was conducted in triplicate, resulting in three conventional breads and six ohmic-heated breads for each formulation.

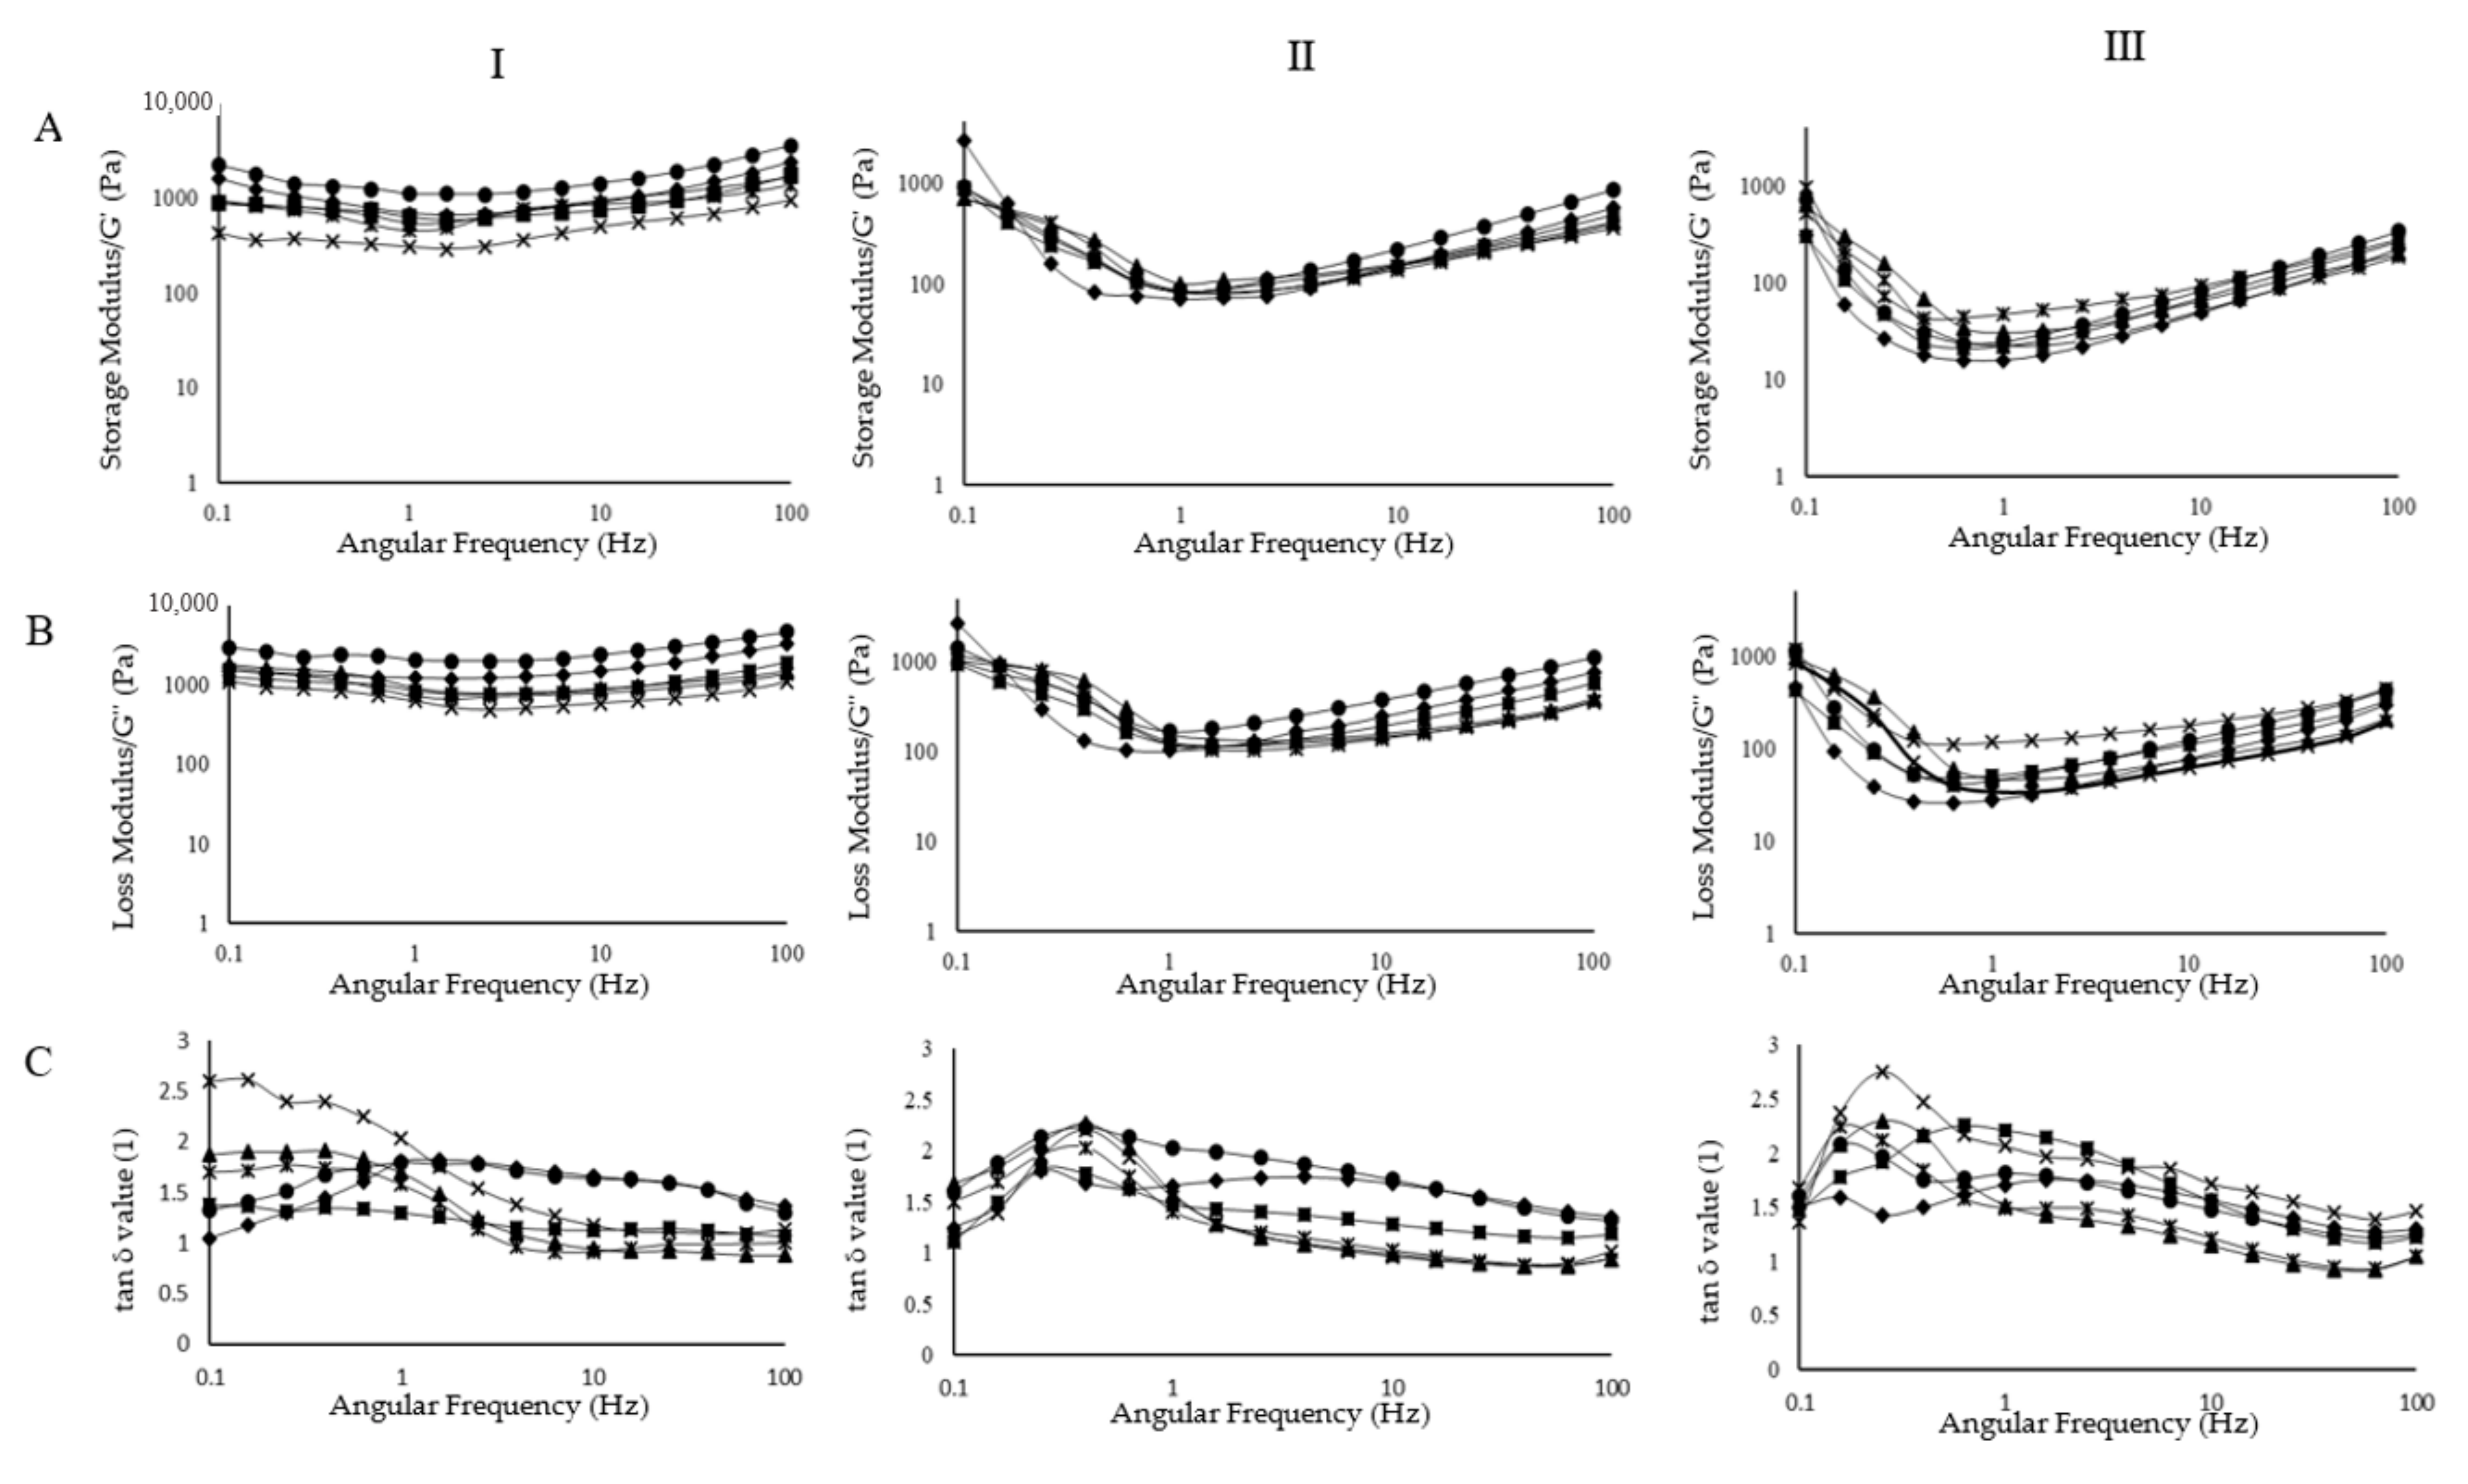
2.5. Rheological Measurements of Batters

Rheological characterization of the batters was performed using a rheometer (Model MCR 302, Anton Paar GmbH, Graz, Austria). The measurements were conducted at 25 °C, using a smooth parallel plate geometry and an upper plate of 25 mm diameter (PP25). The batter was loaded onto the plate, adjusting the gap to 1 mm and rested for 1 min to remove the residual loading stress.
To evaluate the viscoelastic behavior of the batter, a small amplitude oscillatory shear was used. First, a strain sweep was carried out to determine the linear viscoelastic region (LVER) of the batter at a shear rate of 0.01–100% and 1 Hz. All the batter samples showed an LVER at 0.1%, which was further selected for the frequency sweep. This analysis was performed at 100–0.1 Hz, where storage (G′) and loss (G″) moduli were recorded.
Moreover, rotational tests were used to estimate the flow behavior of the batters. Flow curves were obtained under steady shear rate conditions at a shear stress rate of 0.1–100 s−1. Data was fitted to the power-law model displayed in Equation (1):
σ = K γ n
where σ represents the shear stress (Pa), γ the shear rate (s−1), K the consistency coefficient (Pa·sn), and n the flow behavior index (dimensionless). All rheological measurements were conducted at least in triplicate.

2.6. Functional Properties of Bread

2.6.1. Baking Loss

Baking loss was calculated as the ratio of mass batter and mass bread as displayed in the following equation (Equation (2)):
Baking   loss   ( % )   =   W b b W a b W b b × 100
where Wbb is the mass of the batter and Wab is the mass of the bread after baking and cooling [15].

2.6.2. Bread Volume

The volume of the bread was determined by the volume analyzer BVM 6600 (PerkinElmer Instruments AB, Hägersten, Sweden). The specific bread volume was calculated as the ratio of volume (cm3) and mass of the bread (g). Triplicate measurements were performed for each formula resulting in three values for the conventionally baked bread and six values for the ohmic-heated bread for each formulation.

2.6.3. Bread Crumb Texture

Crumb firmness and elasticity were determined by following the AACC Method 74-09.01 with some modifications. The analysis was performed with a compression test using a Texture Analyzer (Model TA-XT+, Stable Micro systems™ Co., Godalming, UK) equipped with a 5 kg load cell and SMS 100 mm diameter compression probe (SMS P/100) was used. A crumb cube was used to analyze the crumb texture instead of a bread slice due to the low volume of the conventionally baked bread. With the compression cylinder used, it was not possible to only measure the crumb, without also compressing the crust. The three 3 × 3 × 3 cm cubes were cut from the center of each bread slice. Due to the low bread volume of potato starch and cassava starch bread, the cube’s dimensions were 2 × 2 × 2 cm. The bread cube was subjected to a uniaxial compression test of 20% strain. The applied strain was reduced after preliminary tests with 50%, 30% and 25% strain, to avoid ruptures of the bread cubes. Test speed was 0.5 mm/s, followed by a relaxation time of 120 s and 10 g trigger force. Pre and post-test speeds were 1 mm/s and 10 mm/s, respectively. The crumb firmness represented the maximum force in N required to deform each cube. The relative elasticity in percent was calculated by dividing the residual force at the end of the relaxation time by the maximum force multiplied by 100. At least triplicate measurements were carried out for each bread loaf resulting in 18 values of ohmic-baked bread and 9 values of conventional-baked bread for each formulation.

2.6.4. Crumb and Crust Color

Crumb and crust color were measured using a Digi-Eye® system (Verivide, Leicester, UK) integrated with a D-90 Nikon digital camera (Tokyo, Japan). Results were obtained in L* (0 = black, 100 = white), a* (+a* = red, −a* = green), and b* (+b* = yellow, −b* = blue) as defined in the CIE L*a*b* system.

2.6.5. Crumb Porosity

Crumb porosity was measured using a digital image analysis system using the software ImageJ (1.47v, National Institute of Health, Bethesda, MD, USA). The analysis was performed on a 2 × 2 cm crumb square taken by the digital camera D-90 Nikon (Tokyo, Japan) from the Digi-Eye® System (Verivide, Leicester, UK). The analyzed parameters were the number of pores (count), the average pore size and the percentage of total pore area to total bread area (% porosity).

2.7. Statistics

Statistical analyses were performed using Statgraphics Version XVIII (StatPoint Technologies, Inc., Warrenton, VA, USA). A one-way ANOVA was conducted, and the least significant difference at a 5% probability level (p-value < 0.05) was used to express statistically significant differences between formulations. Furthermore, a Pearson correlation analysis was performed on the data.

3. Results and Discussions

3.1. Starch and Flour Properties

The physical and chemical properties of starches and flours are shown in Table 1. Starch and flour properties significantly influence the pasting behavior of the raw material, which may have a strong correlation with bread quality.
Amylose is important for bread baking, as it influences gelatinization and retrogradation of starch [16], as well as WHC and swelling power, and thus affects final bread properties. Ee et al. [17] reported that low amylose content led to a lower water absorption, higher gas formation in the dough, reduced staling and improved bread crumb texture. The amylose content significantly varied within the studied samples. Cassava starch exhibited lowest amylose content (15.70%), resulting in lowest WHC (1.78 g/g) and highest swelling power (21.17%). Lower amylose content indicates a more crystalline structure of the starch granule, resulting in low water absorption [18]. Additionally, amylose has a suppressing effect on starch swelling power, therefore samples with lower amylose content exhibited higher swelling power. According to Blazek & Copeland [19], the swelling properties of starch granule is mainly the function of amylopectin. In this study, wheat starch showed the highest amylose, thus lowest amylopectin content and the lowest swelling power at 8.42% (see Table 1). Apart from amylopectin content, B-type starches (tuber starch) exhibited higher swelling power than A-type starches (cereal starch). B-type starches have a more open packing of the helical structures, while A-type starches have a firmly packed arrangement of the double helices. The more open B-type starch structure is more accessible by water than the closed package structure [18].
Swelling power and solubility index were positively correlated (r = 0.94, correlations among starch/flour properties and ohmic-heated bread characteristics are presented in Table 2). According to Ee et al. [17], the solubility of the starch granules reflects the amount of amylose leaching out from the granule into the water after heating. Analog to swelling power, B-type starches demonstrated a higher solubility index than A-type starches as well. In cereal starch, amylose is incorporated into a more compact starch granule, resulting in a reduced amylose mobility to the outer starch granule [17]. Similar results were obtained in this study; wheat starch possessed the highest amylose content (26.55%) and a perceptibly low solubility index at 4.34%.
With respect to pasting properties, swelling power demonstrated a positive correlation with peak viscosity and a negative correlation with final viscosity (r = −0.80) (see Table 2). B-type starches showed higher peak viscosity, and lower final viscosity than A-type starches (see Table 1). This is in agreement with other studies, which observed that a lower starch swelling power contributed to a decreased starch peak viscosity [20,21]. High peak viscosity was concomitant with a higher breakdown (r = 0.99). Potato starch had the highest peak viscosity and breakdown, reaching 1105.41 RVU and 953.83 RVU, respectively. The more compact structure of A-type starches leads to higher hot paste stability, e.g., lower breakdown. This behavior suggests that potato starch may have lower resistance during mixing and baking. In contrast, buckwheat flour exhibited the peak viscosity and breakdown, implying stability towards shearing and high temperatures and thus potentially suitable for baking.
Another starch property that needs to be considered, specifically in breadmaking, is starch damage. Starch damage represents the structural damage occurring during milling or grinding, which significantly influences the starch behavior. Overall, flours had a higher structural damage than isolated starches, with rice flour being the highest. This is probably explained by the more compact kernels of rice, which may lead to more extensive damage during milling, but also to the type of milling itself, which contributes to the extent of starch damage [22].
Starch damage correlated positively with WHC (r = 0.93) (see Table 2). A damaged starch granule absorbs excessively more water than native starch, as was also seen by Leòn et al. [16] for wheat. Additionally, it has been reported that intensive starch damage affects batter handling and bread production negatively. The higher water absorption of damaged granules can lead to the development of sticky dough and may be responsible for a gummy crumb and undesirable bread color [16]. The highest WHC was found in rice flour, which was probably not only related to the amount of damaged starch but also its higher protein content. On the other hand, starch damage showed an inverse relationship with swelling power (r = −0.61) and solubility index (r = −0.62). Starch granule rupture decreases starch swelling power of the sample, as the granule is less compact [16,23].
Apart from the effect of starch damage, swelling power was also influenced by the starch granule size. Flours displayed the largest particle sizes. As protein is concentrated mainly in the outer layers of the kernel and decreases toward the center, the two flours show higher protein content compared to the starches, which influences the overall particle size. Among the starches, corn starch had the smallest and potato starch the coarsest particle size. B-type starches usually have a bigger granule size than the A-type starches, resulting in a higher ability to swell. Yet in this study, wheat starch exhibited a coarser granule size than cassava starch, which might be due to the bimodal granule properties of wheat starch. Granule size was negatively correlated with the pasting temperature, which could be explained by the higher surface area of the smaller granule sizes, leading to increased pasting temperatures. Therefore, B-type starches showed lower pasting temperatures than A-type starches, which apart from their different granule size could also be attributed to their starch granule structure (open/closed packed granule). Rice flour contains particularly small starch granules and thus showed a high pasting temperature.
Regarding the retrogradation behavior, setback and final viscosity showed a positive correlation (r = 0.76). Overall, the results showed that the A-type starches had higher final viscosity than B-type starches. Ai & Jane [24] stated that A-type starches tend to retrogradate more easily than B-type starches, leading to high final viscosity. This behavior is also associated with the lower swelling power of A-type than B-type starches. However, in this study, there was no significant correlation between amylose content and retrogradation behavior, which could have been due to additional influencing factors such as granule size/structure or the type of amylose itself. According to Liu [18], molecular weight of amylose in starch varies depending on starch origin, and different granule crystallinity structures result in different degrees of amylose leaching.
Overall, starch properties such as amylose content, starch damage, and water absorption properties (WHC, solubility index, and swelling power) strongly influenced the starch pasting properties. Some influencing factors such as the type of starch crystallinity or the starch granule size could also explain the starch behavior in this study.

3.2. Effect of Starch:Water Ratio on the Electrical Conductivity and Rheological Properties of GF Batters

The effect of starch:water ratio on the electrical conductivity and rheological properties of GF batter are presented in Table 3. The electrical conductivity of all batters ranged within 0.35–0.64 S/m, which was suitable for ohmic heating according to Jaeger et al. [1], who pointed out that food matrix should have an electrical conductivity in the range of 0.1–10 S/m to be effectively heated with this technology.
Results showed that corn, wheat, rice, and buckwheat batters made with less water exhibited higher electrical conductivity values, while in the case of potato and cassava batters, the highest value was found at a starch:water ratio of 1:1.3. Generally, in previous studies, higher moisture contents contributed to an increased electrical conductivity [13,25,26], which is opposite to what was seen in this study. Discrepancies observed may be attributed to a higher dilution of ions in batters made with higher water contents, resulting in lower overall electrical conductivity. In the case of potato and cassava batter, the slightly different trend may be explained by the higher phosphorus and salt content in potato and cassava starch, respectively (see Supplementary Table S1). These findings reflect those of Marcotte et al. [27], who also found a higher electrical conductivity at higher hydrocolloid concentrations at room temperature (25 °C). Chaiwanichsiri et al. [28] conducted electrical conductivity and viscosity measurements of 12 different starches. Results revealed a non-linear correlation between starch suspension viscosity and electrical conductivity at room temperature, evidencing that not only water influences the electrical conductivity of the batter. Therefore, in this study, other batter components such as amylose, protein, emulsifiers, and salt need to be considered as well.
GF batters were also characterized in terms of their flow behavior (see Table 3). The flow behavior index n of all batters ranged between 0.33–0.55, indicating a shear-thinning behavior, which was mostly not influenced by the addition of water. Shear-thinning indicated a weakened molecule network due to applied shear. This results in a less viscous, less cohesive, and less elastic batter compared to wheat dough [10].
The apparent viscosity and the consistency coefficient (K) showed a similar trend. The values decreased significantly with increasing water content, being negatively correlated (r = −0.72 and r = −0.76, respectively). Rice batter demonstrated the highest apparent viscosity and consistency coefficient, probably due to the high WHC, starch damage, and amylose content of the flour. On the contrary, wheat batter exhibited the lowest apparent viscosity and consistency coefficient, mainly attributed to the low WHC and swelling power of the flour. Figure 1 shows the viscoelastic properties of different GF batters. The increase of water content dramatically decreased storage (G′) and loss (G″) moduli of the samples. Generally, all the samples exhibited higher G″ than G′ values, indicating a viscoelastic liquid with a dominant viscous behavior.
Opposite to the results above, most researchers have attempted to design GF batters with a solid-like behavior to mimic the viscoelastic properties of wheat dough [29,30]. However, in the case of using ohmic heating, a liquid-like behavior of the batter is crucial in order to enhance ion mobility.
Batter behavior mostly showed a loss factor (tan δ) higher than one. This factor describes the ratio of the loss and storage modulus. As seen in Figure 1, the water content of the batter did not significantly influence the tan δ value, as similar trends were seen between different starch:water ratios. The behavior of tan δ indicated that molecular rearrangements within the samples took place. Burešová et al. [3] stated that higher tan δ values are typical for dough with a dominant viscous behavior.
Overall, batters with higher water content exhibited lower complex viscosities (data not shown; r = −0.80). Rice flour showed the highest complex viscosity within the used starches and flours, specifically at lower water content. Mancebo et al. [31] found that the higher complex viscosity seen in rice flour compared to other samples could be attributed to its high starch damage, protein content, and water absorption capacity. Regarding the correlation of rheology to bread quality, Bockstaele et al. [32] found that complex viscosity could be negatively correlated with bread volume. However, no conclusive relationship between the dynamic rheological properties of dough (n, K, η) and breadmaking performance has been established yet.

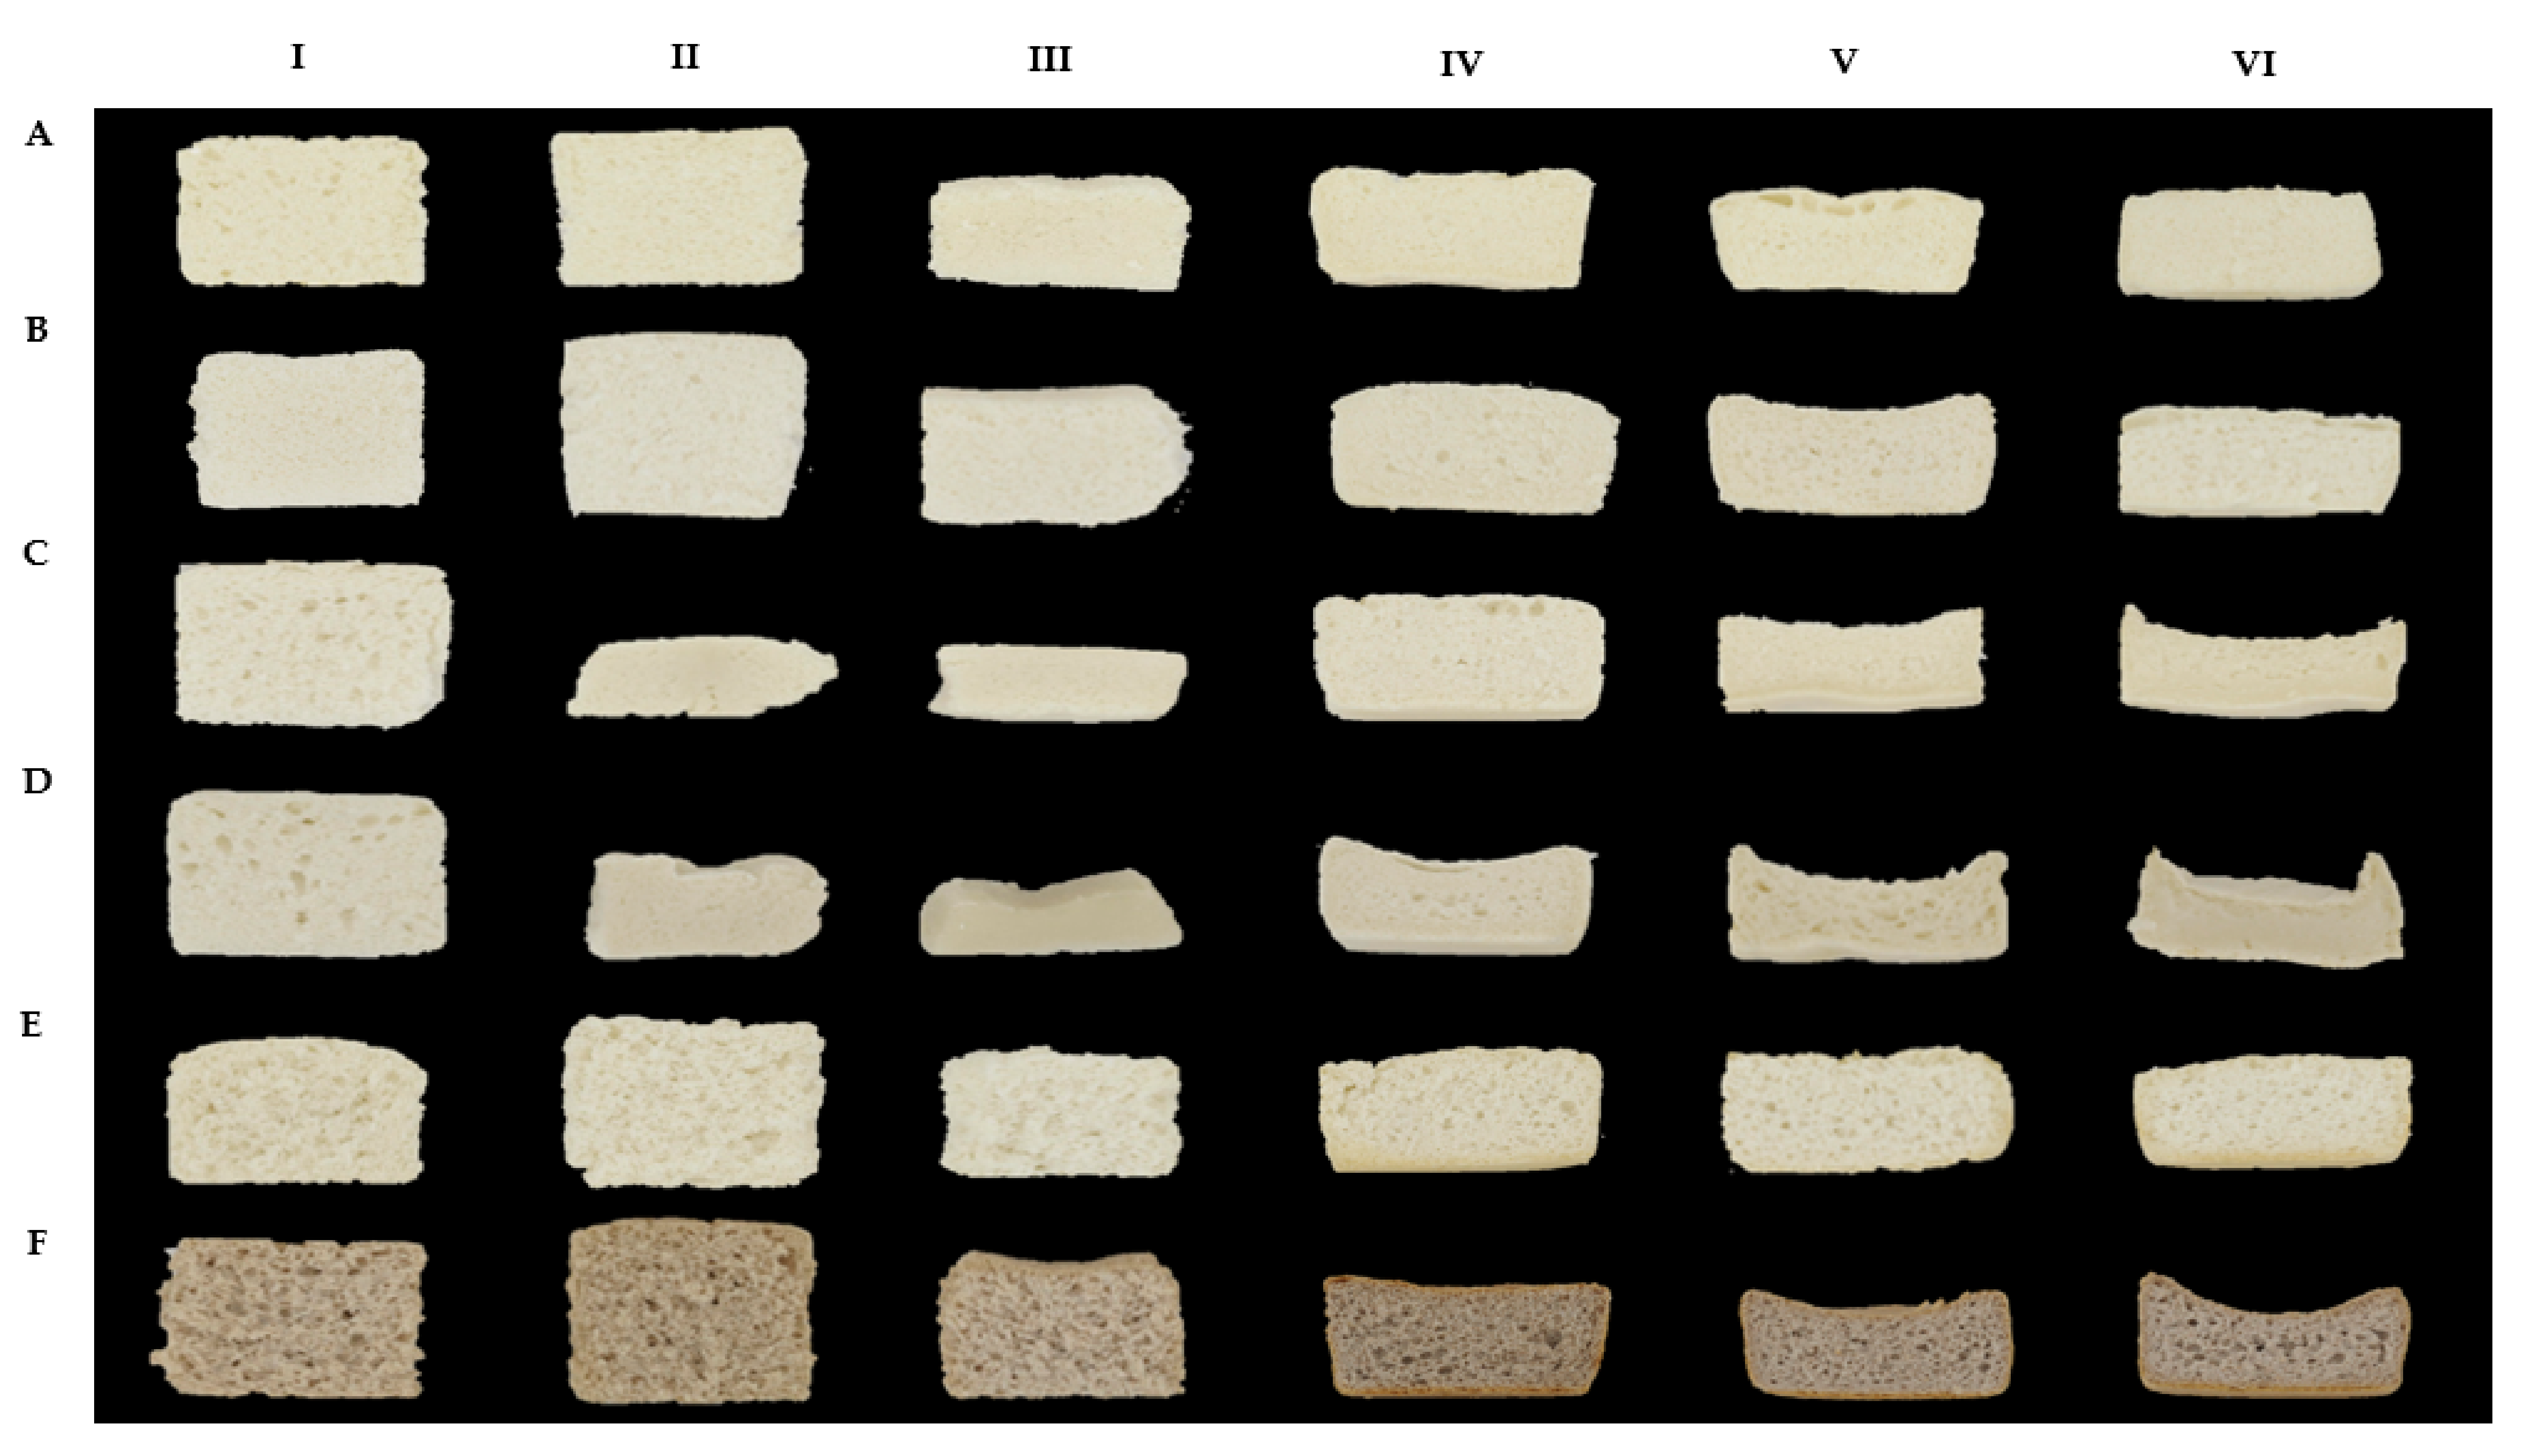
3.3. Effect of Batter Rheology on GF Bread Properties

Table 4 summarizes the effect of starch:water ratio on GF bread properties baked with two different methods, ohmic heating and conventional heating. As expected, ohmic heating showed a positive effect on all GF bread properties compared with conventional heating, except for the baking loss, which was higher in GF bread baked by ohmic heating than by conventional heating. This finding can be explained by the absence of a bread crust in ohmic-heated bread, leading to an increased moisture loss. The water evaporation of this bread occurred more noticeably during storage than during baking itself. Among the starches, ohmic-heated bread made from cassava and potato starch exhibited the lowest baking loss, which could be associated with the higher swelling power of these two starches.
In the case of conventional bread, a linear relationship between baking loss and water content of the batter was found, while a non-linear trend was observed for the ohmic-heated bread. A previous investigation suggested that ohmic-heated bread displayed a lower moisture content due to different moisture migration behavior compared to conventionally baked bread [2,33]. Furthermore, a positive correlation between baking loss and bread volume (r = 0.67) was found. The higher bread volume corresponds to a higher surface area of ohmic-heated bread, resulting in higher water evaporation.
The starch:water ratio and thus the apparent viscosity of the batter strongly influenced the bread volume. As mentioned before, the viscosity of GF batter plays an important role in entrapping gas bubbles during mixing and fermentation. According to Ronda et al. [8], bread volume was negatively correlated with apparent viscosity and positively correlated with the loss factor tan δ of the dough. An excessive dough viscosity led to a smaller bread volume as the dough could not expand during proofing. In contrast, very low viscosities also led to compact structures, as the dough lost its ability to retain gas, subsequently decreasing the bread volume.
In this study, the correlation of apparent viscosity and bread volume was mainly dependent on the characteristics of the starch/flour. The B-type starches produced high bread volume at lower water content and higher apparent viscosity. At the same time, A-type starches demonstrated high bread volume at low and medium water content with lower apparent viscosity than B-type starches. This finding could be associated with the starch properties (breakdown, swelling power, and solubility). As aforementioned, the higher breakdown resulted in lower resistance of the starch granule during mixing, leading to lower bread volume. Additionally, the high swelling power and solubility of potato and cassava starch were responsible for the required low water content to produce high bread volume.
The cross-sections of GF bread slices are shown in Figure 2. It can be seen that higher apparent batter viscosities led to an enhanced bread volume for conventionally baked bread. In this case, slow heating led to CO2 release before the crumb was built; thus, a higher viscosity was needed to trap the CO2 within the batter system. In contrast, ohmic baking was characterized by uniform and fast heating, resulting in the formation of a stable or firm bread crumb before CO2 dissipation. The ohmic-heated bread volume was twice as high as the volume of conventionally baked bread (see Table 4). This result demonstrated that adjusting the starch:water ratio of GF batter is an important factor, as it influences the GF batter apparent viscosity, and subsequently its performance in ohmic baking.
Another important bread parameter is relative elasticity of the crumb, which represents the ability of the bread to return to its initial dimensions after deformation and provides information about the crumb structure, especially the cell wall rigidity [34]. Surprisingly, the relative elasticity of the ohmic-heated bread and conventionally baked bread showed similar trends and were not significantly different between the two baking processes. Potato and buckwheat showed the highest relative elasticity at medium water content, while the other starches/flours demonstrated high relative elasticity at the highest water content. In this study, higher relative elasticity did not always reflect better bread properties. For instance, ohmic-heated corn and potato bread with higher relative elasticity exhibited the hardest crumb. These findings could be attributed to the starch properties and its gelatinization profile during baking.
Conventionally baked bread showed higher crumb firmness than ohmic-heated bread, except when using potato and cassava starch. This fact confirmed that the starch properties strongly influence the bread characteristics, and they greatly differed between A-type and B-type starches, leading to large variations between the formulations. Results may be explained by the differences in the pasting behavior of the B-type starches (high peak viscosity, high breakdown, and low pasting temperature), as well as the coarser granule size, relatively high swelling power, and high viscosity, compared to the A-type starches. In accordance with these mentioned findings, a positive correlation of breakdown (r = 0.81) and peak viscosity (r = 0.81) to crumb firmness was found. Moreover, both heating methods differ in heating rate and baking time, which could also affect the gelatinization behavior of the different starches. Baking parameters (e.g., time, heating rate) may influence the crumb firmness by promoting structural modifications in starch, such as granule swelling, amylose leaching and changes in the crystalline structure of amylopectin [35,36]. Different moisture migration and its correlation to crumb firmness in conventional heating and electrical resistance oven (ERO) were investigated by Luyts et al. [37], who found that ERO baking causes a lower temperature and moisture gradient than conventional baking. This reinforces the reduction of moisture migration or loss from the center of the bread in conventionally baked bread, as the crust is already developed and acts as a barrier. Possibly, the trapped water hinders gas cell expansion, leading to lower bread volume and higher crumb firmness. Similar observations were made by Hayman et al. [38], who found that a slow heating rate during conventional baking restricted gas cell expansion, induced coalescence, and resulted in non-uniform gas cell size and shape associated with grainy crumb texture.
Crumb properties, such as the number of pores, average pore size, and pore area, are commonly used to determine bread quality. Overall, ohmic-heated bread exhibited a higher number of pores at the same water content, and they were more evenly distributed than in conventionally baked bread. Color of the bread crumb remained unaffected by the different heating methods, while the crust color (data not shown) of conventional bread was darker due to an intense Maillard reaction that did not occur in ohmic-heated bread.
Overall, these findings demonstrated that GF bread quality was not only significantly influenced by the starch:water ratio and batter viscosity, but also to a large extent by the starch/flour properties. GF batters have to be adapted to the used starch/flour source, but also to the intended baking process. Batter properties can be divided into two categories: (1) B-type starches (like potato and cassava as used in this study), which require a lower water content and was associated with the highest apparent viscosity at a range of 47.12–56.20 Pa·s, and (2) A-type starches, which require a medium water content, resulting in a low to medium viscosity range of 2.29–15.86 Pa·s. These differences were particularly pronounced when applying ohmic heating; in conventionally baked breads, batter viscosity can be slightly higher for both types of starches.
These results allow for the design of GF batter properties based in particular on viscosity, in order to obtain GF breads with improved quality like high bread volume.

4. Conclusions

Rheological properties of GF batter are an important factor to consider for designing GF bread recipes, which is particularly true when they are baked by ohmic heating. Previous research has shown that ohmic heating is a very suitable process for GF baking, resulting in GF breads with increased volume compared to conventional baking. This research demonstrated that batter properties are not only significantly modified by the starch:water ratio, but also to a large extent by the starch or flour source.
Generally, rheological analyses of the batters revealed shear-thinning properties and a dominant viscous behavior in most of the samples. In case of ohmic-heated breads, a non-linear relationship between viscosity and bread characteristics was found. These breads were generally higher in volume and softer in texture as opposed to conventionally baked bread. This fact showed that viscosity played a critical role in determining GF bread structure and crumb properties.
The different behavior of A and B-type starches at similar water content was strongly influenced by its structural characteristics like granule crystallinity (firm, loose) or amylose content and starch damage, influencing its physical properties (e.g., WHC, swelling power, solubility and pasting properties). Results have revealed that B-type starches (potato and cassava) required lower water content (higher batter viscosity) than A-type starches (corn, wheat, or rice and buckwheat flour) to obtain optimal GF bread characteristics. In case of the flours (buckwheat, rice), batter viscosity was also influenced by other components, such as proteins, which play an important role in the batter rheology due to its foam formation and stabilization capacity. The extent to which the protein content or source affects the properties of GF batter and influences ohmic-heated GF bread quality is yet to be explored and is aimed for subsequent research.

Supplementary Materials

The following data are available online at https://www.mdpi.com/article/10.3390/app11146567/s1, Table S1: Chemical composition of different starches and flours as provided by the manufacturers.

Author Contributions

Conceptualization, E.W., D.B. and R.S.; methodology, E.W.; investigation, E.W. and A.S.; formal analysis, E.W. and A.S.; resources, E.W., R.S. and H.J.; validation, E.W., D.B., and R.S.; visualization, E.W.; writing—original draft preparation, E.W., D.B.; writing—review and editing, D.B., H.J. and R.S.; project administration, R.S. All authors have read and agreed to the published version of the manuscript.

Funding

The present work is a part of a Ph.D. program funded by the Indonesia-Austria Scholarship Programme (IASP), a joint scholarship between the Indonesian Ministry of Education and Culture (KEMDIKBUD) and Austria’s Agency for Education and Internationalization (OeAD-GmbH) in corporation with ASEAN European Academic University Network (ASEA-UNINET) (reference number: ICM-2019-13886).

Data Availability Statement

Data is included within the article or Supplementary Material.

Acknowledgments

The authors thank HARKE Services GmbH (Muelheim an der Ruhr, Germany) for providing hydroxypropyl methylcellulose (HPMC; Metolose®, Shin Etsu Chemical Col, Ltd., Tokyo, Japan).

Conflicts of Interest

The authors declare no conflict of interest.

References

  1. Jaeger, H.; Roth, A.; Toepfl, S.; Holzhauser, T.; Engel, K.H.; Knorr, D.; Vogel, R.F.; Bandick, N.; Kulling, S.; Heinz, V.; et al. Opinion on the Use of Ohmic Heating for the Treatment of Foods. Trends Food Sci. Technol. 2016, 55, 84–97. [Google Scholar] [CrossRef]
  2. Bender, D.; Gratz, M.; Vogt, S.; Fauster, T.; Wicki, B.; Pichler, S.; Kinner, M.; Jäger, H.; Schoenlechner, R. Ohmic Heating—A Novel Approach for Gluten-Free Bread Baking. Food Bioprocess Technol. 2019, 12, 1603–1613. [Google Scholar] [CrossRef] [Green Version]
  3. Burešová, I.; Kráčmar, S.; Dvořáková, P.; Středa, T. The Relationship between Rheological Characteristics of Gluten-Free Dough and the Quality of Biologically Leavened Bread. J. Cereal Sci. 2014, 60, 271–275. [Google Scholar] [CrossRef]
  4. Schober, T.J.; Messerschmidt, M.; Bean, S.R.; Park, S.H.; Arendt, E.K. Gluten-Free Bread from Sorghum: Quality Differences among Hybrids. Cereal Chem. 2005, 82, 394–404. [Google Scholar] [CrossRef]
  5. Schoenlechner, R.; Mandala, I.; Kiskini, A.; Kostaropoulos, A.; Berghofer, E. Effect of Water, Albumen and Fat on the Quality of Gluten-Free Bread Containing Amaranth. Int. J. Food Sci. Technol. 2010, 45, 661–669. [Google Scholar] [CrossRef]
  6. Lazaridou, A.; Duta, D.; Papageorgiou, M.; Belc, N.; Biliaderis, C.G. Effects of Hydrocolloids on Dough Rheology and Bread Quality Parameters in Gluten-Free Formulations. J. Food Eng. 2007, 79, 1033–1047. [Google Scholar] [CrossRef]
  7. Sciarini, L.S.; Ribotta, P.D.; León, A.E.; Pérez, G.T. Incorporation of Several Additives into Gluten Free Breads: Effect on Dough Properties and Bread Quality. J. Food Eng. 2012, 111, 590–597. [Google Scholar] [CrossRef]
  8. Ronda, F.; Perez-Quirce, S.; Lazaridou, A.; Biliaderis, C.G. Effect of Barley and Oat β-Glucan Concentrates on Gluten-Free Rice-Based Doughs and Bread Characteristics. Food Hydrocoll. 2015, 48, 197–207. [Google Scholar] [CrossRef]
  9. Sabanis, D.; Lebesi, D.; Tzia, C. Effect of Dietary Fibre Enrichment on Selected Properties of Gluten-Free Bread. LWT Food Sci. Technol. 2009, 42, 1380–1389. [Google Scholar] [CrossRef]
  10. Matos, M.E.; Rosell, C.M. Understanding Gluten-Free Dough for Reaching Breads with Physical Quality and Nutritional Balance. J. Sci. Food Agric. 2015, 95, 653–661. [Google Scholar] [CrossRef]
  11. Demirkesen, I.; Mert, B.; Sumnu, G.; Sahin, S. Rheological Properties of Gluten-Free Bread Formulations. J. Food Eng. 2010, 96, 295–303. [Google Scholar] [CrossRef]
  12. Leite, T.S.; Sastry, S.K.; Cristianini, M. Effect of Concentration and Consistency on Ohmic Heating. J. Food Process Eng. 2018, 41, 1–9. [Google Scholar] [CrossRef]
  13. Li, F.D.; Li, L.T.; Li, Z.; Tatsumi, E. Determination of Starch Gelatinization Temperature by Ohmic Heating. J. Food Eng. 2004, 62, 113–120. [Google Scholar] [CrossRef]
  14. Eriksson, E. Physicochemical, Functional and Pasting Characteristics of Three Varieties of Cassava in Wheat Composite Flours. Br. J. Appl. Sci. Technol. 2014, 4, 1609–1621. [Google Scholar] [CrossRef]
  15. Turkut, G.M.; Cakmak, H.; Kumcuoglu, S.; Tavman, S. Effect of Quinoa Flour on Gluten-Free Bread Batter Rheology and Bread Quality. J. Cereal Sci. 2016, 69, 174–181. [Google Scholar] [CrossRef]
  16. León, A.E.; Barrera, G.N.; Pérez, G.T.; Ribotta, P.D.; Rosell, C.M. Effect of Damaged Starch Levels on Flour-Thermal Behaviour and Bread Staling. Eur. Food Res. Technol. 2006, 224, 187–192. [Google Scholar] [CrossRef]
  17. Ee, K.Y.; Eng, M.K.; Lee, M.L. Physicochemical, Thermal and Rheological Properties of Commercial Wheat Flours and Corresponding Starches. Food Sci. Technol. 2020, 40, 51–59. [Google Scholar] [CrossRef]
  18. Liu, Q. Understanding Starches and Their Role in Foods. In Food Carbohydrates, 1st ed.; Ciu, S.W., Ed.; Taylor & Francis Group: Boca Raton, FL, USA, 2005; pp. 309–355. [Google Scholar] [CrossRef]
  19. Blazek, J.; Copeland, L. Pasting and Swelling Properties of Wheat Flour and Starch in Relation to Amylose Content. Carbohydr. Polym. 2008, 71, 380–387. [Google Scholar] [CrossRef]
  20. Ragaee, S.; Abdel-Aal, E.S.M. Pasting Properties of Starch and Protein in Selected Cereals and Quality of Their Food Products. Food Chem. 2006, 95, 9–18. [Google Scholar] [CrossRef]
  21. Sasaki, T.; Yasui, T.; Matsuki, J. Effect of Amylose Content on Gelatinization, Retrogradation, and Pasting Properties of Starches from Waxy and Nonwaxy Wheat and Their F1 Seeds. Cereal Chem. 2000, 77, 58–63. [Google Scholar] [CrossRef]
  22. Torbica, A.; Hadnadev, M.; Dapčević Hadnadev, T. Rice and Buckwheat Flour Characterisation and Its Relation to Cookie Quality. Food Res. Int. 2012, 48, 277–283. [Google Scholar] [CrossRef]
  23. Horstmann, S.W.; Lynch, K.M.; Arendt, E.K. Starch Characteristics Linked to Gluten-Free Products. Foods 2017, 6, 29. [Google Scholar] [CrossRef] [PubMed] [Green Version]
  24. Ai, Y.; Jane, J.L. Understanding Starch Structure and Functionality. In Starch in Food: Structure, Function and Applications, 2nd ed.; Sjöö, M., Nilsson, L., Eds.; Elsevier Ltd.: Duxford, UK, 2018; pp. 151–178. [Google Scholar] [CrossRef]
  25. Morales-Sánchez, E.; Reyes-Vega, M.L.; Gaytán-Martínez, M.; Figueroa-Cárdenas, J.D.; Velázquez, G. Relationship between Electrical Conductivity and Water Activity of Starch-Water Composites. Food Eng. Ser. 2015, 527–531. [Google Scholar] [CrossRef]
  26. Pongviratchai, P.; Park, J.W. Electrical Conductivity and Physical Properties of Surimi-Potato Starch under Ohmic Heating. J. Food Sci. 2007, 72, 503–507. [Google Scholar] [CrossRef] [PubMed]
  27. Marcotte, M.; Ramaswamy, H.S.; Piette, J.P.G. Ohmic Heating Behavior of Hydrocolloid Solutions. Food Res. Int. 1998, 31, 493–502. [Google Scholar] [CrossRef]
  28. Chaiwanichsiri, S.; Ohnishi, S.; Suzuki, T.; Takai, R.; Miyawaki, O. Measurement of Electrical Conductivity, Differential Scanning Calorimetry and Viscosity of Starch and Flour Suspensions during Gelatinisation Process. J. Sci. Food Agric. 2001, 81, 1586–1591. [Google Scholar] [CrossRef]
  29. Onyango, C.; Mutungi, C.; Unbehend, G.; Lindhauer, M.G. Modification of Gluten-Free Sorghum Batter and Bread Using Maize, Potato, Cassava or Rice Starch. LWT Food Sci. Technol. 2011, 44, 681–686. [Google Scholar] [CrossRef]
  30. Ronda, F.; Pérez-Quirce, S.; Villanueva, M. Rheological Properties of Gluten-Free Bread Doughs: Relationship with Bread Quality. In Advances in Food Rheology and Its Applications; Ahmed, J., Ptaszek, P., Basu, S., Eds.; Elsevier Ltd.: Duxford, UK, 2017; pp. 297–334. [Google Scholar] [CrossRef]
  31. Mancebo, C.M.; Merino, C.; Martínez, M.M.; Gómez, M. Mixture Design of Rice Flour, Maize Starch and Wheat Starch for Optimization of Gluten Free Bread Quality. J. Food Sci. Technol. 2015, 52, 6323–6333. [Google Scholar] [CrossRef] [PubMed] [Green Version]
  32. Bockstaele, F.; Van Leyn, I.; De Eeckhout, M.; Dewettinck, K. Rheological Properties of Wheat Flour Dough and Their Relationship with Bread Volume II. Dynamic Oscillation Measurements. Cereal Chem. 2008, 85, 762–768. [Google Scholar] [CrossRef]
  33. Derde, L.J.; Gomand, S.V.; Courtin, C.M.; Delcour, J.A. Moisture Distribution during Conventional or Electrical Resistance Oven Baking of Bread Dough and Subsequent Storage. J. Agric. Food Chem. 2014, 62, 6445–6453. [Google Scholar] [CrossRef]
  34. Gil, M.J.; Callejo, M.J.; Rodríguez, G.; Ruiz, M.V. Keeping Qualities of White Pan Bread upon Storage: Effect of Selected Enzymes on Bread Firmness and Elasticity. Eur. Food Res. Technol. 1999, 208, 394–399. [Google Scholar] [CrossRef]
  35. Bosmans, G.M.; Lagrain, B.; Fierens, E.; Delcour, J.A. The Impact of Baking Time and Bread Storage Temperature on Bread Crumb Properties. Food Chem. 2013, 141, 3301–3308. [Google Scholar] [CrossRef] [PubMed]
  36. Patel, B.K.; Waniska, R.D.; Seetharaman, K. Impact of Different Baking Processes on Bread Firmness and Starch Properties in Breadcrumb. J. Cereal Sci. 2005, 42, 173–184. [Google Scholar] [CrossRef]
  37. Luyts, A.; Wilderjans, E.; Van Haesendonck, I.; Brijs, K.; Courtin, C.M.; Delcour, J.A. Relative Importance of Moisture Migration and Amylopectin Retrogradation for Pound Cake Crumb Firming. Food Chem. 2013, 141, 3960–3966. [Google Scholar] [CrossRef] [PubMed]
  38. Hayman, D.A.; Hoseney, R.C.; Faubion, J.M. Effect of Pressure (Crust Formation) on Bread Crumb Grain Development. Cereal Chem. 1998, 75, 581–584. [Google Scholar] [CrossRef]
Figure 1. Frequency sweep of GF batter performed at 100–0.1 Hz: (A) storage modulus, (B) loss modulus, (C) tan δ value, (I) starch:water ratio 1:0.9, (II) starch:water ratio 1:1.3, and (III) starch:water ratio 1:1.7, exlude the buckwheat starch (I) starch:water ratio 1:1, (II) starch:water ratio 1:1.5, and (III) starch:water ratio 1:2. The symbols correspond to: × corn starch, * wheat starch, ■ potato starch, ▲ cassava starch, • rice flour, and ♦ buckwheat flour.
Applsci 11 06567 g001
Figure 2. Cross-sections of GF bread slices from different starch or flour: (A) corn starch, (B) wheat starch, (C) potato starch, (D) cassava starch, (E) rice flour, and (F) buckwheat flour, and water ratio (I) OH 1:0.9, (II) OH 1:1.3, (III) OH 1:1.7, (IV) conventional 1:0.9, (V) conventional 1:1.3, and (VI) conventional 1:1.7. The water ratios for buckwheat flour were different, (I) OH 1:1, (II) OH 1:1.5, (III) OH 1:2, (IV) conventional 1:1, (V) conventional 1:1.5, and (VI) conventional 1:2.
Applsci 11 06567 g002
Table 1. Chemical and physical characterization of different starches and flours used for baking.
SamplesWater Holding Capacity (g/g)Swelling Power (%)Solubility Index (%)Amylose Content (%)Starch Damage (%)Particle Size (μm)Peak Viscosity (RVU)Breakdown
(RVU)
Final
Viscosity
(RVU)
Setback
(RVU)
Pasting
Temperature (°C)
Corn1.83 ± 0.02 a10.28 ± 0.22 b3.98 ± 0.98 a20.85 ± 1.17 c3.06 ± 0.26 c20.02 ± 1.04 a392.42 ± 13.51 b162.22 ± 7.44 c361.48 ± 5.63 c129.93 ± 2.45 a75.65 ± 0.64 d
Wheat1.80 ± 0.02 a8.14 ± 0.42 a5.96 ± 0.07 a26.55 ± 0.53 d2.20 ± 0.02 b42.98 ± 2.20 b389.31 ± 6.88 b63.55 ± 2.39 b457.26 ± 14.64 d131.58 ± 6.19 a72.58 ± 0.08 c
Potato1.92 ± 0.05 b15.89 ± 0.84 c8.91 ± 1.72 b21.45 ± 1.96 c2.34 ± 0.37 b49.03 ± 0.69 b1105.41 ± 28.01 e953.83 ± 25.4 e291.92 ± 12.69 a140.34 ± 10.85 a67.34 ± 0.42 a
Cassava1.78 ± 0.03 a21.17 ± 1.99 d16.78 ± 2.05 c15.70 ± 0.97 b1.65 ± 0.01 a31.72 ± 8.02 ab519.16 ± 12.95 d338.95 ± 16.04 d321.9 ± 5.51 b141.69 ± 8.6 a71.44 ± 0.36 b
Rice2.43 ± 0.01 d8.44 ± 0.09 ab4.29 ± 0.57 a22.15 ± 0.22 c6.16 ± 0.00 e164.94 ± 5.27 c447.12 ± 18.8 c171.78 ± 6.58 c535.69 ± 11.22 e260.35 ± 8.47 b76.63 ± 0.03 e
Buckwheat2.30 ± 0.03 c8.73 ± 0.81 ab5.57 ± 0.58 a18.71 ± 0.71 a4.05 ± 0.15 d266.82 ± 25.25 d244.58 ± 18.35 a7.69 ± 0.17 a472.29 ± 13.32 d254.54 ± 25.59 b72.51 ± 0.16 c
All values are expressed as means ± SD. Sample means with different lowercase letters in the same column are significantly different (p < 0.05).
Table 2. Significant correlations among starch/flour properties and ohmic-heated bread characteristics.
Starch or Bread
Properties
Elasticity
(%)
WHC
(g/g)
Particle
Size (μm)
Solubility
(%)
Swelling
Power
(%)
Amylose
(%)
Starch Damage
(%)
Pasting
Temperature
(°C)
Peak
Viscosity
(RVU)
Breakdown
(RVU)
Setback
(RVU)
Final
Viscosity
(RVU)
Bread
Volume
(cm3/g)
Baking Loss
(%)
WHC (g/g)−0.39 **
Particle size (μm)−0.190.87 **
Solubility (%)0.21−0.47−0.37 **
Swelling power (%)0.02−0.51 **−049 **0.94 **
Amylose (%)0.11−0.27 *−0.52 **−0.37 **−0.34 *
Starch damage (%)−0.39 **0.93 **0.68 **−0.62 **−0.61 **−0.03
Pasting temperature (°C)0.030.40 **0.24−0.52 **−0.58 **0.110.65 **
Peak viscosity (RVU)−0.35 *−0.26−0.45 **0.31 *0.52 **0.23−0.32 *−0.75 **
Breakdown (RVU)−0.37 *−0.27 *−0.43 **0.37 *0.59 **0.11−0.35 *−0.76 **0.99 **
Setback (RVU)−0.350.98 **0.92 **−0.37 **−0.46 **−0.40 **0.87 **0.40 **−0.39 **−0.38 **
Final viscosity (RVU)0.040.74 **0.69 **−0.61 **−0.79 **0.120.79 **0.68 *−0.66 **−0.72 **0.76 **
Bread volume (cm3/g)0.030.120.17−0.55 **−0.65 **0.31 *0.240.47 **−0.52 **−0.57 **0.120.52 **
Baking loss (%)0.060.170.12−0.77 **−0.82 **0.50 **0.38 **0.63 **−0.50 **−0.58 **0.130.60 **0.67 **
Crumb firmness (N)−0.33 *−0.24−0.36 **0.01−0.260.19−0.26−0.58 **0.81 **0.81 **−0.38−0.59 **−0.53 **−0.28 *
* Significant at p < 0.05, ** Significant at p < 0.01.
Table 3. Effect of water content on the rheological and electrical properties of gluten-free batter made from various flours/starch.
SampleRatio *Electrical Conductivity (S/m)Flow Behavior Index nConsistency Coefficient K (Pa·sn)Apparent Viscosity (Pa·s)
Corn1:0.90.64 ± 0.04 a0.48 ± 0.06 a266.98 ± 13.84 c29.11 ± 4.33 b
1:1.30.53 ± 0.04 a0.46 ± 0.01 a62.36 ± 0.44 b4.15 ± 0.15 a
1:1.70.56 ± 0.08 a0.52 ± 0.02 a21.20 ± 1.00 a1.98 ± 0.09 a
Wheat1:0.90.48 ± 0.02 b0.44 ± 0.04 b170.33 ± 10.05 c12.43 ± 0.95 b
1:1.30.40 ± 0.01 a0.34 ± 0.04 a57.09 ± 0.75 b2.29 ± 1.13 a
1:1.70.38 ± 0.01 a0.52 ± 0.01 c22.32 ± 0.11 a1.91 ± 0.08 a
Potato1:0.90.47 ± 0.03 a0.55 ± 0.06 a358.95 ± 13.19 c47.12 ± 10.09 b
1:1.30.53 ± 0.01 b0.55 ± 0.02 a70.85 ± 3.86 b8.14 ± 0.27 a
1:1.70.46 ± 0.02 a0.55 ± 0.03 a28.06 ± 0.97 a2.80 ± 0.10 a
Cassava1:0.90.52 ± 0.01 b0.51 ± 0.07 a352.83 ± 18.04 c56.20 ± 2.48 b
1:1.30.54 ± 0.01 c0.44 ± 0.03 a65.98 ± 1.72 b4.57 ± 0.35 a
1:1.70.43 ± 0.01 a0.53 ± 0.01 a24.29 ± 1.06 a2.28 ± 0.04 a
Rice1:0.90.57 ± 0.00 c0.36 ± 0.02 a749.23 ± 50.08 c63.04 ± 13.99 ba
1:1.30.53 ± 0.02 b0.45 ± 0.02 b130.14 ± 6.68 b15.86 ± 0.71 ab
1:1.70.42 ± 0.01 a0.53 ± 0.04 c46.51 ± 0.88 a5.64 ± 0.07 ab
Buckwheat1:10.50 ± 0.02 c0.33 ± 0.02 a386.33 ± 33.97 c28.39 ± 2.22 c
1:1.50.41 ± 0.02 b0.47 ± 0.02 b100.48 ± 7.47 b11.94 ± 0.40 b
1:20.35 ± 0.01 a0.46 ± 0.02 b36.56 ± 2.22 a3.65 ± 0.17 a
* Expressed as starch/flour: water ratio. All values are expressed as means ± SD. Significant differences (p < 0.05) are displayed by the different lowercase letters in the same column within the same raw material.
Table 4. GF bread properties of ohmic and conventionally baked bread.
Starch/FlourRatioBaking Loss (%)Bread
Volume (cm3/g)
Relative
Elasticity (%)
Crumb
Firmness (N)
Pore PropertiesCrumb Color
Number of PoresAverage Size (mm)Pore Area (%)L*a*b*
Ohmic Heating
Corn1:0.921.03 ± 2.11 b3.50 ± 0.10 b47.90 ± 1.69 a9.89 ± 2.17 b95.33 ± 0.58 b0.84 ± 0.07 a20.42 ± 0.62 a90.65 ± 1.78 a0.77 ± 0.58 a17.45 ± 1.17 a
1:1.320.46 ± 0.46 b3.50 ± 0.06 b61.57 ± 0.54 b4.87 ± 0.59 a102.33 ± 0.58 c0.89 ± 0.08 a22.57 ± 1.80 a88.74 ± 2.49 a0.34 ± 0.08 a17.32 ± 0.18 a
1:1.717.27 ± 0.77 a2.19 ± 0.12 a73.54 ± 2.15 c11.32 ± 1.16 b90.67 ± 0.58 a0.98 ± 0.09 a22.25 ± 1.92 a91.92 ± 0.35 a1.02 ± 0.36 a17.09 ± 0.81 a
Wheat1:0.922.25 ± 1.24 b4.01 ± 0.10 b65.57 ± 1.54 a2.18 ± 0.26 b67.33 ± 1.53 a1.25 ± 0.03 a21.49 ± 1.21 a91.98 ± 0.53 a0.69 ± 0.14 a12.13 ± 0.87 a
1:1.320.94 ± 0.81 ab3.85 ± 0.18 b73.79 ± 0.69 b1.27 ± 0.16 a83.67 ± 0.58 b1.31 ± 0.18 a24.93 ± 1.74 b91.75 ± 0.05 a0.42 ± 0.25 a13.21 ± 0.35 ab
1:1.719.48 ± 0.25 a2.81 ± 0.04 a76.49 ± 0.80 c1.51 ± 0.09 a65.33 ± 1.15 a1.6 ± 0.11 b26.15 ± 1.65 b89.97 ± 1.21 b0.68 ± 0.05 a13.49 ± 0.19 b
Potato1:0.911.70 ± 0.30 a3.01 ± 0.10 c52.87 ± 0.71 a10.2 ± 0.45 a89.67 ± 2.08 a1.04 ± 0.14 b23.20 ± 2.54 b88.9 ± 0.18 b0.76 ± 0.40 a14.32 ± 0.60 a
1:1.311.74 ± 0.76 a1.51 ± 0.01 b59.37 ± 0.84 b30.97 ± 1.91 b108.33 ± 2.52 b0.72 ± 0.04 a20.23 ± 0.71 ab88.07 ± 1.66 b1.45 ± 0.39 b16.23 ± 0.33 b
1:1.713.50 ± 1.40 a1.08 ± 0.04 a53.19 ± 2.09 a31.01 ± 0.35 b94.67 ± 3.06 a0.62 ± 0.16 a14.71 ± 4.21 a85.33 ± 0.70 a1.50 ± 0.04 b16.72 ± 0.21 b
Cassava1:0.911.09 ± 0.83 a2.66 ± 0.14 c72.51 ± 1.03 c1.58 ± 0.18 b103.67 ± 3.21 b0.94 ± 0.17 a24.41 ± 5.16 a89.6 ± 1.39 c1.26 ± 0.24 a14.39 ± 0.40 a
1:1.39.88 ± 0.48 a1.17 ± 0.07 a66.60± 0.48 b1.56 ± 0.08 b102.67 ± 2.31 b0.65 ± 0.10 a16.75 ± 2.57 a82.4 ± 1.80 b2.28 ± 0.20 b15.71 ± 0.46 b
1:1.710.31 ± 0.63 a1.87 ± 0.54 b62.23 ± 0.64 a0.59 ± 0.04 a43.00 ± 2.65 a0.97 ± 1.01 a10.71 ± 11.48 a74.19 ± 1.77 a2.98 ± 0.45 c16.73 ± 0.85 b
Rice1:0.915.61 ± 2.44 a3.02 ± 0.17 b50.66 ± 0.53 a2.67 ± 0.67 b55.67 ± 1.53 a1.68 ± 0.37 a23.29 ± 4.49 a88.06 ± 0.54 a1.40 ± 0.02 c16.33 ± 0.18 c
1:1.319.77 ± 0.91 b3.14 ± 0.08 b56.96 ± 0.27 b0.85 ± 0.17 a60.67 ± 1.53 ab1.46 ± 0.02 a22.22 ± 0.82 a89.46 ± 0.15 b1.03 ± 0.01 b15.34 ± 0.00 b
1:1.720.61 ± 1.80 b2.49 ± 0.06 a62.15 ± 0.34 c0.99 ± 0.10 a58.67 ± 2.52 b1.28 ± 0.09 a18.79 ± 0.82 a89.78 ± 0.18 b0.60 ± 0.22 a14.45 ± 0.68 a
Buckwheat1:114.50 ± 0.01 a3.03 ± 0.12 b60.25 ± 0.80 a0.88 ± 0.06 b64.33 ± 1.53 b1.58 ± 0.13 b24.44 ± 2.28 a62.12 ± 0.79 a7.46 ± 0.20 a18.03 ± 0.18 b
1:1.514.72 ± 0.58 b3.36 ± 0.08 c63.19 ± 0.46 b0.96 ± 0.11 b75.33 ± 1.15 c1.30 ± 0.10 a24.22 ± 1.83 a66.1 ± 0.28 b6.60 ± 0.16 a16.20 ± 0.54 a
1:219.46 ± 2.27 c2.65 ± 0.05 a60.91 ± 0.79 a0.63 ± 0.03 a57.33 ± 0.58 a2.34 ± 0.08 c32.77 ± 0.88 b65.23 ± 1.73 b6.64 ± 0.74 a15.41 ± 1.21 a
Conventional Heating
Corn1:0.916.96 ± 2.41 a2.46 ± 0.05 b48.53 ± 0.55 a24.13 ± 1.09 c78.00 ± 1.00 cb0.79 ± 0.08 a16.67 ± 0.79 a90.25 ± 1.47 ab1.03 ± 0.51 a16.72 ± 0.87 a
1:1.317.31 ± 1.16 a2.27 ± 0.25 ab54.76 ± 1.37 b15.20 ± 0.76 b86.67 ± 1.15 bc1.08 ± 0.04 b23.07 ± 0.92 b87.58 ± 2.00 a0.59 ± 0.29 a17.57 ± 0.85 a
1:1.718.53 ± 0.65 a1.99 ± 0.10 a66.83 ± 2.22 c10.24 ± 0.71 a45.67 ± 0.58 a1.70 ± 0.07 c22.24 ± 0.44 b91.68 ± 0.27 b0.86 ± 0.56 a16.38 ± 0.58 a
Wheat1:0.914.57 ± 1.11 a2.78 ± 0.09 b64.25 ± 1.03 a6.11 ± 1.17 c90.70 ± 0.38 b1.54 ± 0.55 a16.78 ± 0.67 a88.58 ± 1.58 a1.06 ± 0.03 a13.79 ± 0.00 a
1:1.317.74 ± 0.19 b2.23 ± 0.08 a75.04 ± 0.44 b3.63 ± 0.05 b87.43 ± 1.49 a1.33 ± 0.09 a16.33 ± 0.38 a88.98 ± 0.52 a0.74 ± 0.06 a14.92 ± 0.37 b
1:1.718.85 ± 0.71 b2.07 ± 0.16 a76.47 ± 0.34 c1.95 ± 0.04 a88.16 ± 1.78 ab1.91 ± 0.56 a16.62 ± 0.59 a89.49 ± 0.20 a1.03 ± 0.57 a15.34 ± 0.67 b
Potato1:0.912.04 ± 0.71 a2.35 ± 0.04 c64.89 ± 0.33 a6.60 ± 0.39 b46.67 ± 1.53 ca1.37 ± 0.04 a17.65 ± 1.06 ac87.6 ± 0.54 b0.89 ± 0.05 a15.17 ± 0.35 a
1:1.315.75 ± 0.23 b1.67 ± 0.11 b69.03 ± 2.03 b3.85 ± 0.59 a85.33 ± 1.53 ab1.14 ± 0.1 b20.9 ± 1.10 b87.01 ± 1.07 b1.37 ± 0.12 ab16.84 ± 0.77 b
1:1.718.82 ± 0.94 c1.42 ± 0.13 a67.31 ± 1.39 ab4.67 ± 0.39 a92.00 ± 2.00 bc1.18 ± 0.12 a28.31 ± 2.01 ac83.62 ± 0.35 a1.61 ± 0.40 b17.82 ± 0.43 b
Cassava1:0.912.47 ± 0.65 a2.00 ± 0.05 b72.55 ± 1.47 b1.64 ± 0.60 b77.33 ± 1.15 c1.05 ± 0.12 a20.7 ± 2.39 c86.35 ± 0.76 c1.97 ± 0.38 b15.52 ± 0.46 a
1:1.315.42 ± 0.86 b1.80 ± 0.03 a59.58 ± 1.27 a0.60 ± 0.05 a37.67 ± 2.52 a1.68 ± 0.47 b16.08 ± 2.74 b81.79 ± 2.24 b2.64 ± 0.46 ab17.73 ± 0.39 b
1:1.715.3 ± 0.77 b1.79 ± 0.14 a59.19 ± 1.62 a0.52 ± 0.09 a41.33 ± 1.53 b0.70 ± 0.09 a9.24 ± 0.92 a74.71 ± 1.70 a3.15 ± 0.50 a17.33 ± 0.74 b
Rice1:0.914.19 ± 0.25 a2.39 ± 0.06 b53.11 ± 2.31 ca4.79 ± 0.48 c59.00 ± 3.00 a1.66 ± 0.07 c24.50 ± 0.61 c86.77 ± 0.3 a1.48 ± 0.06 b16.09 ± 0.37 c
1:1.314.99 ± 0.30 a2.34 ± 0.05 b62.95 ± 1.70 b3.40 ± 0.84 b73.00 ± 2.65 b1.30 ± 0.06 b22.54 ± 0.66 b88.09 ± 0.29 b0.88 ± 0.06 a14.08 ± 0.38 b
1:1.717.44 ± 3.48 a2.19 ± 0.05 a67.88 ± 1.25 ac1.83 ± 0.03 a70.67 ± 2.08 b1.00 ± 0.06 a17.69 ± 1.38 a88.57 ± 0.10 b0.81 ± 0.41 a13.25 ± 0.42 a
Buckwheat1:115.17 ± 0.34 a2.64 ± 0.06 b63.05 ± 0.12 b1.69 ± 0.32 a63.67 ± 1.53 a2.02 ± 0.41 b32.97 ± 5.24 b55.10 ± 1.20 a6.65 ± 0.32 a13.82 ± 0.32 b
1:1.516.43 ± 0.71 ab2.44 ± 0.15 b63.34 ± 0.53 b1.52 ± 0.15 a81.00 ± 1.73 b1.43 ± 0.10 a29.48 ± 1.06 ab59.14 ± 0.93 b6.67 ± 0.01 a12.35 ± 0.32 a
1:218.20 ± 1.99 b2.21 ± 0.07 a60.95 ± 1.30 a1.79 ± 0.49 a87.00 ± 2.00 c1.11 ± 0.11 a23.15 ± 2.28 a59.74 ± 0.91 b6.48 ± 0.34 a11.79 ± 0.31 a
All values are expressed as means ± SD. Sample means with different lowercase letters in the same column and within the same raw material are significantly different (p < 0.05).
Publisher’s Note: MDPI stays neutral with regard to jurisdictional claims in published maps and institutional affiliations.

