Article

Comparison of Volatiles and Chemical Composition of Traditional and Non-Traditional Honey Available on the Polish Market

1
Department of Food Technology and Assessment, Division of Food Quality Assessment, Faculty of Food Technology, Institute of Food Science, Warsaw University of Life Sciences, Nowoursynowska 159 Street, 02-787 Warsaw, Poland
2
Department of Wood Science and Wood Preservation, Institute of Wood Science and Furniture, Warsaw University of Life Sciences, Nowoursynowska 159 Street, 02-787 Warsaw, Poland
*
Author to whom correspondence should be addressed.
Appl. Sci. 2021, 11(14), 6371; https://doi.org/10.3390/app11146371
Submission received: 16 June 2021 / Revised: 3 July 2021 / Accepted: 4 July 2021 / Published: 9 July 2021
(This article belongs to the Special Issue Chemical Composition, Properties and Applications of Honey)

Abstract

:

Featured Application

The characteristics of aroma compounds of selected honey can be useful in the evaluation procedure of the authenticity of honey derived from Poland. Moreover, data about the quantity selected compounds can be used in order to establish whether the honey samples were properly recognized as traditional or non-traditional products.

Abstract

The purpose of the work was to compare the quality of selected honey available on the Polish market, including traditional (rape, lime and meadow and marsh honey) and non-traditional honey (lime, buckwheat, and honeydew honey from coniferous honeydew). Parameters such as electrical conductivity, color, pH, acidity, water, hydroxymethylfurfural, total phenols content, and ability to deactivate ABTS cation radicals were determined. The profile of aroma compounds was carried out by GC-MS technique, and determination of sugars was performed by HPLC. It was found that all tested honey met standards according to European law requirements. Semi-quantitative analysis of volatile compounds showed that all honey samples contain numerous volatiles (in buckwheat honey there were 67 compounds, and in honeydew honey from coniferous honeydew, only 40 compounds). Characteristic volatile compounds of each aroma profile were described e.g., benzaldehyde, acetone, 2-methyl-butanal, nonanal, benzyl alcohol were found in rape honey aroma, and furfural, isovaleric acid, ethanol, delta-valerolactone, isovaleraldehyde, 2-methyl-butanoic acid, and phenylacetaldehyde in buckwheat honey aroma. The total content of volatiles was the highest in buckwheat honey (199.62 µg/kg), and in traditional lime honey (195.17 µg/kg). The lowest total content of volatile substances was established in non-traditional lime honey (73.20 µg/kg) and in rape honey (39.52 µg/kg).

1. Introduction

According to Regulation (EU) No 1169/2011 of the European Parliament and of the Council of 25 October 2011 on the provision of food information to consumers, it is mandatory to provide information about the country of origin of products such as honey whenever its absence is likely to mislead consumers [1]. On that basis, many analytical methods can be used to confirm the authenticity of honey samples. According to Polish the regulation of the Minister of Agriculture and Rural Development of 29 May 2015, amending the regulation on detailed requirements for the commercial quality of honey following specific requirements for honey can be used as part of the procedure to determine the quality of honey: water content, fructose, glucose, and saccharose content, the content of substances insoluble in water, electrical conductivity, hydroxymethylfurfural and free acids content, and diastase number according to the Schade scale [2]. All these methods are not sufficient to obtain information on the origin of the honey, and for that reason, other methods are used in the procedure of indication of honey origin or authenticity [3]. One of these methods is the analytical method for the evaluation of volatile profile composition. Most of the scientific papers describe qualitative characteristics of honey aroma profiles and are lacking quantitative analyses. To the best of our knowledge, our experiment describes for the first time the quantitative aroma compounds composition of honey such as traditional lime honey, meadow, and marsh honey and also non-traditional honeydew honey from coniferous honeydew derived from Poland.
According to the above-mentioned regulation, honey is a naturally sweet substance produced by Apis mellifera bees from plant nectar or secretions of living parts of plants or secretion of insects sucking live parts plants, collected by bees, processed by combining specific substances from bees, folded, dehydrated, collected, and left in the honeycombs to mature. The composition of honey is affected by its botanical and geographical origin. Honey consists of sugars; mainly fructose and glucose. Moreover, honey contains non-enzymatic and enzymatic compounds. To the first group of mentioned constituents, the following substances can be included: antioxidants, ascorbic acid, flavonoids, phenolic acids, carotenoid derivatives, organic acids, amino acids, proteins, and volatile compounds, and to the second group glucose oxidase, catalase [4]. Due to the high content of polyphenol components, honey is characterized by antioxidant, antibacterial, and anti-inflammatory activities [5]. Another author also declares that kinds of honey have been reported to have antiviral, antifungal, anticancer, and antidiabetic activity [6]. Due to the above-mentioned consumers are seeking specific honey not only as nutritional products but also as pharmaceuticals to cure some health problems, increasing their commercial value [6]. For that reason, the quality of honey has to be proper and the information about the country of origin of products has to be reliable.
Honey is a product that is often adulterated. To overcome this problem, scientists have been trying to evaluate reliable methods for establishing honey authenticity and also information about chemical markers that may be useful for honey origin [7]. One of these methods is the determination of aroma compounds, on that basis, particular chemical substances can be assigned to specific categories of honey and/or honey from specific geographical areas/botanical origin.
The aim of the study was to compare the profile of volatile and chemical components, which have an impact on the quality of Polish traditional and non-traditional honey.

2. Materials and Methods

2.1. Materials

Three honey items were traditional products; product H1 (drahimski rape honey—registered as Protected Geographical Indications, West Pomeranian Voivodeship), product H2 (lipiec bia?owieski-lime honey registered as traditional by Polish Ministry of Agriculture and Rural Development, Podlaskie voivodeship), product H3 (meadow and marsh honey registered as traditional by Polish Ministry of Agriculture and Rural Development, Podlaskie voivodeship), and three honey items were non-traditional: product H4 lime honey (Polish origin), product H5 buckwheat honey (Polish origin), and product H6 honeydew honey from coniferous honeydew (Polish origin).

2.2. Methods

All the physicochemical parameters (water content, electrical conductivity, acidity, hydroxymethylfurfural content, and color intensity) were determined in triplicate according to standardized methods proposed by International Honey Commission [8].

2.2.1. Water Content

Water content (moisture) was determined based on the refractometric method using an Abbe-type refractometer and the values were corrected to standard temperature of 20 °C by adding the correction factor of 0.00023 °C. The % moisture content values corresponding to the corrected refractive index values were calculated using the Wedmore table.

2.2.2. Electrical Conductivity (EC)

Electrical conductivity (EC) of a honey solution (20 g dry matter of honey was dissolved in 100 mL of CO2–free-deionized water) was measured at 20 °C in a Crison Basic 30 conductometer (Crison Instruments S.A., Alella, Spain). The results were expressed as mS/cm.

2.2.3. Acidity

Acidity was determined by potentiometric titration. Honey samples were homogenized in a water bath before analysis. About 10 g of honey was dissolved in 75 mL of CO2-free distilled water. The solution was titrated with 0.05 M NaOH to achieve pH 8.30. The results were expressed as meq/kg. The pH measurements were performed potentiometrically at 20 °C using a pH-meter CP-551 (Elmetron, Poland) in a 10% (w/v) solution of honey prepared with CO2–free distilled water.

2.2.4. Hydroxymethylfurfural (HMF) Content

Hydroxymethylfurfural (HMF) content in honey samples was determined with the use of UV-Vis spectrophotometer (Shimadzu UV mini-1240) by absorbance measured at 550 nm wavelength. Before spectrophotometric analysis, each honey sample (10 g) was diluted in 50 mL of distilled water. An amount of 2 mL of the honey samples solution was transferred to four glass tubes and 5 mL of p-toluidine solution was added to each sample. Afterwards, 1 mL of barbituric acid solution was added to the honey samples and 1 mL of water to the blank sample, and all samples were gently shaken for 1–2 min. The absorbance measurement of samples was performed in relation to the blank sample as soon as the color intensity has reached a maximum (3–4 min after addition of the barbituric acid solution). HMF content in the honey sample was expressed in mg/kg of honey, and was calculated as:
HMF = 192 × ABS × 10 weight   of   th   honey   in   grams  
where ABS is the absorbance of the sample, 192 is the extinction coefficient, and 10 is the factor for dilution.

2.2.5. Color Analysis

The color intensity of honey was measured according to the Pfund classifier [9]. Honey samples were heated at 50 °C to dissolve sugar crystals, and the color intensity was measured with the use of spectrophotometer (Shimadzu UV mini-1240) at 635 nm wavelength in 50% honey solution (w/v). The honeys were classified according to the Pfund scale after conversion of the absorbance values according to formula:
mm Pfund = −38.70 + 371.39 × ABS.

2.2.6. Sugar Analysis

Sugars (fructose, glucose) analysis was performed by high-performance liquid chromatography equipped with a refractive index (RI) detector (Schimadzu, Kyoto, Japan). The separation was performed using Rezex RHM-Monosaccharyde H+ column (7.8 mm × 300 mm). The column was kept at 80 °C throughout the analysis. The mobile phase was redistilled water in flow rate of 0.6 mL/min. Identification of sugars was performed by comparison of retention times of obtained peaks with retention times of their chromatographic standards. Triplicate injections were performed and average peak areas were used for the peak quantification. Fructose and glucose were quantified with external standards and their calibration curves. Concentration of glucose standards ranged 0.4–5.0 mg, fructose 0.3–3.9 mg.

2.2.7. Total Phenolic Content (TPC)

TPC was measured in honey (1.0 g diluted to 10 mL with distilled water) using the Folin-Ciocalteu assay [10]. Samples (0.5 mL) were mixed with 2.5 mL 0.2 N Folin-Ciocalteu reagent. Sodium carbonate (2 mL, 75 g/l) was added after 5 min. Then, samples were incubated for 2 h in the dark at room temperature. Absorbance was measured at 760 nm against a blank of water using a spectrophotometer (Shimadzu UV mini-1240). Gallic acid standard (Sigma, St. Louis, MI, USA) was used to construct the calibration curve (0–300 mg/L) using five concentration levels. The total phenolic content of honey samples was expressed as milligrams of gallic acid equivalents (GAE) per 100 g of honey.

2.2.8. Determination of Antioxidant Activity

The antioxidant activity of honey was evaluated by the method of inhibiting the radical ABTS+ (2,2′-azinobis-[3-ethylbenzothiazol-6-sulfonic acid]. For ABTS determination a modified method of Wilczynska [11] was used. The ABTS+ was synthesized by the reaction of a 7 mM ABTS solution with a 2.4 mM potassium persulfate solution. The mixture was kept in the dark for 24 h. Afterward, the ABTS+ solution was diluted with methanol until the absorbance 0.7 was achieved at 734 nm (Shimadzu UV mini-1240). 2 g of honey sample was dissolved in 10 mL of distilled water, mixed, and filtered by a paper filter. Then 0.1 mL of the sample solution was mixed with 6 mL of ABTS+ solution, well mixed and after 15 min absorbance was measured at a wavelength of 734 nm. The control samples were prepared with distilled water in place of the honey. The scavenging capability of the ABTS+ radical (%AS) was calculated using the following equation:
% AS = 100 ABS   control ABS   sample ABS   control

2.2.9. GC-MS Determination of Volatile Compounds in Honeys

5 g of honey were weighed into a dearomatized jar, and 2 g of sodium chloride, 2 mL of distilled water, and 1 μL 1,2-dichlorobenzene solution (0.01% solution (v/v) in methanol) were added. The sample was incubated at 50 °C for 10 min. The SPME fiber (stationary phase in the form of CAR/PDMS/DVB) was transferred into the jar with honey and absorption of volatiles was performed for 15 min at 50 °C. Desorption of the aromas from the SPME fiber was carried out for 2 min in the injector of gas chromatograph coupled with a Shimadzu GC-MS mass spectrometer (GCMS-QP2010S). Chromatographic analysis of the extracted volatile compounds was carried out with the use of a capillary column (Restek with dimensions: 30 m × 0.25 mm × 0.25 µm) with cross bond stationary phase polyethylene. Helium was used as the carrier gas, the total flow of the column was 1.03 mL/min. The initial temperature of the temperature program oven for the first two minutes was 40 °C and increased by 4 °C/min until it reached 220 °C, and held for 5 min. The temperature of the GC-MS connector was 230 °C. The temperature of the ion source was 240 °C and the ionization energy with the electron beam was 70 eV. The mass spectra of volatile compounds were collected in the total ion flow mode (the so-called TIC- total ion monitoring) in the range of 40 to 500 m/z. The addition of an internal standard 1,2-dichlorobenzene was used for the semi-quantitative analysis of volatile compounds. Qualitative analysis of volatile compounds was performed based on the available manufacturer’s libraries (NIST 47, NIST 147, and Wiley 175). Each honey sample was analyzed in duplicate.

2.3. Statistical Analysis

The obtained results were statistically analyzed using STATISTICA 13.3 software by one way analysis of variance ANOVA. To determine the significance of the differences between the mean values, for example volatiles, in particular samples, Tukey’s test was used with the significance level of p = 0.05.

3. Results

3.1. Physicochemical and Color Analysis

Results of physicochemical analysis of honey are shown in Table 1. The moisture content is one of the most important parameters of honey and ranges between 15.35–18.15%. The highest moisture levels were determined in non-traditional buckwheat honey (H5) and the lowest in non-traditional honeydew honey from coniferous honeydew (H6) and traditional lime honey (H2) (Table 1).
The electrical conductivity values of analyzed honey samples were between 0.17 mS/cm to 0.89 mS/cm. Average value was below the maximum limit of 0.8 mS/cm set by Council Directive 2001/110/EC [12]. The lowest electrical conductivity was characteristic for the honey H1 sample (traditional rape honey), and the highest value of this parameter was investigated in the honey sample H6 (non-traditional honeydew honey from coniferous honeydew). Table 1 shows that only one honey sample did not meet the required standard values and the EC was higher than 0.8 mS/cm, it could be due to the high ash content in this kind of honeydew honey.
The acidity values for individual honeys are also presented in Table 1. The honey with the lowest acidity was non-traditional lime honey (H4) with the mean value of 8.3 meq/kg, while non-traditional honeydew honey from coniferous honeydew (H6) and traditional meadow and marsh honeydew honey (H3) were characterized by the highest mean value (31.3 meq/kg and 30.7 meq/kg, respectively).
The pH values of the analyzed honey samples were acidic and varied between 2.95 and 4.49. The highest levels of pH were observed in traditional lime honey (H2) while traditional meadow and marsh honey (H3) had the lowest level of pH (Table 1). A significant difference in pH was affected by the botanical origin of honey.
Content of hydroxymethylfurfural was investigated in honey samples in order to determine their quality. The data in Table 1 shows that non-traditional lime honey (H4) was characterized by the highest HMF content (12.7 mg/kg), while traditional lime honey (H2) contained the lowest concentration of HMF (0.4 mg/kg).
Color values for each honey sample are presented in Pfund values (mm) and Pfund scale [Table 1]. In order to classify honey colors, the scale starts from water white, extra white, white, extra light amber, light amber, amber and end up on dark amber, where the water white is the brightest, and dark amber is the darkest color. In the current study, the color of honey varied from water white to amber, that means that the intensity of color values ranged from 5.2 to 105.4 mm. The sample H5 (non-traditional buckwheat honey) was darker in comparison to samples H1 (traditional rape honey) and H4 (non-traditional lime honey), which were the brightest among all the analyzed honey samples.

3.2. Sugar Content

The monosaccharides glucose and fructose are the major constituents of honey. The content of reducing sugars in analyzed honey is presented in Table 2. The mean value of glucose ranged from 26.26% (H4, non-traditional lime honey) to 37.06% (H2, traditional lime honey), and significant differences (p ≤ 0.05) between values of H4 and H2 were reported. The fructose content in honey samples ranged from 30.18% (H6, non-traditional honeydew honey) to 37.50% (H5, non-traditional buckwheat honey). The total glucose and fructose content were from 63.05% in non-traditional lime honey (H4) to 73.93% in traditional lime honey (H2). Significant differences between values of fructose, and the total glucose and fructose, were not noticed between investigated honey samples.
The fructose to glucose ratio ranged from 0.91 (H6: non-traditional honeydew honey from coniferous honeydew) to 1.41 (H4: non-traditional lime honey). Statistically, a significant difference was observed in the fructose to glucose ratio between investigated honey samples, and the main difference was reported between samples H4 and H6. The glucose to water ratio ranged from 1.48 (H4: non-traditional lime honey) to 2.41 (H2: traditional lime honey). There was a statistically significant difference (p ≤ 0.05) between honey samples, and the values for samples H2, H3, and H6 were significantly different from values of H4 and H5.

3.3. Antioxidant Properties of Honey

The antioxidant activity and total content of phenolic compounds in analyzed samples varied among the honey types. The average values of the above mentioned parameters are given in Table 3. Honey’s total phenolic content ranged from 13.7 mg GAE/100 g in non-traditional lime honey and 51.2 mg GAE/100 g in non-traditional buckwheat honey. Moreover, statistical data show that honey samples were divided into four separate groups. The first group consisted of H1 (traditional rape honey) and H4 (non-traditional lime honey) with the lowest phenolic content, 14.3 and 13.7 mg GAE/100 g, respectively. The next group consisted of traditional meadow and marsh honey and traditional lime honey (34.2 and 36.2 mg GAE/100 g). In the third group, honeydew honey from coniferous honeydew (30.9 mg GAE/100 g) and also traditional lime honey (36.2 mg GAE/100 g) were reported. The fourth group consisted of only one honey sample, and it non-traditional buckwheat honey, containing the highest level of phenolic compounds-51.2 mg GAE/100 g.
ABTS activity was quantified in terms of percentage inhibition of the ABTS+ radical cation by antioxidants in each of the honey samples. There was a significant variation in the percentage inhibition of the honey samples. H6 (non-traditional honeydew honey from coniferous honeydew), H2 (traditional lime honey), and H3 (traditional meadow and march honey) were the most efficient scavengers of the radical (60.7%, 54.9%, and 52.5% inhibition, respectively) while H1 (traditional rape honey) and H4 (non-traditional lime honey) were characterized by the lowest scavenger inhibition effect (15.1% and 15.2% inhibition, respectively) as presented in Table 3. It should be highlighted that traditional honey samples were recognized as effective scavengers of the radicals, and contained high amounts of phenolic compounds, as well as for honeydew honey from coniferous honeydew and buckwheat honey–non-traditional honey samples.

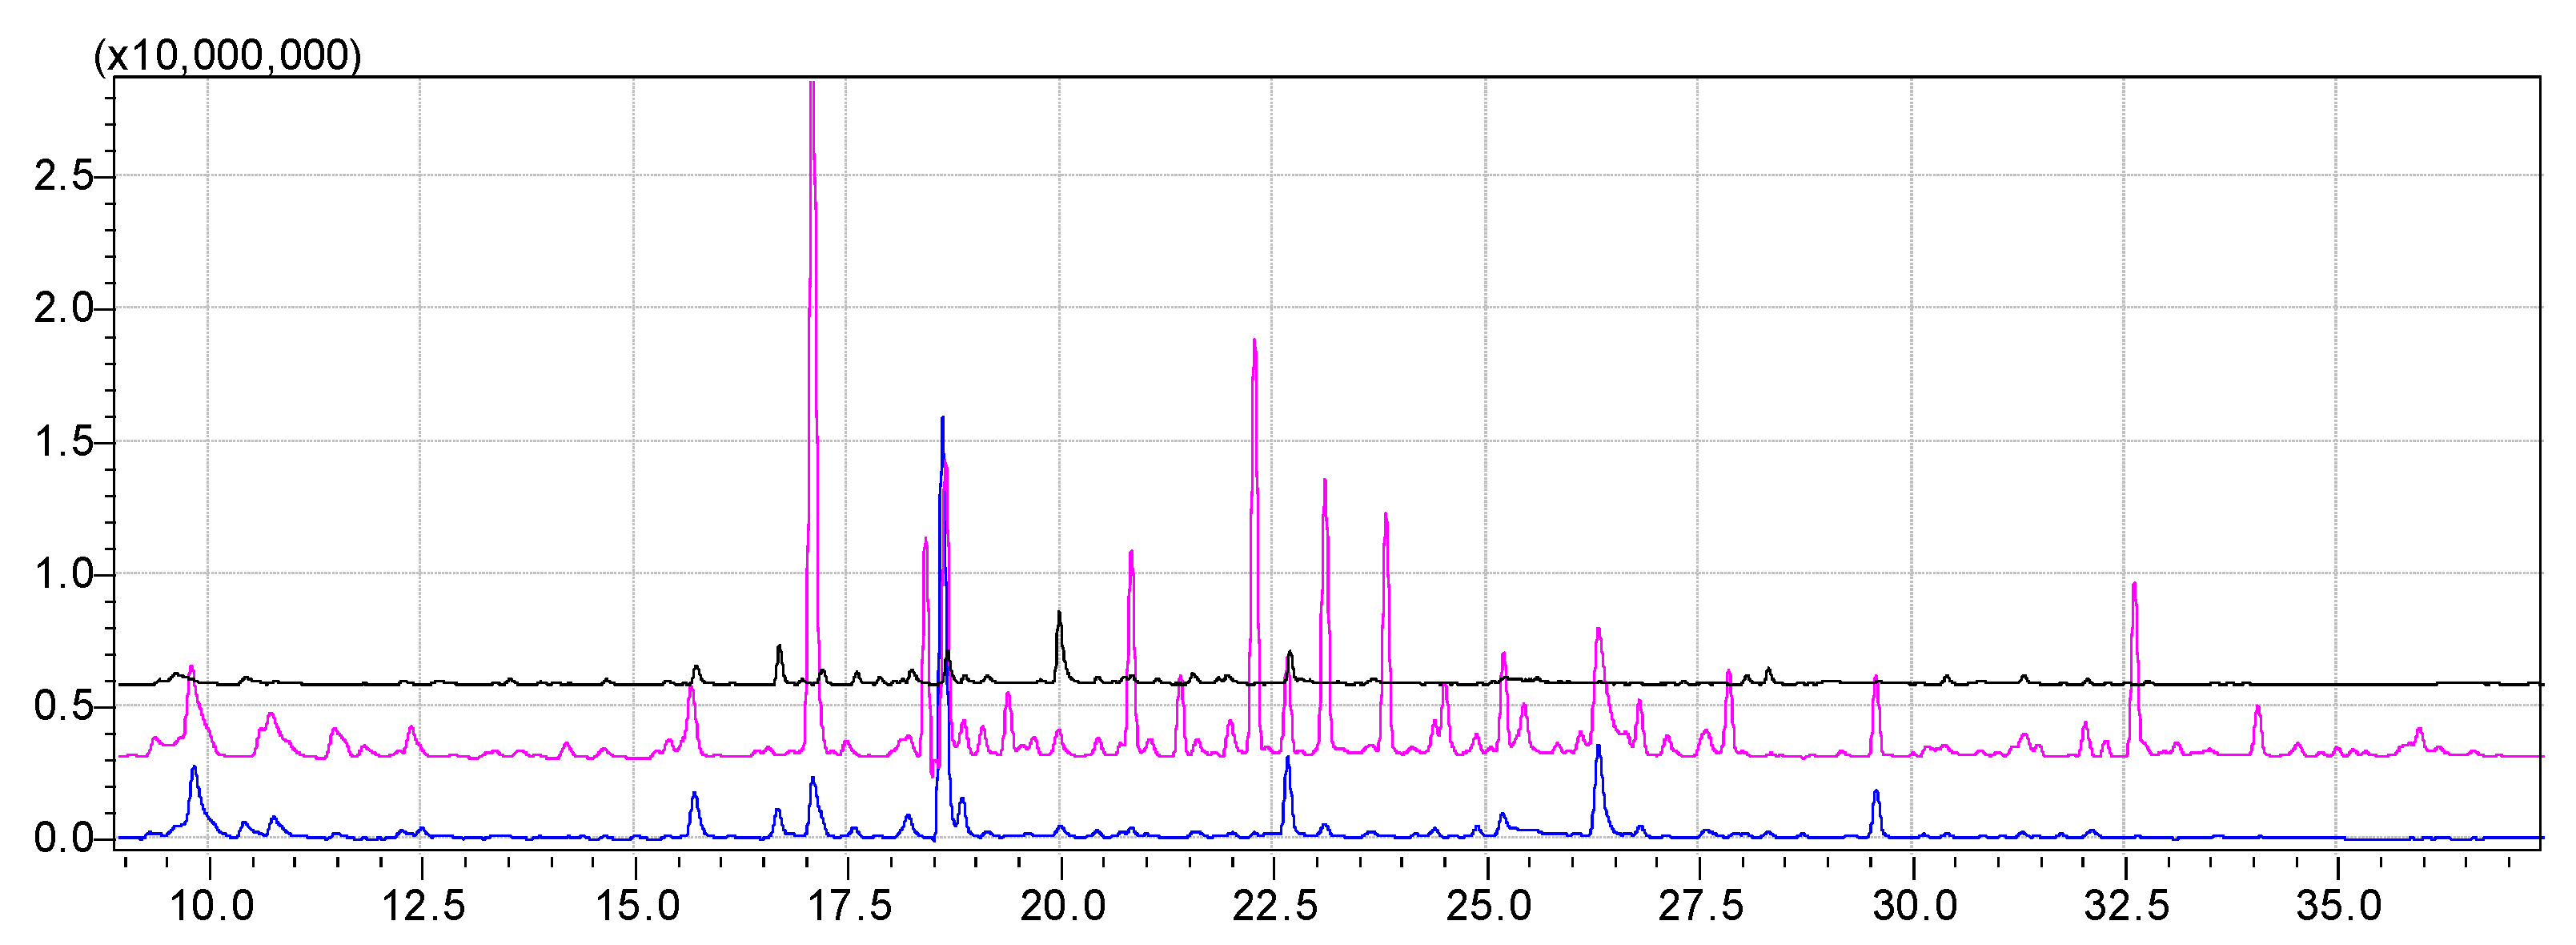
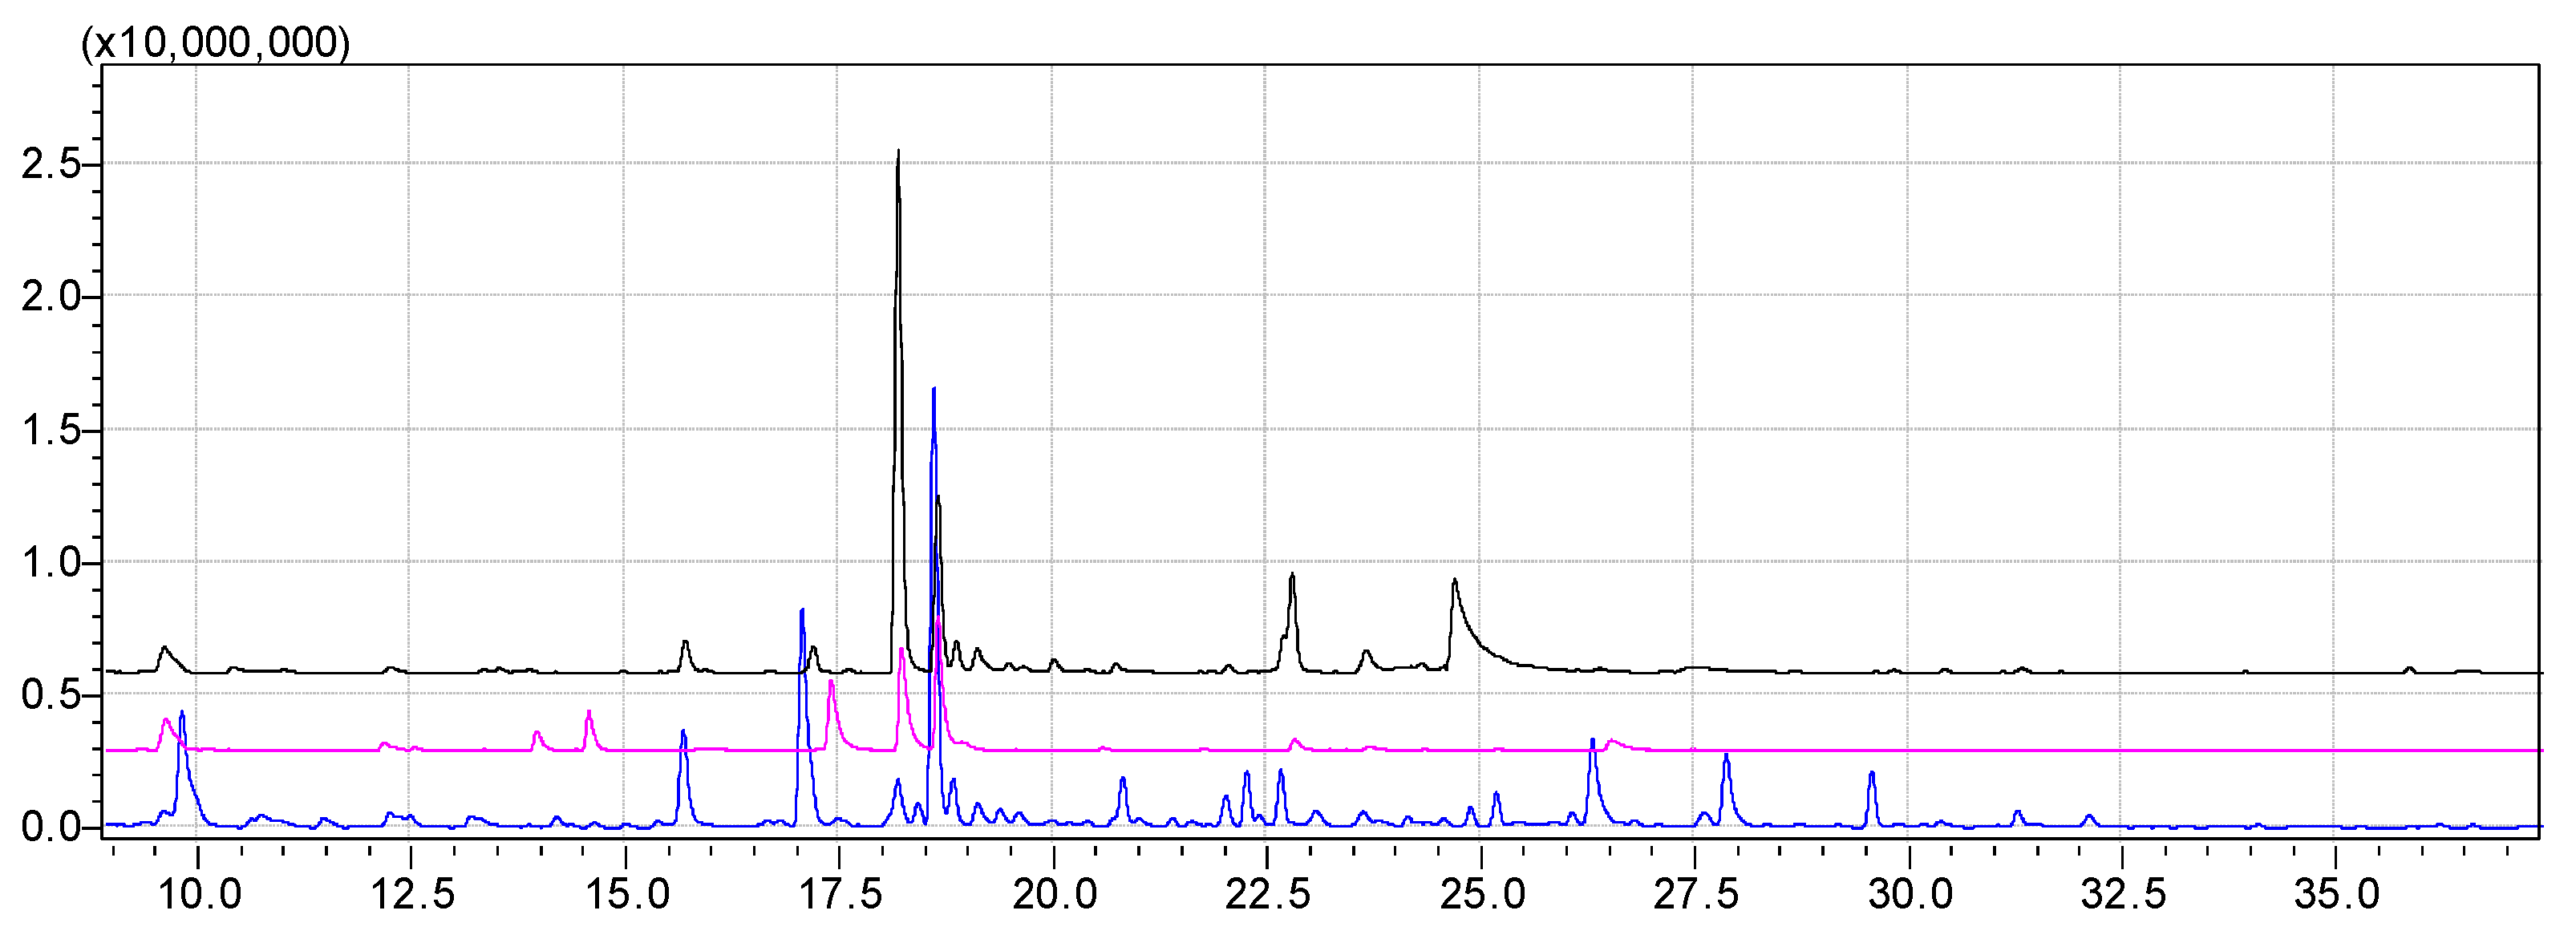
3.4. Volatile Compounds Concentration

Based on chromatograms of volatile compounds obtained for each honey sample, different counts of aroma compounds were identified (characterized by the largest area under their peaks). The highest count of identified volatiles was reported in honey H5 with 67 compounds (non-traditional buckwheat honey), product H6 with 64 compounds (non-traditional honeydew honey from coniferous honeydew), and in product H3 with 61 different volatiles (traditional meadow and marsh honey). The lowest amount of the identified compounds was found in product H4, with 40 compounds (non-traditional lime honey) (Table 4). On the other hand, the highest content of volatile compounds was established in product H2 (lime honey registered as traditional by Polish Ministry of Agriculture and Rural Development) (Figure 1), which was accounted for by 199.62 ± 6.40 µg/kg, and also in product H3 (meadow and marsh honey registered as traditional by Polish Ministry of Agriculture and Rural Development) (Figure 1), which had 170.58 ± 2.28 µg/kg. Non-traditional buckwheat honey (product H5) (Figure 2) was also characterized by a high content of compounds in the aroma; 195.17 ± 2.90 µg/kg. Non-traditional lime honey (product H4) (Figure 2) contained 73.20 ± 1.60 µg of aroma compounds accounted for in 1 kg of honey. The lowest content of volatiles per 1 kg of honey was reported in repressed honey (traditional product H1), which had 39.52 ± 3.04 µg/kg. These observations show that the most intense aroma had two traditional kinds of honey: lime honey and meadow and marsh honey, and traditional rapeseed honey was one of the products that had the least intense aroma, which can be connected to the solid-state of the product and the lowest ability to release volatile compounds from the food matrix. Other honeys—for example, lime, buckwheat, and honeydew honey from coniferous honeydew—which are called non-traditional products, because they are not registered as traditional Polish honey, were characterized by more varied aromas than traditional honey (Figure 2). For instance, traditional lime honey contained about 200 µg of volatiles per 1 kg, and non-traditional lime honey contained about 70 µg/kg, and the total content of volatile compounds was almost three-fold higher than traditional lime honey. Non-traditional buckwheat honey is known as a product with a strong taste and aroma, and in our study, this was confirmed, because about 200 µg of volatile compounds were found in 1 kg of honey, and it was the highest concentration of volatiles reported in analyzed honey samples.
Volatile compounds, which were identified in all analyzed honey samples, belonged to the following chemical groups: acids, alcohols, aldehydes, esters, hydrocarbons, ketones, or terpenes. In rape honey, meadow and marsh honey, and buckwheat honey, the most numerous group of compounds in their aroma were: ketones (19–24 compounds), and alcohols (14–16 compounds). In other products (lime honey and honeydew honey from coniferous honeydew), the most numerous group of compounds in the total profile of volatile compounds were alcohols (12–19 compounds).
It can be noted that, in traditional honey, the most abundant groups of compounds were mainly ketones, which represented 31.5% of the volatile total content in product H1, 25.8% in product H2, and 19.0% in product H3. Moreover, aldehydes concentration was high, because it accounted for 28.8% of all volatile concentrations in product H1, and 19.6% in product H3. In product H2 (traditional lime honey), hydrocarbons were also found in high concentration and represented 30.6% of all content of volatiles found in this product.
In products that were not registered as traditional products, one of the most significant groups of chemical compounds was aldehydes, which represented 27.8% of all volatile content in product H4 (non-traditional lime honey), and 45.4% in product H5. In the above-mentioned products, hydrocarbons, and acids were also found in high concentrations, which represented 25.5% and 20.0% of all volatiles, respectively. In the aroma profile of honeydew honey from coniferous honeydew, the most abundant groups of chemical compounds were alcohols and ester and their concentration represented 36.4% and 24.0% of all volatiles found in this honey.

4. Discussion

4.1. Physicochemical Analysis and Detemination of Color

The moisture content of honey is influenced by the climatic condition, degree of maturity and extraction and storage conditions [3]. Lower moisture content can lead to the development of caramelization and the production of Maillard reaction products during honey storage at room temperature; on the other hand, higher water content might cause honey fermentation and formation of acetic acid [13]. Viscosity, solubility, crystallization, taste and color are parameters that depend on the water content of the honey [14]. The moisture content of honey samples analyzed were all within the standard limit required by the European Union’s Council Directive 2001/110/EC relating to honey whereby the moisture content, in general, should not be more than 20% [12]. The obtained results are close to those previously reported by Popek et al. [15].
Electrical conductivity is a property of electron mobility and is largely correlated with honey mineral salt, organic acids, and protein levels [16]. EC is a good criterion of the botanical origin of the honey and it is determined in routine honey control instead of the ash content [3,17]. The higher ash and acid content, the higher the resulting conductivity [18,19]. Usually, the electrical conductivity of rape honey is rather low [20,21], which means that rape honey contains a lower amount of mineral salts [22]. Electrical conductivity is a significant discriminating parameter for honeydew honey from floral honey, which has a greater conductivity than floral honey [23,24]. Similar values of EC have been reported by do Nascimento et al. [18], Ruoff et al. [25], and Gela et al. [26].
Honey acidity is an indicator of the deterioration of honey. This parameter is due to the presence of organic acids in equilibrium with intermolecular esters, lactone, and to inorganic ions, such as phosphate, sulfate, and chloride; in addition, higher values of acidity may indicate that sugars are transformed into organic acids [3]. In terms of acidity, the Council Directive 2001/110/EC established a level of 40 meq/kg for poly floral honey and 50 meq/kg for honeydew honey, respectively. The acidity observed in the current study for different honey samples was acceptable (below 50 meq/kg), indicating the absence of undesirable fermentation. The results obtained for acidity were in agreement with data reported from other geographical locations [16,25]. Some authors suggest that acidity can be used to differentiate between nectar honey and honeydew honey, as confirmed in this study [24]. Variation in the acidity level in the sampled honey may be due to variation in the harvest season, geographical origin, floral sources, acids produced by bacteria, and the mineral present [27].
The pH of honey influences its texture, stability, and shelf life [18]. The pH is an indicator of possible microbial growth because pH between 7.2 and 7.4 is the optimum for most microorganisms. Therefore, pH values ranging from 3.2 to 4.5 are considered acceptable for honey samples [3]. pH value also is an important variable in the control of spoilage in foods. The low pH content of the honey samples that were investigated in our study, is very desirable as it leads to inhibition of the growth of microorganisms [28].
All honey samples analyzed in this study were characterized by HMF concentration amounts within the parameters allowed according to the European regulations of quality [12] for honey samples-level below 40 mg/kg. HMF content is widely recognized as a parameter of honey freshness as it is absent in fresh honey and tends to increase during processing [16]. Although HMF occurs naturally in honey, the samples analyzed in the present study contained low levels of it, which may be due to the freshness of the honey. Similarly, low content of HMF in Polish honey samples was obtained by Popek et al. [15].
The color of honey is a sensorial parameter that is important for consumers. The honey’s color is related to its flavor. Light colored honey is mild, whereas darker types have stronger flavors. It is one of the parameters mostly taken into consideration by consumers in terms of quality appreciation and acceptability [3]. The international markets demand specific honey colors, for example, Europe prefers darker honey with potent flavors while consumers in North America prefer light colored honey with a less intense flavor [29]. The honey color is mostly reliant on nectar sources and pollen contents which contain various color pigments, i.e., phenolic acids, anthocyanins, chlorophylls, carotenoids, and flavonoids, and mineral constituents. The natural color of honey can also be affected by various factors such as climate, storage conditions, and exposure to high temperatures and light [13,19,23].

4.2. Sugar Content

The most abundant sugars in honey are glucose and fructose, for which no individual limits have been established for their individual amounts; their total content (fructose + glucose) have values corresponding to the limits required of the European regulation for honey (not less than 60 g/100 g for blossom honey and not less than 45 g/100 g for honeydew honey) [12]. The difference between sources of honey in terms of the reducing sugar content might be due to variation in the plant sources from which the honey was produced [28]. The results of this study are in agreement with those obtained by Popek et al. [15], Habib et al. [16], and Ruoff et al. [25]. The balance of fructose and glucose is the principal cause that leads to the process of honey crystallization [28]. The percentage of each sugar regulates whether it crystallizes rapidly or slowly [28]. Our study also confirms the observation that the sugar ratio has an impact on the crystallization of honey. Crystallization time depends strongly on the fructose to glucose ratio, since glucose is less soluble in water than fructose. When the fructose to glucose ratio is 1.14 or less, the fast growth of honey crystal takes place. Ratios greater than 1.3 slow growth down but proportions higher than 1.58 impair it [18]. In this study, the fructose to glucose ratio was 1.04 (H1), 1.00 (H2), 1.03 (H3), and 0.91 (H6), suggesting a fast crystallizing nature of these honeys. However, the fructose to glucose ratio in honey samples H4 and H5 is 1.41 and 1.34, respectively, suggesting a slow crystallizing in those samples. The glucose to water ratio is considered as an appropriate indicator than the fructose to glucose ratio for the prediction of honey crystallization. According to Amir et al. [30], the least ability of honey crystallization is obtained when the glucose to water ratio is less than 1.0, while it crystallizes faster when that ratio is more than 2.0. The results indicate that traditional lime honey, traditional meadow and marsh honey, and non-traditional honeydew honey from coniferous honeydew were characterized by a faster ability to crystallize, which confirms the results obtained for the fructose to glucose ratio.

4.3. Antioxidant Properties

The results of the Folin-Ciocalteu reaction in honey should be interpreted as a quantitative estimation of total phenols because the reducing sugars of honey can also react with this reagent. Nevertheless, since the sugar component gives an identical contribution for different samples, the observed differences in the results of the Folin-Ciocalteu assay are the reflection of differences in the phenolics content [31]. The observed differences in the total phenols content are most likely related to different botanical origins of the investigated honey, as well as to differences there are in the geographic origin and different harvest times. The values of the total phenols content obtained in these studies are comparable with the results obtained by other researchers [11,19,23,31].
In ABTS+ reaction system, the radical scavenging ability of honey was much lower in the pale honey. The antioxidant activity with ABTS+ increased in the following order: H1 < H4 < H5 < H3 < H2 < H6. The observed relationship is similar to the results of Wilczynska [11].

4.4. Volatile Compounds Profile

The traditional rape honey aroma profile consisted mainly of eight volatiles, for which the percentage was above 2%. The following compounds were found in the aroma of the product H1: benzaldehyde, which represented 15.2% of the total content of volatiles, 2-methyl-butanal (6.8%), acetone (6.7%), hotrienol (5.1%), nonanal (4.1%), furfural (3.6%), 1-(2,4-dimethyl-3-furanyl)ethenone (3.0%), linalool oxide (2.6%). Radovic et al. [32] also reported the presence of the above-mentioned benzaldehyde, acetone, 2-methyl-butanal, nonanal, and also benzyl alcohol in rape honey aroma derived from Germany, France, and Denmark. Other authors have confirmed that the most abundant volatiles in the rape honey aroma are the following: furfural, benzyl aldehyde, 2-methylbutanol, 3-methylbutanol, p-cymen-8-ol, benzoic acid, benzyl alcohol, dime-thyl disulphide, 1-nonanol, butyrolactone (dihydro-2(3h)-furanone) [7].
Traditional meadow and marsh honey (product H3) was characterized by an aroma profile abundant in grandlure IV (10.8%), 1,4-butanediol diacetate (9.5%), ho-trienol (7.9%), dehydro-p-cymene (7.9%), p-cymen-8-ol (4.4%), furfural (3.7%). Grandlure IV is known as the pheromone of strawberry blossom weevil [33]. One of the volatiles found in aromatic vinegar is 1,4-butanediol diacetate, and its odor description is recognized as a smoke [34]. The other above-mentioned compounds were also found in the honey aroma of rape, lime, and honeydew honey from coniferous honeydew [7].
Lime honey registered as traditional products (H2) was characterized by the following substances which represented above 3% of the total concentration of all compounds in its aroma: dehydro-p-cymene (16.7%), 3,6-dimethyleneoctahydro-1-benzofuran (11.0%), menthofuran (10.1%), tert-amylbenzne (5.9%), terpinen-4-ol (5.1%), 2,4-decadienal (4.2%), and benzene, (1-methyl-2-propenyl-3-ol) (3.1%). Non-traditional lime honey (product H4) contained similar volatiles in its aroma profile. The most abundant component of the aroma profile was also dehy-dro-p-cymene (22.1%), grandlure IV (17.0%), furfural (5.0%), 1,4-butanediol diacetate (4.8%), 2-caren-10-al (3.6%), terpinen-4-ol (2.6%), 3-methyl-1-butanol (2.5%). In lime honeys, the samples’ characteristic aroma compounds were found, which were described by Machado et al. [6] as volatile markers, for example rose oxides, carvacrol, 8-p-menthen-1,2-diol, α-terpene. Guyot et al. [35] reported that the highest content of volatile compounds in the aroma of lime honey had furfural, benzyl alcohol, benzene ethanol, and 8-p-menthene-1,2-diol, of which quantities were higher than 1 ppb. In our study, only in the aroma of traditional lime honey, the quantity of the above-mentioned compounds was higher than 1 ppb, because the concentration of 8-p-menthene-1,2-diol was 2.92 ± 0.19 µg/kg, benzene ethanol 2.50 ± 0.05 µg/kg, furfural 1.43 ± 0.15 µg/kg, and benzyl alcohol 1.04 ± 0.04 µg/kg. In non-traditional lime honey, the content of furfural and benzene ethanol were higher than 1 ppb and accounted for 3.34 ± 0.38 µg/kg, and 1.32 ± 0.29 µg/kg, and for other compounds the content was lower than 1 ppb (benzyl alcohol 0.22 ± 0.03 µg/kg, 8-p-menthene-1,2-diol 0.05 ± 0.01 µg/kg). This shows that the aroma of traditional honey was more intense than non-traditional honey.
The aroma profile of the buckwheat honey (non-traditional product H5) was characterized by a high percentage of furfural (30.6%), isovaleric acid (19.4%), ethanol (10.3%), delta-valerolactone (8.0%), isovaleraldehyde (7.2%), 2-methyl-butanoic acid (3.1%), phenylacetaldehyde (2.4%), and nonanal (2.3%). Wolski et al. [36] also described the profile of buckwheat honey derived from Poland and reported that furfural percentage was 4.85%, isovaleric acid 24.45%, ethanol 0.02%, delta-valerolactone 0.6%, isova-leraldehyde 0.68%, 2-methyl-butanoic acid 13.20% and nonanal 1.78%. Wolski et al. [36] also found that in this aroma there was also a high amount of benzaldehyde (10.45%), 2(3H)-furanone, dihydro-4-methyl- (10.29%). In the investigated buckwheat honey samples, only one of the above-mentioned substances was identified, and its percentage accounted for 1.76%. Differences between the buckwheat honey aromas can be caused by the different times of storage, and higher amounts of ethanol in non-traditional product H5 can be linked to the long time storage, and the ethanol concentration was higher due to the fermentation process.
The aroma of honeydew honey from coniferous honeydew contained mainly valeric acid, 2-hydroxy-4-methyl-, methyl ester (22.7%), 1-butoxy-2-propanol (16.9%), and iso amyl alcohol (11.1%). Other compounds, of which percentages were lower than 10% were, for example: 2-methyl-3-hexanol (7.7%), 6-oxa-bicyclo[3.1.0]hexan-3-ol (7.1%), ethyl 1-hexyl-4-hydroxy-2-oxo-1,2-dihydro-3-quinolinecarboxylate (5.7%), acetoin (4.0%), (2-ethyl-1-methyl-1-butenyl)cyclohexane (3.9%), 1-piperazinecarboxylic acid (3.9%), hotrienol (2.4%), and ethanol (1.7%). Pita-Calvo and Vazquez [37] published the characteristic of honeydew and blossom honey, they stated that the most typical volatile markers of honeydew honey are acetoin, 2,3-butanediol, and 1-hydroxy-2-propanone. The first two substances were identified in the analyzed honeydew honey from coniferous honeydew, and their content was 4.24 ± 0.20 µg/kg, and 0.74 ± 0.10 µg/kg, respectively.

5. Conclusions

Our study results indicate that each of the analyzed honey samples can be characterized by the presence of volatile markers (e.g., 8-p-menthene-1,2-diol in lime honeys, and grandlure IV for meadow and marsh honey). Moreover, such compounds seem to be useful in the assessment of the origin of the honey samples taking into account, that and also the composition of the volatile fraction may suggest whether the honey has been registered as traditional, as it was described in the case of lime honey samples. Additionally, our investigations have proven that traditional kinds of honey contained high amounts of phenolic compounds (lime and meadow and marsh honey), except for non-traditional buckwheat honey. At the same time, those traditional kinds of honey were reported to be effective scavengers of free radicals, except for non-traditional honeydew honey from coniferous honeydew. It is worth mentioning that these kinds of honey should be recommended to be a part of the average diet as a food product, thanks to their antioxidant, antibacterial, and anti-inflammatory properties.
Finally, our study shows that not only physicochemical properties, but the mainly volatile composition of honey samples, play an important role in assessing the origin of honey. The volatile profiles obtained in our study can be useful in the detection procedure of adulteration of honey.

Author Contributions

Conceptualization, D.D.; methodology, D.D., E.M., D.S.; software, D.D.; validation D.D., D.S.; formal analysis, D.D., investigation, D.D., D.S., K.K.; writing—original draft preparation, D.D., E.M.; writing, D.D., E.M.; visualization, D.D., E.M.; supervision, D.D. All authors have read and agreed to the published version of the manuscript.

Funding

This research received no external funding.

Institutional Review Board Statement

Not applicable.

Informed Consent Statement

Not applicable.

Data Availability Statement

Data supporting reported results are restored at Warsaw University of Life Sciences.

Conflicts of Interest

The authors declare no conflict of interest.

References

  1. European Union. Regulation (EU) No 1169/2011 of the European Parliament and of the Council of 25 October 2011 on the provision of food information to consumers, amending Regulations (EC) No 1924/2006 and (EC) No 1925/2006 of the European Parliament and of the Council, and repealing Commission Directive 87/250/EEC, Council Directive 90/496/EEC, Commission Directive 1999/10/EC, Directive 2000/13/EC of the European Parliament and of the Council, Commission Directives 2002/67/EC and 2008/5/EC and Commission Regulation (EC) No 608/2004. Off. J. Eur. Communities 2011, L 304, 18–63. [Google Scholar]
  2. Republic of Poland. Amending Regulation on Detailed Re-Quirements for the Commercial Quality of Honey. In Regulation of the Minister of Agriculture and Rural Development of 29 May 2015. Polish Journal of Laws 2015, pos. 850; Ministry of Agriculture and Rural Development: Warsaw, Poland, 2015. [Google Scholar]
  3. Da Silva, P.M.; Gauche, C.; Gonzaga, L.V.; Costa, A.C.O.; Fett, R. Honey: Chemical composition, stability and authenticity. Food Chem. 2016, 196, 309–323. [Google Scholar] [CrossRef] [PubMed]
  4. Alghamdi, B.A.; Alshumrani, E.S.; Bin Saeed, M.S.; Rawas, G.M.; Alharthi, N.T.; Baeshen, M.N.; Helmi, N.M.; Alam, M.Z.; Suhail, M. Analysis of sugar composition and pesticides using HPLC and GC–MS techniques in honey samples collected from Saudi Arabian markets. Saudi J. Biol. Sci. 2020, 27, 3720–3726. [Google Scholar] [CrossRef] [PubMed]
  5. Liu, J.-R.; Ye, Y.-L.; Lin, T.-Y.; Wang, Y.-W.; Peng, C.-C. Effect of floral sources on the antioxidant, antimicrobial, and anti-inflammatory activities of honeys in Taiwan. Food Chem. 2013, 139, 938–943. [Google Scholar] [CrossRef] [PubMed]
  6. Yap, S.; Chin, N. Identification of distinctive properties of common Malaysian honeys. Mater. Today Proc. 2021, 42, 115–118. [Google Scholar] [CrossRef]
  7. Machado, A.; Miguel, M.G.; Vilas-Boas, M.; Figueiredo, A.C. Honey Volatiles as a Fingerprint for Botanical Origin—A Review on Their Occurrence on Monofloral Honeys. Molecules 2020, 25, 374. [Google Scholar] [CrossRef] [PubMed] [Green Version]
  8. International Honey Commision. Available online: http://www.bee-hexagon.net/en/network.htm (accessed on 10 May 2019).
  9. Ferreira, I.C.; Aires, E.; Barreira, J.C.; Estevinho, L.M. Antioxidant activity of Portuguese honey samples: Different contributions of the entire honey and phenolic extract. Food Chem. 2009, 114, 1438–1443. [Google Scholar] [CrossRef]
  10. Alvarez-Suarez, J.M.; Tulipani, S.; Díaz, D.; Estevez, Y.; Romandini, S.; Giampieri, F.; Damiani, E.; Astolfi, P.; Bompadre, S.; Battino, M. Antioxidant and antimicrobial capacity of several monofloral Cuban honeys and their correlation with color, polyphenol content and other chemical compounds. Food Chem. Toxicol. 2010, 48, 2490–2499. [Google Scholar] [CrossRef] [PubMed]
  11. Wilczyńska, A. Effect of filtration on colour, antioxidant activity and total phenolics of honey. LWT Food Sci. Technol. 2014, 57, 767–774. [Google Scholar] [CrossRef]
  12. European Union. Council Directive 2001/110/EC relating to honey. Off. J. Eur. Communities 2001, 10, 47–52. [Google Scholar]
  13. Sakač, M.B.; Jovanov, P.; Marić, A.; Pezo, L.; Kevrešan, Ž.S.; Novaković, A.R.; Nedeljković, N.M. Physicochemical properties and mineral content of honey samples from Vojvodina (Republic of Serbia). Food Chem. 2019, 276, 15–21. [Google Scholar] [CrossRef]
  14. Escuredo, O.; Míguez, M.; Fernández-González, M.; Seijo, M.C. Nutritional value and antioxidant activity of honeys produced in a European Atlantic area. Food Chem. 2013, 138, 851–856. [Google Scholar] [CrossRef]
  15. Popek, S.; Halagarda, M.; Kursa, K. A new model to identify botanical origin of Polish honeys based on the physicochemical parameters and chemometric analysis. LWT Food Sci. Technol. 2017, 77, 482–487. [Google Scholar] [CrossRef]
  16. Habib, H.M.; Al Meqbali, F.T.; Kamal, H.; Souka, U.D.; Ibrahim, W. Physicochemical and biochemical properties of honeys from arid regions. Food Chem. 2014, 153, 35–43. [Google Scholar] [CrossRef]
  17. El Sohaimy, S.A.; Masry, S.H.D.; Shehata, M.G. Physicochemical characteristics of honey from different origins. Ann. Agric. Sci. 2015, 60, 279–287. [Google Scholar] [CrossRef] [Green Version]
  18. Do Nascimento, K.S.; Sattler, J.A.G.; Macedo, L.F.L.; González, C.V.S.; de Melo, I.L.P.; da Silva Araújo, E.; Granato, D.; Sattler, A.; de Almeida-Muradian, L.B. Phenolic compounds, antioxidant capacity and physicochemical properties of Brazilian Apis mellifera honeys. LWT Food Sci. Technol. 2018, 91, 85–94. [Google Scholar] [CrossRef]
  19. Kavanagh, S.; Gunnoo, J.; Passos, T.M.; Stout, J.C.; White, B. Physicochemical properties and phenolic content of honey from different floral origins and from rural versus urban landscapes. Food Chem. 2019, 272, 66–75. [Google Scholar] [CrossRef]
  20. Piazza, M.G.; Oddo, L.P. Bibliographical review of the main European unifloral honeys. Apidologie 2004, 35, 94. [Google Scholar] [CrossRef] [Green Version]
  21. Devillers, J.; Morlot, M.; Pham-Delègue, M.; Doré, J. Classification of monofloral honeys based on their quality control data. Food Chem. 2004, 86, 305–312. [Google Scholar] [CrossRef]
  22. Kaškonienė, V.; Venskutonis, P.; Čeksterytė, V. Carbohydrate composition and electrical conductivity of different origin honeys from Lithuania. LWT Food Sci. Technol. 2010, 43, 801–807. [Google Scholar] [CrossRef]
  23. Can, Z.; Yiladiz, O.; Sahin, H.; Turumtay, E.A.; Silici, S.; Koayli, S. An investigation of Turkich honeys: Their physico-chemical properties, antioxidant capacities and phenolic profiles. Food Chem. 2015, 180, 133–141. [Google Scholar] [CrossRef]
  24. Oroian, M.; Rapciuc, S. Honey authentication based on physicochemical parameters and phenolic compounds. Comput. Electron. Agric. 2017, 138, 148–156. [Google Scholar] [CrossRef]
  25. Ruoff, K.; Luginbühl, W.; Kilchenmann, V.; Bosset, J.O.; Von Der Ohe, K.; Von Der Ohe, W.; Amadò, R. Authentication of the botanical origin of honey using profiles of classical measurands and discriminant analysis. Apidologie 2007, 38, 438–452. [Google Scholar] [CrossRef]
  26. Gela, A.; Hora, Z.A.; Kebebe, D.; Gebresilassie, A. Physico-Chemical Characteristics of Honey Produced by Stingless Bees (Meliponula Beccarii) from West Showa Zone of Oromia Region, Ethiopia. Heliyon 2021, 7, e05875. [Google Scholar] [CrossRef]
  27. De Beer, T.; Otto, M.; Pretoruis, B.; Schönfeldt, H.C. Monitoring the quality of honey: South African case study. Food Chem. 2021, 343, 128527. [Google Scholar] [CrossRef]
  28. Tigistu, T.; Worku, Z.; Mohammed, A. Evaluation of the physicochemical properties of honey produced in Doyogena and Kachabira Districts of Kembata Tambaro zone, Southern Ethiopia. Heliyon 2021, 7, e06803. [Google Scholar] [CrossRef]
  29. Al-Farsi, M.; Al-Amri, A.; Al-Hadhrami, A.; Al-Belushi, S. Color, flavonoids, phenolics and antioxidants of Omani honey. Heliyon 2018, 4, e00874. [Google Scholar] [CrossRef] [Green Version]
  30. Amir, Y.; Yesli, A.; Bengana, M.; Sadoudi, R.; Amrouche, T. Physico-Chemical and Microbiological Assessment of Honey from Algeria. Electron. J. Environ. Agric. Food Chem. 2010, 9, 1485–1494. [Google Scholar]
  31. Alves, A.; Ramos, A.; Gonçalves, M.; Bernardo, M.; Mendes, B. Antioxidant activity, quality parameters and mineral content of Portuguese monofloral honeys. J. Food Compos. Anal. 2013, 30, 130–138. [Google Scholar] [CrossRef]
  32. Radovic, B.; Careri, M.; Mangia, A.; Musci, M.; Gerboles, M.; Anklam, E. Contribution of dynamic headspace GC–MS analysis of aroma compounds to authenticity testing of honey. Food Chem. 2001, 72, 511–520. [Google Scholar] [CrossRef]
  33. Innocenzi, P.J.; Hall, D.R.; Cross, J.V. Components of Male Aggregation Pheromone of Strawberry Blossom Weevil, Anthonomus rubi Herbst. (Coleoptera: Curculionidae). J. Chem. Ecol. 2001, 27, 1203–1218. [Google Scholar] [CrossRef] [PubMed]
  34. Al-Dalali, S.; Zheng, F.; Sun, B.; Chen, F. Comparison of Aroma Profiles of Traditional and Modern Zhenjiang Aromatic Vinegars and Their Changes During the Vinegar Aging by SPME-GC-MS and GC-O. Food Anal. Methods 2018, 12, 544–557. [Google Scholar] [CrossRef]
  35. Guyot, C.; Bouseta, A.; Scheirman, V.; Collin, S. Floral Origin Markers of Chestnut and Lime Tree Honeys. J. Agric. Food Chem. 1998, 46, 625–633. [Google Scholar] [CrossRef] [PubMed]
  36. Wolski, T.; Tambor, K.; Rybak-Chmielewska, H.; Kędzia, B. Identification of honey volatile components by solid phase microextraction (SPME) and gas chromatography/mass spectrometry (GC/MS). J. Apic. Sci. 2006, 50, 115–126. [Google Scholar]
  37. Pita-Calvo, C.; Vázquez, M. Differences between honeydew and blossom honeys: A review. Trends Food Sci. Technol. 2017, 59, 79–87. [Google Scholar] [CrossRef]
Figure 1. Chromatograms of traditional honey aroma compounds (black line—rape honey, pink line—lime honey, blue line—meadow and marsh honey).
Applsci 11 06371 g001
Figure 2. Chromatograms of non-traditional honey aroma compounds (black line—lime honey, pink line—buckwheat honey, blue line—honeydew honey from coniferous honeydew).
Applsci 11 06371 g002
Table 1. Physicochemical parameters and color of honeys (average values and standard deviation).
Traditional HoneyNon-Traditional Honey
H1H2H3H4H5H6
Rape honeyLime honeyMeadow and
marsh honey
Lime honeyBuckwheat honeyHoneydew honey
from coniferous
honeydew
Moisture (%)16.80 c ± 0.1415.40 a ± 0.1416.35 b ± 0.0717.80 d ± 0.1418.15 d ± 0.2115.35 a ± 0.21
Electrical conductivity
(mS/cm)
0.17 a ± 0.000.63 b ± 0.010.70 f ± 0.010.35 e ± 0.000.24 c ± 0.000.89 d ± 0.00
Acidity (meq/kg)13.3 a ± 0.613.0 a ± 1.730.7 b ± 1.28.3 c ± 0.624.3 d ± 0.631.3 b ± 1.5
pH3.55 b ± 0.004.49 c ± 0.082.95 c ± 0.033.37 a ± 0.033.28 a ± 0.013.09 d ± 0.02
HMF (mg/kg)0.7 a ± 0.30.4 a ± 0.24.2 b ± 0.212.7 c ± 0.811.8 c ± 2.34.5 b ± 0.8
Color (mm Pfund)5.2 a ± 2.037.2 b ± 2.573.7 d ± 0.85.6 a ± 1.9105.4 e ± 2.860.0 c ± 0.4
ColorWater whiteExtra light amberLight amberWater whiteAmberLight amber
Different letters (a–f) in the same line are significantly different at the 95% level (p ≤ 0.05).
Table 2. Percentage of reducing sugar in honeys.
Traditional HoneyNon-Traditional Honey
H1H2H3H4H5H6
Sugars (g/100 g)Rape honeyLime honeyMeadow and
marsh honey
Lime honeyBuckwheat
honey
Honeydew
honey from
coniferous
honeydew
Glucose31.52 a,b ± 5.0537.06 b ± 2.5435.21 a,b ± 1.9526.26 a ± 2.3928.58 a,b ± 5.4133.06 a,b ± 2.68
Fructose32.46 b ± 3.0036.87 a ± 2.8136.20 a ± 1.4236.79 a ± 0.2037.50 a ± 0.8430.18 a ± 2.76
Glucose + fructose63.98 a ± 7.8373.93 a ± 5.1271.41 a ± 1.6263.05 a ± 2.5866.08 a ± 5.9463.24 a ± 4.87
Fructose/glucose ratio1.04 a,b,c ± 0.101.00 a,b ± 0.041.03 a,b ± 0.091.41 c ± 0.131.34 b,c ± 0.270.91 a ± 0.07
Glucose/water ratio1.88 a,b ± 0.042.41 a ± 0.122.15 a ± 0.101.48 b ± 0.051.58 b ± 0.022.15 a ± 0.06
Different letters (a–c) in the same line are significantly different at the 95% level (p ≤ 0.05).
Table 3. Antioxidant properties of honeys and the total content of phenolic compounds determined in analyzed samples.
Traditional HoneyNon-Traditional Honey
H1H2H3H4H5H6
Rape honeyLime honeyMeadow and
marsh honey
Lime honeyBuckwheat
honey
Honeydew
honey from coniferous
honeydew
Total phenolic
(mg GAE/100 g)
14.3 a ± 0.436.2 b,c ± 0.834.2 b ± 0.813.7 a ± 0.351.2 d ± 5.130.9 c ± 2.0
ABTS [%]15.1 b ± 1.554.9 a ± 2.852.5 a ± 3.315.2 b ± 0.045.9 c ± 0.960.7 a ± 2.3
Different letters (a–d) in the same line are significantly different at the 95% level (p ≤ 0.05).
Table 4. Content of volatile compounds [µg/kg] determined in analyzed honey samples.
Traditional HoneyNon-Traditional Honey
H1H2H3H4H5H6
Volatile groupRape honeyLime honeyMeadow and
marsh honey
Lime honeyBuckwheat honeyHoneydew honey
from coniferous
honeydew
Acids1.40 b ± 0.03 b (3)ndndnd39.95 ± 1.69 a (6)nd
Alcohols6.44 ± 0.8 d
(13)
20.40 ± 1.88 b (12)23.85 ± 1.28 b
(16)
12.07 ± 1.04 c
(19)
13.71 ± 1.17 c
(14)
38.59 ± 1.97 a
(15)
Aldehydes11.40 ± 1.18 d (8)30.70 ± 2.60 b (10)33.41 ± 1.91 b
(8)
20.39 ± 1.50 c
(12)
90.72 ± 3.16 a
(7)
nd
Esters1.59 ± 0.13 e
(3)
7.08 ± 0.61 c
(1)
16.86 ± 0.63 b
(2)
3.80 ± 0.55 d
(2)
0.27 ± 0.03 f
(1)
25.57 ± 1.53 a
(5)
Hydrocarbons1.00 ± 0.21 e
(2)
59.73 ± 2.99 a
(8)
13.02 ± 0.67 c
(8)
18.69 ± 1.18 b
(9)
0.04 ± 0.02 f
(1)
6.39 ± 0.42 d
(3)
Ketones12.46 ± 1.0 d (19)50.38 ± 2.72 a (10)32.43 ± 2.73 b
(19)
7.39 ± 0.46 e (11)30.79 ± 3.59 b
(24)
19.51 ± 1.96 c
(9)
Terpenes3.39 ± 0.38 d (3)11.11 ± 1.37 b (9)23.65 ± 1.82 a (5)4.57 ± 0.36 c
(5)
2.94 ± 0.33 e
(3)
2.91 ± 0.05 e
(2)
Others1.84 ± 0.39 e (2)5.54 ± 0.55 d
(5)
25.30 ± 1.53 a
(6)
6.17 ± 0.82 d (9)21.21 ± 0.97 b (5)13.10 ± 1.16 c
(6)
Sum39.52 ± 3.04 e
(53)
195.17 ± 2.90 a (55)170.58 ± 2.28 b
(64)
73.20 ± 1.60 d
(67)
199.62 ± 6.40 a (61)106.06 ± 0.45 c
(40)
Different letters (a–f) in the same line are significantly different at the 95% level (p ≤ 0.05).
Publisher’s Note: MDPI stays neutral with regard to jurisdictional claims in published maps and institutional affiliations.

