Article

Screening of Some Romanian Raw Honeys and Their Probiotic Potential Evaluation

by
Claudia Pașca
1,*,
Liviu Alexandru Mărghitaș
1,†,
Ioana Adriana Matei
2,
Victorița Bonta
1,
Rodica Mărgăoan
3,
Florina Copaciu
4,
Otilia Bobiș
1,
Maria Graça Campos
5,6 and
Daniel Severus Dezmirean
1,*
1
Department of Apiculture and Sericulture, Faculty of Animal Sciences and Biotechnologies, University of Agricultural Sciences and Veterinary Medicine Cluj-Napoca, Calea Mănăștur 3-5, 400372 Cluj-Napoca, Romania
2
Department of Microbiology, Faculty of Veterinary Medicine, University of Agricultural Sciences and Veterinary Medicine Cluj-Napoca, Calea Mănăștur 3-5, 400372 Cluj-Napoca, Romania
3
Advanced Horticultural Research Institute of Transylvania, Faculty of Horticulture, University of Agricultural Sciences and Veterinary Medicine Cluj-Napoca, 400372 Cluj-Napoca, Romania
4
Department of Chemistry and Biochemistry, Faculty of Animal Sciences and Biotechnologies, University of Agricultural Sciences and Veterinary Medicine, 400372 Cluj-Napoca, Romania
5
CQ-Centre of Chemistry—Coimbra, Department of Chemistry, Faculty of Sciences and Technology, University of Coimbra, Rua Larga, 3004-535 Coimbra, Portugal
6
Laboratory of Pharmacognosy, Faculty of Pharmacy, Health Sciences Campus, University of Coimbra, Azinhaga de Santa Comba, 3000-548 Coimbra, Portugal
*
Authors to whom correspondence should be addressed.
This co-author died on 14 May 2021.
Appl. Sci. 2021, 11(13), 5816; https://doi.org/10.3390/app11135816
Submission received: 22 May 2021 / Revised: 12 June 2021 / Accepted: 20 June 2021 / Published: 23 June 2021
(This article belongs to the Special Issue Chemical Composition, Properties and Applications of Honey)

Abstract

:
This study aimed to characterize raw honeys from different geographical origins in Romania, in respect of chemical composition, microbiological examination and evaluate their probiotic potential. The physico-chemical determinations were performed in APHIS-DIA Laboratory, Cluj-Napoca, Romania, using standard validated methods. Bacterial identification was performed for each sample and each colony type using Vitek® 2 Compact 15 system and PCR amplification using 16S rDNA bacterial universal primers (27F, 1492R), species being confirm by sequences analysis. In five raw honey samples, we have identified probiotic bacteria, such as: Bacillus mycoides, Bacillus thuringiensis, Bacillus amyloliquefaciens, Bacillus subtilis, and Bacillus velezensis. Generally, all honey samples meet the standard values for chemical composition. However, one sample having 7.44% sucrose was found to have also probiotics bacteria from the genus Bacillus because sucrose is a substrate for probiotics development. In conclusion, the Romanian raw honey can be a potential reservoir of probiotics, which confer a health benefit for consumers.

1. Introduction

Romania has an ancient tradition of beekeeping, and it is one of the most important honey producers in Europe, due to the variety of landforms, as well as the diverse and very rich flora. In the Romanian flora, there is a series of meliferous plants that stand out through a high honey production [1]. Honey, which is the earliest sweetener known to mankind, was used also for wound healing and as a traditional medicine before the advent of modern antibiotics, and now it is regarded not only as a natural sweetener but also as a healthy food with medicinal properties [2,3,4], and it has evoked a renewed interest with the reported upsurge in antibiotic resistance globally [5]. According to the definition set by European Union Council Directive 2001/110/EC [6], “Honey is the natural sweet substance produced by the Apis mellifera bees from the nectar of plants or from the secretions of living parts of plants or excretions of plant sucking insects on the living parts of plants which the bees collect, transform by combining with specific substances of their own, deposit, dehydrate, store and leave in honeycombs to ripen and mature.” Its composition is rather variable and primarily depends on the botanical and geographical origin of the floral source, although certain external factors also play an important role, such as seasonal and environmental factors and its processing.
Honey is a natural prebiotic composed of sugars, amino acids, enzymes, vitamins, and minerals [7]. Monosaccharides, glucose and fructose, are the major sugars (nearly 75%) and disaccharides, sucrose, maltose, turanose, isomaltose, and maltulose, are in the small amount in honey [8]. Non-digestible carbohydrates (oligosaccharides and polysaccharides), some peptides and proteins, and certain lipids (esters and ethers) are considered prebiotics [9]. Prebiotics are non-digestible food ingredients that beneficially affect the host by selectively stimulating the growth and/or activity of one or a limited number of probiotic bacteria [10,11,12,13,14].
Fructooligosaccharides (FOS) are non-digestible carbohydrates, composed mainly of chains of fructose units with a terminal glucose molecule, such as fructans, oligofructans, glucofructans, inulins, or oligosaccharides, such as sucrose, inulobiose, and levanobiose [9,15]. Sucrose is a fructooligosaccharide, which is prebiotic, and prebiotics are substrates for develop probiotics. If the concentration in fructooligosaccharides is higher, the probiotics are developing fast. High sucrose values in honeys are related to its botanical origin, for example, the honey dew or different honey maturity stages, or high nectar flux or artificial feeding of honey bees with sugar syrup [16]. Honeybees’ relationship with probiotic microorganisms starts from the early metamorphosis stage of the larvae (day 4), when the feed is changed to honey, replacing royal jelly, until day 21 when adult larvae is ready to eclosionate. In this process, the larvae are immunologically stimulated due to probiotics contained in honey [2,17]. For a long time, researchers believed that the source of lactic acid bacteria in honey was pollen and secretions of flowers that arrived in honey transported by honey bees. However, later studies proved that the lactic acid bacteria are present in the stomach of the honeybees; therefore, the source of lactic acid bacteria is the bee itself [7]. In the honey production process, the enzyme glucose oxidase is responsible for the glucose transformation in galacturonic acid. This causes the natural acidification of honey and, therefore, its preservation. There, the majority of pathogenic and spoilage microorganisms are inhibited [18]. Due to honey acidity, yeasts and lactic acid bacteria are the predominant microorganisms. Among the lactic acid bacteria, there are probiotic microorganisms, from Bacillus and many other genera, such as Lactobacillus, Lactococcus, Bifidobacterium, Leuconostoc, and Pediococcus [19,20]. In 2014, the International Scientific Association for Probiotics and Prebiotics (ISAPP) consensus statement ratified an earlier definition of probiotics outlined by Food and Agriculture Organization and World Health Organization (FAO/WHO, 2001), as ‘live microorganisms that, when administered in adequate amounts, confer a health benefit on the host’. Therefore, honey can be used in honeybee feeding and also in human consumption. Probiotics maintain microbial balance in intestine, prevent and inhibit the growth of pathogenic bacteria, and cure various intestinal diseases [21].
In this context, in various reports, several probiotic bacteria were isolated from honey or honeybee, and then characterized. Wang et al. (2015) [22] reported Bacillus amyloliquefaciens and Bacillus subtilis as the dominant bacteria in honey bee gut [23] or honey as an antagonistic agent against Paenibacillus larvae and Ascosphaera apis [24]. In South East Asia, different probiotic products containing Bacillus stains, either as single or mixed with other Lactobacillus strains, are used as an alternative to conventional antibiotics. Therefore, there is a risk of transferring antibiotic resistance genes to pathogens in the gut of humans and animals and release of drug resistance genes to the environment through feces [25]. Whereas the probiotics do not carry the risk for antibiotics resistance, they are used exactly for the opposite: the organism shall not develop resitance towards antibiotics.
The aim of the present study was to characterize the raw honeys from different geographic area and evaluate the probiotic potential of bacteria isolated from these honeys.

2. Materials and Methods
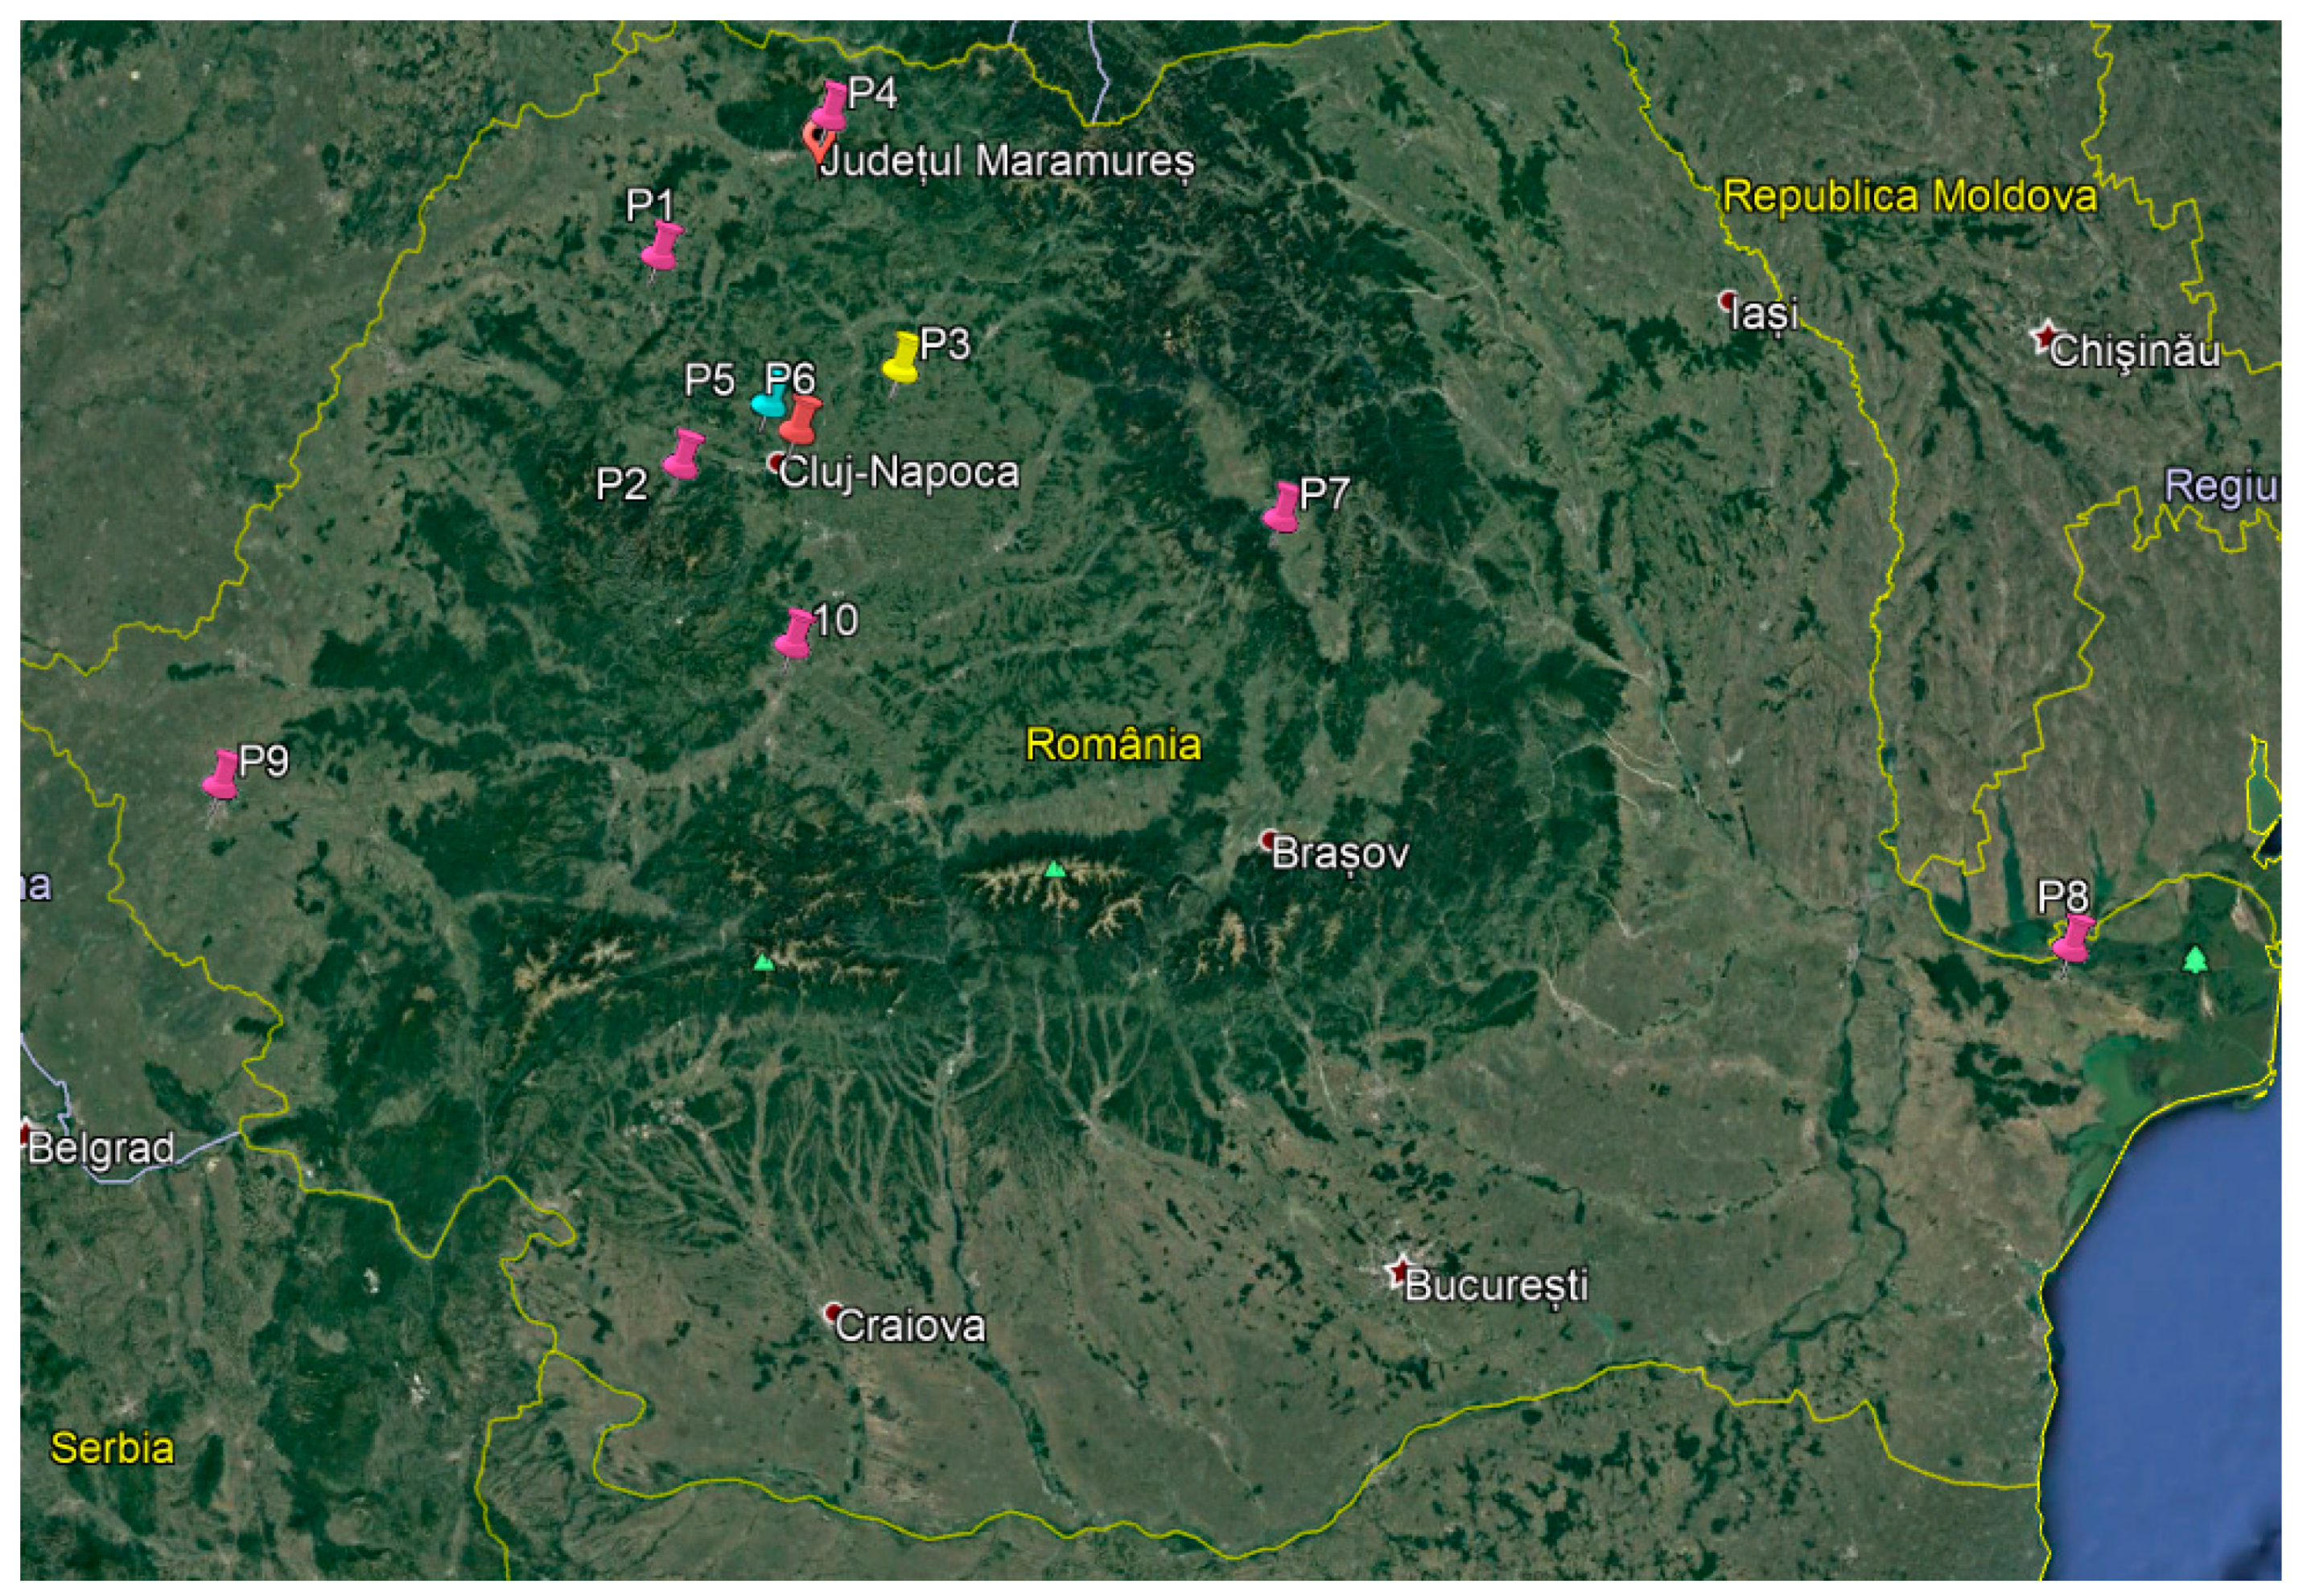
2.1. Honey Samples

Raw honey was harvested directly from honeycombs that were collected from different Romanian apiaries in autumn 2020 (Figure 1): five samples (P1- Sălaj area; P2-Râșca apiary; P3-Țaga apiary; P5-Corușu apiary; and P6-USAMV apiary) from north-west of the country, two samples (P7-Harghita area and P10-Alba area) from the center of the country, one sample (P4-Maramureș area) from north of the country, another sample (P9-Banat area) from west of the country, and the last one sample (P8-Tulcea area) from south-east of the country. In this research, we choose to study honey because it is the most consumed bee product. The characteristics of these honey samples (P1–P10) were analyzed in accordance with the FDA (Food and Drug Administration) standard methods or scientific articles. All the chemical reagents and microbial media used in this research were purchased from Merck (Darmstadt, Germany) and Sigma-Aldrich (Saint Louis, MO, USA) companies, with analytical grade.

2.2. Physico-Chemical Characterization of Raw Honey Samples

2.2.1. Nutritional Parameters of Raw Honey Samples

The melissopalynological analysis was made after the method of Louveaux et al. (1978) [26], without acetolysis. Briefly, 10 g of honey was dissolved in diluted H2SO4 (5‰), centrifugated 10 min (3396 rcf), and the sediment washed twice with distilled water. After another centrifugation, the supernatant was discharged, and two drops of liquid, together with the entire sediment, was put on a microscopic slide, and an area 20 × 20 m2 was mounted with glycerine-gelatine-fuxine. Slide examination was performed using an Olympus BX51microscope at 1000×magnification (for identification) and 400×magnification for counting. One thousand pollen grains were counted from every slide, and percentages of different botanical species were calculated. For the identification of pollen type, different pollen guides were used.
Moisture content: The method used for moisture content was adapted from International Honey Commission (IHC) [27], measuring the refractive index of a liquid honey sample, using Abbe refractometer (Abbé WAY-S Selecta—Spain). In the case of a crystalized sample, honey was placed in a tube with rod and was heated in a water bath at 40 °C until liquification. The refractive index read at 20 °C on the refractometer is transformed in water content using the table from the standard. Results are expressed as % water.
Sugars profile determination: HPLC (High-performance liquid chromatography) analysis of the carbohydrates is carried out on a modified Alltima Amino 100 Å stainless steel column (Alltech, Nicholasville, KY, USA) (4.6 mm diameter, 250 mm length, particle size 5 µm) following IHC method modified in APHIS-DIA Laboratory [28]. The SHIMADZU instrument (LC–10AD VP model, Shimadzu, Kyoto, Japan) was equipped with degasser, two pumps, auto sampler, thermostat oven, controller, and refractive index detector. The injection volume was 10 µL, and the flow rate was 1.3 mL/min. The mobile phase was acetonitrile/water (75:25 v/v). Briefly, 5 g of honey were dissolved in ultrapure water (40 mL), transferred into a 50 mL volumetric flask, containing 25 mL HPLC grade purity methanol, and subsequently filled to the mark with water. The honey solution was filtered through a 0.45 µm membrane filter, collected in HPLC glass vials for analysis. A calibration curve for each sugar was made using standard solutions of different concentrations (0.5–80 mg/mL) for the quantification of sugars, with regression coefficients r2 higher than 0.998. Quantification was made by comparing the obtained peak area with those of standard sugars. The results were expressed as g/100 g honey.
Total lipids: The content of total lipids in honey samples was determined using Soxhlet method (Soxtherm, Gerhardt, Germany), a literature method [29] modified in APHIS-DIA Laboratory. Briefly, 2 g of honey samples were weighted on filter paper, and also the extraction glasses containing 2 boiling stones, will be weighted and, after that, together with the cartridge and the solvent (90 mL etil-eteric), will be fixed in PTFE cylinders. The method is set from the multistat: extraction temperature 140 °C, extraction time 5 h, washing 30 min, solvent evaporation in hot air flow 10 min. After extraction ends, extraction glasses will be placed in the oven at 60 °C, for one half hour, to eliminate traces of solvent and, after cooling, will be weighted, and the results were expressed as percent.
Total proteins: The content of total proteins of honey samples was determined using Bradford method. The original method of Bradford [30] was modified in our laboratory, for honey analysis. Briefly, 2 g of honey samples dissolve with 2 mL of ultrapure water in a 10 mL Berzelius glass. Take 0.1 mL of the diluted honey solution and place in a test tube, over which 2 mL Bradford reagent is added. Thus, the sample obtained shall be homogenized. The absorption of solutions is measured at 595 nm. The amount of protein was calculated according to the calibration curve.

2.2.2. pH and Acidity Value Measurement

Honey has an acidic pH due to the presence of different organic acids in the composition. This low pH inhibits the presence and growth of different unwanted microorganisms, and the presence of different acids help developing the flavor and aroma or different types of honey. Honey pH is measured with an automatic titrator (Titroline Easy SCHOTT Germany) from a solution of 10% (w/v) honey. Free acidity of honey is obtained from neutralization with a solution of sodium hydroxyde. Lactonic acidity is obtained by titration with NaOH in excess and making the neutralization curve of the NaOH excess by titration with sulfuric acid. Total acidity of honey is the sum of free acidity and lactonic acidity. The method from International Honey Commission [27] and adapted for the automatic titrator in our laboratory. Acidity is expressed as meqNaOH/kg honey.

2.2.3. Mineral Content

To determine the levels of micro and macro elements: Ni, Na, Cd, Mg, K, Cr, Ca, Fe, Mn, Cu, Se, Pb, and Zn from studied honey samples, the atomic absorption spectrometry method was used [31,32]. The mineralization of the samples was made in a microwave furnace, Berghof digestion system MWS-2. Approximately 0.3 g of the homogenized honey samples were placed in special Teflon tubes, 2 mL of 65% HNO3, after which 3 mL of H2O2 was added before the container was sealed. At the end of the initiated program, the solution is transferred into graded plastic containers and the sample is diluted with ultrapure water to a volume of 30 mL. An AAnalyst 800 Atomic Absorption Spectrometer from Perkin-Elmer (Shelton, CT, USA) equipped with a cross-linked graphite furnace was used. The absorption wavelength for the determination of each micro and macro element, together with its linear working range and correlation coefficient of calibration graphs, were calculated. The reagents used to perform the analyses were of analytical purity, namely 65% nitric acid and ultra-purified water. For the calibration curve, following dilutions of standard solutions were used: chromium (10 μg/L), manganese (10 μg/L), calcium (2 μg/L), nickel (50 μg/L), iron (20 μg/L), cadmium (2.0 μg/L), sodium (4.0 μg/L), potassium (5.0 μg/L), zinc (2.0 μg/L), selenium (100 μg/L), magnesium (1.0 μg/L), copper (25 μg/L), and lead (50 μg/L) [32]. The result obtained represents the concentration of mineral elements expressed in μg/L, then transformed according to the amount of weighted sample.

2.2.4. Quality Analysis of Raw Honey Samples

Hydroxymethylfurfural content: The concentration of hydroxymethylfurfural (5-hydroxymethil-furan-2-carbaldehide—HMF) content was determined via high performance liquid chromatography with photodiode array detection (HPLC-PDA) [27] (Shimadzu VP system—Japan). Operational parameters of chromatographic system: mobile phase ultrapure water (solvent A), methanol (solvent B), gradient scheme: 10% B at 0–13 min, 90% B at 13–15 min, 90% B at 20 min, and 90–10% B at 21 min, equilibrating the column (10% B) until 30 min, flow rate 0.8 mL/min, injection volume 20 µL, Discovery HS C18, 5 µm 4.6 × 250 mm column, column temperature 30 °C, detection at 283 nm. Ten grams of honey is weighted into a Berzelius glass and dissolved in approximately 25 mL of distilled water. Honey solution is transferred quantitatively into a 50 mL volumetric flask. Add 0.5 mL of Carrez I solution (15 g of potassium hexacyanoferrate (II), K4Fe(CN)6 × 3H2O in water and make up to the mark in 100 mL) and mix. Then, add 0.5 mL of Carrez II solution (30 g of zinc acetate, Zn(CH3COO)2 × 2H2O, and make up to 100 mL), mix, and make up to 100 mL with water. Filter through filter paper, removing the first 10 mL. The filtrate was afterwards filtered into glass vial through a 0.45 μm syringe filter and inject into HPLC system. Different concentrations of HMF (Hidroximetilfurfural) standard (1–50 mg/mL) were injected into the chromatographic system and a calibration curve was constructed. The concentration of HMF from the samples is calculated with the equation:
H M F ( m g / k g ) = Cc × 5 × 10 m ,
where:
  • Cc—concentration from the calibration curve,
  • m—mass of weighted honey, and
  • results are expressed in mg/kg honey.
Diastase activity: For the determination of diastazic activity, Amylazime—Megazyme spectrophotometric method was used [33]. Amylazime tablets contain amylose (the linear fraction of starch). In the presence of α-amylase (from the honey solution), the substrate is hydrolyzed, and the soluble colored product is released. The reaction is terminated by the addition of Trizma solution, followed by filtration. The absorbance of the filtrate is read at 590 nm towards a control sample (without honey) as blank. There is a linear correlation between absorbance of the filtrate and the diastase activity in the sample. For sample preparation, 2 g of honey was weighted and dissolved in 40 mL of 100 mM maleate buffer (pH 5.6) in a 50 mL Berzelius glass. The solution was then transferred quantitatively into a 50 mL volumetric flask and make up to the mark with water. One mL of the diluted honey solution was placed in a test tube and pre-incubated at 40 °C for 5 min. One tablet of Amylazime was added to the tube without removing the test tube from the water bath. The tablet hydrated quickly and absorbed most of the liquid.
The samples were then incubated the tube at 40 °C for exactly 10 min; afterwards, 10 mL of basic Trizma solution (2% w/v) was added to complete the reaction, and the test tube was shacked vigorously and stored at room temperature for 5 min. The content of the tubes was filtered through paper filter and read at 590 nm on a spectrophotometer (UV-1700 Shimadzu Instruments) against a control.
Diastazic activity was calculated by the following formula: 20 × DO590, where DO590 represents the absorbance. Results are expressed in Schade units/g honey.
Contaminants: tetracycline and oxytetracycline: Tetracycline and oxytetracycline from honey were determined using high performance liquid chromatography with photodiode array detection (HPLC-PDA). The method was adapted from AOAC methods [34] in our laboratory for the detection and quantification of antibiotics from honey. Sample preparation was based on the purification and extraction of tetracycline residues from honey using affinity columns with metallic chelates [35]. The chromatographic system (Shimadzu VP Series, Japan) consists of: binary pump, degasser, system controller, column oven, auto-injector, and detector set at 360 nm. The separation was performed on a Nucleosil 100 RP-18, 5 μm column, 250 × 4.6 mm ID, equipped with guard column. The mobile phase is 10 mM oxalic acid, acetonitrile, and methanol (16/3/2). The flow rate was 1 mL/min, injection volume: 50 μL and column temperature: 35 °C. For sample preparation, an Alltech vacuum Manifold with polypropylene mini-columns of 3 mL with 10 mL reservoir, containing a frit at the bottom (Supelco), was used. The extraction solution is sodium succinate buffer 0.1 M, eluent McIlvine-EDTA-NaCl buffer, and chelating Sepharose fast flow resin in 20% methanol suspension [35]. From a stock solution of 0.1 mg/mL oxytetracycline and tetracycline, different dilutions were made (5–75 µg/L) and were injected separately in duplicate. Following the chromatograms registrations, calibration curves were constructed, to be used in unknown concentration determination from the honey samples. The oxytetracycline or tetracycline residue content of the sample was calculated by comparing the signal area corresponding to the sample with that of the standard solution, taking into consideration the dilution. There is a direct proportionality between the concentration and the signal area given by those. Calculation was made following the equation:
Residue concentration (µg/kg) = (Velution/msample) × Cc,
where:
  • Velution—elution volume from sample preparation (3 mL),
  • msample—honey sample mass (g), and
  • Cc—concentration from the calibration curve.
Every batch of analysis contained one pure standard mixture run and fortified samples to exclude uncertainty from inconclusive results. The results are expressed in µg/kg honey (ppm).

2.3. Microbiological Examination of Raw Honey Samples

From each lot (P1–P10), 25 g of honeycombs were weight and added to 225 mL Tween 80 tryptic soy broth under sterile condition. The samples were incubated 24 h at 37 °C in a shaker incubator. The next day, up to 6 10-fold serial dilution were performed, and 1 mL sample were poured on Tween 80 tryptic soy agar. For each sample dilution, 2 plates were inoculated. One of each dilution plates was cultivated in aerobic condition at 37 °C for 24 h, and the second one in anaerobic condition at 37 °C for 5 days [23].
The number of total germs (NTG) was established by counting at the proper dilution on the plates cultivated aerobically, and the bacterial concentration was calculated taking into account the dilution.
Bacterial identification was performed for each sample and each colony type using Vitek® 2 Compact 15 system (bioMérieux, Marcy l’Etoile, France). The appropriate card type (BCL, ANC, GP, and GN) was used accordingly to the microscopical identification (Gram staining) and manufacturer recommendations. Where Vitek® identification failed, the colony was processed further by DNA extraction using commercial kits (ISOLATE II Genomic DNA Kit, Bioline, UK) and PCR amplification using 16 s rDNA bacterial universal primers (27F, 1492R) using previously published protocols [36,37]. The amplification was carried out in 25 µL reaction mixture containing 12.5 µL of Green PCR Master Mix (Rovalab GmBH), 6.5 µL PCR water, 1 µL of each primer (0.01 mM), and 4 µL aliquot of isolated DNA. The PCR was carried out using a T100TM Thermal Cycler (Bio-Rad). The PCR products were visualized by electrophoresis in a 1.5% agarose gel stained with SYBR® Safe DNA gel stain (Invitrogen). Positive PCR products were purified using commercial kits (Isolate II PCR and Gel Kit, Bioline, UK). Sequencing analysis was performed (Macrogen Europe, Amsterdam), and the obtained sequences were edited and analyzed using Geneious® (Biomatters LTD) 4.8.7 and compared with those available in the GenBank database by BLASTn analysis.

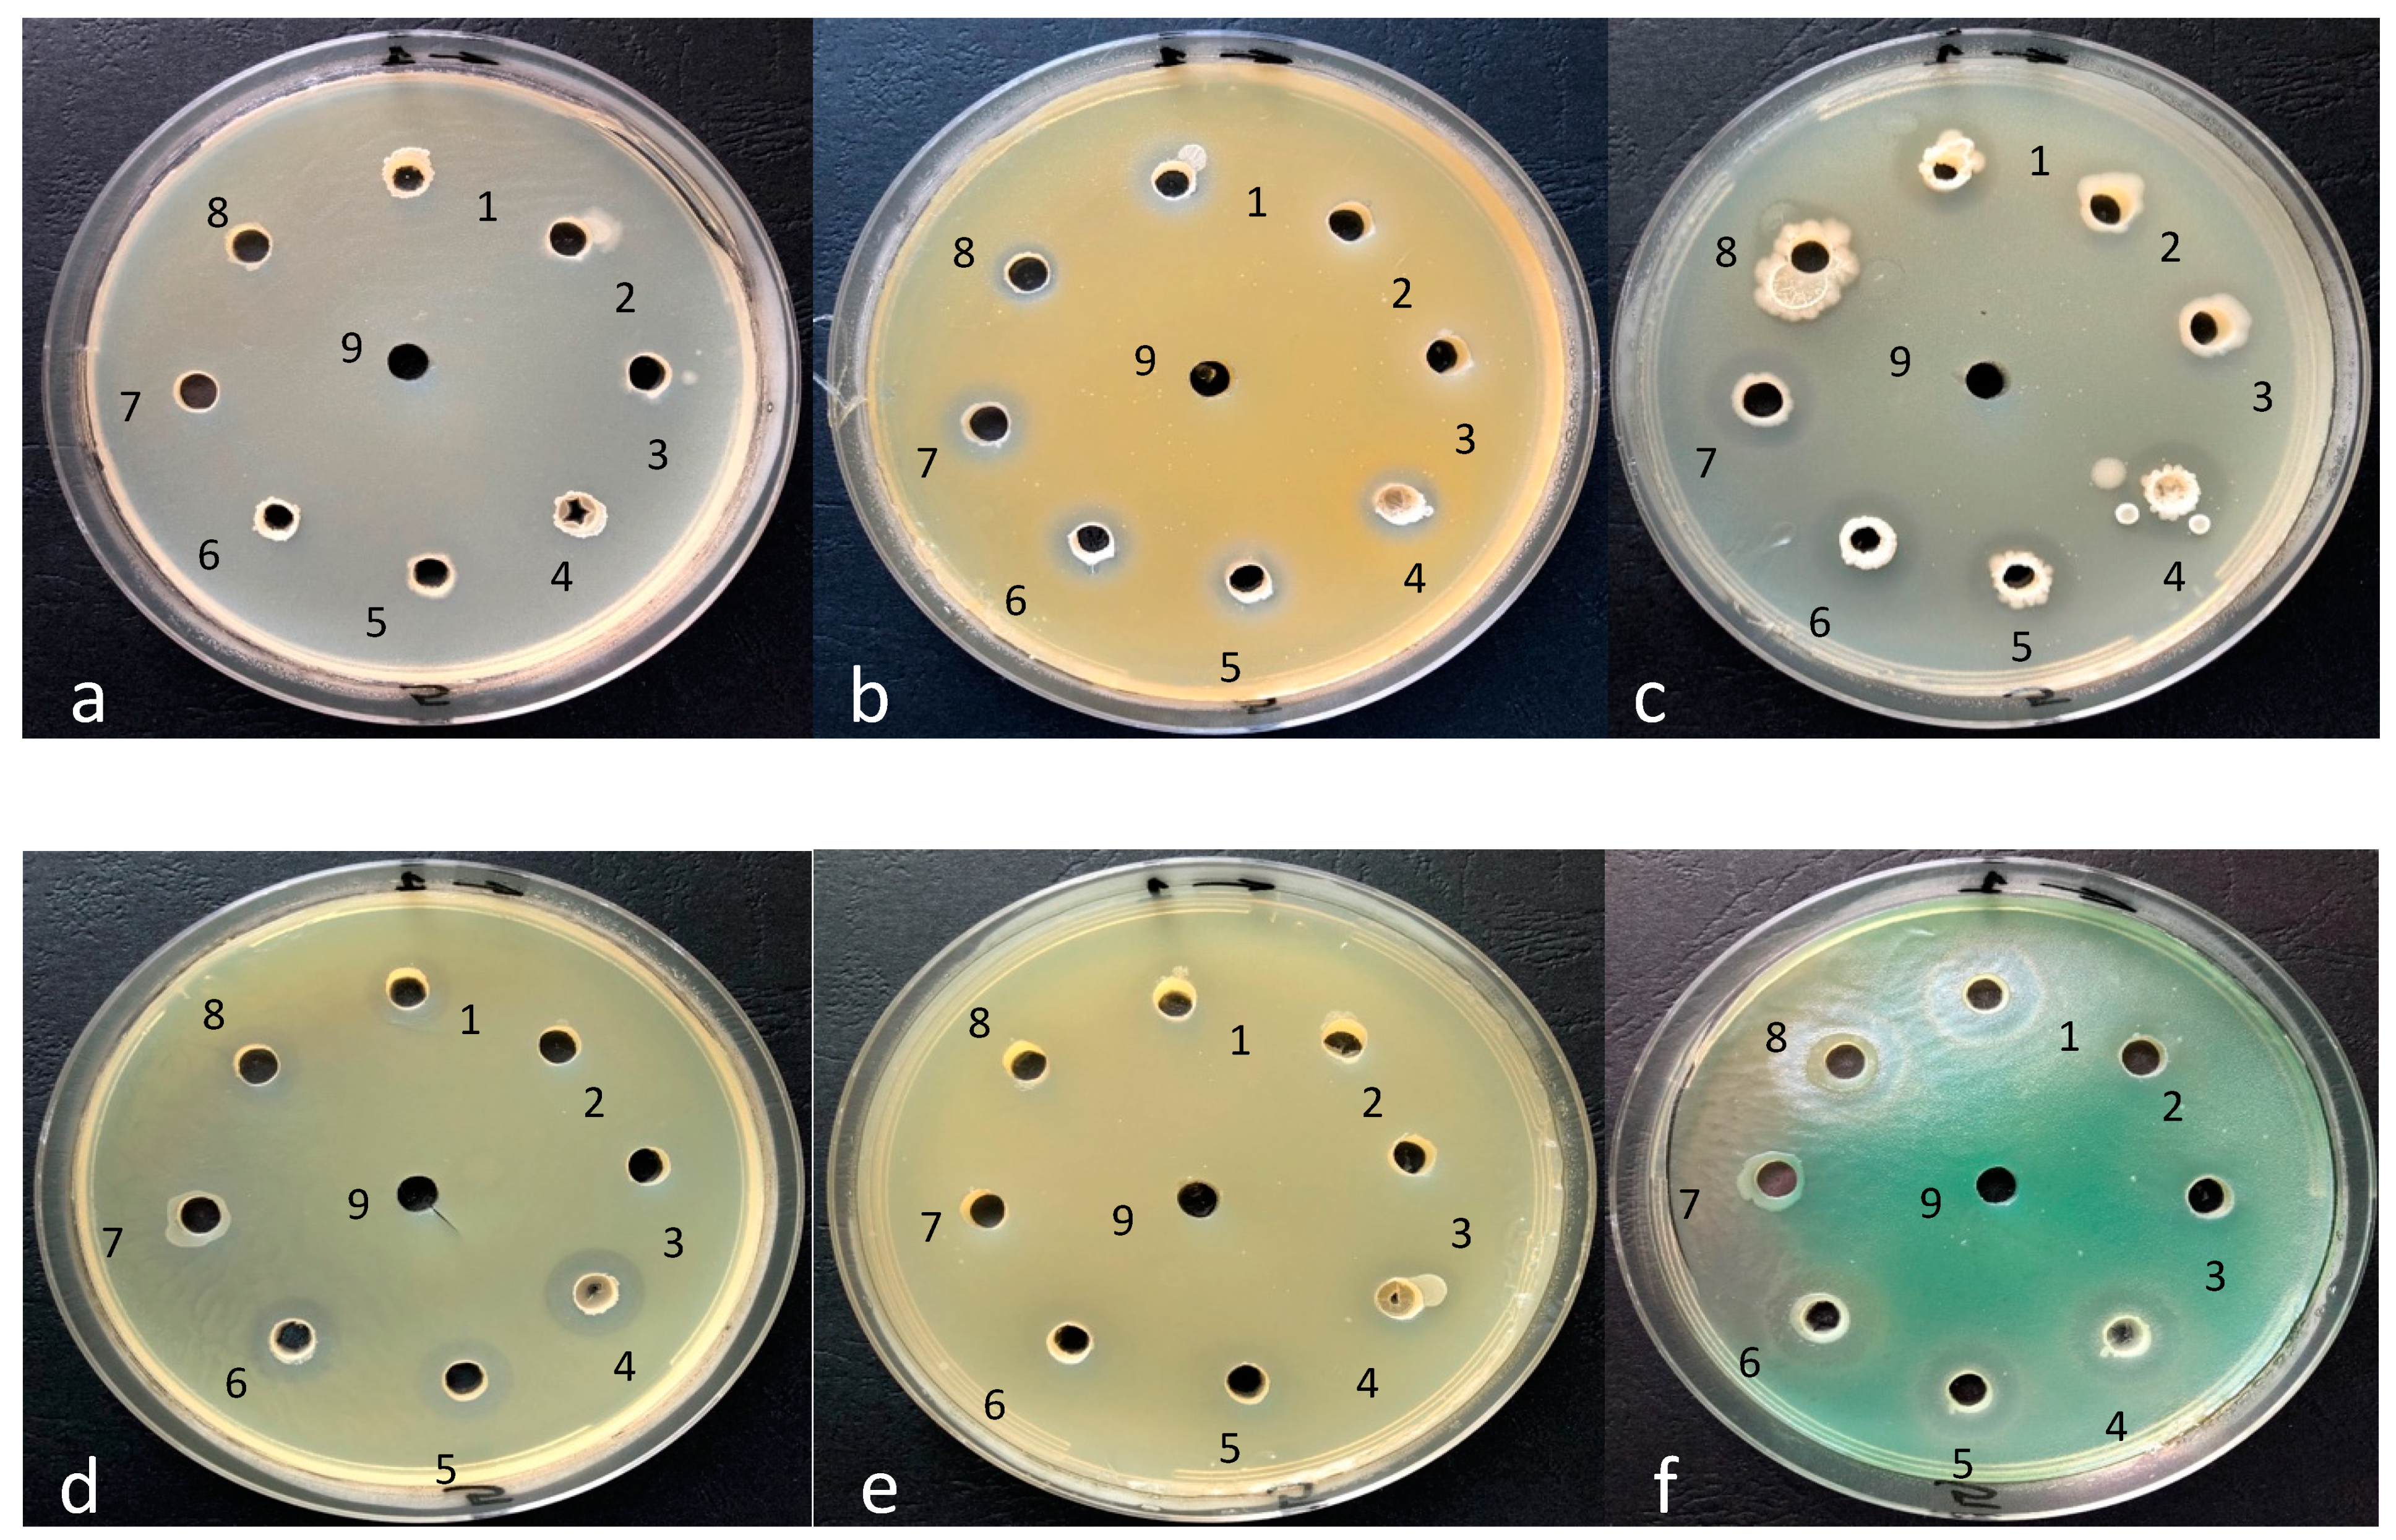
2.4. Antibacterial Activity of Bacillus spp. Isolates

The antimicrobial activity of Bacillus spp. isolates (B. subtilis, B. thuringiensis 1, B. mycoides, B. amyloliquefaciens, B. velezensis 1, B. velezensis 2, B. thuringiensis 2, B. velezensis 3) was tested against 3 Gram-positive and 3 Gram-negative references strains of bacteria (Enterococcus faecalis ATCC 29212, Staphylococcus aureus ATCC 6538P, Listeria monocytogenes ATCC 13932, Escherichia coli ATCC 10536, Salmonella enteritidis ATCC 13076, Pseudomonas aeruginosa ATCC 27853). The tryptic soy gar plates were inoculated with 1 mL of 0.5 McFarland bacterial suspension. After drying, 9 holes were sterile cut, and 50 μL of Bacillus spp. 2 McFarland bacterial suspension was added. The pates were incubated aerobically at 37 °C for 24 h. The next day, the inhibition radius was measured [38].

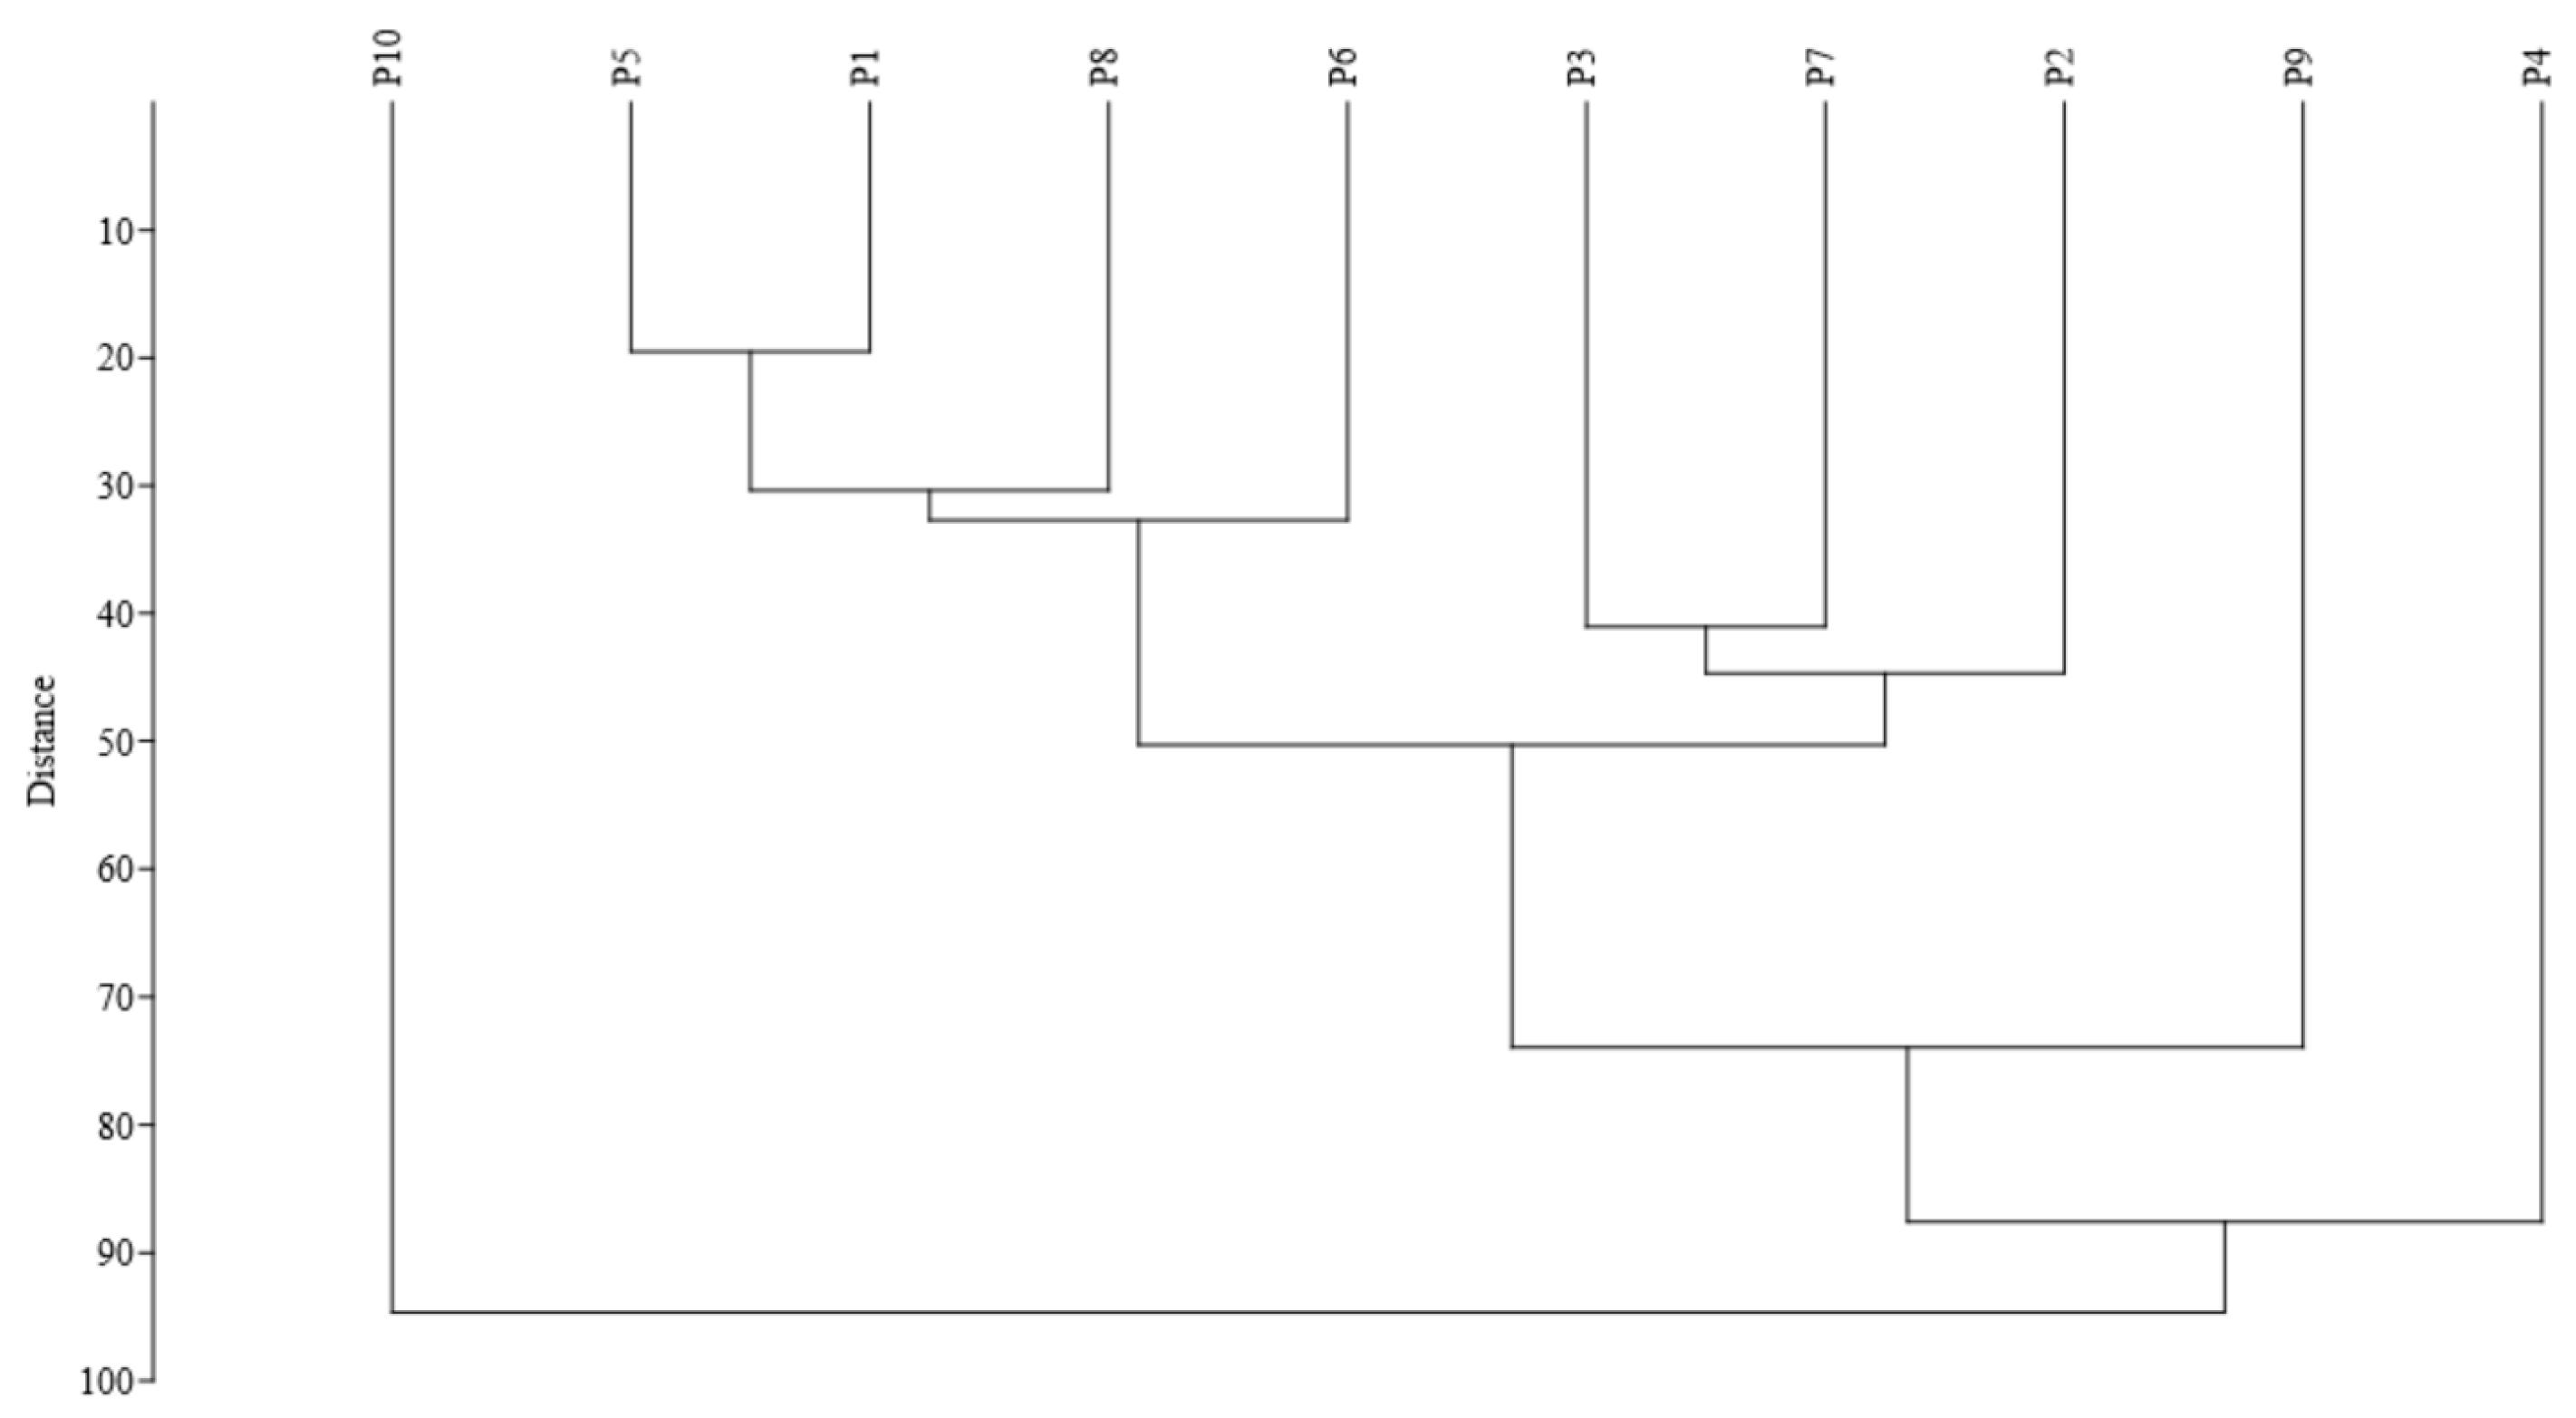
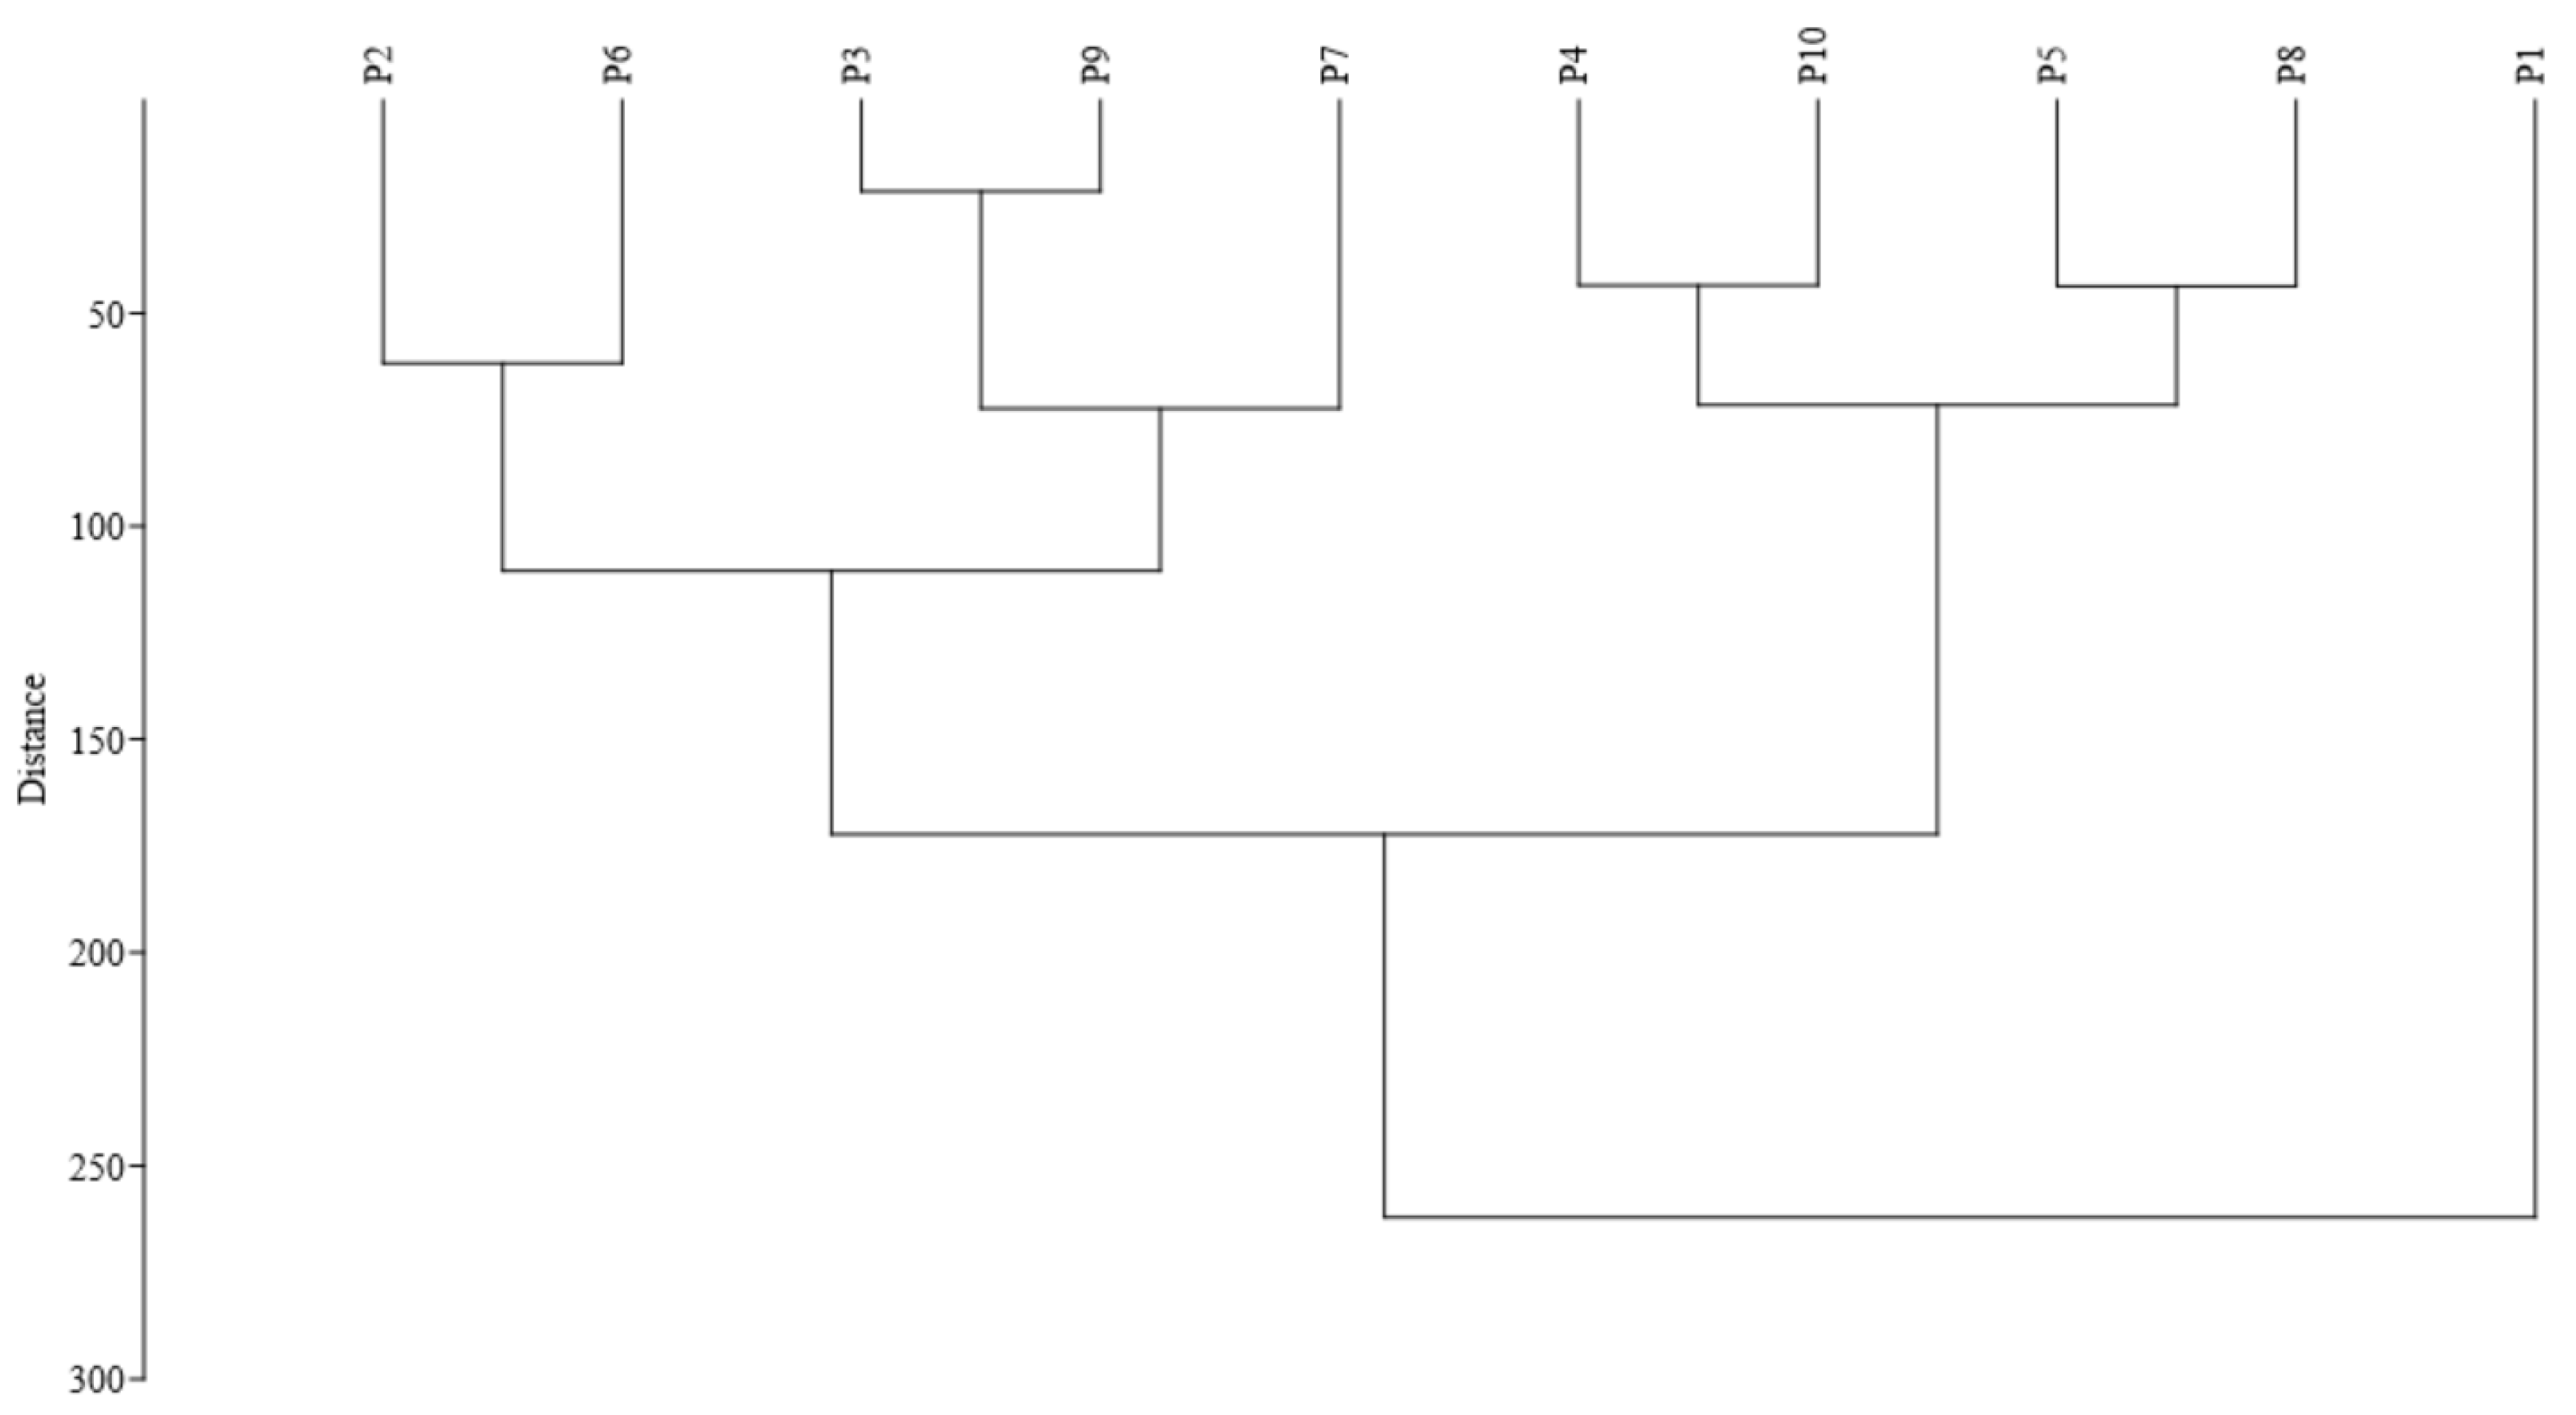
2.5. Statistical Analysis

All determinations were made in series of three independent repetitions, and the obtained results were expressed as mean ± standard deviation (SD). Significant differences between samples were analyzed with one-way ANOVA (Analysis of varianc) post hoc tests, and pairwise multiple comparisons were conducted using Tukey’s test. Significant differences were reported based on p ˂ 0.05. Statistical analyses were performed using the SPSS programme (version 22.0, Chicago, IL, USA). Dendrograms were generated using the Euclidean distance based on Ward’s algorithm for clustering [39]. To reduce the pollen dataset to a lower number of dimensions, cluster analyses using the Paleontological Statistics (PAST) software (version 2.17, Oslo, Norway, 2012) was performed [40].

3. Results

3.1. Melisopalinological Analysis

Melisopalinological analysis of raw honey samples provides information about the plants from which bees collected the nectar. In Table 1 are represented the families, genera and species to which the analyzed honey samples belong. From all the analyzed honey samples, in only five, a predominant pollen species (>45%) was identified (Asteraceae family), and, in five samples, secondary pollen species (16–45%) were identified, belonging to Asteraceae, Fabaceae, Boraginaceae, Laminaceae families and other important minor pollen and minor pollen.
In the same time, hierarchical clustering was performed in order to differentiate the honey samples based on their botanical and geographical origin (r = 0.95). As shown in Figure 2, the dendrogram obtained from the Cluster analysis (Euclidean distance) reveals the formation of two main clusters, except samples P10 and P4, which are considered ‘outliers’, not being grouped with the others, which might be based on the predominant pollen in Asteraceae (Xanthium sp.) and only a few minor pollens for P10. The same was noticed for sample P4 which is predominant in Asteraceae T (Taraxacum sp.), followed by sample P9 predominant in Asteraceae H (Helianthus sp.). The following sub-cluster comprises samples P2, P3, and P7, which are mainly polyfloral. The last sub-cluster comprises samples P6 and P8, which are polyfloral, but with secondary pollen in Asteraceae J. The same was noticed for samples P1 and P5, which are predominant in Asteraceae J and secondary in Fabaceae. This approach shows that cluster analysis can discriminate the honey samples based on their botanical origin, even among polyfloral samples.

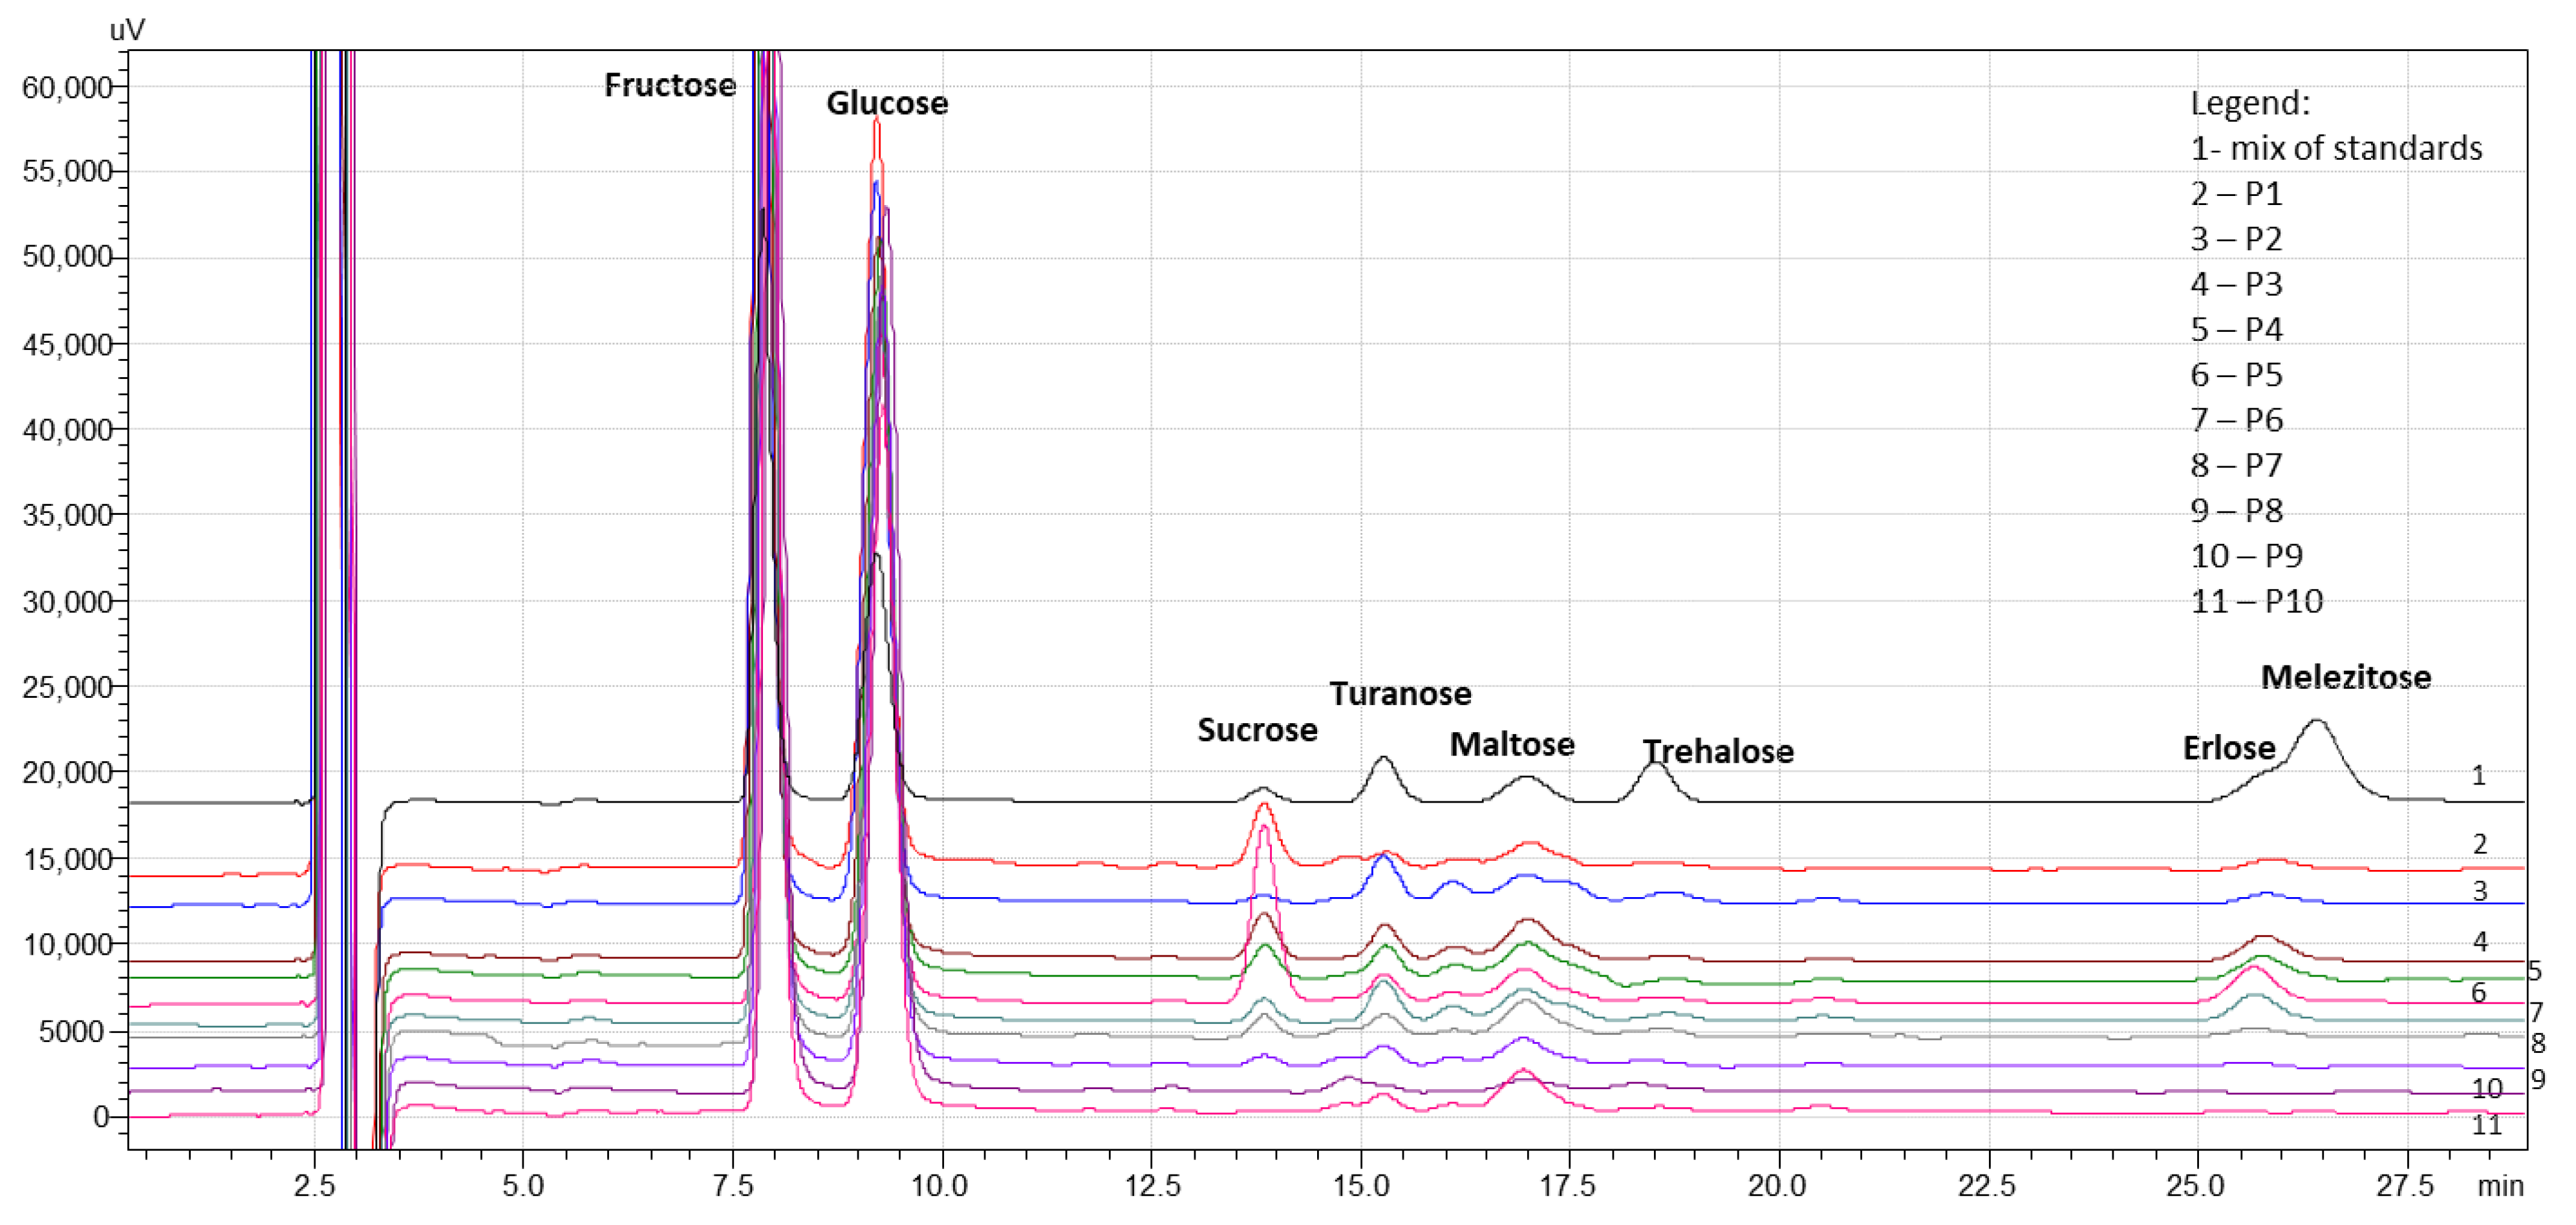
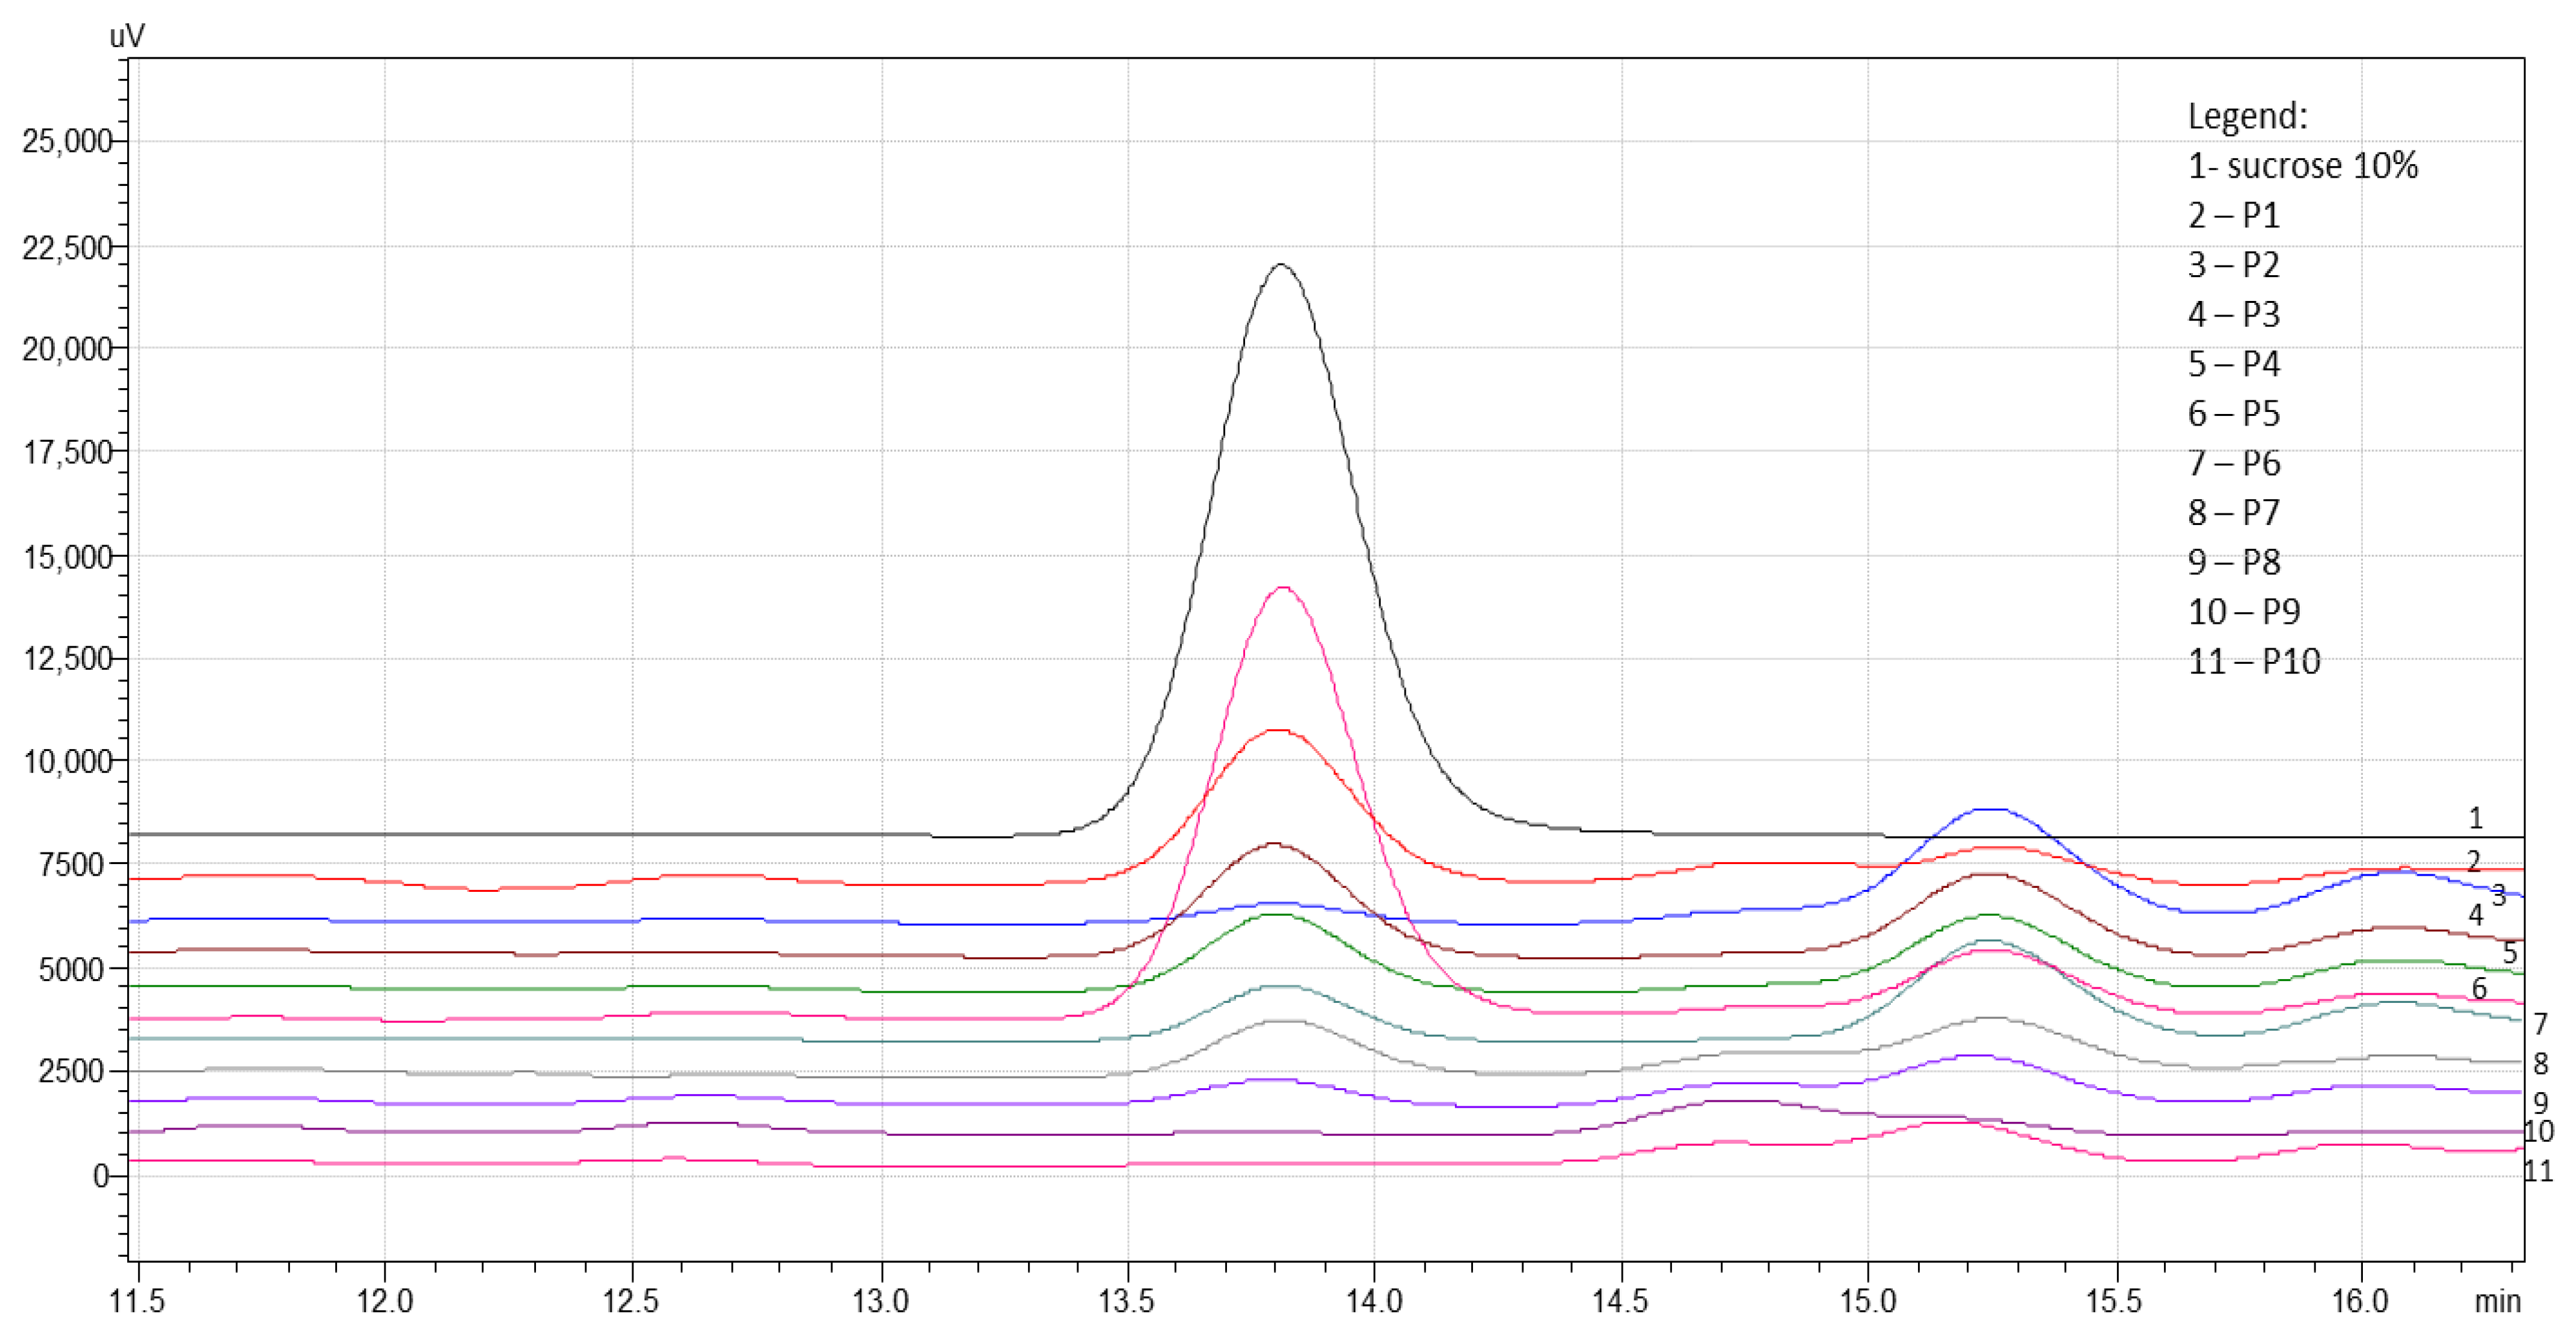
3.2. Physico-Chemical Parameters of Raw Honey Samples

Nutritional parameters for raw honey samples were made using the methods described previously. Table 2 presents the identified free sugars, moisture, proteins, and lipids in the analyzed samples. Seven sugars (Figure 3) were identified in the raw honey samples, fructose and glucose being the predominant ones. Sucrose, turanose, maltose, trehalose, and erlose were detected in low amounts. The higher concentrations in fructose were identified in samples P8 and P9, while glucose was identified in higher amounts in sample P9. Besides the reducing sugar analysis, the amount of sucrose is a very important parameter in evaluating the honeys’ maturity [7]. In addition, sucrose is an important fructooligosaccharide for the growing of the probiotic bacteria. Sucrose was quantified in higher amounts in sample P5 (7.44 ± 0.37%) (Figure 4), followed by sample P1 (3.06 ± 0.15%). The sugar and moisture results obtained in the present study are in accordance with those specified in national and European directive [41,42]. Only sucrose for P5 (7.44 ± 0.37%) exceeds more than 5 g/100 (probably the amounts in fresh honey was higher than in ripe honey). The protein content in analyzed honeys was in the range of 0.1–0.5% [16], and lipid content ranged between 0.07 and 0.42%.
A total of 13 micro and macro elements were identified and quantified in the analyzed samples (Table 3). Mineral content in honey is generally low, ranging between 0.02 and 0.3% in blossom honeys, while, in honeydew, honeys can reach 1% of the total [43,44]. Potassium is the main one, standing for 80% of the total, because of its quick secretion in nectar sources [45]. The amount of minerals present in honey does not significantly contribute to the dietary recommendations [16]. In the present study, higher amounts of potassium was identified (375.30 ± 19.3 mg/kg), as well as calcium (83.0 ± 4.26 mg/kg) and magnesium (69.7 ± 3.59 mg/kg), in P1 sample. Low concentrations of selenium (0.13–0.79 mg/kg), zinc (0.32–0.50 mg/kg), and manganese (0.07–7.26 mg/kg) were identified. Other microelements identified were Cu, Fe, Cr, and Ni, only in sample P3. The level of Na was below the detection limit of the method (4.0 μg/L). No heavy metals, such as cadmium and lead, were identified in the analyzed raw honey samples.
As shown in Figure 5, the dendrogram obtained from the Cluster analysis (Euclidean distance) reveals the formation of two clusters, with the exception of sample P1, which is an ‘outlier’, being distinct from the others due to its high content in the minerals K, Ca, and Mg. At the same time, a high content in sucrose and lower in lipids and trehalose is noticed. The following cluster comprises the samples P8 and P5, followed by samples P10 and P4, which display similar concentrations in fructose, glucose, and lipids, as well as in Ca, Se, and Cr. The next sub-cluster comprises samples P7, P9, and P3, which have similar protein values, as well as in the mineral K. The last sub-cluster comprises samples P6 and P2, with relatively close values in fructose, glucose, and moisture content. The same is noticed in the minerals Ca, K but also in those with lower values, such as Zn and Cr.
Low honey pH and acidic substances, such as aromatic acids and royal jelly acids, have been reported to play an important role on antibacterial activity of honeys [5,46]. In the present study (Table 4), the pH value range between 3.78 (P1)–4.21 (P6), and total acidity value between 15.5 (P4)–65.2 (P8) meq/kg. The recommended value for free acidity, as stated in the European regulations, is 50 mEq/kg [47]. Higher amounts in free acidity were obtained in sample P8 (34.1 meq/kg), followed by P1 (25.3 meq/kg). Higher values are indication of incipient sugar fermentation, leading to the presence of acetic acid, formed by alcohol hydrolysis [48].

3.3. Quality Parameters of Raw Honey Samples

HMF is a parameter of honey freshness, since it is absent or present in trace amounts in fresh honeys. Furthermore, the HMF content in honey is established by the Codex Alimentarius Standard Commission [42] at 40 mg/kg. The amount of HMF identified in the studied raw honey samples ranged between 1.65 ± 0.08 mg/kg (P6) and 19.7 ± 0.99 mg/kg (P9).
Diastase is also considered an indicator of honey freshness for authentic samples or possible adulteration with inverted sugars, when the content is very low [49]. The values obtained in our study were between 41.37 ± 2.06 (P8) and 9.12 ± 0.43 (P9).
Production of honey without residues showed Good Apicultural Practice. Antibiotic residues can originate from treatments against the brood diseases American Foul Brood (AFB) or European Foul Brood (EFB). Treatments with antibiotics are not allowed in the EU, while in many other countries they are widely used [50]. The levels of oxytetracycline and tetracycline were studied for the raw honey samples. Only one sample (P5) presented 95 μg/kg oxytetracycline. All other honeys were free of antibiotics.

3.4. Microbiological Results of Raw Honey Samples

In five raw honey samples (P1, P4, P5, P9, P10), we have identified probiotic bacteria (Table 5), processed further by DNA extraction (Figure 6) and BLASTn analysis of Bacteria 16S sequence. The probiotic bacteria were: Bacillus mycoides (P1), Bacillus thuringiensis (P4), Bacillus amyloliquefaciens (P5), Bacillus subtilis and Bacillus velezensis (P9), and B. thuringiensis and Bacillus velezensis (P10).
In addition to probiotic bacteria, other species have been identified in the analyzed raw honey samples (Table 5). The NTG value was between 1 × 10² (P1, P8) and 100 × 10⁶ (P3) CFU/mL. This aspect means that the beekeepers do not respect the Good Apicultural Practice and a correct hygiene in their apiary. No bacteria were identified in P2 and P7 samples.

3.5. Antibacterial Activity for the Identified Probiotic Bacteria

Bacillus subtilis complex species (B. subtilis, B. amyloliquefaciens, B. velezensis), identified in samples 1, 4, 5, 6, and 8, seems to have antibacterial activity especially against Gram-negative bacteria: Pseudomonas aeruginosa, Escherichia coli, followed by Salmonella enteritidis, but also against Gram-positive: Listeria monocytogenes and less against Staphylococcus aureus. No effect was observed against Enterococcus faecalis.
Antimicrobial activity of Bacillus spp. isolates against pathogenic bacteria is presented in Table 6 and Figure 7.

4. Discussion

This study represents a screening of some Romanian raw honeys collected from different geographic area and investigated the chemical characterization, microbiological examination and probiotic effect for these honeys. The general effects of geographic origin on the chemical and microbiological characterization for honey have been reported previously [1,5,6,7,8,16,30,51,52,53,54]. From the ten different geographical locations, the botanical origin shows similarities, and, according to palynological examination and chemical characterization, the samples can be framed as polyfloral honey. Generally, this type of honey has water content below 20% [51,52], which can be observed also in this study. Regarding the sugar spectrum, the higher concentrations in fructose and glucose was registered for west (P9) and south-east (P8) of the country, while sucrose was in higher amounts in north-west of the country (P5 and P1). Fructooligosaccharides (sucrose), but also other oligosaccharides, can contribute as a nutritional ingredient, together with other prebiotic bacteria [9] from honeybee gut, to growing the probiotic bacteria, which have efficacy against pathogens [55]. Another important parameter for stimulating the growth and/or activity of the probiotic bacteria is the acidity. These bacteria need low acidity for development. The raw honey samples with low acidity and pH was registered in north-west (P1) and south-east (P8) of the country. The free acidity content of honey describes the presence and amount of organic acids, like butyric, acetic, formic, lactic, succinic, pyrogutamic, malic, and citric acids in equilibrium with their corresponding lactones, or internal esters, and some inorganic ions, such as phosphate [56,57]. Higher values were registered in samples from south-east (P8) of the country. The quality of honey is very important when this bee product is used as natural antibiotic or as a nutritional supplement. In this context, we evaluated the HMF, diastase, contaminants from the class of antibiotics, and heavy metals from analyzed honey samples. In addition, in the north-west (P3) and in the center (P10) of the country, we found higher levels of Zn. This microelement together with the prebiotic and probiotic bacteria from honey increasing its antibacterial activity.
After the microbiological examination seven Bacillus spp. isolates were identified in the raw honey samples: in the north-west (P1, P5) of the country: Bacillus mycoides and Bacillus amyloliquefaciens; in the north (P4) of the country: Bacillus thuringiensis; in the west of the country (P9): Bacillus subtilis, Bacillus velezensis; and in the center (P10) of the country: B. thuringiensis, Bacillus velezensis. Leuconostoc mesenteroides ssp cremoris [58] was identified in a single sample. It is recognized as a potential probiotic, and its effect on Candida albicans [59] was studied before. Probiotic bacteria can be found in raw, unfiltered honey, including Lactobacilli and Bifidobacteria [17]. Esawy et al. (2012) [17] also found and isolated from different honey sources, probiotic bacteria, such as B.subtilis, B.licheniforms, B. amyloliquefaciens, B. thuringiensis, B. cereus, B. pseudomycoides, and B. mycoides. In the present study, no Lactobacilli or Bifidobacteria were identified. In addition, opportunistic pathogens were identified: Ewingella americana [60], Staphylococcus hominis ssp. Hominis [61], S. haemolyticus, S. warneri, S. epidermidis [62], Aerococcus viridans [63], Leuconostoc mesenteroides ssp cremoris [58,64], Corynebacterium amycolatum [65], and Candida glabrata [66]. Despite the pathogenic potential of these species, the low value of NTG in the tested samples indicate a low risk for consumers, with the exception of the sample P3, in which two potentially pathogenic bacteria in a high concertation (>106 CFU/mL) were detected.
Bacillus subtilis complex species identified have antibacterial activity against Gram-positive and Gram-negative bacteria, which we have demonstrated in this research study. In addition, literature studied [67] showed antimicrobial activity of probiotic bacteria (B. endophyticus and B. subtilis) against different pathogenic species. B. subtilis had higher antimicrobial activity against all tested bacteria, except Staphylococcus aureus and C. albicans, while B. endophyticus showed antimicrobial activities against B.cereus, C. albicans, C. trobicales, and Saccharomyces cerevisiae. In addition, B. subtilis had antimicrobial activity against Staphylococcus aureus. Sabate et al. (2012) [68] demonstrated that in vivo administration of B. subtilis subsp. subtilis Mori2 had three beneficial effects on bee colonies: an increase in open and operculated brood, greater accumulation of honey compared to the control hives, and a healthier hive, due to the reduction of Varroa and Nosema incident rates.

5. Conclusions

In the samples from the north-west of the country (P1 and P5), being distinct from the others due to its high content in minerals, a high content in sucrose and lower in lipids and trehalose is noticed. More studies on different maturity stages of honey are needed to certify the level of different constituents and their connection to health promoting properties related to the presence of probiotics bacteria.
Honey possesses natural antibacterial activity due to factors, such as botanical and geographical origin, sugar content, acidity, and other chemical compounds. In this study, we demonstrated that raw honey from different area could have probiotic potential, predominantly from the Bacillus subtilis complex species. In conclusion, Romanian raw honey can be a potential reservoir of probiotics, which confer a health benefit for consumers.

Author Contributions

All authors contribute equally at the manuscript preparation. All authors have read and agreed to the published version of the manuscript.

Funding

This work was supported by a grant of the Ministry of Research, Innovation and Digitization, CNCS/CCCDI—UEFISCDI, project number PN-III-P1-1.1-PD-2019-0498, within PNCDI III.

Institutional Review Board Statement

Not applicable.

Informed Consent Statement

Not applicable.

Data Availability Statement

Not applicable.

Conflicts of Interest

The authors declare no conflict of interest.

References

  1. Albu, A.; Radu-Rusu, C.G.; Pop, I.M.; Frunza, G.; Nacu, G. Quality Assessment of Raw Honey Issued from Eastern Romania. Agriculture 2021, 11, 247. [Google Scholar] [CrossRef]
  2. Shamala, T.R.; Jyothi, Y.S.; Saibaba, P. Stimulatory effect of honey on multiplication of lactic acid bacteria under in vitro and in vivo conditions. Lett. Appl. Microbiol. 2000, 30, 453–455. [Google Scholar] [CrossRef] [Green Version]
  3. Wallace, A.; Eady, S.; Miles, M.; Martin, H.; McLachlan, A.; Rodier, M.; Willis, J.; Scott, R.; Sutherland, J. Demonstrating the safety of manuka honey UMF® 20+in a human clinical trial with healthy individuals. Br. J. Nutr. 2009, 103, 1023–1028. [Google Scholar] [CrossRef] [PubMed] [Green Version]
  4. Sarkar, S.; Chandra, S. Honey as a functional additive in yoghurt—A review. Nutr. Food Sci. 2020, 50, 168–178. [Google Scholar] [CrossRef]
  5. Kwakman, P.H.S.; Zaat, S.A.J. Critical Review-Antibacterial Components of Honey. UBMB Life 2012, 64, 48–55. [Google Scholar] [CrossRef]
  6. European Union Council Directive 2001/110/EC. Available online: https://eur-lex.europa.eu/legal-content/RO/TXT/PDF/?uri=CELEX:32001L0110&from=EN (accessed on 17 March 2021).
  7. da Silva, P.M.; Gauche, C.; Gonzaga, L.V.; Costa, A.C.O.; Fett, R. Honey: Chemical composition stability and authenticity. Food Chem. 2015, 196, 309–323. [Google Scholar] [CrossRef]
  8. Alnaimat, S.; Wainwright, M.; Al’Abri, K. Antibacterial potential of honey from different origins: A comparision with Manuka honey. J. Microbiol. Biotechnol. Food Sci. 2012, 1, 1328–1338. [Google Scholar]
  9. Flores-Maltos, D.A.; Mussatto, S.I.; Contreras-Esquivel, J.C.; Rodrıguez-Herrera, R.; Teixeira, J.A.; Aguilar, C.N. Biotechnological production and application of fructooligosaccharides. Crit. Rev. Biotechnol. 2014, 36, 259–267. [Google Scholar] [CrossRef] [Green Version]
  10. Luchese, R.H.; Prudêncio, E.R.; Guerra, A.F. Honey as a Functional Food. In Honey Analysis; IntechOpen: London, UK, 2018. [Google Scholar] [CrossRef] [Green Version]
  11. Viuda-Martos, M.; Ruiz-Navajas, Y.; Fernández-López, J.; Pérez Álvarez, J.A. Functional properties of honey, propolis, and royal jelly. J. Food Sci. 2018, 73, R117–R124. [Google Scholar] [CrossRef]
  12. Gibson, G.R.; Roberfroid, M.B. Dietary modulation of the human colonic microbiota: Introducing the concept of prebiotics. J. Nutr. 1995, 125, 1401–1412. [Google Scholar] [CrossRef]
  13. Pandiyan, C.; Annal, V.R.; Kumaresan, G.; Murugan, B.; Gopalakrishnamurthy, T.R. In vivo and in vitro effect of Lactobacillus acidophilus in synbiotic ice cream enriched with whey protein concentrate. Int. Food. Res. J. 2012, 19, 441–446. [Google Scholar]
  14. Shin, H.S.; Ustunol, Z. Carbohydrate composition of honey from different floral sources and their influence on growth of selected intestinal bacteria: An in vitro comparison. Food Res. Int. 2005, 38, 721–728. [Google Scholar] [CrossRef]
  15. Sabater-Molina, M.; Larque, E.; Torrella, F.; Zamora, S. Dietary fructooligosaccharides and potential benefits on health. J. Physiol. Biochem. 2009, 65, 315–328. [Google Scholar] [CrossRef] [PubMed]
  16. Machado De-Meloa, A.A.; de Almeida-Muradian, L.B.; Sancho, M.T.; Pascual-Mate, A. Composition and properties of Apis mellifera honey: A review. J. Apic. Res. 2017, 57, 5–37. [Google Scholar] [CrossRef]
  17. Esawy, M.A.; Awad, G.E.A.; Ahmed, E.F.; Danial, E.N.; Mansour, N.M. Evaluation of honey as a new reservoir for probiotic bacteria. Adv. Food Sci. 2012, 34, 72–81. [Google Scholar]
  18. Olofsson, T.C.; Vásquez, A. Detection and identification of a novel lactic acid bacterial flora within the honey stomach of the honeybee Apis mellifera. Curr. Microbiol. 2008, 57, 356–363. [Google Scholar] [CrossRef]
  19. Das, A.; Datta, S.; Mukherjee, S.; Bose, S.; Ghosh, S.; Dhar, P. Evaluation of antioxidative, antibacterial and probiotic growth stimulatory activities of Sesamum indicum honey containing phenolic compounds and lignans. LWT Food Sci. Technol. 2015, 61, 244–250. [Google Scholar] [CrossRef]
  20. Isolauri, E.; Salminen, S.; Ouwehand, A. Microbial-Gut Interactions in Health and Disease. Probiotics Best Pract. Res. Clin. Gastroenterol. 2004, 18, 299–313. [Google Scholar] [CrossRef]
  21. Kalhoro, M.S.; Nguyen, L.T.; Anal, A.K. Evaluation of probiotic potentials of the lactic acid bacteria (LAB) isolated from raw buffalo (Bubalus bubalis) milk. Pak. Vet. J. 2019, 39, 395–400. [Google Scholar] [CrossRef]
  22. Wang, M.; Zhao, W.Z.; Xu, H.; Wang, Z.W.; He, S.Y. Bacillus in the guts of honey bees. (Apis mellifera; Hymenoptera: Apidae) mediate changes in amylase values. Eur. J. Entomol. 2015, 112, 619–624. [Google Scholar] [CrossRef]
  23. Hamdy, A.A.; Elattal, N.A.; Amin, M.A.; Ali, A.E.; Mansour, N.M.; Awad, G.E.A.; Awad, H.M.; Esawy, M.A. Possible correlation between levansucrase production and probiotic activity of Bacillus sp. isolated from honey and honey bee. World J. Microbiol. Biotechnol. 2017, 33, 69. [Google Scholar] [CrossRef] [PubMed]
  24. SCAN. Opinion of the Scientific Committee on Animal Nutrition, on the Criteria for Assessing the Safety of Microorganisms Resistant to Antibiotics of Human Clinical and Veterinary Importance. European Commission, Health and Consumer Protection Directorate-General. (SCAN) Scientific Committee on Animal Nutrition. 2003. Available online: https://www.efsa.europa.eu/en/efsajournal/pub/223 (accessed on 17 March 2021).
  25. Sabate, D.C.; Carrillo, L.; Audisio, M.C. Inhibition of Paenibacillus larvae and Ascosphaera apis by Bacillus subtilis isolated from honeybee gut and honey samples. Res. Microbiol. 2009, 60, 163–169. [Google Scholar] [CrossRef]
  26. Louveaux, J.; Maurizio, A.; Vorwohl, G. Methods of melissopalynology. Bee World 1978, 59, 139–157. [Google Scholar] [CrossRef]
  27. International Honey Commision (IHC). Harmonised Methods of the International Honey Commission. 2009. Available online: https://www.ihc-platform.net/ihcmethods2009.pdf (accessed on 24 March 2021).
  28. Bonta, V.; Mărghiraş, L.A.; Stanciu, O.; Laslo, L.; Dezmirean, D.; Bobiş, O. High-performance liquid chromatographic analysis of sugars in Transilvanian honey. Bull. UASVM Anim. Sci. Biotechnol. 2008, 65, 229–232. [Google Scholar] [CrossRef]
  29. Almeida-Muradian, L.B.; Pamplona, L.C.; Coimbra, S.; Barth, O.M. Chemical composition and botanical evaluation of dried bee pollen pellets. J. Food. Compos. Anal. 2005, 18, 105–111. [Google Scholar] [CrossRef]
  30. Azeredo, L.D.C.; Azeredo, M.A.; de Souza, S.; Dutra, V.M. Protein contents and physicochemical properties in honey samples of Apis mellifera of different floral origins. Food Chem. 2003, 80, 249–254. [Google Scholar] [CrossRef]
  31. Paşca, C.; Mărghitaş, L.A.; Dezmirean, D.S.; Bobiş, O.; Bonta, V.; Mihăiescu, T.C.; Chirilă, F.; Fiţ, N. Mineral profile evolution of some medicinal plants with antibacterial effects. Bull. Univ. Agric. Sci. Vet. Med. Cluj Napoca 2016, 73, 223–229. [Google Scholar] [CrossRef] [Green Version]
  32. Pașca, C.; Mărghitaș, L.; Dezmirean, D.; Bobiș, O.; Bonta, V.; Chirilă, F.; Matei, I.; Fiț, N. Medicinal plants based products tested on pathogens isolated from mastitis milk. Molecules 2017, 22, 1473. [Google Scholar] [CrossRef] [PubMed] [Green Version]
  33. Diastase Activity (α-Amylase) in Honey, Megazyme, 2014. Available online: https://prod-media.megazyme.com/media/pdf/97/5a/62/T-AMZHY.pdf (accessed on 5 April 2021).
  34. Mertens, D.R. Multiple Tetracycline Residues in Milk Metal Chelate Affinity—Liquid Chromatographic Method. AOAC Official Methods of Analysis 1995 (33.2.62). Available online: https://members.aoac.org/AOAC_Docs/ISPAM/ISPAMMtgs/063011_Mtg_Book_ISPAM_chem.pdf (accessed on 22 June 2021).
  35. Bonta, V.; Mărghitaş, L.A.; Dezmirean, D.; Moise, A.; Bobiş, O.; Maghear, O. Optimization of HPLC method for quantifying tetracycline residues in honey. Bull. Univ. Agric. Sci. Vet. Med. Cluj Napoca Anim. Sci. Biotechnol. 2007, 63–64, 186–190. [Google Scholar]
  36. Rouzé, R.; Moné, A.; Delbac, F.; Belzunces, L.; Blot, N. The honeybee gut microbiota is altered after chronic exposure to different families of insecticides and infection by Nosema ceranae. Microbes Environ. 2019, 34, 226–233. [Google Scholar] [CrossRef] [Green Version]
  37. Tonooka, T.; Sakata, S.; Kitahara, M.; Hanai, M.; Ishizeki, S.; Takada, M.; Sakamoto, M.; Benno, Y. Detection and quantification of four species of the genus Clostridium in infant feces. Microbiol. Immunol. 2005, 49, 987–992. [Google Scholar] [CrossRef] [PubMed]
  38. Pașca, C.; Mărghitaș, L.A.; Dezmirean, D.; Bobiș, O.; Bonta, V.; Mărgăoan, R.; Chirilă, F.; Fit, N. The Assessment of the Antibacterial Activity of some Plant Extracts on Normal and Pathogenic Microflora from Milk. Sci. Pap. Anim. Sci. Biotechnol. 2015, 48, 166–172. [Google Scholar]
  39. Ward, J.J.H. Hierarchical grouping to optimize an objective function. J. Am. Stat. Assoc. 1963, 58, 236–244. [Google Scholar] [CrossRef]
  40. Hammer, Ø.; Harper, D.A.; Ryan, P.D. PAST: Paleontological statistics software package for education and data analysis. Palaeontol. Electron. 2001, 4, 9. [Google Scholar]
  41. Directiva 2014/63/UE a Parlamentului European și a Consiliului din 15 mai, 2014. Available online: https://eur-lex.europa.eu/legal-content/RO/TXT/PDF/?uri=CELEX:32014L0063&from=RO (accessed on 5 April 2021).
  42. STANDARD FOR HONEY CXS 12-19811 Adopted in 1981. Revised in 1987, 2001. Amended in 2019. Available online: http://www.fao.org/fao-who-codexalimentarius (accessed on 5 May 2021).
  43. Crane, E. A Book of Honey; Oxford University Press: Oxford, UK; New York, NY, USA, 1980. [Google Scholar]
  44. Felsner, M.L.; Cano, C.B.; Matos, J.R.; Almeida-Muradian, L.B.; Bruns, R.E. Optimization of thermogravimetric analysis of ash content in honey. J. Braz. Chem. Soc. 2004, 15, 797–802. [Google Scholar] [CrossRef]
  45. Ortiz-Valbuena, A.; Fernández-Maeso, M.C.; Sabra Munoz De La Torre, E. The main characteristics of the honey from Alcarria. Toledo: Consejerı’a de Agricultura y Medio Ambiente de La Junta de Comunidades de Castilla-La Mancha, Marchamalo, Spain, 1996. Available online: https://agris.fao.org/agris-search (accessed on 22 March 2021).
  46. Bogdanov, S. Nature and origin of the antibacterial substances in honey. LWT Food Sci. Technol. 1997, 30, 748–753. [Google Scholar] [CrossRef] [Green Version]
  47. Pauliuc, D.; Dranca, F.; Oroian, M. Raspberry, rape, thyme, sunflower and mint honeys authentication using voltammetric tongue. Sensors 2020, 20, 2565. [Google Scholar] [CrossRef] [PubMed]
  48. Geană, E.I.; Ciucure, C.T.; Costinel, D.; Ionete, R.E. Evaluation of honey in terms of quality and authenticity based on the general physicochemical pattern, major sugar composition and Δ13C signature. Food Control 2019, 109, 106919. [Google Scholar] [CrossRef]
  49. Cianciosi, D.; Forbes-Hernández, T.Y.; Afrin, S.; Gasparrini, M.; Reboredo-Rodriguez, P.; Manna, P.P.; Zhang, J.; Lamas, L.B.; Flórez, S.M.; Toyos, P.A.; et al. Phenolic compounds in honey and their associated health benefits: A Review. Molecules 2018, 23, 2322. [Google Scholar] [CrossRef] [PubMed] [Green Version]
  50. Bogdanov, S. Honey Control and Trade, Book of Honey, Chapter 7, Bee Product Science. Available online: www.bee-hexagon.net (accessed on 5 April 2021).
  51. Bogdanov, S. Honey Composition, The Honey Book, Chapter 5, Bee Product Science. Available online: www.bee-hexagon.net (accessed on 5 May 2021).
  52. Mădas, N.M.; Mărghitas, L.M.; Dezmirean, D.S.; Bonta, V.; Bobis, O.; Fauconnier, L.M.; Francis, F.; Haubruge, E.; Nguyen, K.B. Volatile Profile and Physico-Chemical Analysis of Acacia Honey for Geographical Origin and Nutritional Value Determination. Foods 2019, 8, 445. [Google Scholar] [CrossRef] [PubMed] [Green Version]
  53. Mărghitas, L.M.; Dezmirean, D.S.; Moise, M.; Bobis, O.; Laslo, L.; Bogdanov, S. Physico-chemical and bioactive properties of different floral origin honeys from Romania. Food Chem. 2009, 112, 863–867. [Google Scholar] [CrossRef]
  54. Isopescu, R.D.; Josceanu, A.M.; Minca, I.; Colta, T.; Postelnicescu, P.; Mateescu, C. Characterization of Romanian Honey Based on Physico-Chemical Properties and Multivariate Analysis. Rev. Chim. 2014, 65, 4. [Google Scholar]
  55. Mohan, A.; Quek, S.Y.; Gutierrez-Maddox, N.; Gao, Y.; Shu, Q. Effect of honey in improving the gut microbial Balance. Food Qual. Saf. 2017, 1, 107–115. [Google Scholar] [CrossRef]
  56. Codex Alimentarius. Revised Standard for Honey. Codex Standard, 12-1981. Rome, Italy, 1987. Available online: http://www.fao.org/fao-who-codexalimentarius (accessed on 7 May 2021).
  57. Shahnawaz, M.; Sheikh, S.A.; Hussain, M.; Razaq, A.; Khan, S.S. A study of the determination of the physiochemical properties of honey from different valleys of Gilgit—Baltistan. Int. J. Agric. Sci. Res. 2013, 2, 49–53. [Google Scholar]
  58. Kekkonen, R.A.; Kajasto, E.; Miettinen, M.; Veckman, V.; Korpela, R.; Julkunen, I. Probiotic Leuconostoc mesenteroides ssp. cremoris and Streptococcus thermophilus induce IL-12 and IFN-γ production. World J. Gastroenterol. 2008, 14, 1192. [Google Scholar] [CrossRef]
  59. Salman, J.A.; Ajah, H.A.; Khudair, A.Y. Analysis and Characterization of Purified Levan from Leuconostoc mesenteroides ssp. cremoris and its Effects on Candida albicans Virulence Factors. Jordan J. Biol. Sci. 2019, 12, 2. [Google Scholar]
  60. Pound, M.W.; Tart, S.B.; Okoye, O. Multidrug-resistant Ewingella americana: A case report and review of the literature. Ann. Pharmacother. 2007, 41, 2066–2070. [Google Scholar] [CrossRef] [PubMed]
  61. Voineagu, L.; Braga, V.; Botnarciuc, M.; Barbu, A.; Tataru, M. Emergence of Staphylococcus hominis strains in general infections. ARS Med. Tomitana 2012, 18, 80–82. [Google Scholar] [CrossRef] [Green Version]
  62. Asante, J.; Amoako, D.G.; Abia, A.L.; Somboro, A.M.; Govinden, U.; Bester, L.A.; Essack, S.Y. Review of clinically and epidemiologically relevant coagulase-negative Staphylococci in Africa. Microb. Drug Resist. 2020, 26, 951–970. [Google Scholar] [CrossRef] [PubMed] [Green Version]
  63. Ezechukwu, I.; Singal, M.; Igbinosa, O. Aerococcus viridans: Case report, microbiology, and literature review. Am. J. Med. Case Rep. 2019, 20, 697. [Google Scholar] [CrossRef]
  64. Bou, G.; Saleta, J.L.; Nieto, J.A.; Tomás, M.; Valdezate, S.; Sousa, D.; Lueiro, F.; Villanueva, R.; Pereira, M.J.; Llinares, P. Nosocomial outbreaks caused by Leuconostoc mesenteroides subsp. mesenteroides. Emerg. Infect. Dis. 2008, 14, 968. [Google Scholar] [CrossRef] [PubMed]
  65. Knox, K.L.; Holmes, A.H. Nosocomial endocarditis caused by Corynebacterium amycolatum and other nondiphtheriae corynebacteria. Emerg. Infect. Dis. 2002, 8, 97. [Google Scholar] [CrossRef] [PubMed]
  66. Silva, S.; Negri, M.; Henriques, M.; Oliveira, R.; Williams, D.W.; Azeredo, J. Candida glabrata, Candida parapsilosis and Candida tropicalis: Biology, epidemiology, pathogenicity and antifungal resistance. FEMS Microbiol. Rev. 2012, 36, 288–305. [Google Scholar] [CrossRef] [PubMed] [Green Version]
  67. Abdel Wahab, W.A.; Saleh, S.A.A.; Karam, E.A.; Mansour, N.M.; Esawy, M.A. Possible correlation among osmophilic bacteria, levan yield, and the probiotic activity of three bacterial honey isolates. Biocatal. Agric. Biotechnol. 2018, 14, 386–394. [Google Scholar] [CrossRef]
  68. Sabaté, D.C.; Cruz, M.S.; Benítez-Ahrendts, M.R.; Audisio, M.C. Beneficial effects of Bacillus subtilis subsp. subtilis Mori2, a honey associated strain, on honeybee colony performance. Probiotics Antimicrob. Proteins 2012, 4, 39–46. [Google Scholar] [CrossRef]
Figure 1. Geographical spread of raw honey samples (P1–P10).
Applsci 11 05816 g001
Figure 2. Hierarchical clustering of the honey samples based on melissopalynological analysis (Euclidean distance, r = 0.95).
Applsci 11 05816 g002
Figure 3. Chromatogram of the identified carbohydrates in the raw honey samples.
Applsci 11 05816 g003
Figure 4. Chromatogram of sucrose standard solution 10% (black) and analyzed samples (colored signals).
Applsci 11 05816 g004
Figure 5. Hierarchical clustering of the honey samples based on physico-chemical parameters (Euclidean distance, r = 0.76).
Applsci 11 05816 g005
Figure 6. PCR amplification of bacteria DNA (1481 bp) Lines 1 and 15: 1500 bp DNA ladder, lines 2–6 and 8–12 bacterial DNA positive amplification (~1481 bp), lines 7 and 14 positive control, line 13 negative control.
Applsci 11 05816 g006
Figure 7. Antimicrobial activity of Bacillus spp. strains (1 = B. subtilis, 2 = B. thuringiensis 1, 3 = B. mycoides, 4 = B. amyloliquefaciens, 5 = B. velezensis 1, 6 = B. velezensis 2, 7 = B. thuringiensis 2, 8 = B. velezensis 3, N = negative control-central) against Enterococcus faecalis (a), Staphylococcus aureus (b), Listeria monocytogenes (c), Esherichia coli (d), Salmonella enteritidis (e), Pseudomonas aeruginosa (f).
Applsci 11 05816 g007
Table 1. Melissopalynological analysis of the studied honey samples.
SamplePredominant Pollen (>45%)Secondary Pollen 
(16–45%)
Important Minor Pollen 
(3–15%)
Minor Pollen 
(<3%)
FamilySpecieFamilySpecieFamilySpecieFamilySpecie
P1Asteraceae JCentaurea  
montana type
Asteraceae S 
Brassicaceae 
Lamiaceae 
Asteraceae A 
Fabaceae
Cirsium type 
Brassica sp. 
 
Matricaria sp.
Asteraceae T 
Asteraceae H 
Geraniaceae 
Poaceae 
Apiaceae 
Rosaceae  
Cornaceae  
Plantaginaceae  
Caryophyllaceae
Taraxacum sp. 
Helianthus sp. 
 
Zea mays * 
 
Rubus sp. 
Cornus sp. 
Plantago sp. *
P2 BrassicaceaeBrassica sp.Ericaceae  
Rosaceae 
 
Lamiaceae 
Scophulariaceae 
Fabaceae 
Fagaceae
 
Prunus sp. 
Filipendula sp. 


Quecus sp. *
Asteraceae J 
 
Asteraceae H 
Plantaginaceae 
Asteraceae T 
Asteraceae A 
Rosaceae  
Poaceae* 
Salicaceae
Centaurea  
montana type 
Helianthus sp. 
Plantago sp. * 
Taraxacum sp. 
Matricaria sp. 
Rubus sp. 
 
Salix sp.
P3 Asteraceae H 
Asteraceae T 
Fabaceae
Bellis sp. 
Taraxacum sp.
Asteraceae  
 
Apiaceae 
Asteraceae S
Artemisia sp. * 
Ambrosia sp. * 
 
Cirsium type
Asteraceae A 
Asteraceae J 
Tiliaceae  
Ranunculaceae 
Salicaceae 
Brassicaceae 
Rosaceae  
Plantaginaceae 
Asteraceae H 
Scrophulariaceae 
Poaceae
Matricaria sp. 
Centaurea sp. 
Tilia sp. 
 
Salix sp. 
 
Rubus sp. 
Plantago sp. * 
Helianthus sp. 
 
Zea mays *
P4Asteraceae TTaraxacum sp. AsteraceaeAmbrosia sp. *Brassicaceae 
Fabaceae 
Asteraceae A 
Caryophyllaceae 
Rosaceae 
Asteraceae S 
Salicaceae 
Asteraceae J 
 
Ericaceae
 
 
Matricaria sp. 
 
Filipendula sp. * 
Cirsium type 
Salix sp. 
Centaurea montana 
type
P5 Asteraceae J 
 
 
Fabaceae
Centaurea  
montana 
type
Lamiaceae 
Asteraceae S 
Apiaceae 
Rosaceae 
Scrophulariaceae
 
Cirsium type
Tiliaceae  
Asteraceae A 
Asteraceae H 
Asteraceae T 
Boraginaceae 
Geraniaceae 
Loranthaceae 
Caryophyllaceae
Tilia sp. 
Matricaria sp. 
Helianthus sp. 
Taraxacum sp. 
Symphytum sp. 
 
Loranthus europaeus
P6 Asteraceae J 
 
 
Asteraceae T
Centaurea sp. 
montana 
type 
Taraxacum sp.
Asteraceae S 
Asteraceae A 
Asteraceae  
Amaranthaceae 
Asteraceae
Cirsium type 
Matricaria sp. 
Artemisia sp. * 
 
Ambrosia sp. *
Brassicaceae 
Fabaceae 
Apiaceae 
Lamiaceae 
Poaceae 
Scrophulariaceae 
Asteraceae H
Brassica sp. 


Zea mays * 
 
Bellis type
P7 Boraginaceae  
Asteraceae H
Echium sp. 
Helianthus sp.
Asteraceae H 
Plantaginaceae 
Fabaceae 
Brassicaceae 
Scrophulariaceae 
Lamiaceae 
Asteraceae A 
Rosaceae  
Bellis type  
Plantago sp.* 
 
Brassica sp. 
 
 
Matricaria sp.
Asteraceae  
Geraniaceae 
Asteraceae T 
Apiaceae 
Poaceae  
Asteraceae 
Poaceae * 
Asteraceae S 
Polygonaceae
Ambrosia sp. * 
 
Taraxacum sp. 
 
Zea mays * 
Artemisia sp.* 
 
Cirsium type 
Rumex sp. *
P8 Asteraceae J 
 
 
Asteraceae H 
Lamiaceae 
Centaurea  
montana  
type 
Helianthus sp.
Fabaceae 
Geraniaceae 
Asteraceae S 
Rosaceae  
Asteraceae A 
Asteraceae T 
Brassicaceae 
Plantaginaceae
 
 
Cirsium type 
Rubus sp. 
Matricaria sp. 
Taraxacum sp. 
Brassica sp. 
Plantago sp. *
Asteraceae C 
 
Poaceae 
Onagraceae
Centaurea  
cyanus 
Zea mays * 
Epilobium sp.
P9Asteraceae HHelianthus sp. Boraginaceae  
Fabaceae 
Rosaceae
Echium sp. 
 
Rubus sp.
Asteraceae H 
Boraginaceae  
Rosaceae  
Amaranthaceae 
Asteraceae S 
Brassicaceae 
Betulaceae
Bellis type  
Echium sp. 
Filipendula sp. * 
 
Cirsium type 
Brassica sp. 
Corylus sp. *
P10AsteraceaeXanthium sp.* Cyperaceae * 
Asteraceae T 
Plantaginaceae
 
Taraxacum sp. 
Plantago sp. * 
Amaranthaceae 
Asteraceae 
Asteraceae A 
Apiaceae 
Rosaceae 
Asteraceae S 
Lamiaceae 
Poaceae* 
Ranunculaceae 
Asteraceae
 
Artemisia sp. * 
Matricaria sp. 
 
Rubus sp. 
Cirsium type 


Ambrosia sp. *
*—non-nectariferous plants.
Table 2. Sugar, moisture, proteins, and lipids results from raw honeys samples.
Honey 
Samples
Fructose 
(%)
Glucose 
(%)
Sucrose 
(%)
Turanose 
(%)
Maltose 
(%)
Trehalose 
(%)
Erlose 
(%)
Moisture 
(%)
Proteins 
(%)
Lipides 
(%)
P138.8 (2.02) a32.8 (1.57) cb3.06 (0.15) b0.83 (0.04) g2.4 (0.11) d0.17 (0.01) e0.78 (0.04) c16.0 (0.78) cb0.12 (0.00) d0.07 (0.00) g
P238.1 (1.95) a32.2 (1.53) cb0.39 (0.01) e2.27 (0.11) a2.8 (0.14) dc1.06 (0.05) a0.95 (0.04) c16.4 (0.80) cb0.29 (0.01) b0.30 (0.01) b
P337.7 (1.91) a32.8 (1.56) cb1.93 (0.09) c1.64 (0.08) c3.94 (0.19) a0.39 (0.02) d2.06 (0.10) b14.4 (0.71) c0.17 (0.00) c0.21 (0.01) d
P436.5 (1.85) a33.5 (1.61) cb1.33 (0.06) d1.79 (0.08) c3.37 (0.16) b0.54 (0.02) c2.20 (0.10) b16.1 (0.76) cb0.06 (0.00) e0.19 (0.01) ed
P536.2 (1.82) a29.4 (1.41) c7.44 (0.37) a1.49 (0.07) dc3.25 (0.16) b0.39 (0.02) d3.13 (0.16) a14.8 (0.74) cb0.10 (0.00) d0.16 (0.01) fe
P638.5 (1.90) a32.1 (1.63) cb1.01 (0.04) d1.97 (0.09) b3.19 (0.15) cb0.80 (0.04) b2.28 (0.11) b17.0 (0.82) ba0.02 (0.00) f0.15 (0.00) fe
P737.6 (1.85) a34.1 (1.74) cb1.07 (0.05) d1.31 (0.06) ed3.32 (0.16) b0.47 (0.02) dc0.75 (0.04) c16.7 (0.79) ba0.21 (0.01) c0.29 (0.01) b
P840.1 (1.95) a34.1 (1.68) b0.42 (0.02) e1.10 (0.05) fe2.52 (0.13) d0.22 (0.01) e0.37 (0.02) d16.0 (0.82) cb0.28 (0.01) b0.25 (0.01) c
P940.1 (1.94) a39.4 (1.89) a0.08 (0.00) e0.27 (0.01) h1.14 (0.05) e0.40 (0.02) dnd15.9 (0.82) cb0.18 (0.01) c0.42 (0.02) a
P1036.9 (1.89) a31.9 (1.52) cb0.18 (0.01) e1.01 (0.05) gf3.87 (0.19) a0.25 (0.01) end19.0 (0.95) a0.48 (0.02) a0.15 (0.01) f
The values are mean of three samples (n = 3, standard deviation in parentheses), analyzed individually in triplicate. Different letters within a column denote significant differences (p < 0.05); nd = not detectable.
Table 3. Minerals results from raw honey samples.
Honey  
Samples
Ca 
(mg/kg)
Mg 
(mg/kg)
Cu 
(mg/kg)
Fe 
(mg/kg)
Mn 
(mg/kg)

(mg/kg)
Ni 
(mg/kg)
Se 
(mg/kg)
Zn 
(mg/kg)
Cr 
(mg/kg)
P183.0 (4.26) a69.7 (3.59) a0.31 (0.01) b7.96 (0.38) b2.23 (0.11) b375.30 (19.3) and0.79 (0.04) a0.39 (0.02) c0.37 (0.02) a
P233.6 (1.73) dnd0.21 (0.01) dc3.58 (0.18) c7.26 (0.38) a282.64 (14.6) bnd0.40 (0.02) b0.33 (0.01) d0.20 (0.01) c
P324.5 (1.20) e46.3 (2.35) cb0.19 (0.01) ed3.5 (0.17) c0.30 (0.01) fe147.75 (7.35) e0.50 (0.02) a0.31 (0.01) c0.50 (0.02) a0.16 (0.01) d
P435.8 (1.72) d40.9 (1.99) c0.74 (0.03) ed2.99 (0.15) dc0.68 (0.03) ed66.89 (3.38) fnd0.22 (0.01) dnd0.26 (0.01) b
P535.2 (1.67) d27.4 (1.33) d0.14 (0.00) e1.70 (0.08) e1.52 (0.07) cndnd0.16 (0.00) e0.41 (0.02) cb0.29 (0.02) b
P630.3 (1.59) ed46.1 (2.30) cbnd1.84 (0.08) e0.09 (0.00) f242.38 (11.8) cnd0.15 (0.00) e0.32 (0.01) d0.18 (0.01) dc
P736.9 (1.76) dnd0.35 (0.02) b1.21 (0.06) e0.07 (0.00) f195.10 (9.97) dnd0.13 (0.00) e0.36 (0.02) dc0.19 (0.01) dc
P866.9 (3.40) bnd0.25 (0.01) c9.00 (0.46) a0.93 (0.05) dndnd0.14 (0.01) e0.35 (0.02) dc0.26 (0.01) b
P932.2 (1.59) d41.3 (2.01) b0.56 (0.03) a2.74 (0.13) d0.59 (0.03) ed130.35 (6.76) end0.16 (0.01) e0.36 (0.02) dc0.20 (0.01) c
P1046.8 (2.22) cnd0.15 (0.01) e9.05 (0.44) a1.51 (0.07) c60.73 (3.02) fnd0.14 (0.00) e0.46 (0.02) ba0.29 (0.01) b
The values are mean of three samples (n = 3, standard deviation in parentheses), analyzed individually in triplicate. Different letters within a column denote significant differences (p < 0.05); nd = not detectable.
Table 4. pH and acidity results from raw honey samples.
Honey 
Samples
pHFree Acidity (meq/kg)Lactone Acidity (meq/kg)Total Acidity (meq/kg)
P13.78 (0.19) a25.3 (1.27) b23.3 (1.11) b48.6 (2.38) b
P24.17 (0.20) a13.5 (0.68) d10.1 (0.52) f23.6 (1.20) ed
P34.19 (0.21) a12.4 (0.61) ed14.1 (0.71) ed26.6 (1.28) d
P44.00 (0.20) a8.93 (0.44) f6.63 (0.34) g15.5 (0.77) f
P53.92 (0.20) a18.0 (0.92) c17.5 (0.90) c35.6 (1.74) c
P64.21 (0.20) a10.1 (0.52) fe9.71 (0.46) f19.8 (1.04) fe
P73.97 (0.20) a19.0 (0.92) c16.5 (0.79) dc35.6 (1.81) c
P83.84 (0.19) a34.1 (1.77) a31.6 (1.53) a65.2 (3.17) a
P93.9 (0.20) a20.1 (0.97) c14.2 (0.71) ed34.4 (1.66) c
P103.89 (0.18) a18.7 (0.91) c13.3 (0.67) e32.0 (1.54) c
The values are mean of three samples (n = 3, standard deviation in parentheses), analyzed individually in triplicate. Different letters within a column denote significant differences (p < 0.05).
Table 5. NTG quantification, probiotic, and other species identification in the raw honey samples analyzed.
Raw Honey Samples NTG CFU/mLIdentified Species
P11 × 102Bacillus mycoides
P20-
P3100 × 106Ewingella americana, Staphylococcus hominis ssp. hominis
P451 × 104Staphylococcus epidermidis, Bacillus thuringiensis, Aerococcus viridans
P5150 × 104Bacillus amyloliquefaciens *
P625 × 104Staphylococcus hominis ssp. hominis, Candida glabrata
P70-
P81 × 102Leuconostoc mesenteroides ssp. cremoris
P920 × 102Bacillus subtilis, Bacillus velezensis *
P1028 × 103Corynebacterium amycolatum, Staphylococcus haemolyticus, Staphylococcus warneri, B. thuringiensis *, Bacillus velezensis *, Candida glabrata
* Identified by BLASTn analysis of Bacteria 16S sequence.
Table 6. Antimicrobial effect of Bacillus spp. isolates from the raw honey samples (zone of inhibition, mm).
Antimicrobial Effect12345678
Enterococcus faecalis00000000
Staphylococcus aureus2.10 (0.11) c001.80 (0.09) d1.70 (0.38) c1.80 (0.08) c2.40 (0.12) a1.40 (0.07) c
Listeria monocytogenes3.4 (0.17) b1.8 (0.09) a1.9 (0.09) a3.50 (0.18) b2.60 (0.13) b2.80 (0.14) b2.20 (0.10) b1.80 (0.08) c
Esherichia coli3.4 (0.17) b003.40 (0.16) cb2.80 (0.13) b2.80 (0.15) b02.40 (0.12) b
Salmonella enteritidis3.2 (0.15) b002.99 (0.15) c2.80 (0.14) b2.80 (0.15) b02.60 (0.13) b
Pseudomonas aeruginosa5.2 (0.26) a004.90 (0.23) a4.50 (0.21) a4.40 (0.23) a06.40 (0.31) a
The values are mean of three samples (n = 3, standard deviation in parentheses), analyzed individualy in triplicate. Different letters within a column denote significant differences (p < 0.05). 1 = B. subtilis, 2 = B. thuringiensis 1, 3 = B. mycoides, 4 = B. amyloliquefaciens, 5 = B. velezensis 1, 6 = B. velezensis 2, 7 = B. thuringiensis 2, 8 = B. velezensis 3, N = negative control.
Publisher’s Note: MDPI stays neutral with regard to jurisdictional claims in published maps and institutional affiliations.

