Article

Ecological Response in the Integrated Process of Biostimulation and Bioaugmentation of Diesel-Contaminated Soil

1
State Key Laboratory of NBC Protection for Civilian, Beijing 102205, China
2
Department of Chemical Engineering, Tsinghua University, Beijing 100084, China
3
State Key Laboratory of Petroleum Pollution Control, Beijing 102206, China
4
CNPC Research Institute of Safety and Environmental Technology, Beijing 102206, China
*
Author to whom correspondence should be addressed.
Contributed equally by authors.
Appl. Sci. 2021, 11(14), 6305; https://doi.org/10.3390/app11146305
Submission received: 16 May 2021 / Revised: 29 June 2021 / Accepted: 1 July 2021 / Published: 8 July 2021
(This article belongs to the Special Issue Advances in Biorefinery and Bioenergy)

Abstract

:
The study applied microbial molecular biological techniques to show that 2.5% to 3.0% (w/w) of diesel in the soil reduced the types and number of bacteria in the soil and destroyed the microbial communities responsible for the nitrogen cycle. In the meantime, the alkane degradation gene alkB and polycyclic aromatic hydrocarbons (PAHs) degradation gene nah evolved in the contaminated soil. We evaluated four different remediation procedures, in which the biostimulation-bioaugmentation joint process reached the highest degradation rate of diesel, 59.6 ± 0.25% in 27 days. Miseq sequencing and quantitative polymerase chain reaction (qPCR) showed that compared with uncontaminated soil, repaired soil provides abundant functional genes related to soil nitrogen cycle, and the most significant lifting effect on diesel degrading bacteria γ-proteobacteria. Quantitative analysis of degrading functional genes shows that degrading bacteria can be colonized in the soil. Gas chromatography-mass spectrometry (GC-MS) results show that the components remaining in the soil after diesel degradation are alcohol, lipids and a small amount of fatty amine compounds, which have very low toxicity to plants. In an on-site remediation experiment, the diesel content decreased from 2.7% ± 0.3 to 1.12% ± 0.1 after one month of treatment. The soil physical and chemical properties returned to normal levels, confirming the practicability of the biosimulation-bioaugmentation jointed remediation process.

1. Introduction

Diesel is used extensively in today’s world as a major fuel for transportation. Accidental releases of diesel products during transportation by pipeline or shipping occurred have been reported increasingly due mainly to the rapidly expanded energy consumption [1,2]. Diesel fuel is a mixture of linear, branched alkane, cyclic alkanes, and aromatic compounds, including naphthalene and its derivatives, toluene, anthracene, and phenanthrene [3]. These compounds enter the human body primarily through the food chain and might then show a strong teratogenic, mutagenic and carcinogenic effect [4,5,6,7]. In general, diesel contamination destroys soil structure and lowers its electrical conductivity, permeability, and resistance to deterioration. Moreover, the exposure to condensed hydrocarbon contaminants hinders root respiration and absorption, leading plant to death [8]. The harsh soil environment and aromatic hydrocarbons will kill microorganisms in the soil, change the soil micro-ecological environment, and affect the soil’s ecological cycle ability [9,10]. Therefore, the problem of remediation of diesel-contaminated soil has received increasing attention.
Several methods are widely used for soil remediation, such as vapor treatment [11,12], chemical treatment [13,14], physical remediation [15,16,17] and bioremediation [18,19], etc. Among these, bioremediation techniques have drawn growing attention due to their cost-effectiveness and non-invasiveness [20,21,22,23,24]. Ortega [25] et al. obtained a stabilized bacterial consortium from the rhizosphere soil of Cyperus sp. grown in an oil-contaminated field. The isolated bacteria were identified using 16S rRNA gene sequence analysis as Ralstonia insidiosa [26], Cellulomonas hominis [27], Burkholderia kururiensis [28], and Serratia marcescens [29]. The result showed that these bacteria efficiently removed monoaromatic hydrocarbons such as benzene, toluene, and xylene (BTX). Reena et al. screened a novel bacterial strain (B6) degrading a high concentration of diesel oil (up to 2.5% v/v) from contaminated soil in India [30]. The strain was identified to be 99% similar to Planomicrobium and demonstrated efficient degradation for diesel oil range alkanes (C14 to C36). The organism could grow at a wide temperature range, a high concentration of heavy metal, and tolerate to moderate NaCl concentration, suggesting its potential application in extreme environments. Wannarak et al. [31] demonstrated that Pseudoxanthomonas sp. RN402 was capable of degrading diesel, crude oil, n-tetradecane, and n-hexadecane. Further study showed that the immobilized cells had higher degrading efficacy than free cells and could degrade higher diesel concentrations. The immobilized cells still maintained high efficacy and viability throughout 70 cycles. Besides aerobic degradation bacterium, anaerobic microorganisms are also involved in biodegradation [32,33,34].
Our previous work demonstrated that soil microorganisms are highly sensitive to environmental disturbances caused by petroleum components [35,36]. Soil enzyme activity and microbial community structure and diversity are the two most important aspects for evaluating soil microbes and their biological functions, so they can be used to evaluate diesel pollution and remedial measures [37,38]. With the rapid development of biotechnology methods and molecular technology, 16S rRNA gene library, denaturing gradient gel electrophoresis (DGGE) (The abbreviated terms mentioned in the article are presented in Table A1 (Appendix A)), single-strand conformation polymorphism (SSCP), DNA hybridization such as fluorescence in situ hybridization (FISH) and DNA microarray are widely used in the evaluation of different bioremediation protocols [39]. For polycyclic aromatic hydrocarbons (PAHs) and total petroleum hydrocarbon (TPH) bioremediation process, polymerase chain reaction (PCR) [40], PCR-DGGE [41], and high-throughput sequencing [42] are widely used. Illumina’s MiSeq sequencing technology is a low-throughput, fast, and high-accuracy platform that is becoming the leading analysis technology in the market. As a result, the information obtained by using the MISeq platform to analyze the microbial community is more accurate and can deepen the understanding of environmental microecology. However, to the best of our knowledge, there have been few reports on the evaluation of the remediation process of the diesel-polluted soil using Miseq sequencing and quantitative polymerase chain reaction (qPCR) analysis. Sutton et al. [43] used qPCR to evaluate the microbial community size and alkane degradation ability during in-situ chemical oxidation and in situ bioremediation of diesel-contaminated sites. Bücker monitors the growth of Booker microorganisms (biofilm) at the oil/water interface by qPCR [44]. A better understanding of the functional genes and microbial community structure changes during the remediation process will help us choose different on-site bioremediation strategies and regulate the remediation process.
This study sampled diesel-contaminated soil in Handan City, Hebei Province, and evaluated different bioremediation procedures, including natural attenuation, biostimulation, bioaugmentation, and the biostimulation-bioaugmentation joint processes. Real-time fluorescence qPCR and Miseq sequencing were used to monitor the changes in functional genes and microbial communities during different repair processes. Simultaneously, the dynamic changes of functional enzyme activities during different remediation processes were also monitored. The physical and chemical properties of the soil after restoration were compared and analyzed. Finally, the on-site diesel pollution remediation of cultivated soil was conducted to demonstrate the efficiency of the biosimulation-bioaugmentation joint process.

2. Materials and Methods

2.1. Soil Sampling

The soil samples were collected in Handan (Hebei, China, 114.22° E 36.36° N), in which the soil was polluted by diesel due to pipeline leakage. Handan City was categorized as “Dwa” according to the Köppen–Geiger climate classification [45]. Spring is windy and dry, summer is hot and rainy, autumn is mild and cool, and winter is cold and dry. The annual average temperature is 13.5 °C. The average temperature of the coldest month (January) is −2.3 °C, and the average temperature of the hottest month (July) is 26.9 °C. All year round, the frost-free period is 200 days, and the annual sunshine is 2557 h, and the average annual precipitation is 400–550 mm.
The soil samples of 5000 g were taken at 30 cm to 90 cm underground. The soil samples’ physicochemical properties were determined by the Beijing Academy of Agricultural and Forestry Sciences, and the results are presented in Table A2 (Appendix B).

2.2. Soil Treatment and Experimental Design

Contaminated soils of 10 kg were first sieved using a 2.0 mm diameter sifter, then evenly divided into five samples, each of which was placed in a φ15 cm × 20 cm cylindrical container to form a 15 cm-depth microcosm. The sample in Container 1 was sterilized and used in the treatment of natural volatilization, marked as “S”. The sample in Container 2 was used in the treatment of natural attenuation, marked as “C”, in which no microorganisms or nutrients were applied. The sample in Container 3 was treated by adding (NH4)2SO4 and K2HPO4 as the nutrients and marked as “N,” i.e., biostimulation. The proportion for carbon, nitrogen, and phosphorus was C : N : P = 100 : 1.25 : 1 , according to Trindade et al. [46]. According to the proportion and the diesel content, 38.22 g (NH4)2SO4 and 80.64 g K2HPO4 were added into the container with 2000 g soil. The sample in Container 4 was inoculated with 50 mL of liquid culture of Pseudomonas sp. and marked as “B” i.e., bioaugmentation. The strain was isolated from the contaminated soil and contained an alkB gene but no nah gene (More information about the isolated strain was shown in Figure A1 (Appendix C). The sample in Container 5 was treated by adding the nutrients mentioned above and microbes, i.e., a biostimulation-bioaugmentation joint process, and thus marked as “N-B.” At the end of 3, 6, 9, 12, 15, 18, 21, 24, and 27 days, 5.0 g of soil samples were collected from 10 points at the superstratum and substratum from each treatment. We divided each sample into two parts, one of 2.5 g was stored at −20 °C for DNA extraction, and the other of 2.5 g was stored at 4.0 °C for diesel analysis. All treatments mentioned above were undertaken in triplicate.

2.3. Determination of Total Diesel

The diesel in soil samples was extracted according to the procedure recommended by the US Environmental Protection Agency [47]. During a run, 2.0 g dry soil and 25 mL of n-hexane/acetone mixture (1:1 v/v) were mixed and subjected to extraction in a microwave accelerated solvent extraction system (CEM Corporation, Matthews, NC, USA) at 120 °C for 30 min. Then each extractant was filtered through the filter paper and applied for gas chromatography (GC) analysis with a flame ionization detector (GC-FID, SHIMADZU, Kyoto, Japan) equipped with a φ 0.53 mm × 30 m capillary column (Ultra Alloy DX30, Frontier Lab, Tokyo, Japan). The GC-FID operation program for the diesel analysis was started with both injector and detector temperatures of 300 °C. The oven temperature was programmed from an initial 40 °C (held for 5 min) to 290 °C in the speed of 15 °C min−1 and then kept at 290 °C for 5 min.

2.4. Determination of Soil Enzyme Activity

To reflect the microbial activity of diesel-polluted soil, we measured the dehydrogenase activity, fluorescein diacetate (FDA) hydrolase activity, urease activity, and phosphatase activity in the soil, which reflect the soil microbial activity, pollutant degradation function, and nutrient cycling capacity, respectively.
Dehydrogenase activity was measured using the 2,3,5-triphenyltetrazolium chloride (TTC) reduction color method [48]. Briefly, 1.0 g soil sample was mixed with 2.0 mL glucose solution (0.1 M, stored at 4.0 °C) and 2.0 mL TTC (0.5% solution, sealed storage), In a shaking incubator at 30 °C for 12 h, 1.0 mL sulfuric acid was added to stop the enzyme reaction. After being stood still, the supernatant was extracted with 5.0 mL of acetone. After shaking and mixing, it was centrifuged at 5000 rpm for 8.0 min. The absorbance at 486 nm was determined, and the dehydrogenase activity was expressed as μg triphenylformanzan (TPF) per g dry soil. All samples were repeated in triplicate.
FDA hydrolase activity was measured as follows. Briefly, 2.0 g soil (wet weight) was mixed with 15 mL potassium phosphate buffer (pH 7.6, 60 mM) in a 50 mL centrifuge tube. Then 200 μL fluorescein diethyl ester was added (1 mg/mL, dissolved in acetone). The reaction system was incubated in a shaking incubator at 30 °C and 175 rpm. After 20 min incubation, 15 mL chloroform/methanol mixture solution (vol/vol 2:1) was added to stop the reaction. Centrifuge at 8000 rpm for 12 min, take the supernatant and measure it with a spectrophotometer at 490 nm. The reaction system without adding fluorescein diethyl ester was used as a blank control.
Urease activity was measured using a modified literature method [49]. Briefly, 2.0 g of air-dried soil in a 50 mL centrifuge tube was mixed with 600 μL of toluene to completely wet the soil for 15 min. Then 2.0 mL of urea (10% solution) and 4.0 mL of citrate buffer (pH 6.7) were added. After reacting at 37 °C and 145 rpm in a shaking incubator for 24 h, 20 mL of 37 °C water was added. Then, shake and filter through a 0.45 μm filter. 1.0 mL of filtrate was transferred to the 25 mL graduated constant volume tub with the addition of a little deionized water. 4.0 mL of sodium phenolate (prepared for sodium phenolate solution) and 3 mL of sodium hypochlorite solution were added and shaken. After standing for 20 min, the solution turned into indophenol blue. Then add deionized water to reach the marked line. Measure the OD578 (Optical Density) value after mixing, and the urease activity was expressed as mg NH4+-N per g dry soil per hour. All samples were repeated in triplicate.
Phosphatase activity was measured as follows. Briefly, 2.0 g of air-dried soil was added into a 50 mL centrifuge tube, mixed with 0.5 mL of toluene. 8.0 mL of phenyl disodium phosphate solution (0.5% concentration) was added, and the reaction was shaken in the incubator at 37 °C and 175 rpm for 2.0 h. The suspension was filtered through the dense filter paper and 2.0 mL of the filtrate was transferred to the 25 mL graduated constant volume tub with the addition for 10 mL of deionized water. 0.15 mL of ammonium chloride-ammonium hydroxide buffer (pH = 9.8) and 0.25 mL of 4-aminoaminolipine (concentration 2%) and 0.25 mL of potassium ferricyanide were added in sequence, respectively. Finally, the OD510 value was measured by the spectrophotometer within 15 min after the addition of deionized water to the mark. All samples were repeated in triplicate.

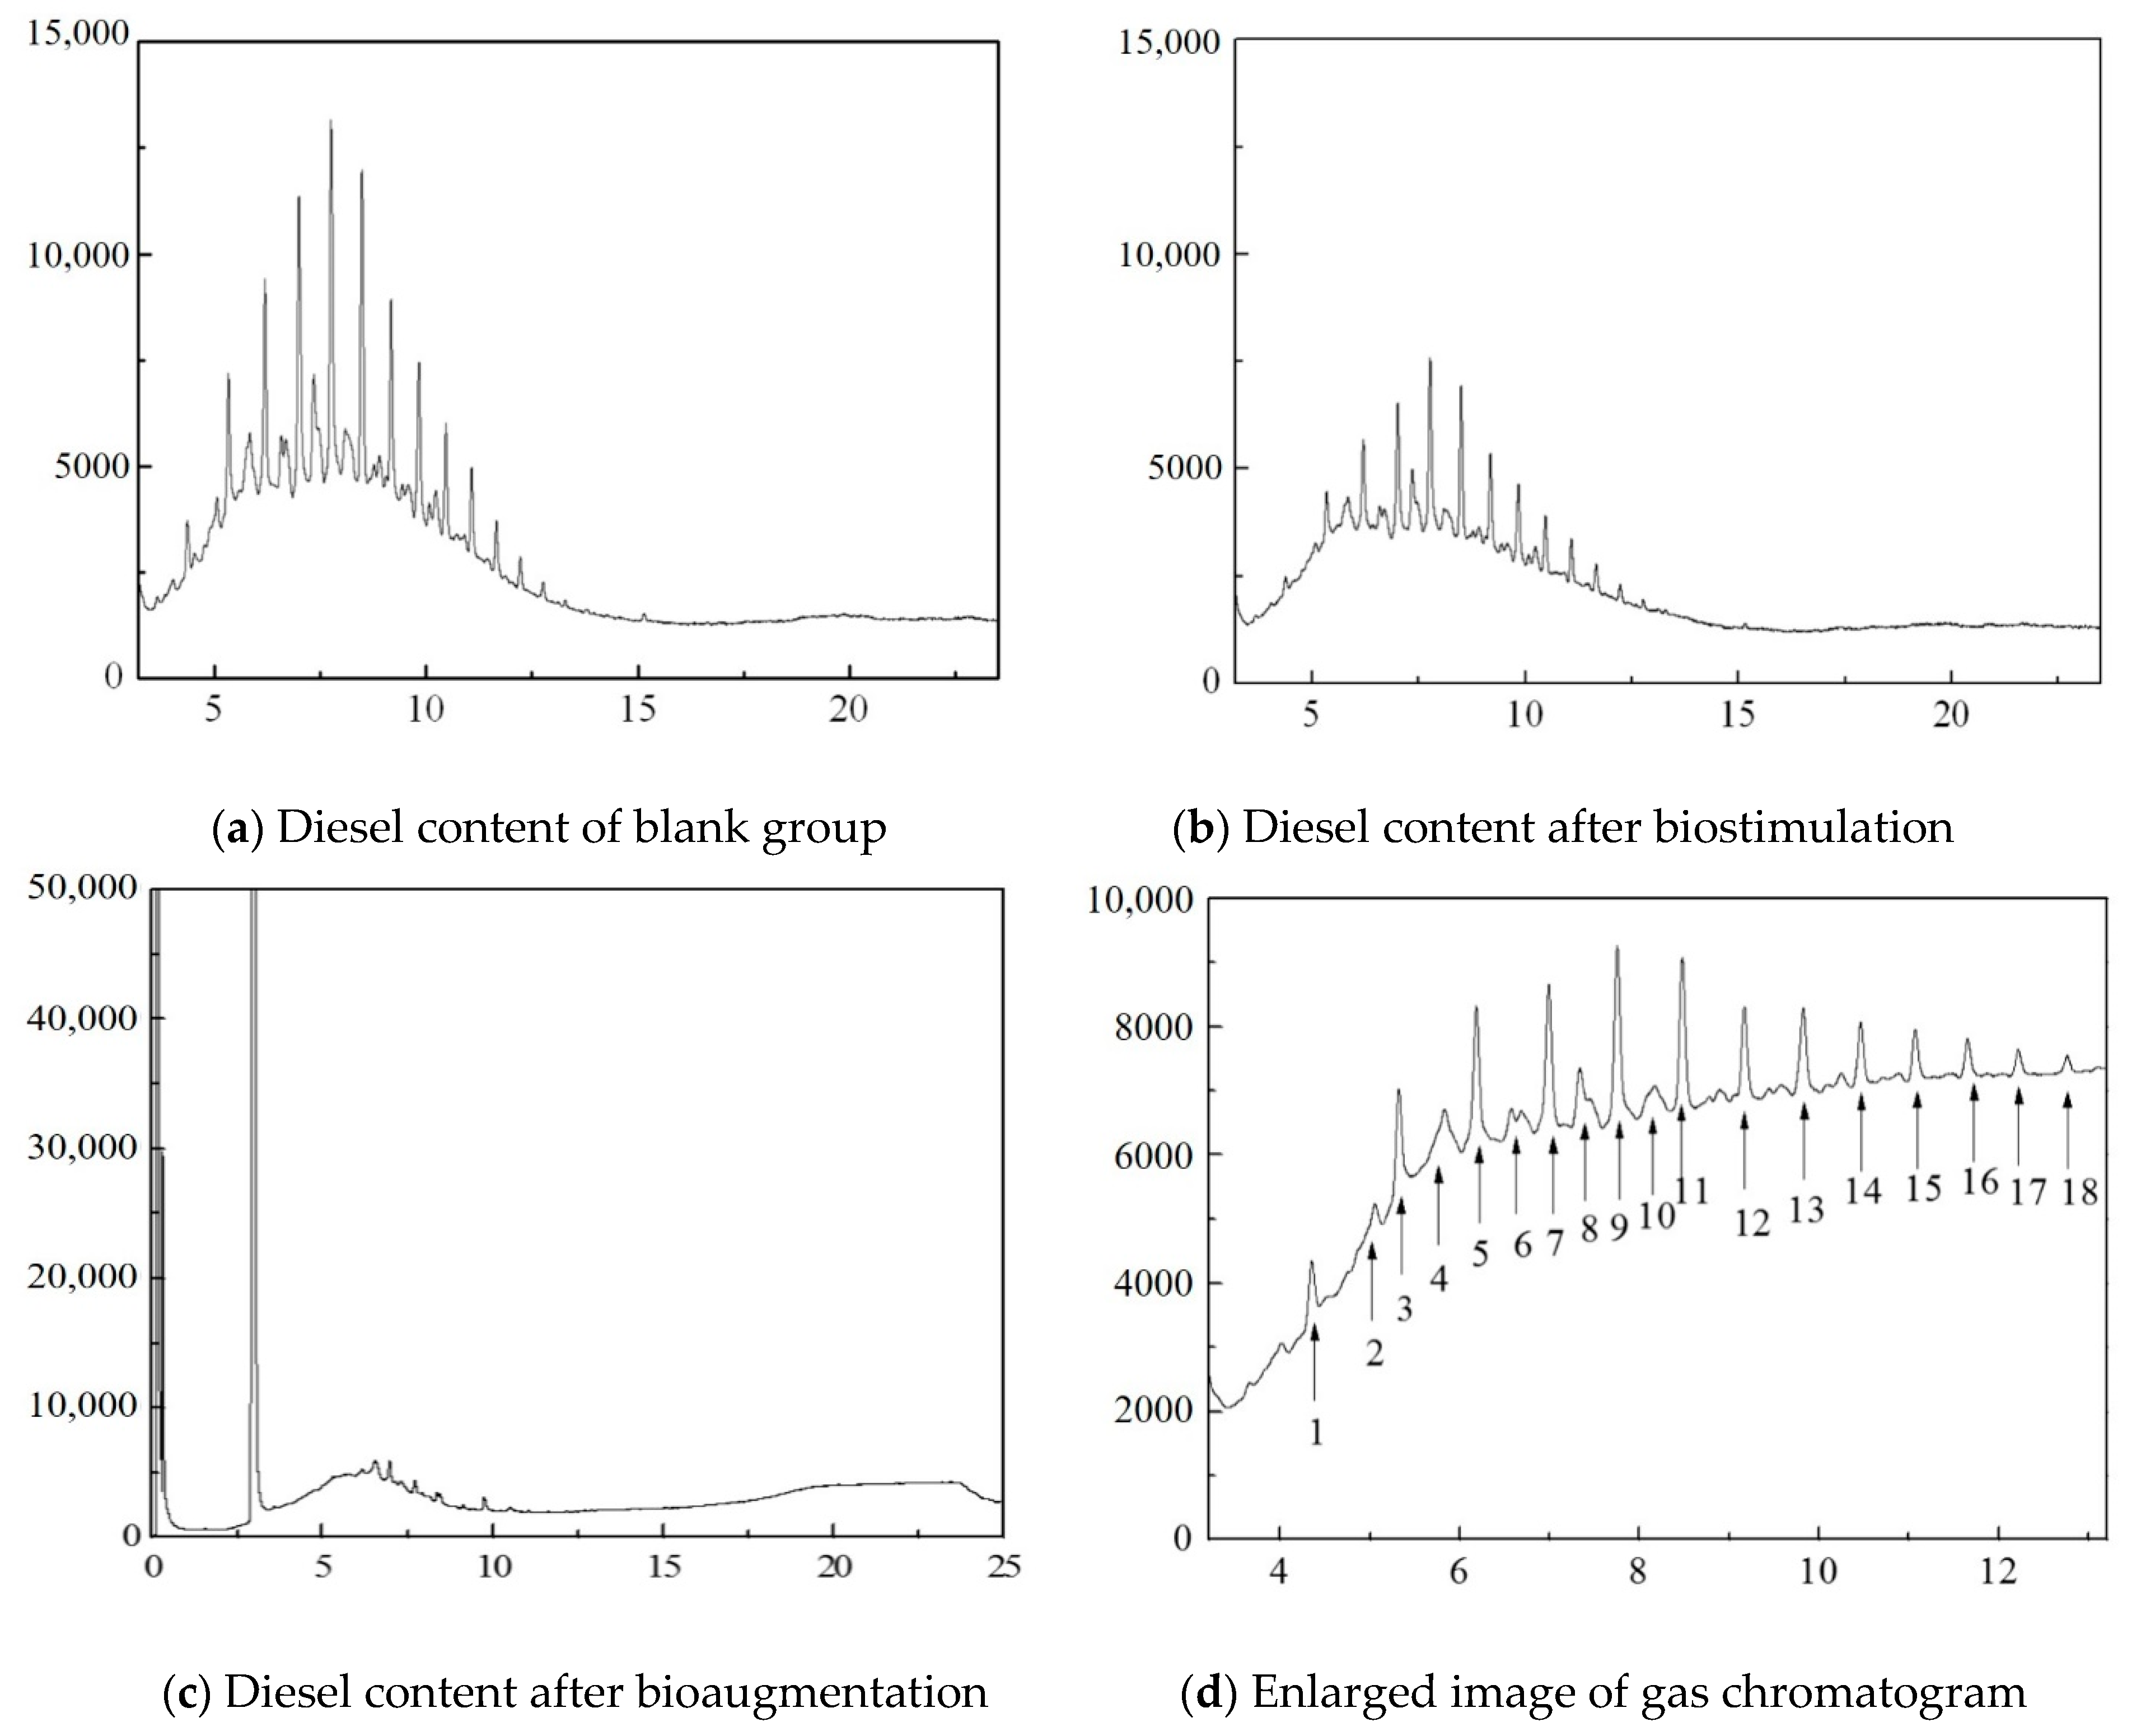
2.5. Analysis of Degradation Products

The degradation products were analyzed using Shimadzu GCMS-QP505OA gas chromatography-mass spectrometry (SHIMADZU, Kyoto, Japan). The data was processed through LABSOLUTIONS GCMSSOLUSTION RELEASE1.02 system (SHIMADZU, Kyoto, Japan). The cracker is a tube furnace cracker (PYR-4A). Chromatographic conditions: inlet temperature of 280 °C; sample starting temperature of 50 °C, hold for 1 min, and increase to 280 degrees at 8 degrees per minute; use DB-5 30m × 0.25 mm id capillary column; carrier gas is helium; Airflow: ~1 mL/min; split ratio: ~30:1. Mass spectrometry conditions: an ion source, EI; voltage, 70 ev; scanning range, amu 33–600; detector temperature 250 °C. Cracker conditions: cracking temperature 100–400 degrees; cracking time 30 s.

2.6. Extraction of Total Soil DNA

DNA extraction from 0.25 g of the soil samples was performed using PowerSoil® D.N.A. Isolation Kit (MoBio Laboratories, San Diego, CA, USA). The extracted total DNA was then subjected to electrophoresis on 1.0% agarose gel, after which it was stored at −20 °C until further PCR amplification and real-time PCR analysis.

2.7. Real-Time Q-PCR (Quantitative Polymerase Chain Reaction) Analysis

Real-time Q-PCR was performed to determine the amount of 16S rRNA, alkB, nah, nifH and amoA. The Real-time Q-PCR reactions were conducted using an ABI 7300 Applied Biosystem. We give the details for primer sequences and PCR procedure in Table A3 (Appendix D). The PCR was performed in 20 μL reaction volume containing 10 μL of 2 × SYBR Green PCR Mix (TOYOBO, Osaka, Japan), 0.2 μL of each primer, and 1.0 μL of template DNA on a 7300 Real-time PCR System (ABI, Waltham, MA, USA). The melting curve step with 15 s at 95 °C, 1 min at 60 °C, and 15 s at 95 °C instead of the final extension step was carried out after the normal PCR procedure. Data collection took place during the extension step of the reaction. The qPCR standard curve drawing method is shown in Appendix E. All reactions were conducted in triplicate.

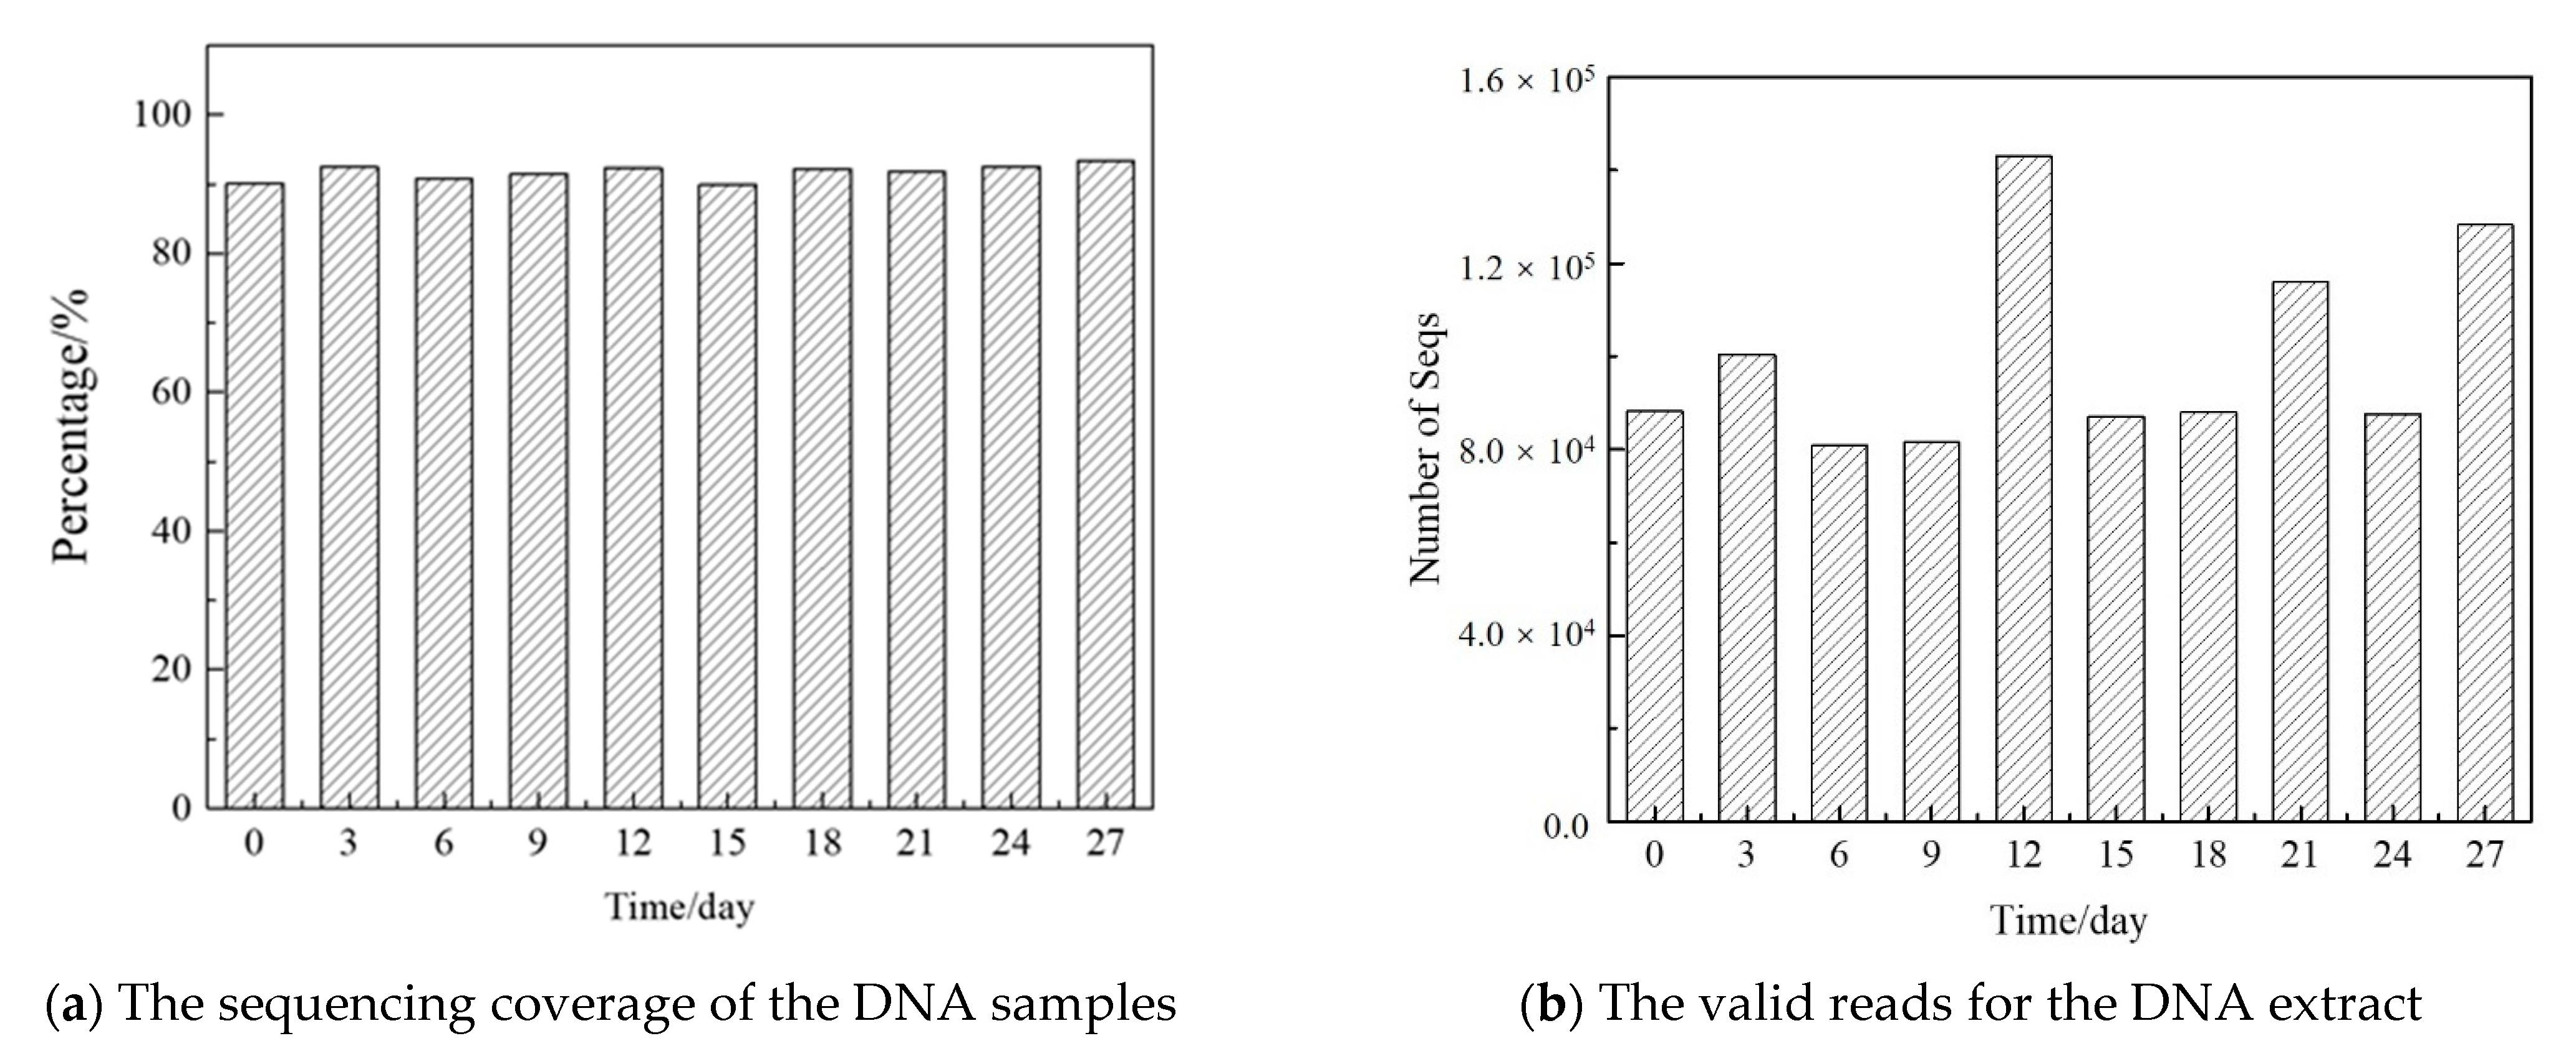
2.8. Microbial Ecology Analysis

The soil bacterial DNA was extracted with the Fast DNA Spin Kit for Soil (Power Soil DNA Isolation Kit, MoBio) ( MoBio Laboratories, San Diego, CA, USA). The DNA samples were then sent to the company (Sinogeno Max Corporation, Beijing, China) for high-throughput sequencing. The primer amplified the DNA samples: PrimerF: ACTCCTACGGGAGGCAGCAG; PrimerR: ATTACCGCGGCTGCTGG. Amplifications were carried out in a total volume of 20 μL using 50 ng of DNA, dNTPs (10 mM each) 1 µL, each of forward and reverse primers 0.4 µL (10 μM). PCR conditions were 5 min 94 °C, followed by 35 cycles of 30 s at 94 °C, 30 s at 55 °C, 30 s at 72 °C. The paired-end sequencing (2 × 150 bp) was carried out on an Illumina MiSeq sequencer in Sinogeno Max Corporation, Beijing, China.

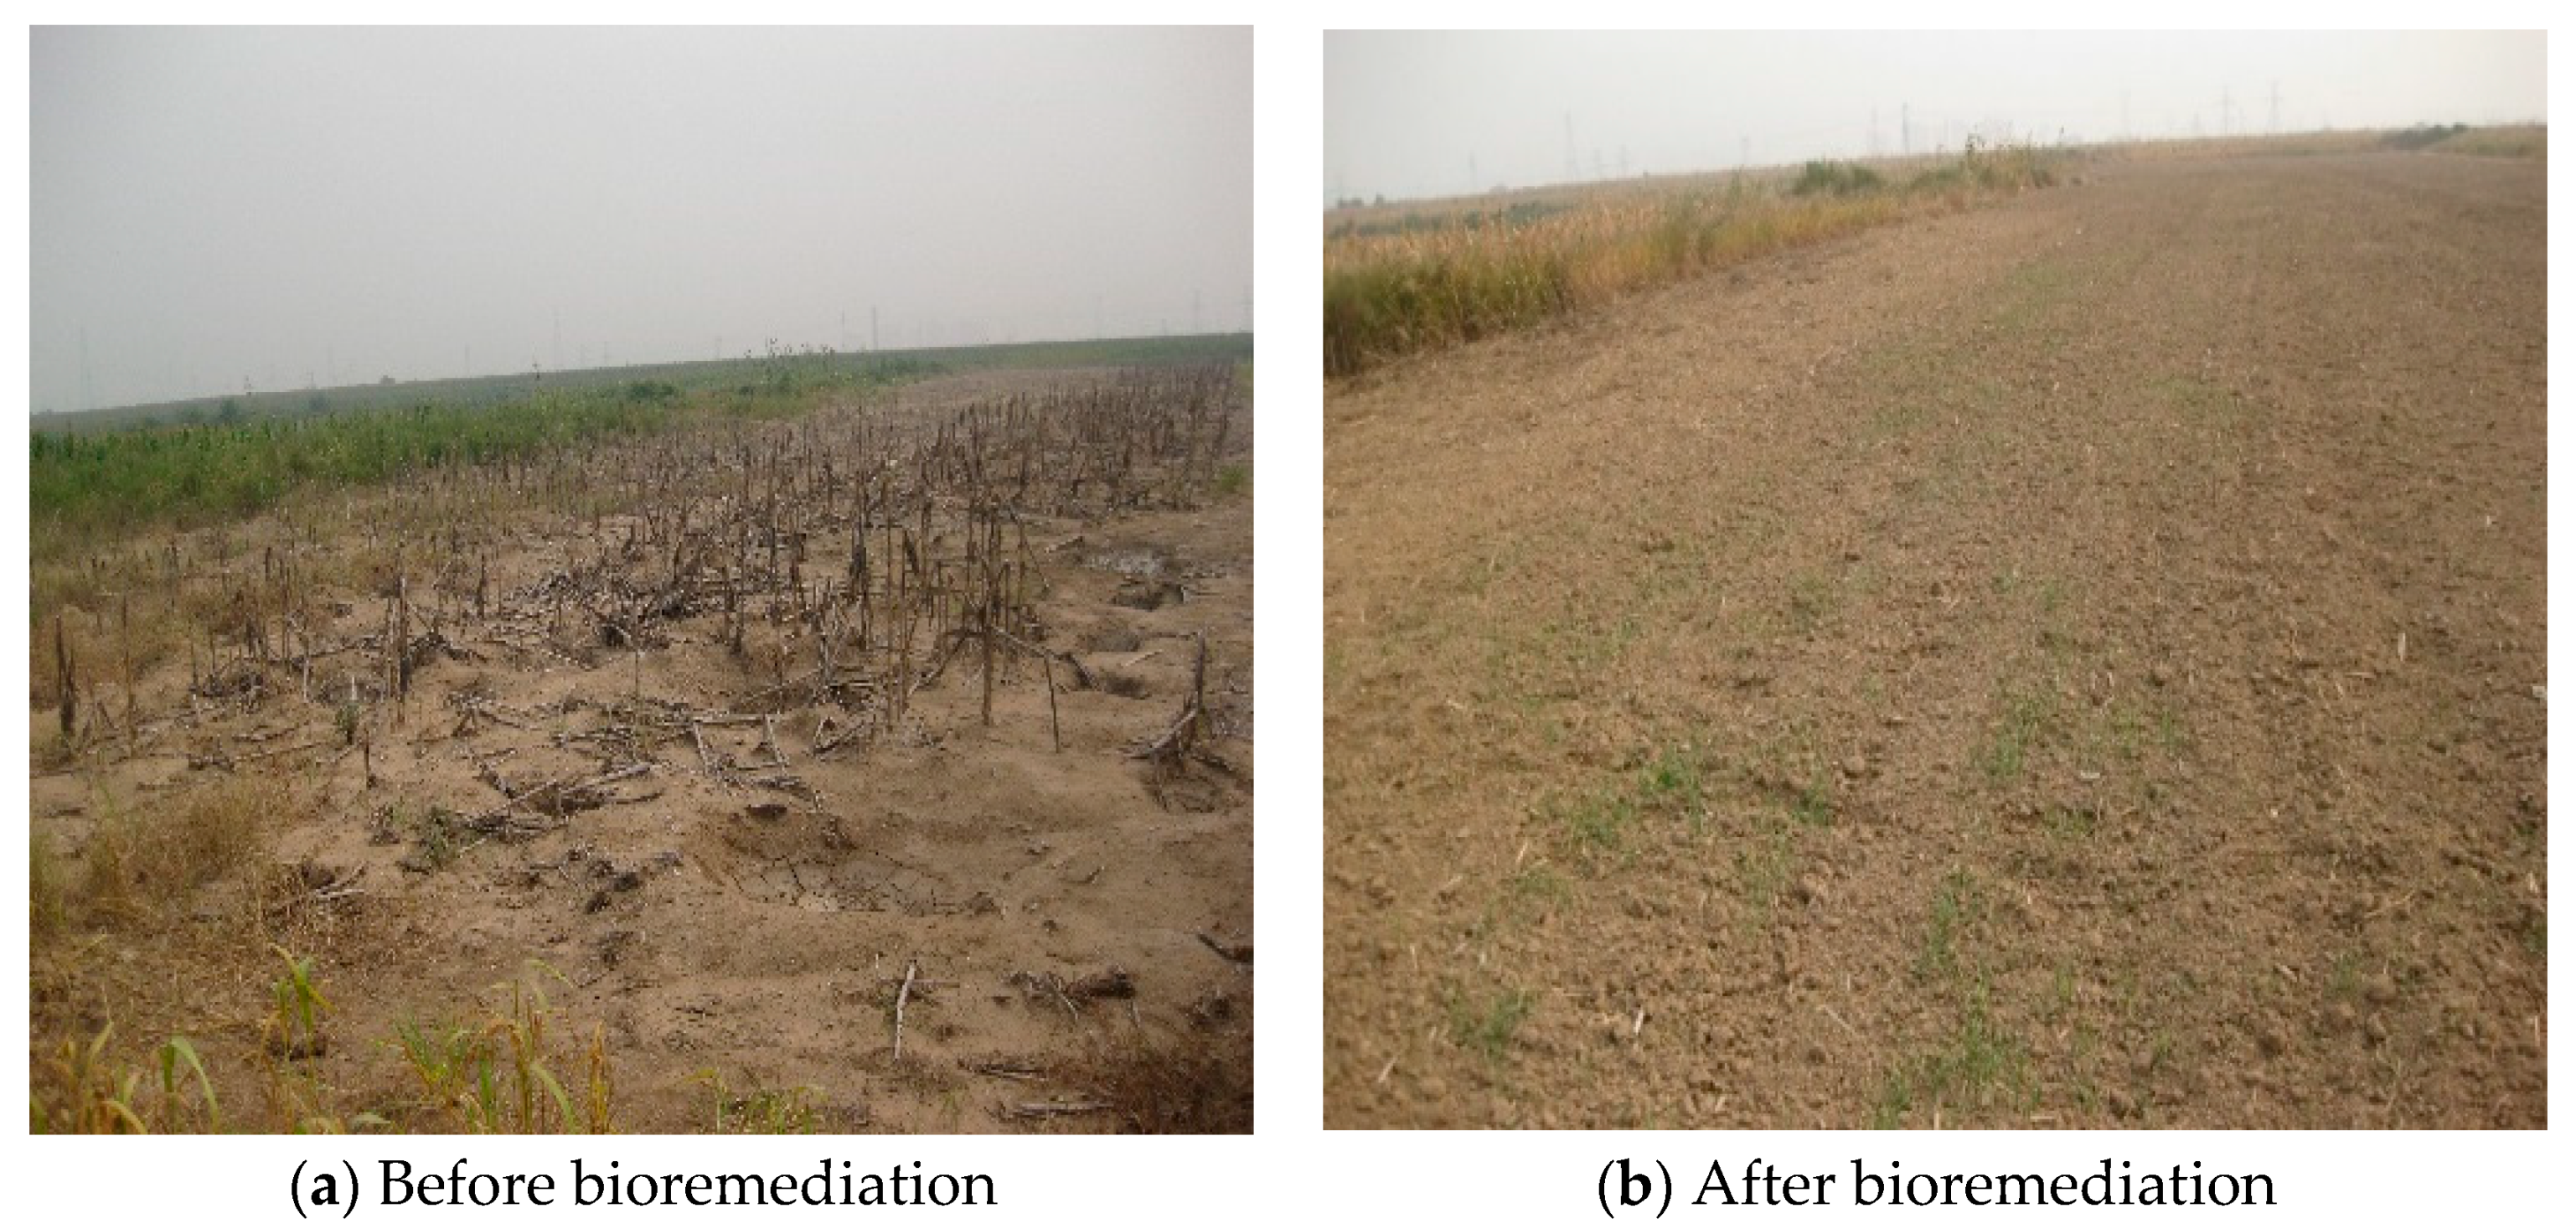
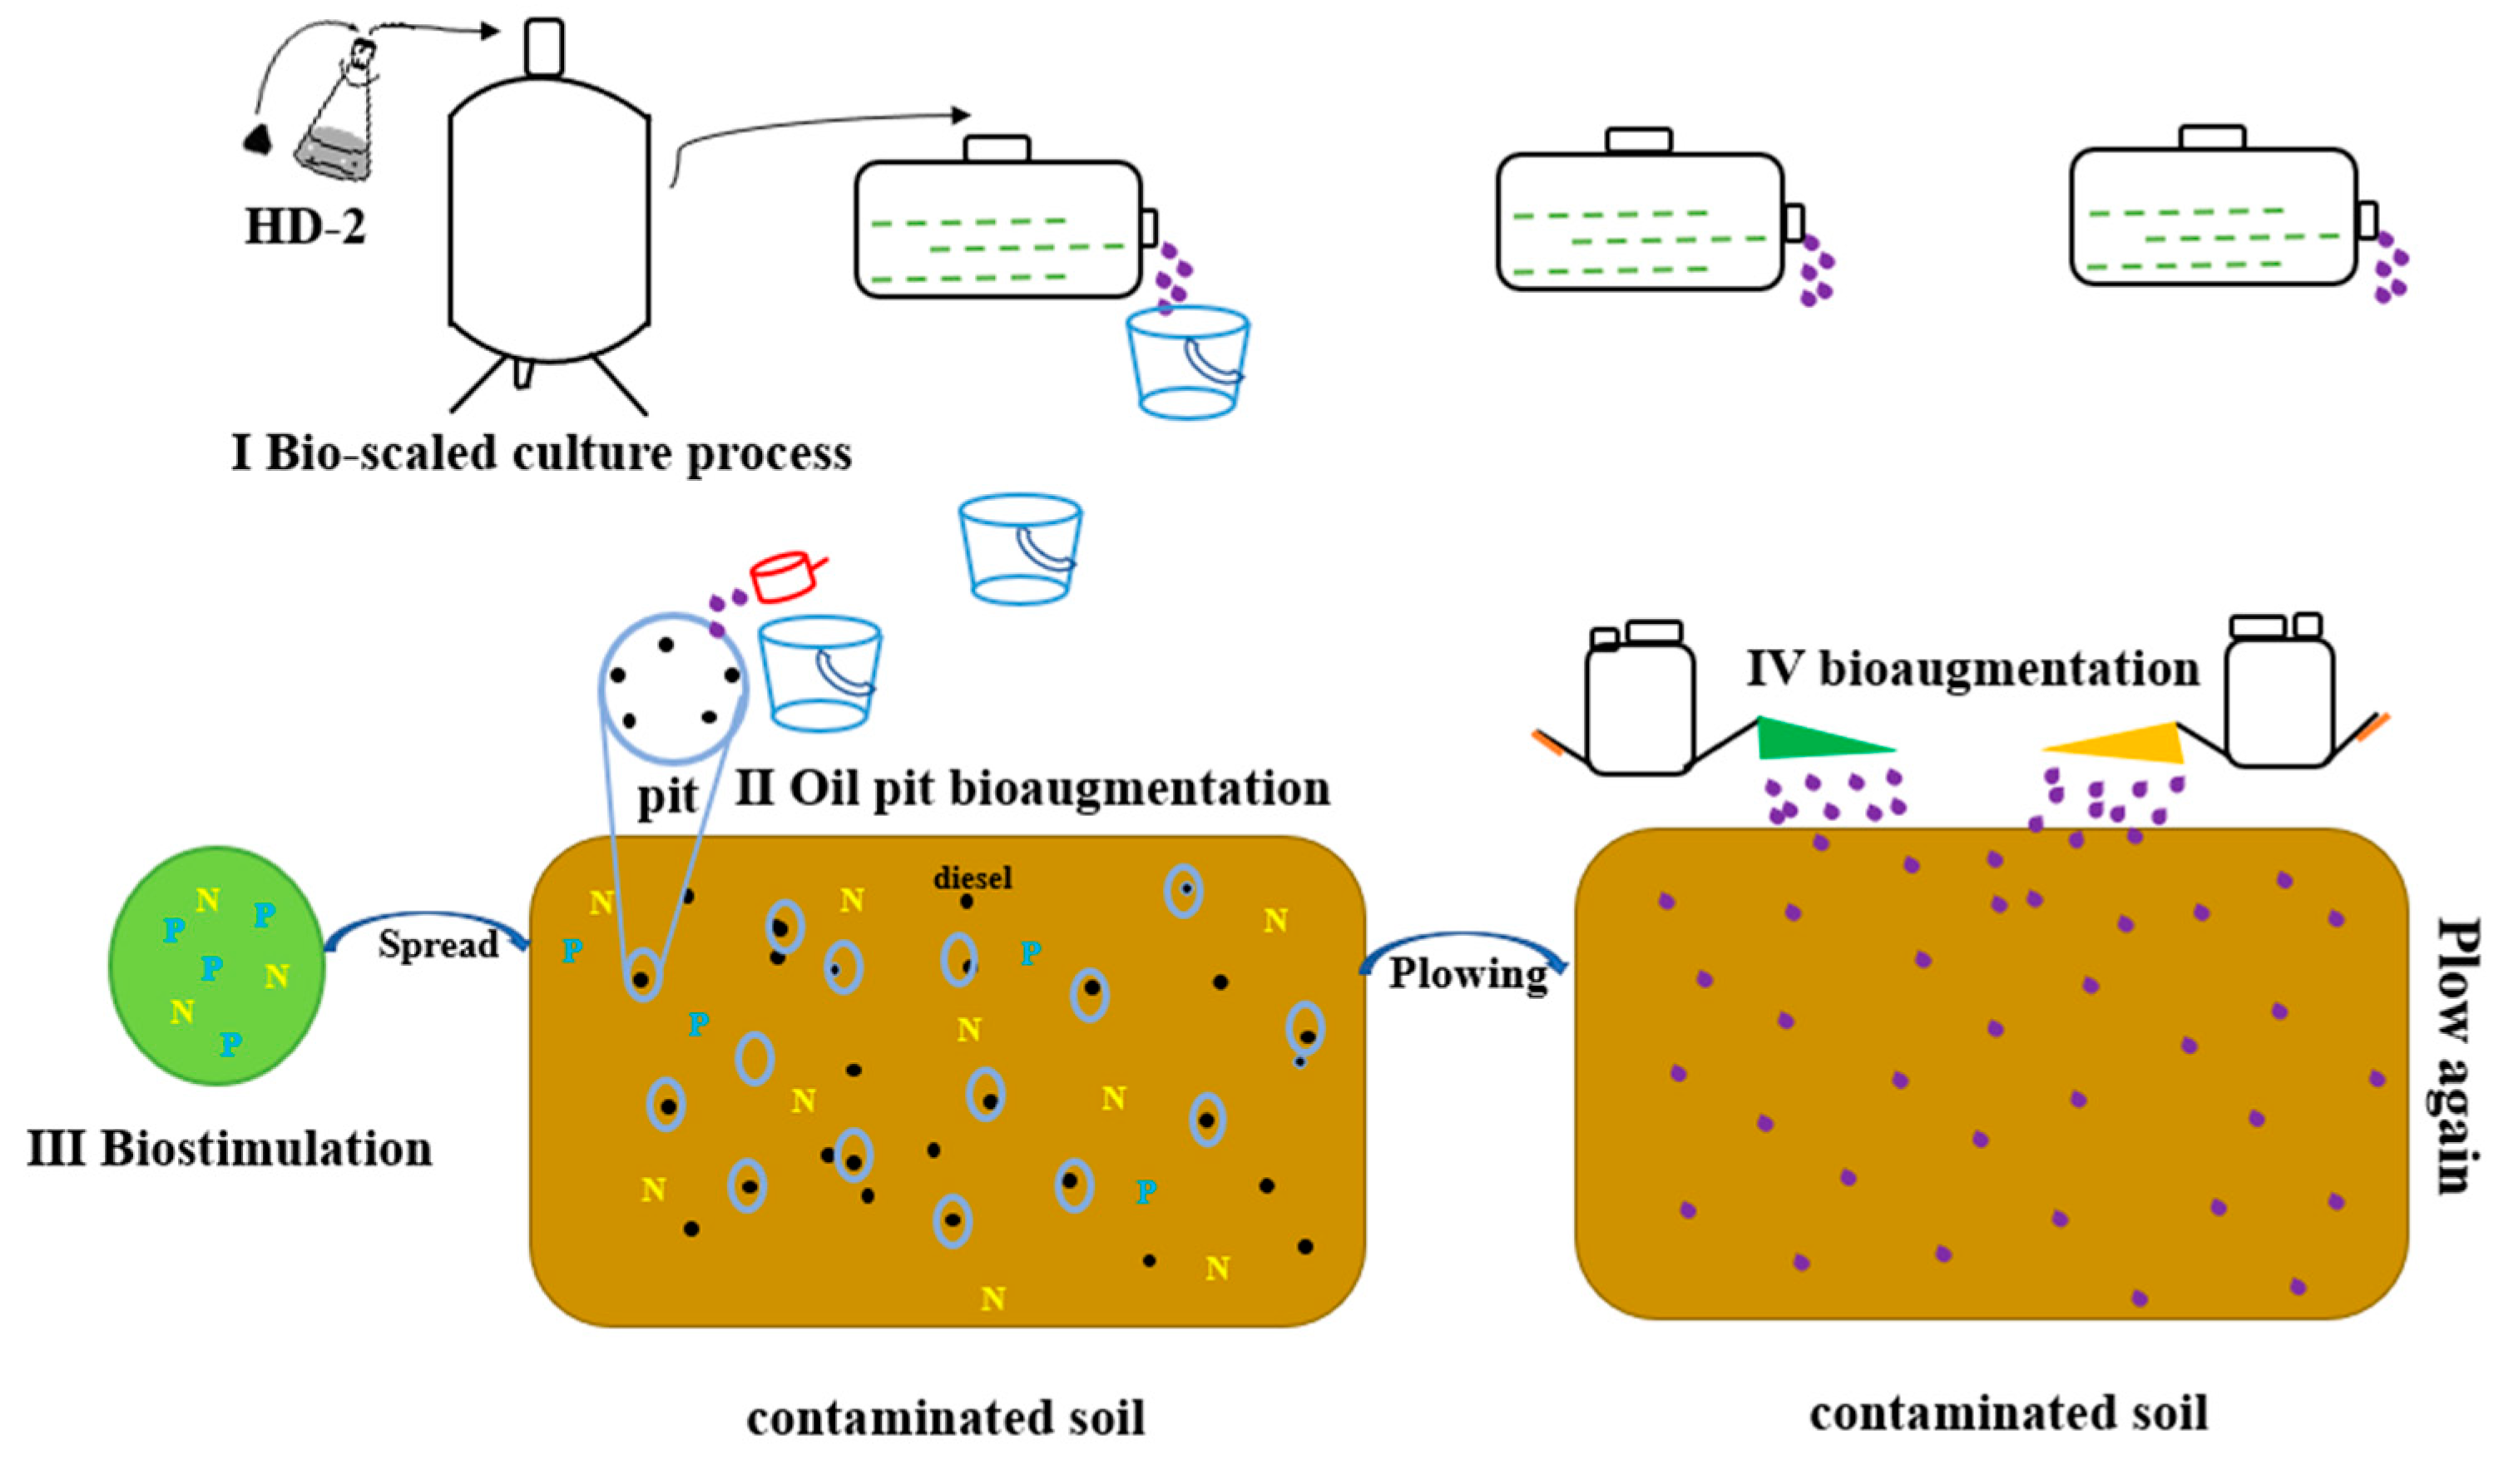
2.9. On-Site Implementation of the Bioremediation Approach

The on-site bioremediation was conducted at the diesel-contaminated field with about 0.53 ha in the area at Handan city, Hebei province, China. The treatment lasted for one month (from 30 September to 25 October). There are more than 100 pits distributed on the site to collect diesel fuel sprayed from the pipeline. All pits are in a diameter of 0.5–1 m2 and a depth of about 90 cm. The diesel oil overflowing from the pit flows downstream from the cultivated land on the high slope. Figure 1 gives a schematic diagram of the contaminated site.
As described in the above portion, the biostimulation-bioaugmentation joint approach was used to treat the contaminated field. (NH4)2SO4 and K2HPO4 were added for the biostimulation operation according to the proportion and the dosage mentioned in Section 2.2. Pseudomonas sp. was added for the bioaugmentation. The strains and the fertilizer were mixed with the soil, and the contaminated field was plowed three times. After the above bioremediation treatment, grass seeds were sowed to test the recovery of the cultivation ability.

2.10. Statistical Analysis

For the total diesel, soil enzyme activities, total bacteria, and functional gene copy numbers, the mean value and standard deviation were calculated from three replicates. The mean values were compared by one-way analysis of variance (ANOVA) with the at a level of p 0.05 . All statistical analyses were conducted using SPSS 19.0.

3. Results and Discussions

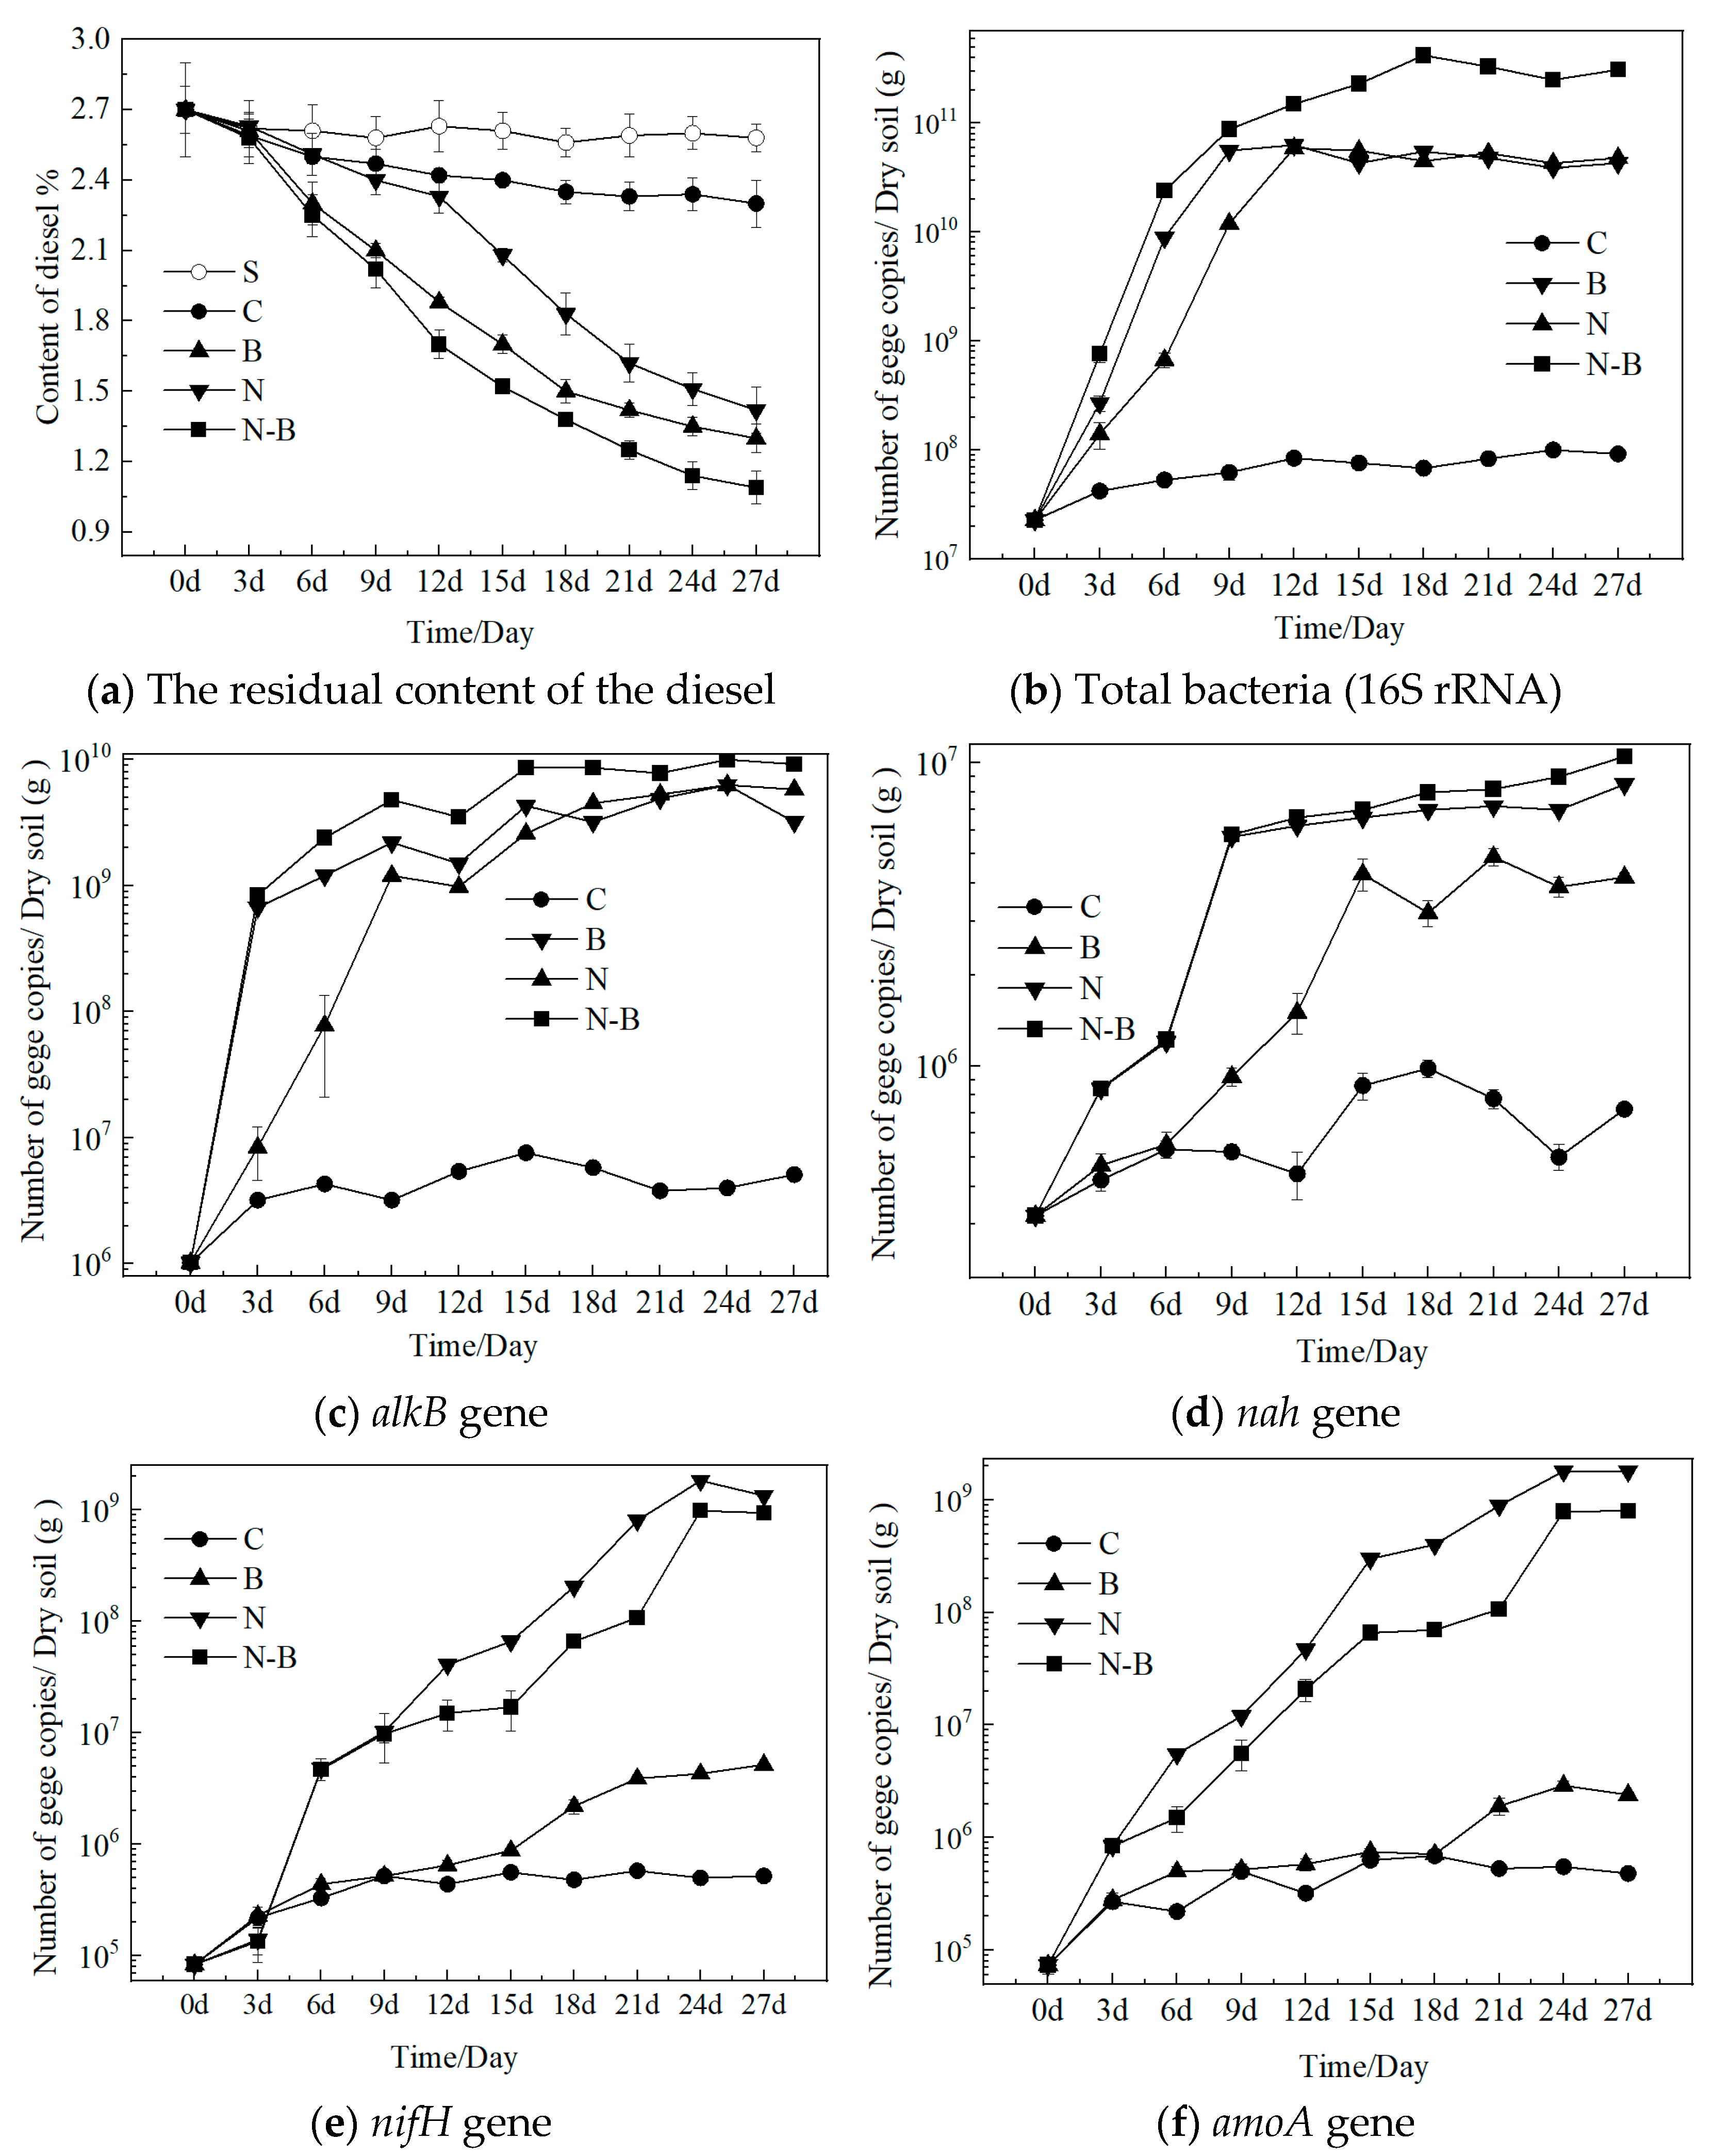
3.1. The Microbial and Gene Kinetics of Different Degradation Approaches

The degradation using natural volatilization (S), natural attenuation (C), biostimulation (N), bioaugmentation (B), and the biostimulation-bioaugmentation (N-B) joint process was conducted, as described in the previous portion. The residual diesel content changes in each experiment system were thus plotted and shown in Figure 2. The alkB and nah genes, which encode the degradation activities for alkene and aromatic compounds, and the nifH and amoA gene encoding nitrogen cycle, are also shown in Figure 2. The kinetic picture of bioremediation of diesel degradation was obtained, from which the different degradation performance by different remediation processes were identified.
It can be seen in Figure 2a that the residual content of diesel was down to 1.09% in the case of the biostimulation-bioaugmentation joint process. The volatilization contributes to a reduction of diesel content within 0.1–0.3%, indicating the necessity of implementing bioremediation procedures. Both B and N-B processes showed a lag phase of 3 days, indicating the growth of the inoculated degrading bacteria. As for the N process, the lag phase extended to 12 days. Here the N-B system removed 58% of diesel, exhibiting the highest degrading efficiency.
Figure 2b shows the variation of the number of the total bacteria during the degradation in the soil. Here we ignored system S because it was subjected to sterilization treatment before bioremediation. The amount of the 16sS rRNA gene copies maintained a low level in the C system, which, we believe, reflected the toxic effects of diesel that hindered microbial proliferation. As for other systems, the amount of the total bacteria increased from 107 to about 1011, in which the N-B system appeared the highest bacterial growth. An increase in microbial 16S rRNA also appears for the B and N systems, respectively, indicating the colonization of the exogenous bacteria and the effect of biostimulation.
Figure 2c,d give the changes in amount of the alkB and nah gene copies. The amount of alkB gene copies increased from 106 to 1010 in the B system, which could be attributed to the inoculation of the degrading strain. We also observe the increase of nah gen copies, which does not exist in Pseudomonas sp. Therefore, the magnificent increase of the nah gene was attributed to the increase of microorganisms in the soil caused by biostimulation.
Figure 2e,f give the recovery of the nitrogen cycle genes in different experimental systems. Here B and C both show a low effect on promoting the nifH and aomA genes, which indicated that exogenous bacteria might mostly act on the degradation reaction. By contrast, N showed the best effect for increasing the nitrogen cycle genes; for instance, the nifH gene copies amount increased from 105 to 109. Here the variation of nifH and aomA genes before and after the remediation confirmed the effectiveness of the biostimulation in the restoration of the soil nitrogen cycle.

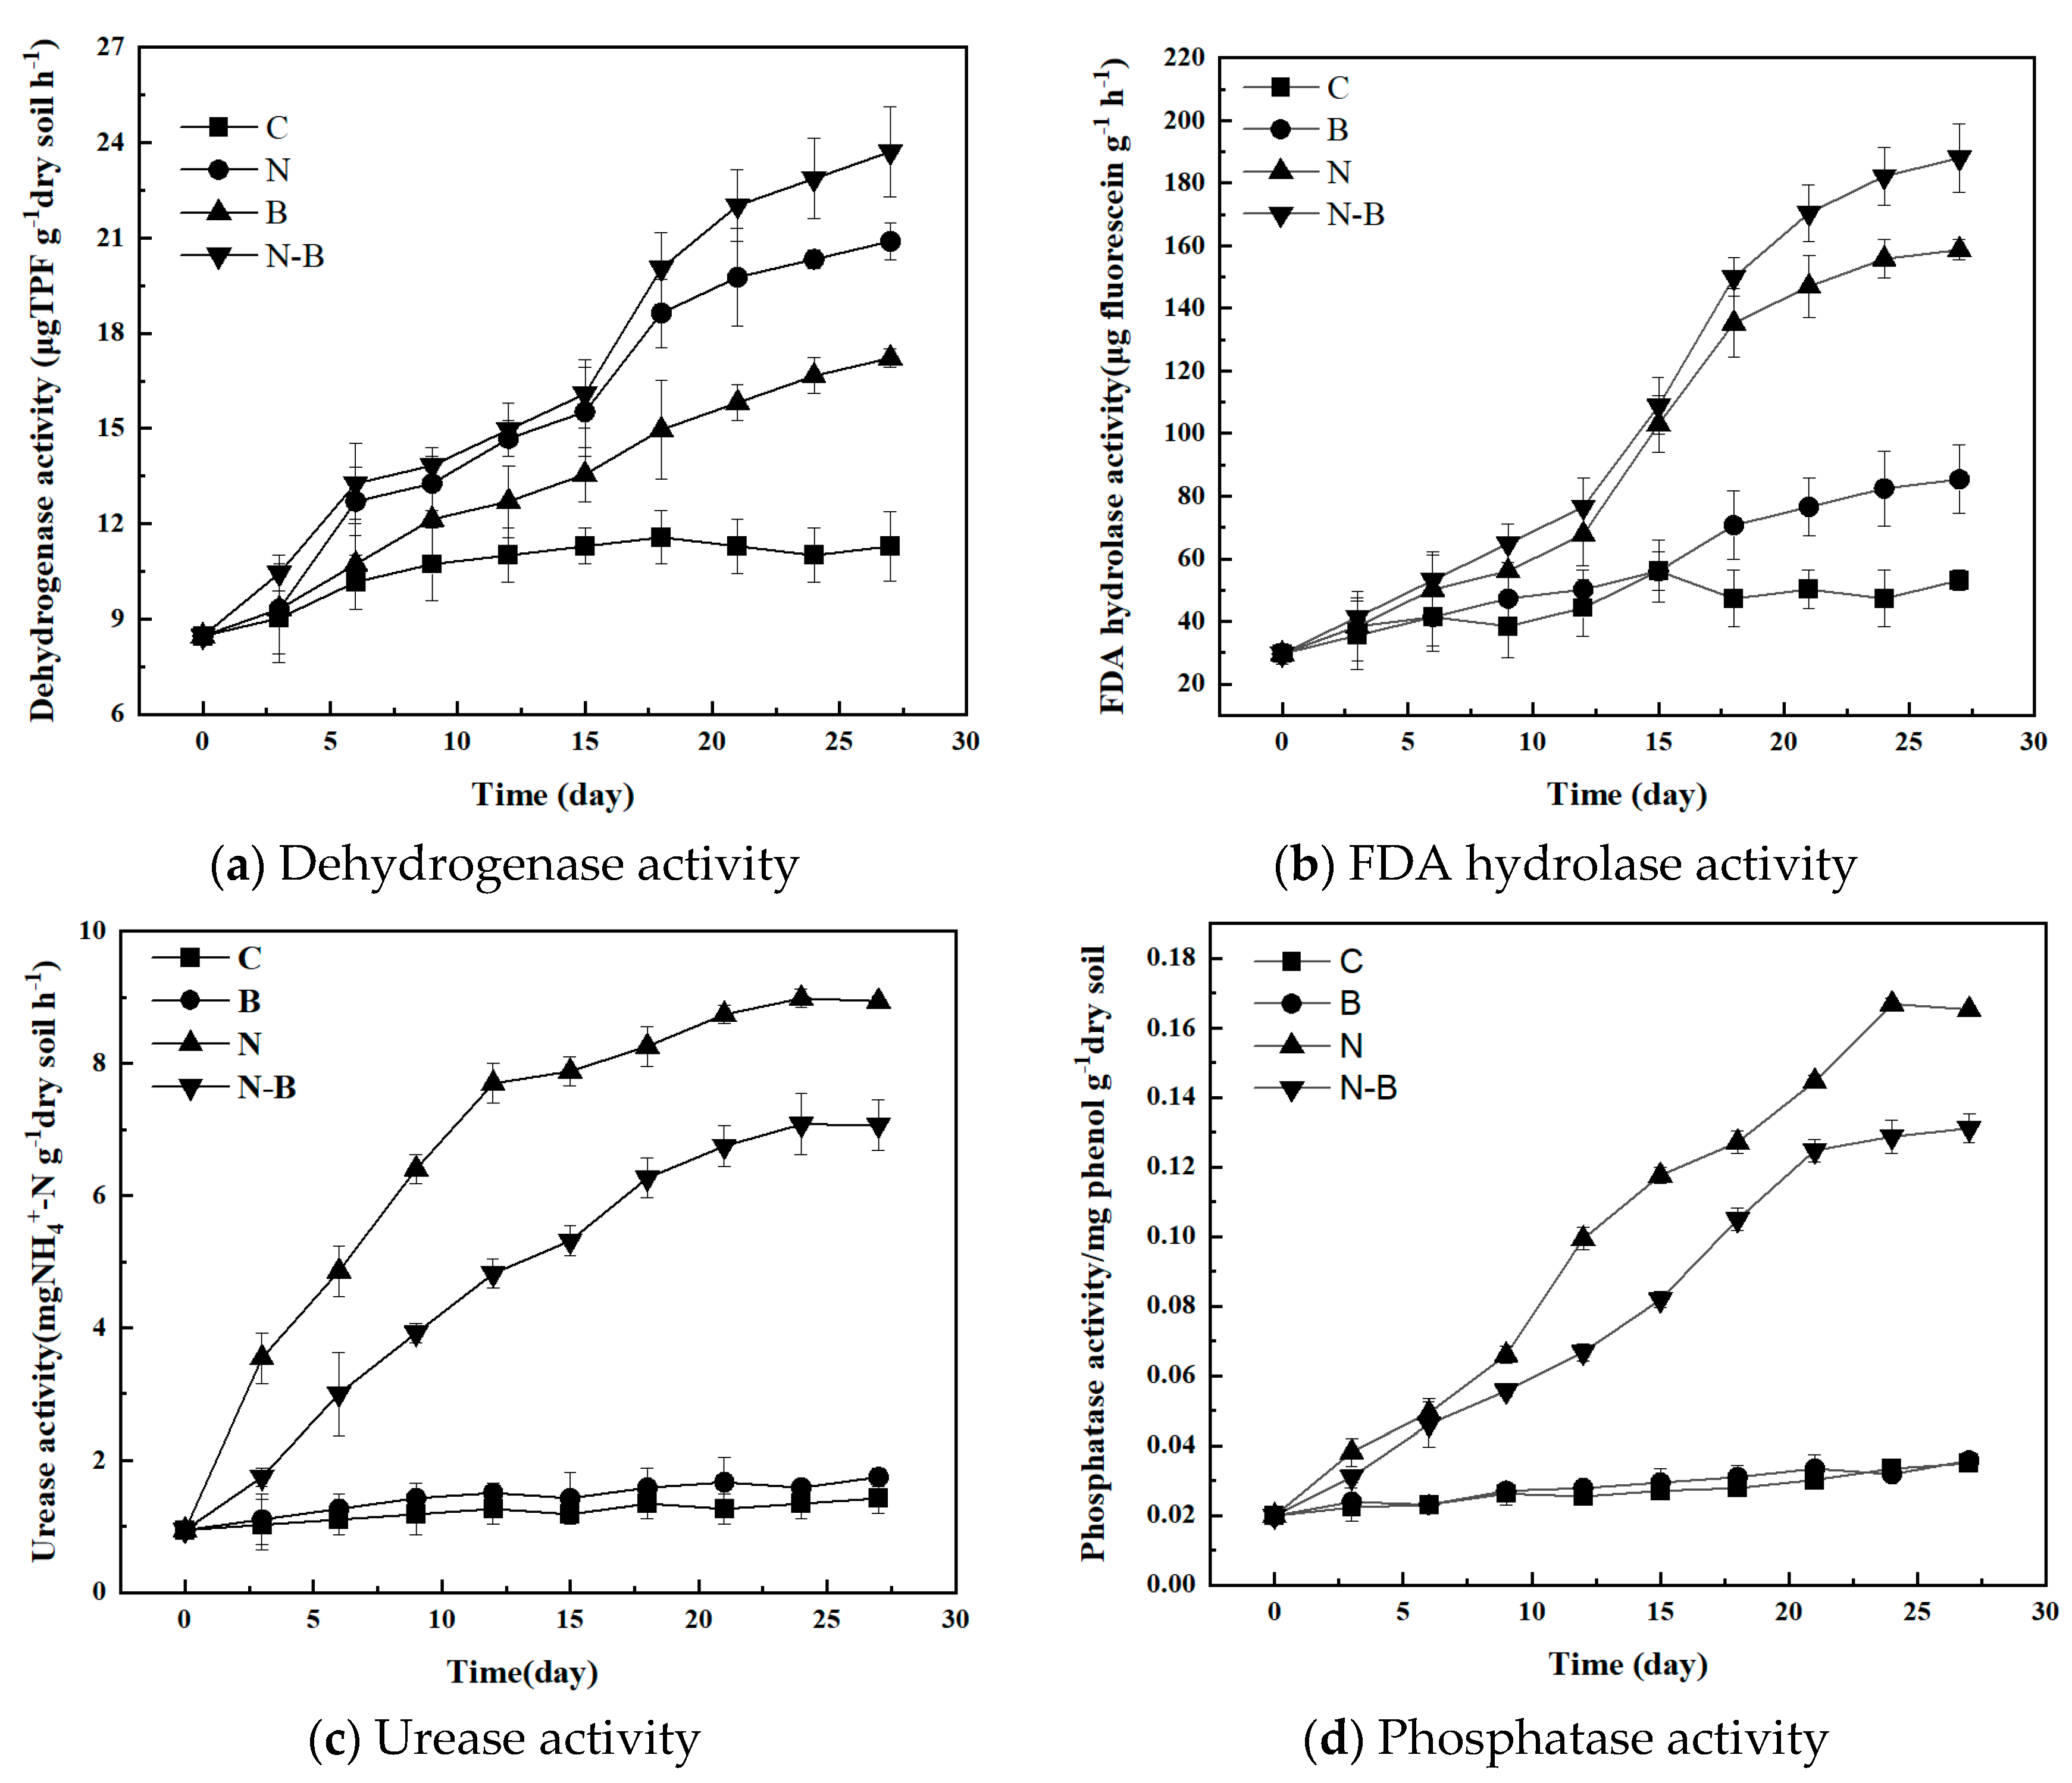
3.2. Soil Enzyme Activities

During the remediation process, soil dehydrogenase activity, FDA hydrolase activity, urease activity, and phosphatase activity were monitored, and the results are shown in Figure 3.
As shown in Figure 3a, the changing trend of dehydrogenase activity is consistent with the diesel degradation process (Figure 2a), indicating that dehydrogenase is a crucial enzyme in the degradation of diesel pollutants. The enzyme activities of B and N-B systems increase rapidly, and their growth trends are the same, indicating that the metabolism of pollutants in the soil was mainly completed by the added degrading bacteria in the beginning bioremediation stage. After 18 days, the enzyme activity of the N-B group was gradually higher than that of the B group, indicating that the addition of nutrient sources is beneficial to the growth of both degrading strains and indigenous microorganisms and can promote the increase of dehydrogenase activity. The dehydrogenase activity of the N group increased rapidly after 15 days, indicating that the degrading bacteria in the indigenous flora played a role.
It can be seen from Figure 3b that during the first six days of all treatment processes, the FDA hydrolase activity is low, which shows that diesel pollutants have an adverse impact on microbial activity.
During the experiment, the FDA hydrolase of the C group has been maintained at a low level (less than 55 μg fluorescein/g/h), indicating that the microbial activity in the soil is low and remains unchanged. The N group and N-B group trends were similar in the early stage, and the degradation ability was higher than that of the N group due to the addition of degrading bacteria in the later stage of degradation. The results of groups N and B are opposite to the results of dehydrogenase activity. The overall results show that biological stimulation remediation measures can better promote the restoration of soil microbial activity.
Soil urease and phosphatase can reflect the nutrient cycling capacity of the soil, which is an indicator that needs attention in the process of remediation of barren contaminated soil. Figure 3c,d give kinetics of urease and phosphatase activities of soil during different remediation methods. The effect of the N group is the best, and the urease activity and phosphatase activity increase rapidly during the whole degradation process, which shows that the proper ratio of nutrient addition can significantly restore the soil nutrient cycle. Moreover, from the measurement results of the two enzymes, the effect of biological stimulation on different enzyme activities is different. The urease activity increased from 0.95 ± 0.02 to 8.94 ± 0.01 mg NH4+-N/g dry soil/h, and phosphatase activity increased from 0.02 ± 0.01 to 0.17 ± 0.01 mg phenol/g dry soil.

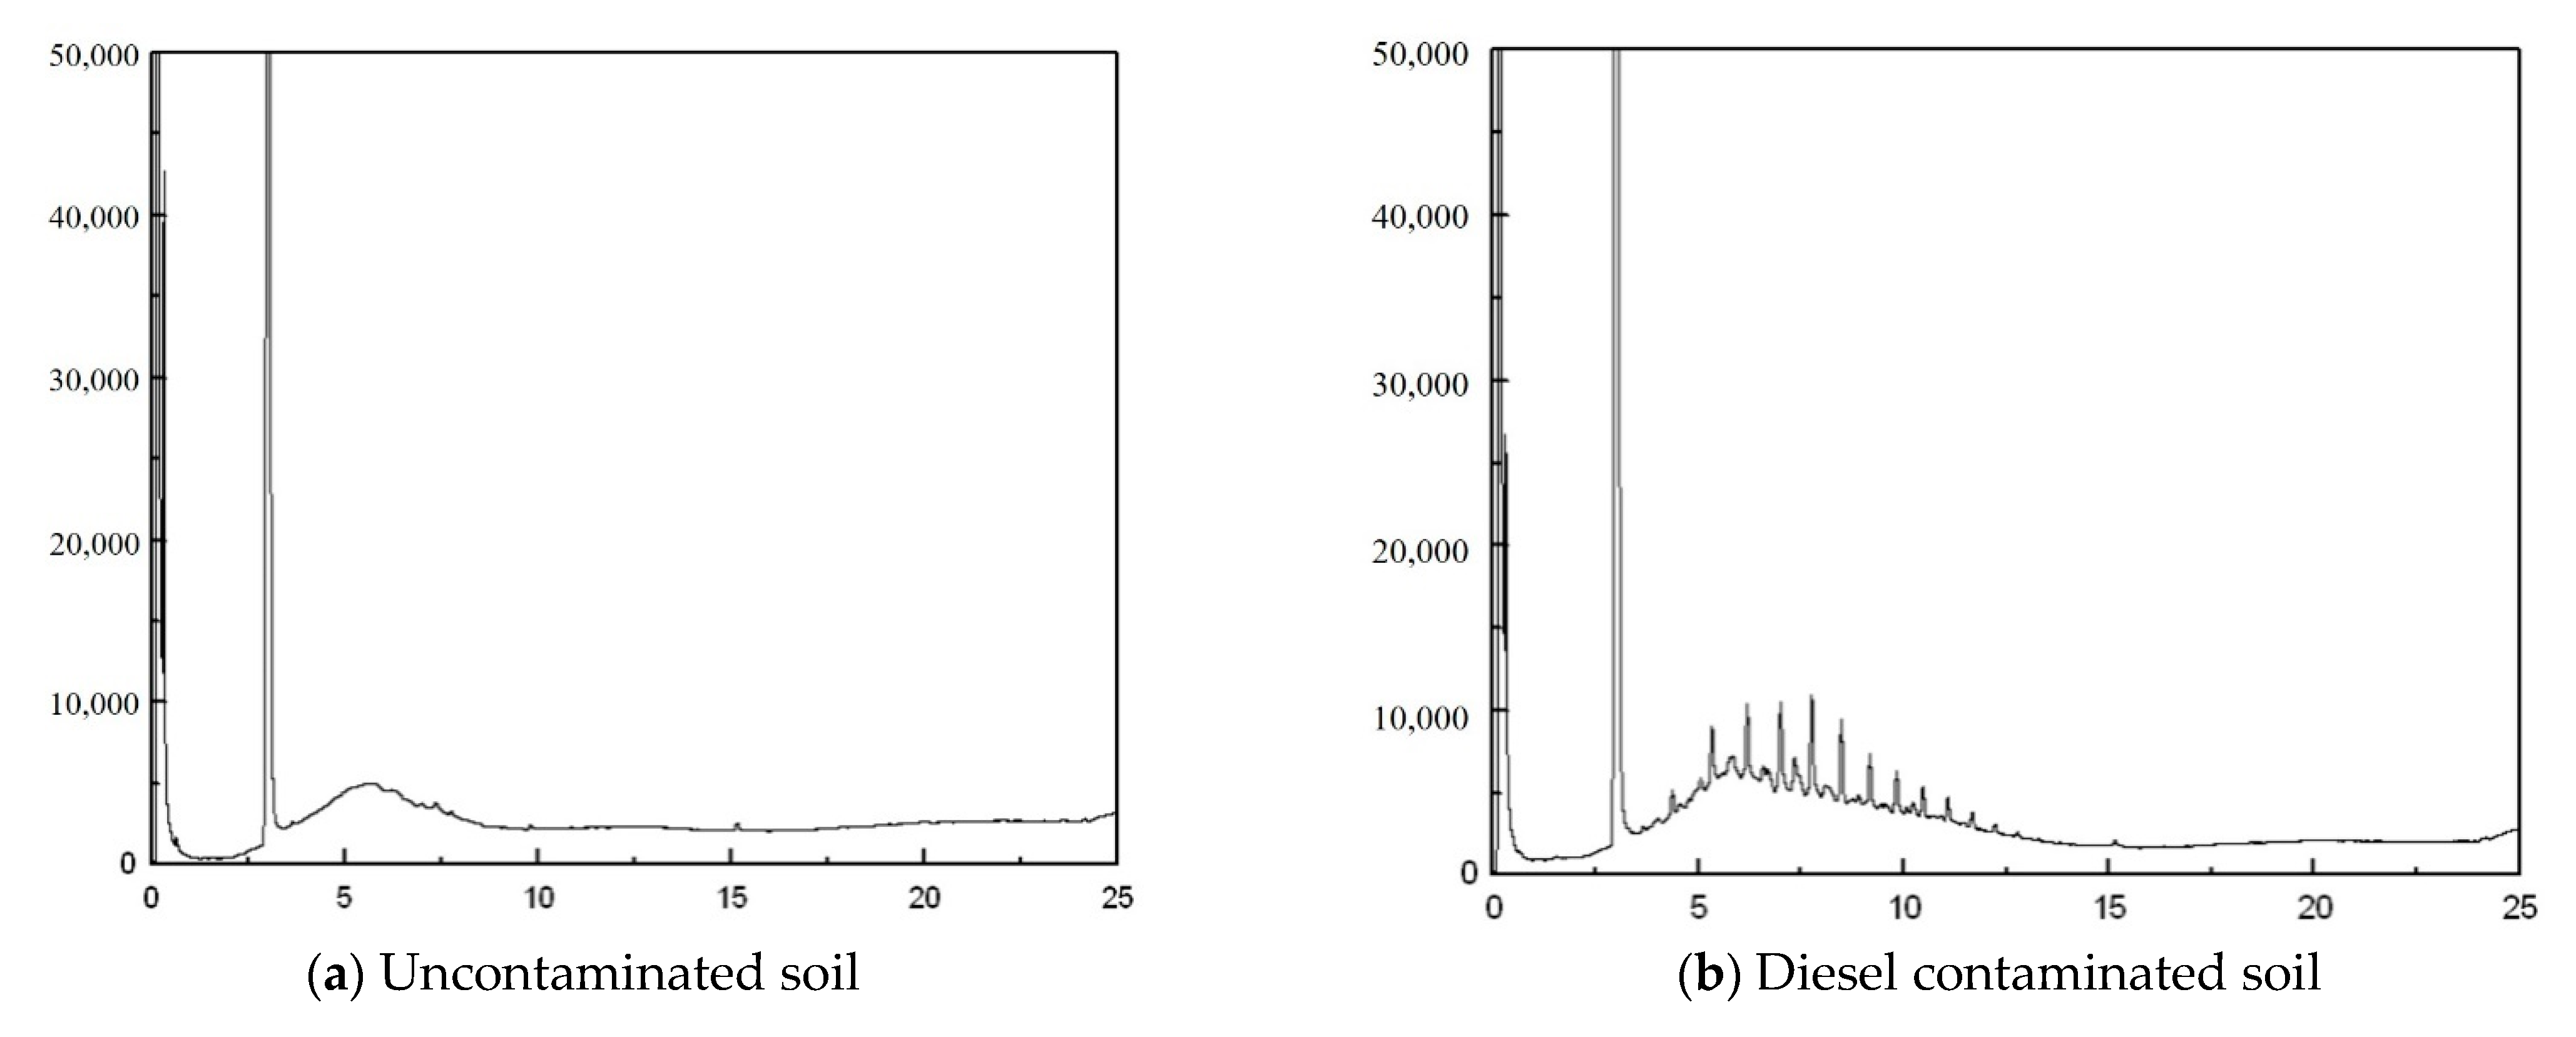
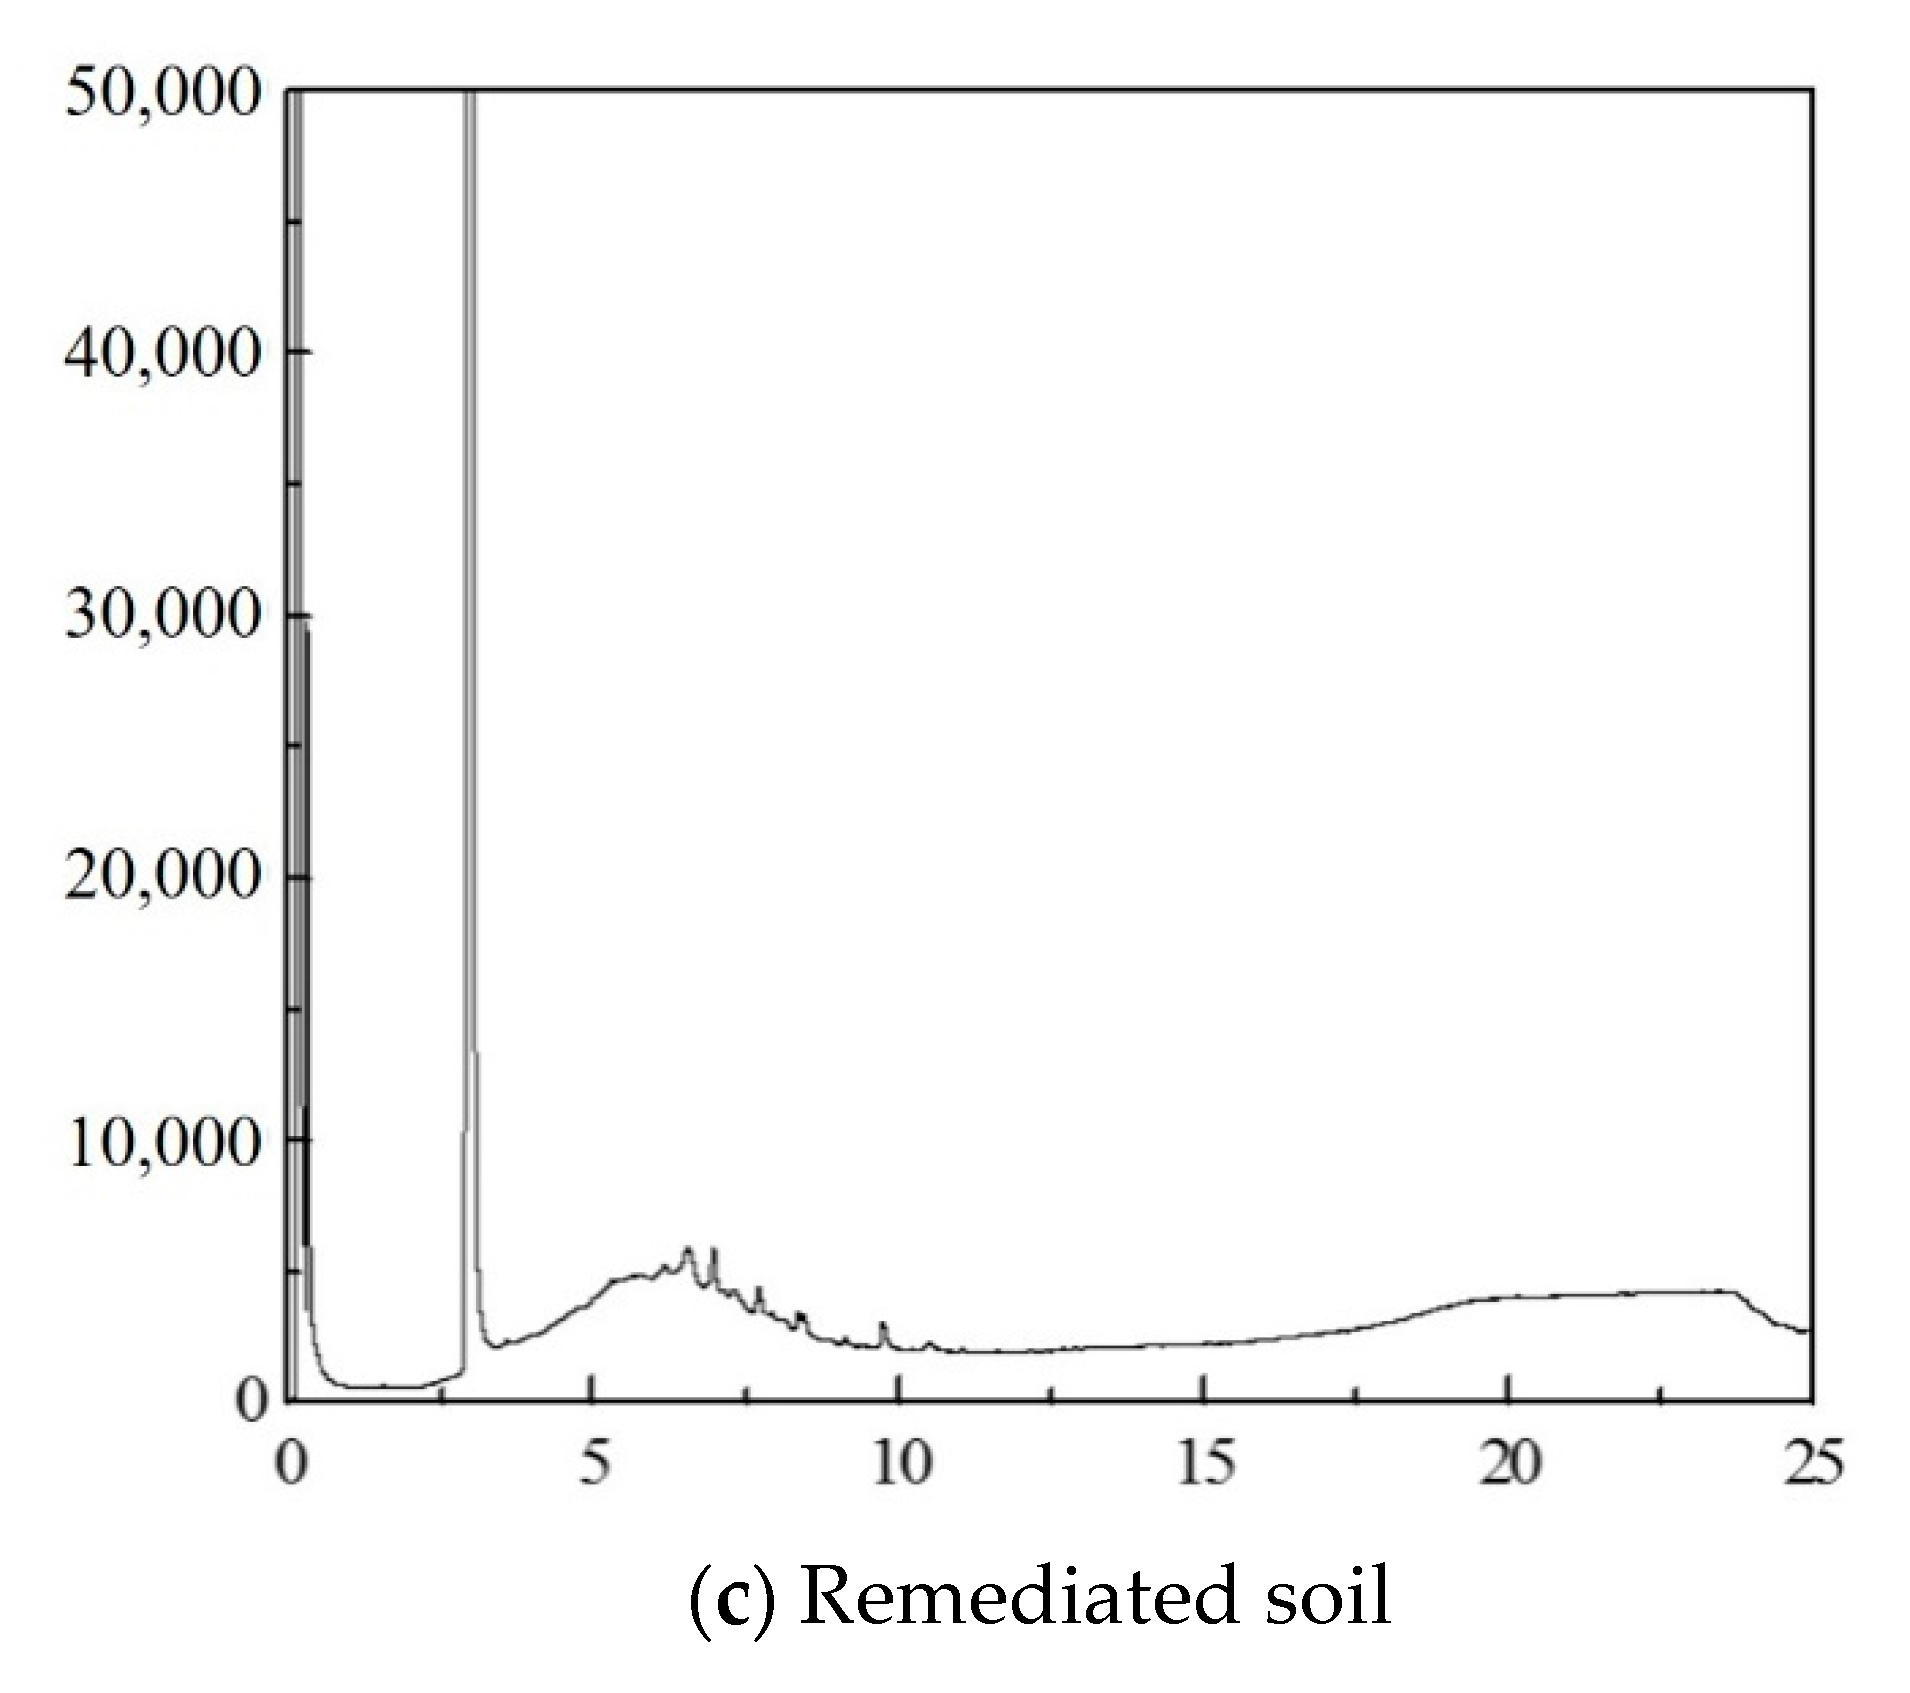
3.3. Analysis of Diesel Oil Components

In the process of bioremediation, not only the changes in the content of pollutants should be considered, but also the composition and toxicity of the residual pollutants in the soil after the bioremediation so as to avoid greater harm to the soil microecology and crop growth. Figure 4 shows the GC results of diesel in different simulated degradation soils.
The residual diesel components in the soil are shown in Table 1 after mass spectrometry analysis. According to the components of diesel fuel and mass spectrometry analysis, compounds No. 2, 4, 6, 8, and 10 should be the intermediate products of diesel degradation during the soil bioremediation process. After comparison with the mass spectrum database, the most likely structural formula is shown in Figure 4d. The components remaining in the soil after diesel degradation are mainly alcohols, lipids, and a small number of fatty amine compounds. These substances have very low toxicity. It also shows that the main degradation pathway of alkanes in the soil is achieved through the β oxidation process of degrading bacteria [50].

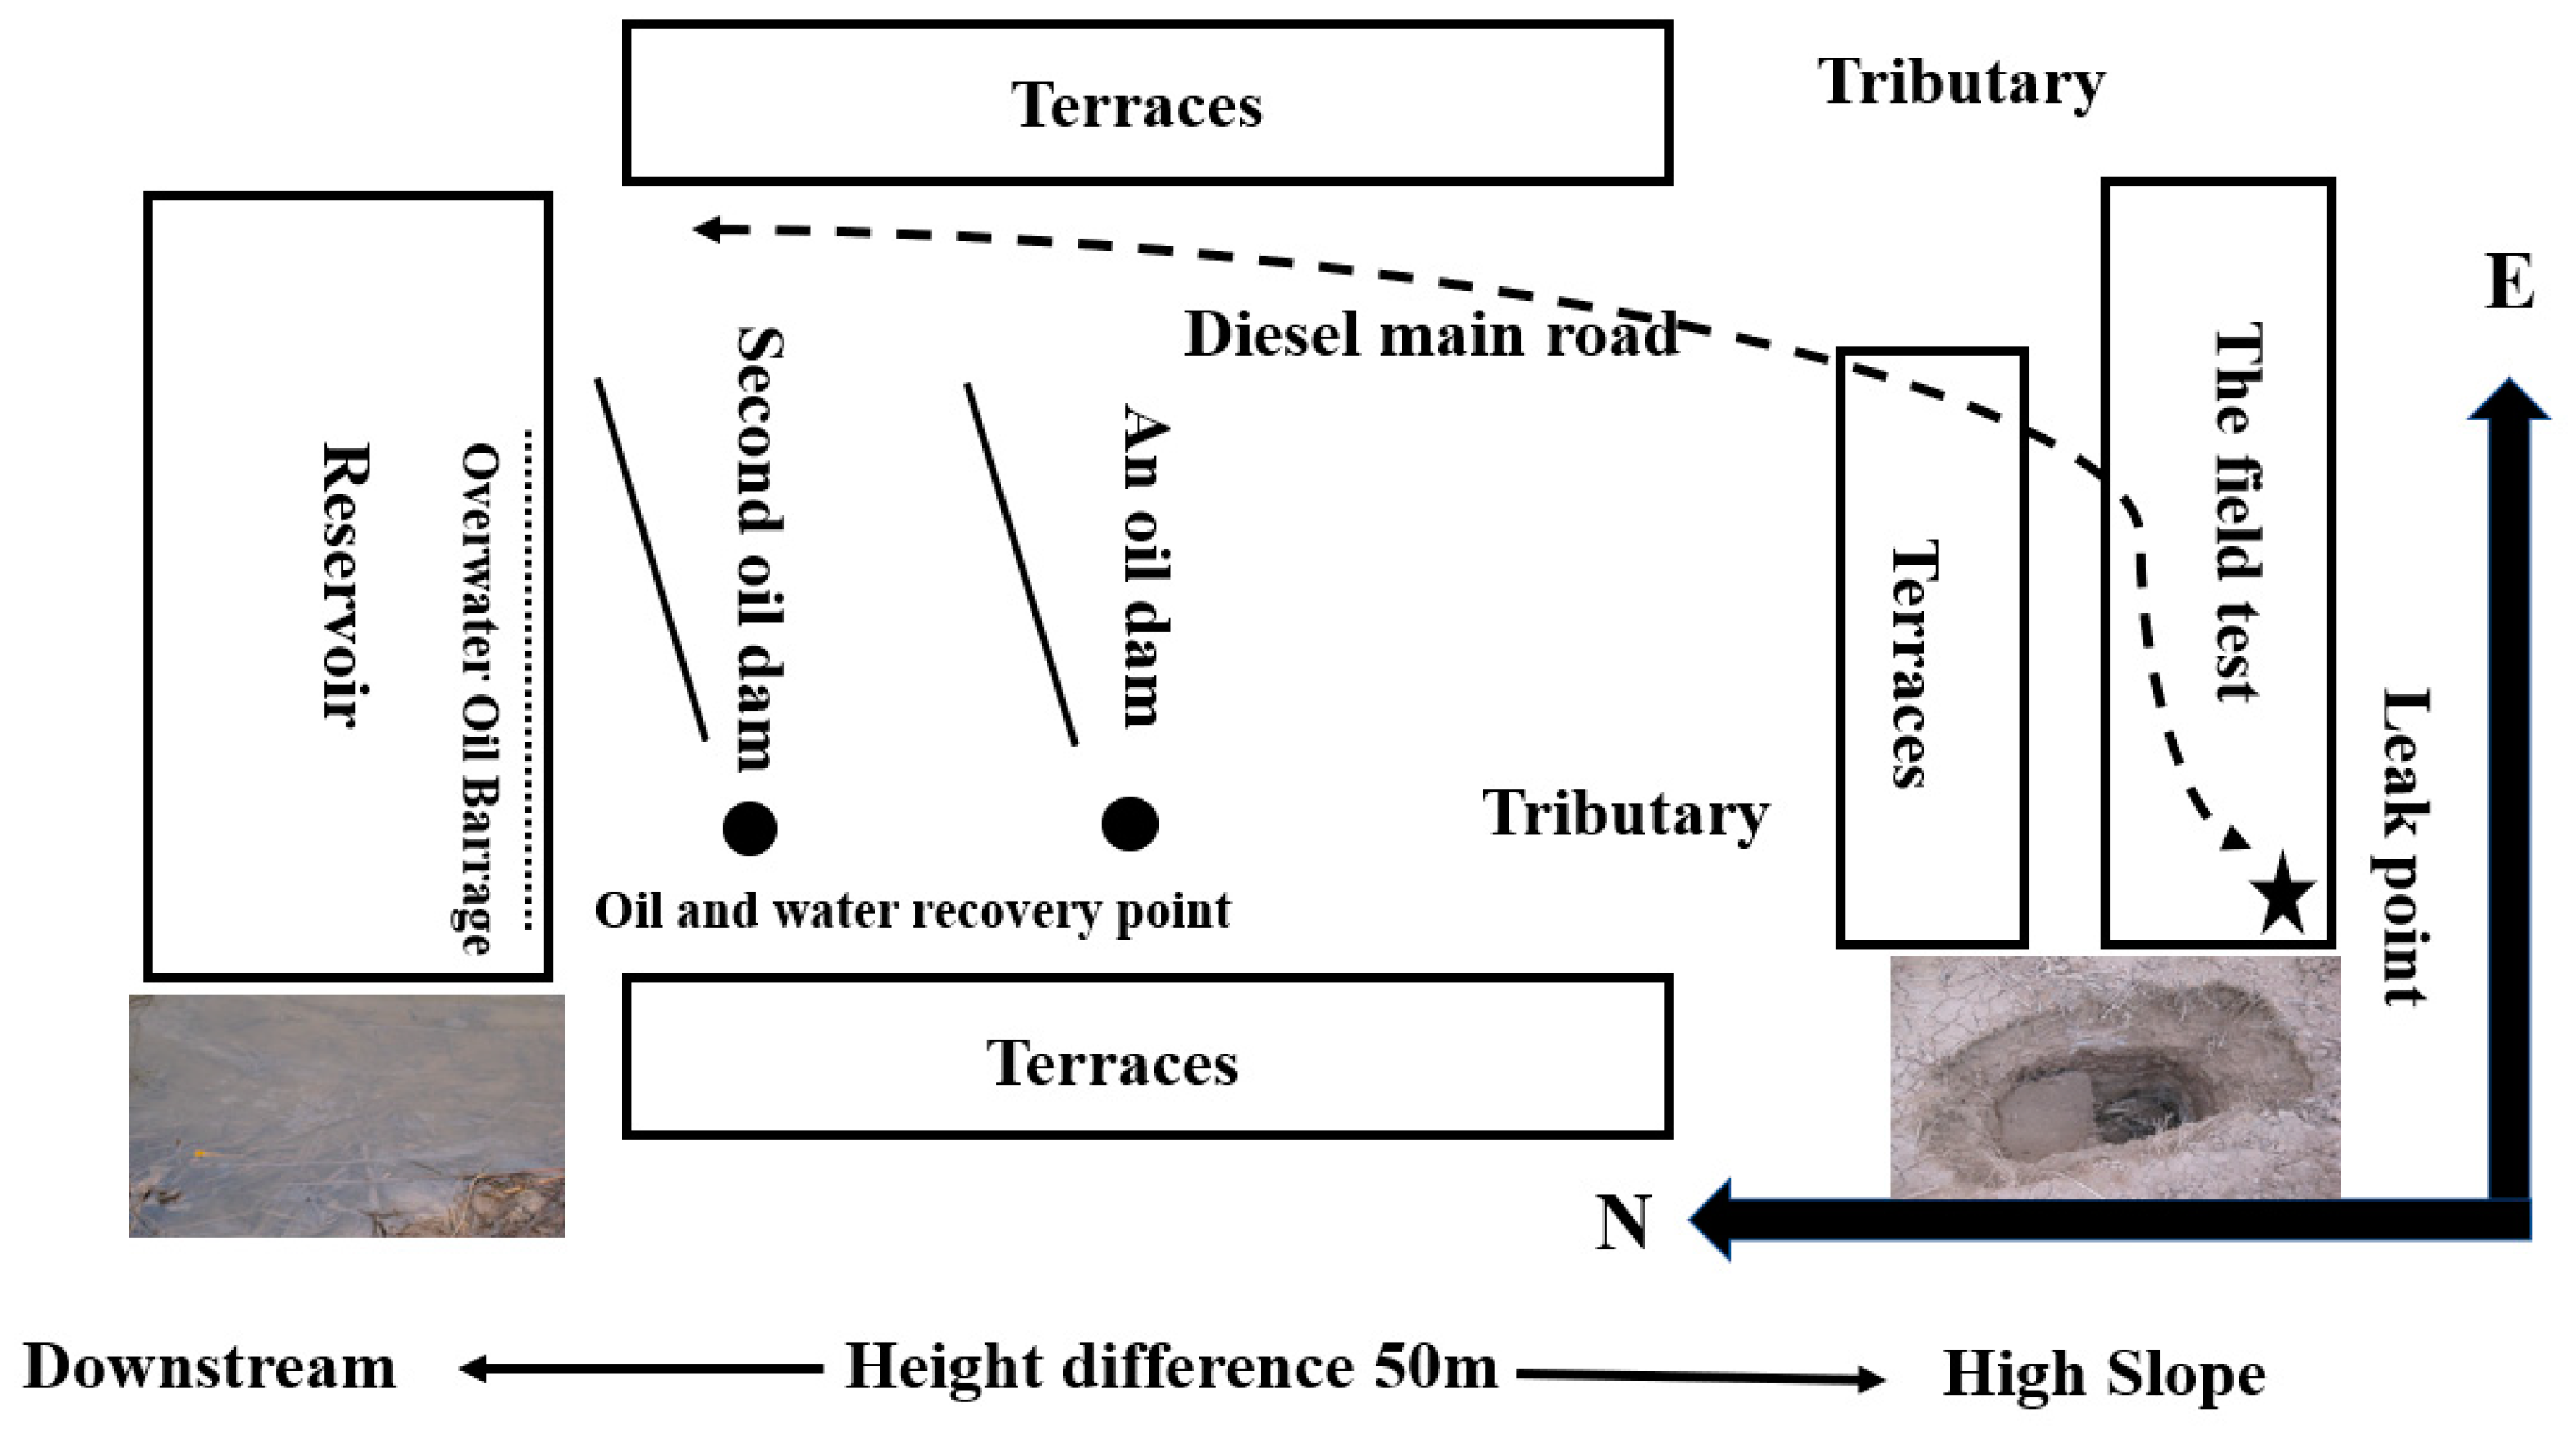
3.4. The On-Site Test of the Biosimulation-Bioaugmentation Joint Remediation

Using the biostimulation-bioaugmentation joint process, as described in Section 2.2, on-site remediations were conducted for one month. Figure 5 shows the pictures of the contaminated soil before and after the bioremediation.
Figure 5 shows that the surface of the field was flat after bioremediation, green grass appeared, indicating the recovery of the soil fertility directly. After a month of operation, the content of diesel decreased from 2.7% ± 0.3 to 1.12% ± 0.1. Meanwhile, the physical and chemical properties of the remediated soil were close to the uncontaminated counterpart. More information is available in Table A2 and Figure A2 (Appendix B and Appendix F).

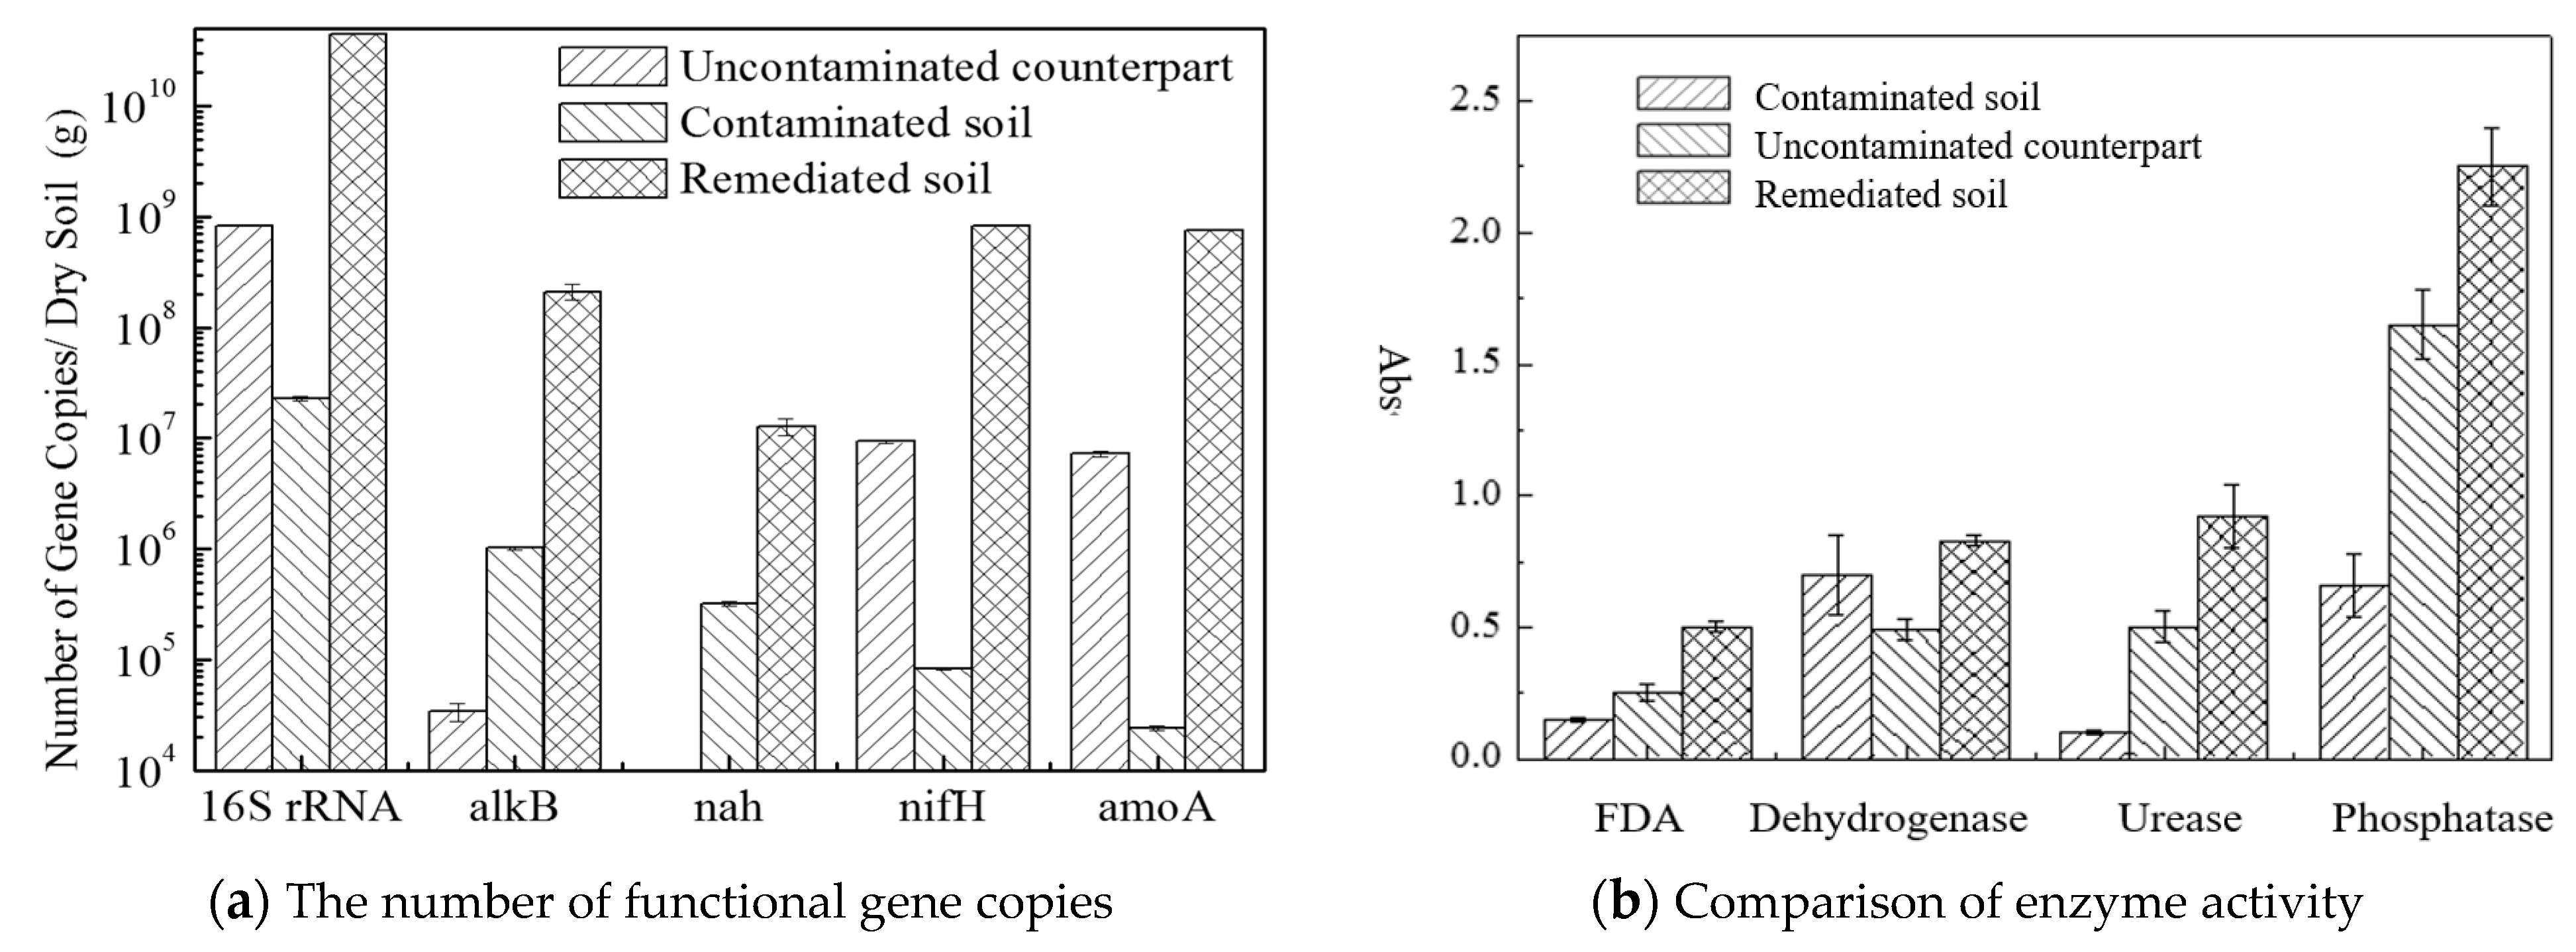
3.5. Profiling of Functional Genes and Enzyme Activity during Biodegradation

The real-time PCR quantification of functional soil bacteria involved in universal bacteria (16S rRNA), nitrogen fixation (nifH), ammoxidation (amoA), alkane degradation (alkB), and naphthalene degradation (nah) are shown in Figure 6.
As shown in Figure 6a, the diesel contamination in the soil led to a reduction for the universal bacteria (UB), the nitrogen-fixing bacteria (NFB), and the ammonia-oxidizing bacteria (AOB). By contrast, the amount of alkane degradation bacteria (ADB) and naphthalene degradation bacteria (NDB) increased. This indicated diesel contaminants harmful to UB, as described by Calvo et al. [51].
The amount of alkB and nah genes that encode, respectively, the alkane hydroxylase and naphthalene dioxygenase, are increased from 2 × 10⁴ to 1 × 10⁶, indicating the stimulation effect. Similar enrichments in indigenous degrading microorganisms by the selective pressure exerted by petroleum hydrocarbons have been reported [52,53,54]. There was a qualitative change of NDB, which was not detectable in the uncontaminated counterpart. The diesel contamination led to its appearance, up to 2 × 10⁵. The difference in the amount of the ADB and NDB in the contaminated soil could be due to the different biodegradability for alkane and PAHs.
The nitrogen cycle is one of the most important cycles in the biosphere, consisting of nitrogen assimilation, ammoniation, nitrogen fixation, nitrification, and denitrification. During the nitrogen cycle, the key reactions are catalyzed by dinitrogenase and ammonia oxidase, which are encoded by nifH, amoA genes, respectively. The population of nitrogen cycle-related bacteria reflects nitrogen nutritional status in soil. The presence of NFB and AOB is also beneficial for the accumulation of available nitrogen. The decrease of NFB and AOB populations indicated the destruction of the nitrogen cycle due to diesel contamination, as Knowles and Wishart [55] reported. They found that light PAHs might cause the strong inhibition of the nitrogen cycle.
As for the N-B process, the number of copies for all functional genes increased, indicating the promotion of both nitrogen cycle genes and degrading reactions. It was reported that biostimulation operations displayed high remediation efficiency when nutrient depletion occurred. Biostimulation could particularly effectively recover the nitrogen cycle [56]. The increase of the NDB displayed the effect of biostimulation as the gene level.
Figure 6b analyzes the FDA hydrolase activity, dehydrogenase activity, urease activity, and phosphatase activity of the soil after restoration. First, the FDA hydrolase activity has recovered and exceeded the normal value, indicating that after the combined remediation of bioaugmentation and biostimulation, the pollutants in the soil are removed and the soil nutrient level is improved, thereby promoting the improvement of soil microbial activity. From the perspective of dehydrogenase, due to the addition of degrading bacteria, soil dehydrogenase activity is increased, laying a foundation for further bioremediation in the future. The activity levels of urease and phosphatase are more than in normal soil, showing that for the treatment of barren contaminated soil, biostimulation remediation technology can effectively restore the cyclic activity of soil nitrogen and phosphorus.
The above results show that the enzyme activity of the soil is severely reduced without treatment after the soil is polluted, and the pollution affects the soil micro-ecology and farming ability. After bioremediation, the soil functional enzyme activity indicators tend to recover and exceed normal values.

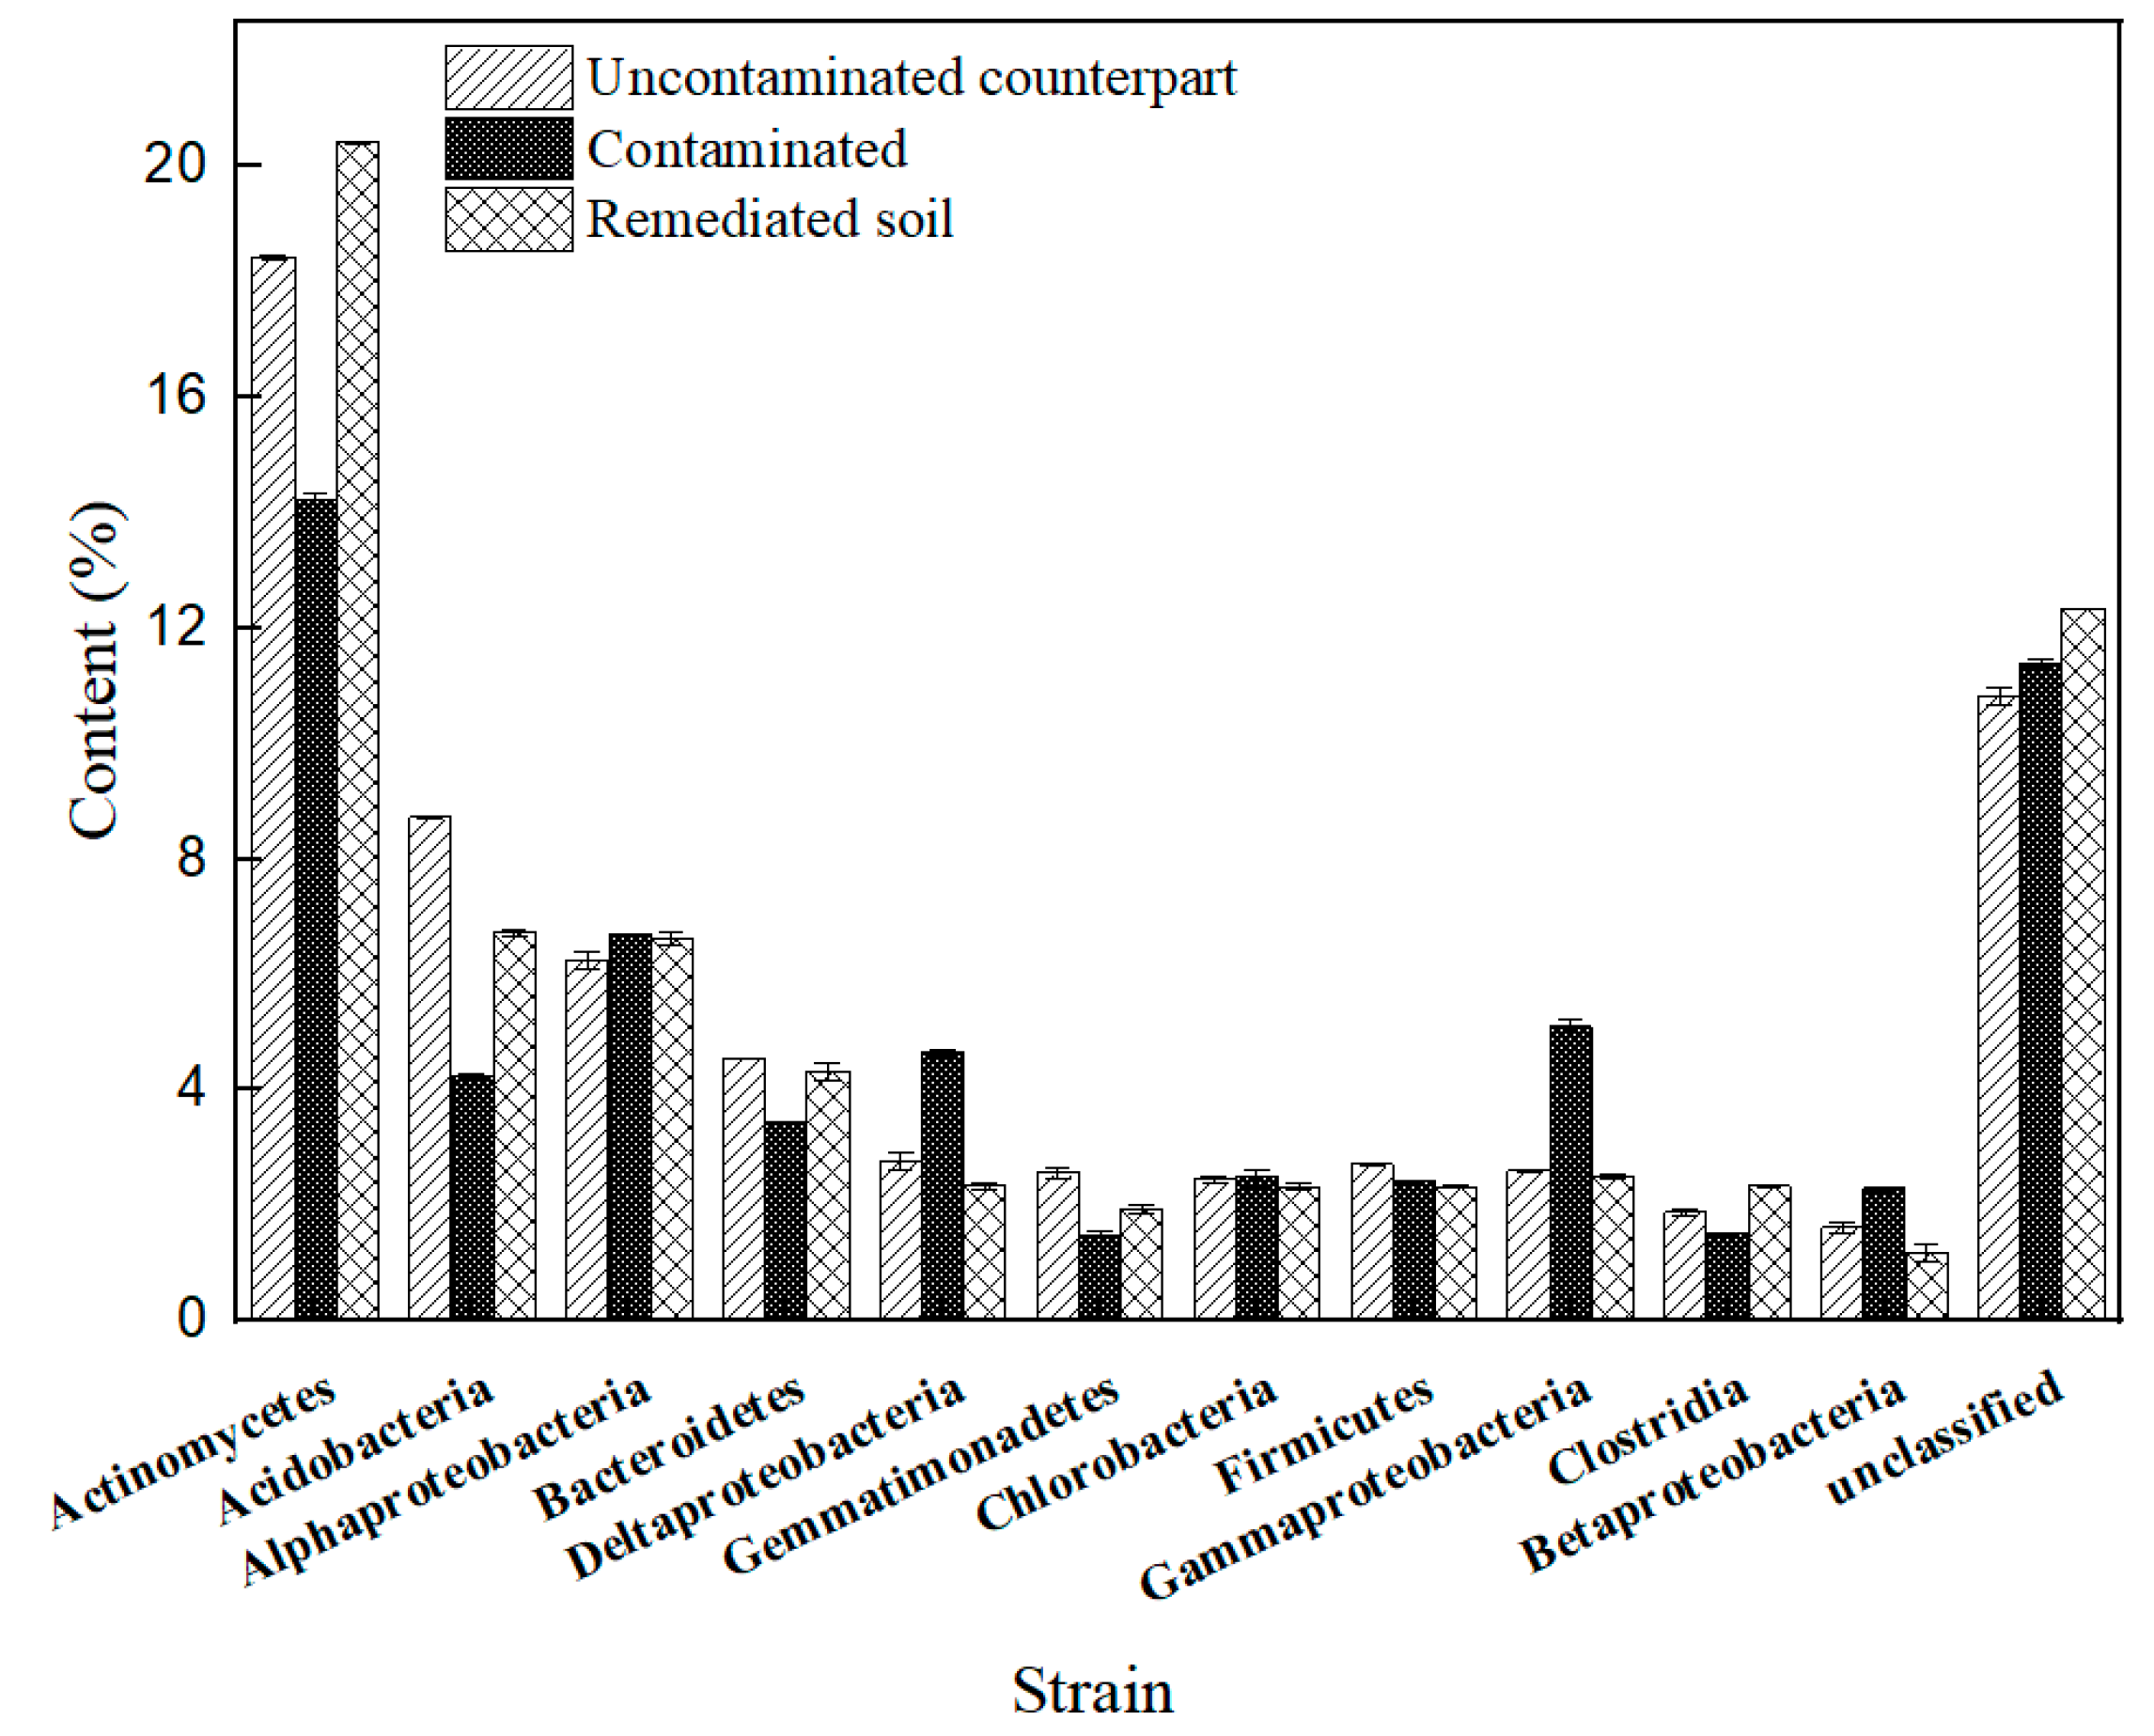
3.6. Profiling of Microbial Community during the Biostimulation-Bioaugmentation Joint Remediation Process

The Illumina MiSeq sequencing quantification of the microbial community involved in the Actinomycetes, Acidobacteria, Bacteroidetes, Deltaproteobacteria, and Gammaproteobacteria are shown in Figure 7.
As shown in Figure 7, the diesel contamination in the soil led to a reduction for the Actinomycetes, Acidobacteria, and Bacteroidetes, which are involved in the regular microorganisms in the soil, as also reported by Greenwood et al. [57] and Zhang et al. [58], indicating the inhibition effects for the regular microbial community. In addition to diesel contamination, the low electrical conductivity reduced the oxygen content of the soil. Meanwhile, the proteobacteria were stimulated by diesel contamination, i.e., Gammaproteobacteria from 2.61% ± 0.02 to 5.08% ± 0.15 in the contaminated soil. Such enrichment in degrading microorganisms by the selective pressure exerted by diesel has also been reported by Ramsay et al. [59] and Harayama et al. [60]. After the bioremediation operation, the Actinomycetes, Acidobacteria, and Bacteroidetes approached the level of those in uncontaminated soil, indicating the recovery of the regular microorganisms. The flow chart of the diesel contaminated site demonstration is shown in Figure 8.

4. Conclusions

In this work, we investigated the remediation effect on diesel-contaminated farmland soil using different bioremediation methods, including natural volatilization (S), natural attenuation (C), biostimulation (N), bioaugmentation (B), and the biostimulation-bioaugmentation joint (N-B) remediation method. Quantitative analysis of bacterial genes and functional genes was carried out by real-time PCR. The functional enzyme activity, functional gene content, and soil total DNA metagenomic information were determined to evaluate the impact of diesel pollution on soil microbial ecology and biological functions by monitoring the soil’s physical and chemical properties to evaluate the feasibility of the experimental program. The results show that the presence of diesel severely damages the soil’s nitrogen cycle system and reduces soil cultivation capacity. The combined remediation of the biostimulation-bioaugmentation can reduce the diesel content in the soil and restore the micro-ecological structure of the soil. This joint remediation process can improve the functional enzyme activity of the soil, strengthen the coding expression of the soil nitrogen cycle functional gene, and stimulate the increase of degradation genes alkB and the expression of the gene nah. The in situ field experiment shows that the diesel content decreases from 2.7% ± 0.3 to 1.12% ± 0.1, and the soil electrical conductivity, available ammonium nitrogen, and available potassium, restore to normal levels. The Miseq sequencing results showed that the microecological diversity returned to normal levels. Among them, the Actinomycetes, Acidobacteria, Bacteroidetes all reached or exceeded normal soil. This work will help us to better understand how to regulate the micro-ecological structure of the biosimulation-bioaugmentation joint remediation process and to further improve the degradation efficiency.

Author Contributions

Conceptualization, X.L.; methodology, X.L. and Y.C.; software, X.L. and Y.C.; validation, Y.C., X.D.; formal analysis, J.Z.; investigation, X.L.; resources, D.L. and Z.L.; data curation, X.L.; writing—original draft preparation, X.L., Y.C.; writing—review and editing, X.L., Y.C.; visualization, Y.C.; supervision, X.D. and J.Z.; project administration, D.L.; funding acquisition, D.L. All authors have read and agreed to the published version of the manuscript.

Funding

This study is supported by the Independent Project from the State Key Laboratory of Petroleum Pollution Control (No. RISEAW2019002) and “The National Key Research and Development Program of China under Grant No. 2018YFA0902200” and the Chinese National Natural Science Foundation under Grant No. 21878175 and State Key Laboratory of NBC Protection for Civilian (No. SKLNBC2020-16).

Institutional Review Board Statement

Not applicable.

Informed Consent Statement

Not applicable.

Data Availability Statement

Not applicable.

Acknowledgments

The authors would like to thank the CNPC Research Institute of Safety and Environmental Technology for its strong assistance and support in this work.

Conflicts of Interest

The authors declare no conflict of interest. The funders had no role in the design of the study; in the collection, analyses, or interpretation of data; in the writing of the manuscript; or in the decision to publish the results.

Appendix A

Table A1. Nomenclature.
Abbreviation
ODOptical Density
qPCRQuantitative Polymerase Chain Reaction
GC-MSGas chromatography-Mass spectrometry
TTC2,3,5-triphenyltetrazolium chloride
TPFTriphenylformanzan
nifHnitrogen fixation
amoAAmmoxidation
alkBalkane degradation
nahnaphthalene degradation
UBuniversal bacteria
NFBnitrogen-fixing bacteria
AOBammonia-oxidizing bacteria
ADBalkane degradation bacteria
NDBnaphthalene degradation bacteria
PAHsPolycyclic Aromatic Hydrocarbons
TPHTotal Petroleum Hydrocarbon
FDA hydrolaseFluorescein Diacetate Hydrolase

Appendix B. Physicochemical Properties of Soil Samples

The physicochemical properties of soil samples were determined at the Beijing Academy of Agricultural and Forestry Sciences. The results are presented in Table A2.
Table A2. The physicochemical properties of the soil.
SamplesResults
Organic MatterAmmonium NitrogenAvailable PhosphorusSoil pHECSoil Texture (%)
g/kgmg/kgmg/kgmS/mSandSiltClay
Uncontaminated counterpart20.87.231448.1910.12.4413.6824
Diesel contaminated soil29.77.591148.28.833.9812.1426
Remediated soil17.810.31507.9924.72.8213.2425
Referenced value>15>20>1007.5–8.5<50
Table A2 shows the differences in the soil samples. Due to the diesel contaminant, the soil’s organic matter increased from 20.8 to 29.7 (g/kg). It was the typical characteristic for petroleum hydrocarbon contamination. Both the normal soil and the contaminated soil showed lower ammonium nitrogen and available phosphorus according to the referenced value (referenced values according to the data from Beijing Academy of Agricultural and Forestry Sciences), indicating the nutrient depletion for the local soil. The electrical conductivity decreased obviously after the pollution, which was particularly harmful to the growth of both plants and microorganisms. Thus the remediation plan should consider the degradation of the contaminants, the recovery of the soil nutrient content, and the electrical conductivity.
After the bioremediation operation, it was shown in Table A2 that the physical and chemical properties of the remediated soil were close to the uncontaminated counterpart. The organic matter dropped to the normal level, indicating the degradation of the contamination. Ammonium nitrogen and available phosphorus increased to the referenced level. Both the pH and electrical conductivity have been restored to the normal level.

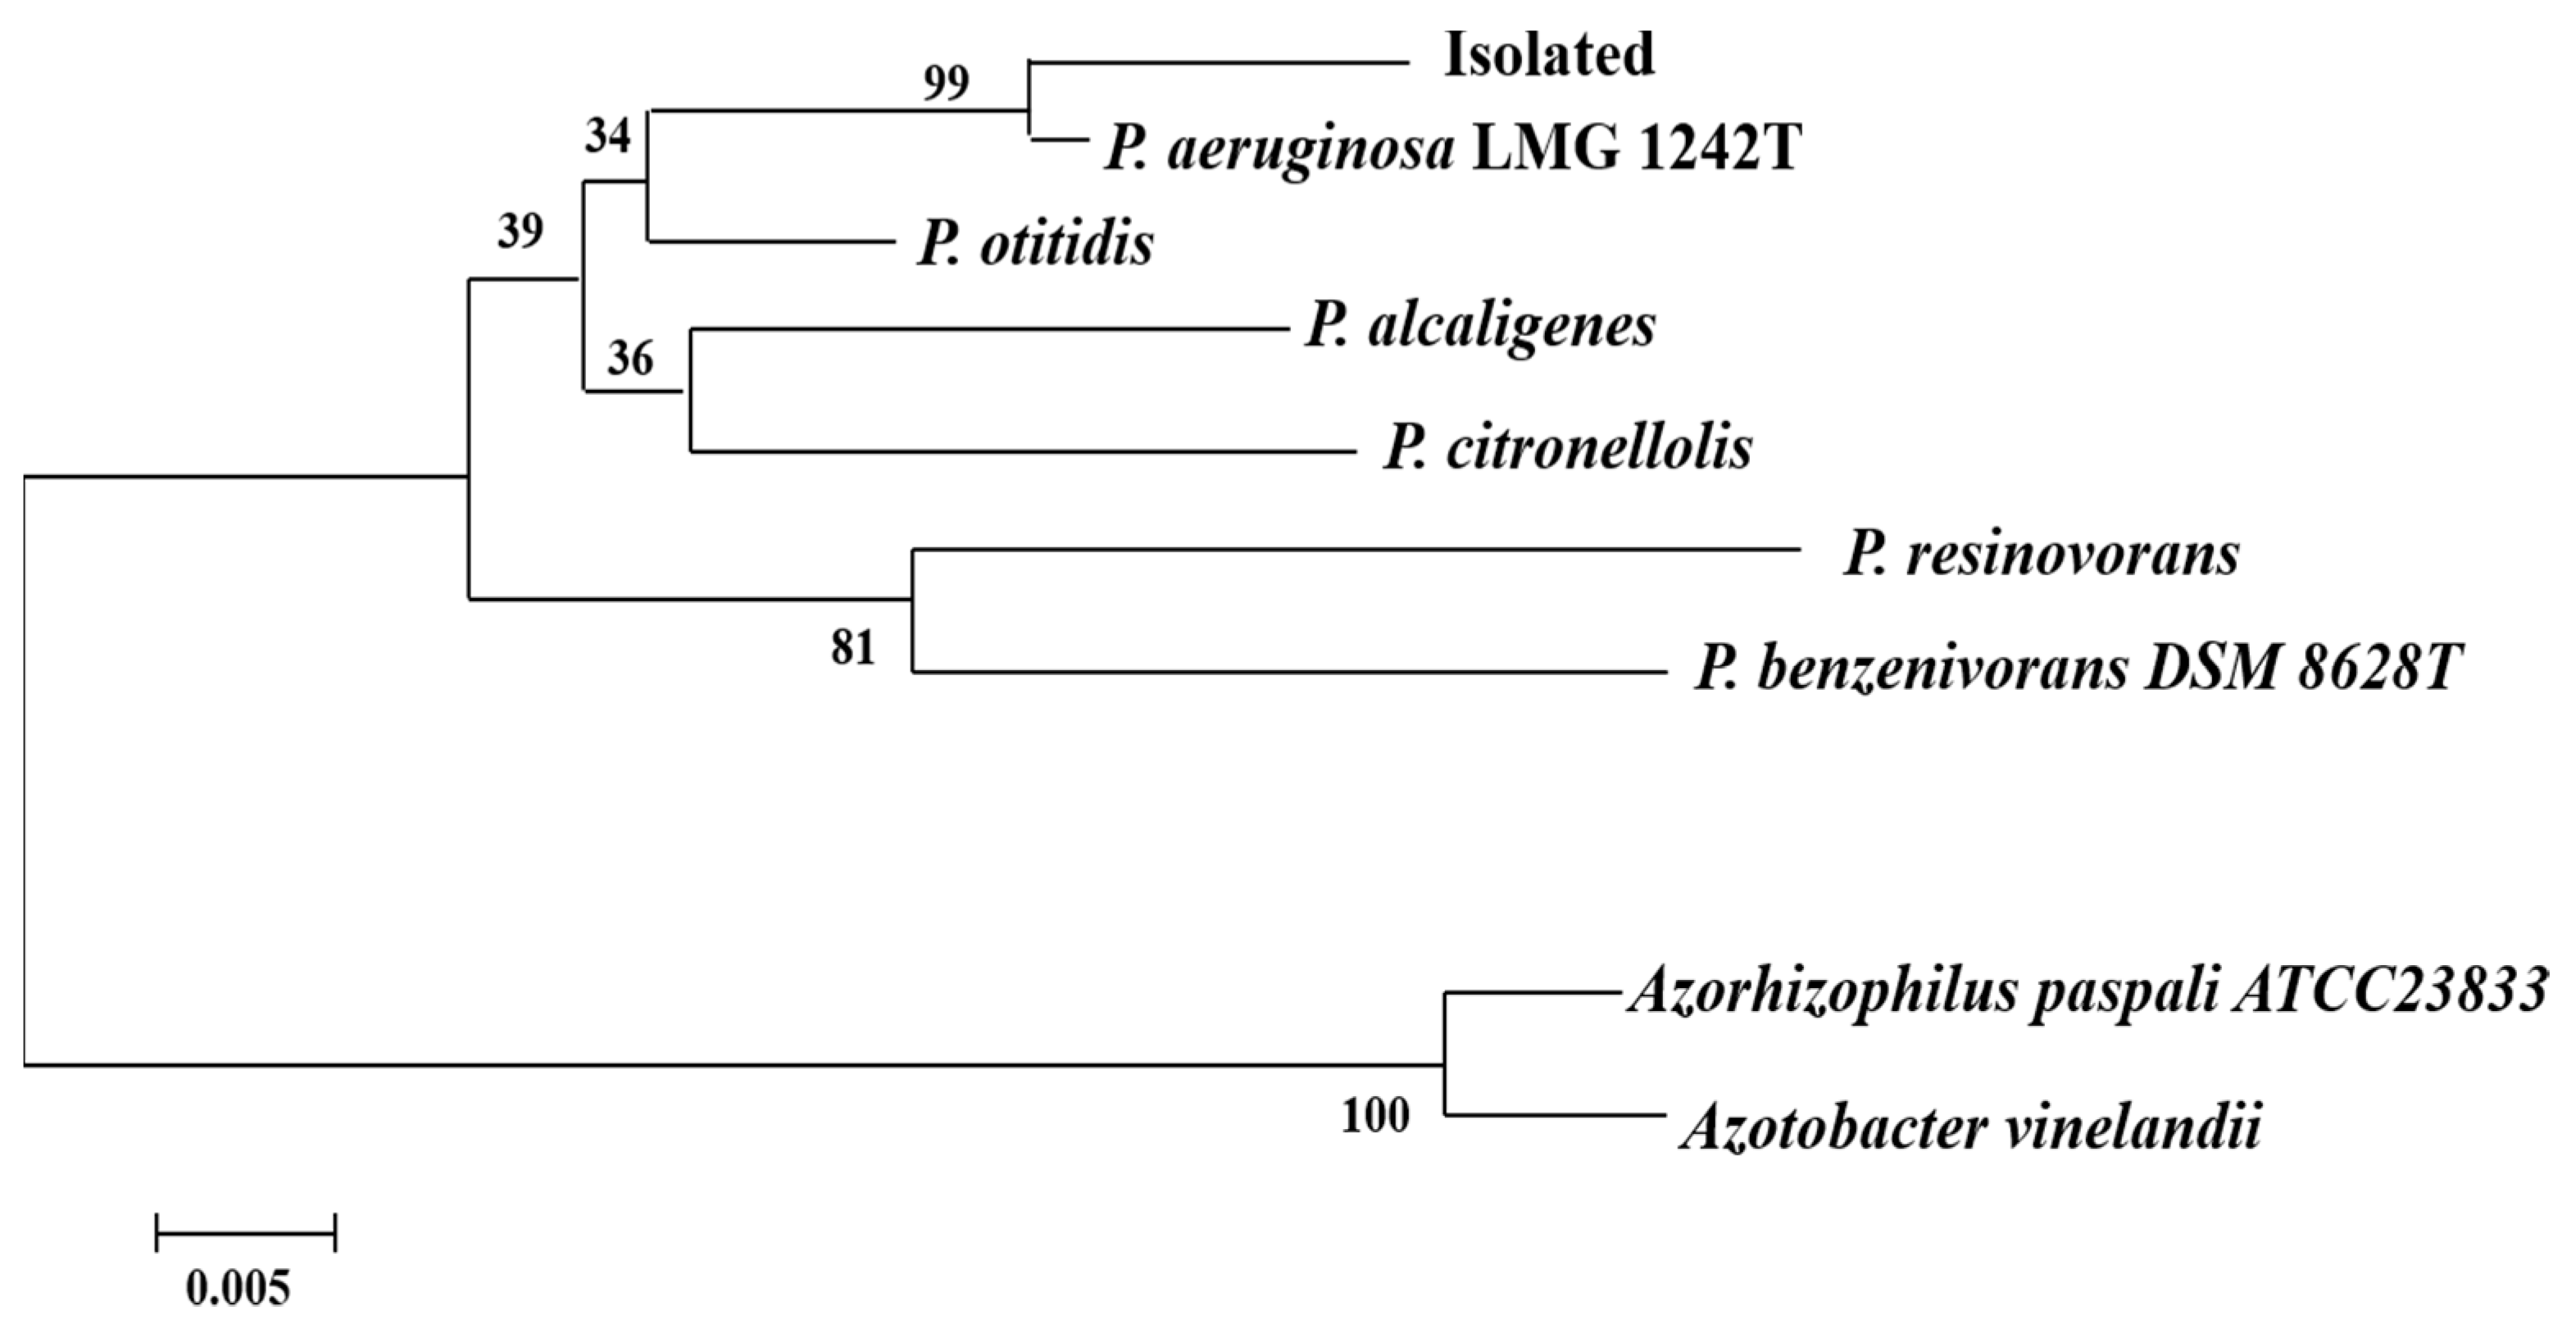
Appendix C. The Isolation of the Strain from the Contaminated Soil

Diesel-contaminated soil (10 g) was suspended with sterile water (100 mL) and blended at 170 rpm for 24 h in 30 °C. The resultant slurry was added to 3 mL sterilized standard #0 diesel (0.22 um filter) each day and incubated in 3 days. The resultant slurry was serially diluted with physiological saline, and aliquots with 0.1 mL culture were plated on solid plates. All of the plates were incubated at 30 °C for 24 h. Isolates were distinguishable based on colony morphology.
HD-2 was selected as the target strain through the diesel degradation rate experiment, and the 16S rDNA of HD-2 was specifically amplified using the bacterial universal primer 27f/1492r. The amplified PCR products were purified and sequenced. The sequencing results were compared with the 16S rDNA sequences of other bacteria through the Genbank database. Through Mega 5.0 analysis, the PCR product sequence of HD-2 has high homology with multiple representative strains of Pseudomonas. The phylogenetic tree construction is shown in Figure A1. Therefore, HD-2 was identified as Pseudomonas by the 16S rDNA gene sequence. The Gram staining experiment found that the bacterium was a Gram-negative bacterium.
Figure A1. Phylogenetic tree of HD-2 strain.
Applsci 11 06305 g0a1

Appendix D. The Primer Sequences and Normal PCR Procedure

Table A3. The primer sequences and normal PCR procedure.
Target GenePrimer (5′-3′)PCR Program
16S rRNA
Universal
AAACTCAAAKGAATTGACGG10 min at 95 °C; followed by 40 cycles of 15 s at 95 °C, 30 s at 50 °C, 50 s at 72 °C
CTCACRRCACGAGCTGCTGAC
alkB
Partial alkane hydroxylase gene
AACTACMTCGARCAYTACGG5 min at 94 °C; followed by 40 cycles of 15 s at 95 °C, 30 s at 50 °C, 45 s at 72 °C
TGAMGATGTGGTYRCTGTTCC
nah
Partial naphthalene dioxygenase gene
CAAAARCACCTGATTYATGG10 min at 95 °C; followed by 40 cycles of 1 min at 95 °C, 1 min at 49 °C, 2 min at 72 °C
AYRCGRGSGACTTCTTTCAA
nifH
Partial nitrogen fixation gene
AAAGGYGGWATCGGYAARTCCACCAC5 min at 95 °C; followed by 40 cycles of 1 min at 94 °C, 1 min at 55 °C, 2 min at 72 °C
TTGTTSGCSGCRTACATSGCCATCAT
amoA
Partial nitrification gene
GGGGTTTCTACTGGTGGT5 min at 94 °C; followed by 40 cycles of 1 min at 94 °C; 90 s at 60 °C, 90 s at 72 °C

Appendix E. Standard Curves for Quantitative PCR (qPCR)

The PCR products were purified using a TIAN Quick Midi Purification Kit (TIANGEN, Beijing, China), ligated with the pMD19-T cloning vector (TAKARA, Dalian, China), and transformed into DH5α/JM109 (TIANGEN, China) competent cell. Transformants were selected on LB(Luria-Bertani) agar plates containing ampicillin (final concentration of 50 μg/mL), 4 μL of 200 mg/mL IPTG and 40 μL of 20 mg/mL X-gal. Positive clones confirmed by colony PCR were inoculated into LB liquid medium with ampicillin (50 μg/mL) and incubated at 37 °C, 145 r/min for 12 h. The plasmid DNA was extracted using a Plasmid Miniprep Kit (Biomiga, San Diego, CA, USA). The concentrations of plasmids were determined by a NANODROP 1000 Spectrophotometer (Thermo Scientific, Rockwood, TN, USA). Ten-fold serial dilution was conducted to construct standard plasmid DNA with 103 to 108 gene copies/μL. Standard curves for the taxonomic and functional genes were generated by plotting the threshold cycle (Ct) values versus the logarithmic values of gene copy numbers.

Appendix F. Total Diesel Analysis

The content of diesel in the soil was determined by gas chromatography analysis. The gas chromatography results were shown in Figure A2.
It was seen the chromatograph peak of the diesel in the contaminated soil. According to the standard curve, the diesel content in the soil was around 2.5–3.0% (g/g). After a month’s operation, the content of diesel decreased to 1.12%. According to the Guidance Document for the Remediation of Contaminated Soils (USEPA, 2007), the diesel content after bioremediation was close to the standard level.
Figure A2. The gas chromatography analysis of the soil.
Applsci 11 06305 g0a2aApplsci 11 06305 g0a2b

Appendix G

The data of sequencing coverage and reads were shown in the Figure A3. The sequencing coverage of the DNA samples was not less than 90%. The valid reads were more than 8.0 × 10⁴ for every DNA extract from the soil. The different number of sequences might be due to the sample preparation and the change of the microbial community for the soil. The results of the statistics for cluster and distribution of the DNA reads are shown in Table A4.
Figure A3. Data of sequencing coverage and sequencing reads.
Applsci 11 06305 g0a3
Table A4. The statistics for cluster and distribution of the DNA reads.
StartEndNBasesAmbigsPolymerNumSeqs
Minimum:1387150031
2.5%-tile:139116802835,020
25%-tile:139117002835,020
Median:139118804670,039
75%-tile:1391193051,005,058
97.5%-tile:1391194051,306,575
Maximum:2391216061,431,033
Mean:1.00028391182.77403.8571775,285
uniqueseqs: 174,834
totalseqs: 1,431,033

References

  1. Guan, Z.; Tang, X.Y.; Nishimura, T.; Katou, H.; Liu, H.Y.; Qing, J. Surfactant-enhanced flushing enhances colloid transport and alters macroporosity in diesel-contaminated soil. J. Environ. Sci. 2018, 64, 197–206. [Google Scholar] [CrossRef] [PubMed]
  2. Pasha, A.Y.; Hu, L.M.; Meegoda, J.A.; Aflaki, E.; Du, J. Centrifuge modeling of in situ surfactant enhanced flushing of diesel contaminated soil. Geotech. Test. J. 2011, 34, 1–11. [Google Scholar] [CrossRef]
  3. Nazri, M.K.H.M.; Sapawe, N. A Short Review on Photocatalytic Reaction in Diesel Degradation. Mater. Today Proc. 2020, 31, A33–A37. [Google Scholar] [CrossRef]
  4. Al-Baldawi, I.A.; Abdullah, S.R.S.; Anuar, N. Phytodegradation of total petroleum hydrocarbon (TPH) in diesel-contaminated water using Scirpus grossus. Ecol. Eng. 2015, 74, 463–473. [Google Scholar] [CrossRef]
  5. Fahid, M.; Arslan, M.; Shabir, G.; Younus, S.; Yasmeen, T.; Rizwan, M.; Siddique, K.; Ahmad, S.R.; Tahseen, R.; Iqbal, S.; et al. Phragmites australis in combination with hydrocarbons degrading bacteria is a suitable option for remediation of diesel-contaminated water in floating wetlands. Chemosphere 2020, 240, 124890. [Google Scholar] [CrossRef] [PubMed]
  6. Hunt, L.J.; Duca, D.; Dan, T.; Knopper, L.D. Petroleum hydrocarbon (PHC) uptake in plants: A literature review. Environ. Pollut. 2019, 245, 472–484. [Google Scholar] [CrossRef] [PubMed]
  7. Moreira, I.T.A.; Oliveira, O.M.C.; Triguis, J.A.; Santos, A.M.P.D.; Queiroz, A.F.S.; Martins, C.M.S.; Silva, C.S.; Jesus, R.S. Phytoremediation using Rhizophora mangle L. in mangrove sediments contaminated by persistent total petroleum hydrocarbons (TPH′s). Microchem. J. 2011, 99, 376–382. [Google Scholar] [CrossRef]
  8. Vasenev, V.I.; Ananeva, N.D.; Ivashchenko, K.V. The effect of pollutants (heavy metals and diesel fuel) on the respiratory activity of constructozems (artificial soils). Russ. J. Ecol. 2013, 44, 475–483. [Google Scholar] [CrossRef]
  9. Al-Turki, A.I. Microbial Polycyclic Aromatic Hydrocarbons Degradation in Soil. Res. J. Environ. Toxicol. 2009, 3, 1–8. [Google Scholar] [CrossRef] [Green Version]
  10. Borowik, A.; Wyszkowska, J.; Mirosław, M.; Kucharski, J. Implications of Soil Pollution with Diesel Oil and BP Petroleum with ACTIVE Technology for Soil Health. Int. J. Environ. Res. Public Health 2019, 16, 2474. [Google Scholar] [CrossRef] [Green Version]
  11. Gimžauskaitė, D.; Tamošiūnas, A.; Tučkutė, S.; Snapkauskienė, V.; Aikas, M.; Uscila, R. Treatment of diesel-contaminated soil using thermal water vapor arc plasma. Environ. Sci. Pollut. Res. 2020, 27, 43–54. [Google Scholar] [CrossRef]
  12. Labianca, C.; Gisi, S.D.; Picardi, F.; Todaro, F.; Notarnicola, M. Remediation of a Petroleum Hydrocarbon-Contaminated Site by Soil Vapor Extraction: A Full-Scale Case Study. Appl. Sci. 2020, 10, 4261. [Google Scholar] [CrossRef]
  13. Bortone, I.; Labianca, C.; Todaro, F.; De Gisi, S.; Coulon, F.; Notarnicola, M. Experimental investigations and numerical modeling of in-situ reactive caps for PAH contaminated marine sediments—ScienceDirect. J. Hazard. Mater. 2020, 387, 121724. [Google Scholar] [CrossRef]
  14. Li, X.; Wu, B.; Zhang, Q.; Liu, Y.; Gu, Q. Effects of soil properties on the remediation of diesel-contaminated soil by Triton X-100-aided washing. Environ. Sci. Pollut. Res. 2020, 27, 23323–23330. [Google Scholar] [CrossRef]
  15. Asadollahfardi, G.; Rezaee, M. Electrokinetic remediation of diesel-contaminated silty sand under continuous and periodic voltage application. Environ. Eng. Res. 2018, 24, 456–462. [Google Scholar] [CrossRef] [Green Version]
  16. Ren, J.; Song, X.; Ding, D. Sustainable remediation of diesel-contaminated soil by low-temperature thermal treatment: Improved energy efficiency and soil reusability. Chemosphere 2019, 241, 124952. [Google Scholar] [CrossRef]
  17. Uyizeye, O.C.; Thiet, R.K.; Knorr, M.A. Effects of community-accessible biochar and compost on diesel-contaminated soil. Bioremediation J. 2019, 23, 107–117. [Google Scholar] [CrossRef]
  18. Lee, Y.Y.; Seo, Y.; Ha, M.; Lee, J.; Yang, H.; Cho, K.S. Evaluation of rhizoremediation and methane emission in diesel-contaminated soil cultivated with tall fescue (Festuca arundinacea). Environ. Res. 2021, 194, 110606. [Google Scholar] [CrossRef]
  19. Lofrano, G.; Libralato, G.; Minetto, D.; De Gisi, S.; Todaro, F.; Conte, B.; Calabro, D.; Quatraro, L.; Notarnicola, M. In situ remediation of contaminated marine sediments: An overview. Environ. Sci. Pollut. Res. 2017, 24, 5189–5206. [Google Scholar] [CrossRef] [Green Version]
  20. Eman, K.; Esmaeil, S.; Arturo, A.-M.; Mohamed, T.; Nagalakshmi, H.; Tanvih, M.; Paul, D.M.; Andrew, S.B. Bioremediation potential of diesel-contaminated Libyan soil. Ecotoxicol. Environ. Saf. 2016, 133, 297–305. [Google Scholar] [CrossRef]
  21. Safdari, M.S.; Kariminia, H.R.; Ghobadi Nejad, Z.; Fletcher, T.H. Study Potential of Indigenous Pseudomonas aeruginosa and Bacillus subtilis in Bioremediation of Diesel-Contaminated Water. Water Air Soil Pollut. 2017, 228, 37. [Google Scholar] [CrossRef]
  22. Yasushi, M.; Atsushi, S.; Yuko, M.; Atsushi, F.; Kosuke, S. Enhancing bioremediation of oil-contaminated soils by controlling nutrient dispersion using dual characteristics of soil pore structure. Ecol. Eng. 2013, 51, 237–243. [Google Scholar] [CrossRef]
  23. Łebkowska, M.; Zborowska, E.; Karwowska, E.; Miaśkiewicz-Pęska, E.; Muszyński, A.; Tabernacka, A.; Naumczyk, J.; Jęczalik, M. Bioremediation of soil polluted with fuels by sequential multiple injection of native microorganisms: Field-scale processes in Poland. Ecol. Eng. 2011, 37, 1895–1900. [Google Scholar] [CrossRef]
  24. Lei, H.; Xu, G.; Ming, L.; Gang, D.; Guo, J.S.; Theoneste, N. Correlation among soil microorganisms, soil enzyme activities, and removal rates of pollutants in three constructed wetlands purifying micro-polluted river water. Ecol. Eng. 2012, 46, 98–106. [Google Scholar] [CrossRef]
  25. Ortega, G.; Katherine, O.G.; Zaragoza, D. Degradation of benzene, toluene, and xylene isomers by a bacterial consortium obtained from rhizosphere soil of Cyperus sp grown in a petroleum-contaminated area. Folia Microbiol. 2013, 58, 569–577. [Google Scholar] [CrossRef]
  26. Coenye, T. Classification of Ralstonia pickettii-like isolates from the environment and clinical samples as Ralstonia insidiosa sp. nov. Int. J. Syst. Evol. Microbiol. 2003, 53, 1075–1080. [Google Scholar] [CrossRef] [PubMed]
  27. Funke, G.; Ramos, C.P.; Collins, M.D. Identification of some clinical strains of CDC coryneform group A-3 and A-4 bacteria as Cellulomonas species and proposal of Cellulomonas hominis sp. nov. for some group A-3 strains. J. Clin. Microbiol. 1995, 33, 2091–2097. [Google Scholar] [CrossRef] [PubMed] [Green Version]
  28. Zhang, H.; Hanada, S.; Shigematsu, T.; Shibuya, K.; Kamagata, Y.; Kanagawa, T.; Kurane, R. Burkholderia kururiensis sp. nov. a trichloroethylene (TCE)-degrading bacterium isolated from an aquifer polluted with TCE. Int. J. Syst. Evol. Microbiol. 2000, 50, 743–749. [Google Scholar] [CrossRef] [PubMed] [Green Version]
  29. Grimont, F.; Grimont, P.A.D. Serratia marcescens. Bizio 1823, 288. [Google Scholar] [CrossRef]
  30. Reena, D.; Tiwary, B.N. Isolation of a novel strain of Planomicrobium chinense from diesel contaminated soil of tropical environment. J. Basic Microbiol. 2013, 53, 723–732. [Google Scholar] [CrossRef]
  31. Wannarak, N.; Parichat, N.; Onruthai, P. Diesel oil removal by immobilized Pseudoxanthomonas sp. RN402. Biodegradation 2013, 24, 387–397. [Google Scholar] [CrossRef]
  32. Daghio, M.; Vaiopoulou, E.; Patil, S.A.; Suárez-Suárez, A.; Head, I.M.; Franzetti, A.; Rabaey, K. Anodes stimulate anaerobic toluene degradation via sulfur cycling in marine sediments. Appl. Environ. Microbiol. 2015, 82, 297–307. [Google Scholar] [CrossRef] [Green Version]
  33. Heider, J.; Schühle, K. Anaerobic Biodegradation of Hydrocarbons Including Methane. Prokaryotes 2013, 605–634. [Google Scholar] [CrossRef]
  34. Sutton, N.B.; Maphosa, F.; Morillo, J.A.; Al-Soud, W.A.; Langenhoff, A.A.M.; Grotenhuis, T.; Rijnaarts, H.H.M. Impact of long-term diesel contamination on soil microbial community structure. Appl. Environ. Microbiol. 2013, 79, 619–630. [Google Scholar] [CrossRef] [Green Version]
  35. Wu, B.; Lan, T.; Lu, D.; Liu, Z. Ecological and enzymatic responses to petroleum contamination. Environ. Sci. Process. Impacts 2014, 16, 1501–1509. [Google Scholar] [CrossRef]
  36. Dong, Y.; Lang, Z.; Kong, X.; Lu, D.; Liu, Z. Kinetic and multidimensional profiling of accelerated degradation of oil sludge by biostimulation. Environ. Sci. Process. Impacts 2015, 17, 763–774. [Google Scholar] [CrossRef]
  37. Wu, Z.; Dong, H.; Zou, L.; Lu, D.; Liu, Z. Enriched Microbial Community in Bioaugmentation of Petroleum-Contaminated Soil in the Presence of Wheat Straw. Appl. Biochem. Biotechnol. 2011, 164, 1071–1082. [Google Scholar] [CrossRef]
  38. Bahrampour, T.; Moghanlo, V.S. Evaluation of soil biological activity after soil contaminating by crude oil. Int. J. Agric. Res. Rev. 2012, 2, 671–679. [Google Scholar]
  39. Gupta, S.; Pathak, B.; Fulekar, M.H. Molecular approaches for biodegradation of polycyclic aromatic hydrocarbon compounds: A review. Rev. Environ. Sci. Bio Technol. 2015, 14, 241–269. [Google Scholar] [CrossRef]
  40. Zhou, L.S.; Li, H.; Zhang, Y.; Han, S.Q.; Xu, H. Sphingomonas from petroleum-contaminated soils in Shenfu, China and their PAHs degradation abilities. Braz. J. Microbiol. 2016, 47, 271–278. [Google Scholar] [CrossRef] [Green Version]
  41. Pratiwi, E.; Satwika, T.D.; Agus, F. Analysis of peat bacterial diversity in oil palm plantations and a logged forest in Jambi, Indonesia, using PCR-DGGE technique. IOP Conf. Ser. Earth Environ. Sci. 2021, 648, 012200. [Google Scholar] [CrossRef]
  42. Wolff, D.C.; Cryder, Z.; Gan, J. Soil bacterial community dynamics following surfactant addition and bioaugmentation in pyrene-contaminated soils. Chemosphere 2019, 231, 93–102. [Google Scholar] [CrossRef]
  43. Sutton, N.B.; Kalisz, M.; Krupanek, J.; Marek, J.; Grotenhuis, T.; Smidt, H.; de Weert, J.; Rijnaarts, H.H.M.; van Gaans, P.; Keijzer, T. Geochemical and Microbiological Characteristics during in Situ Chemical Oxidation and in Situ Bioremediation at a Diesel Contaminated Site. Environ. Sci. Technol. 2014, 48, 2352. [Google Scholar] [CrossRef]
  44. Bücker, F.; de Moura, T.M.; da Cunha, M.E.; de Quadros, P.D.; Beker, S.A.; Cazarolli, J.C.; Caramao, E.B.; Frazzon, A.P.G.; Bento, F.M. Evaluation of the deteriogenic microbial community using qPCR, n-alkanes and FAMEs biodegradation in diesel, biodiesel and blends (B5, B10, and B50) during storage. Fuel 2018, 233, 911–917. [Google Scholar] [CrossRef]
  45. Peel, M.C.; Finlayson, B.L.; Mcmahon, T.A. Updated world map of the Köppen-Geiger climate classification. Hydrol. Earth Syst. Sci. 2007, 11, 259–263. [Google Scholar] [CrossRef] [Green Version]
  46. Trindade, P.V.O.; Sobral, L.G.; Rizzo, A.C.L. Evaluation of the biostimulation and bioaugmentation techniques in the bioremediation process of petroleum hydrocarbons contaminated soil. In Proceedings of the Contribuição Técnica a 9th International Petroleum Environmental Conference, Albuquerque, NM, USA, 21–25 October 2002. [Google Scholar]
  47. USEPA. Hazardous Waste Test Methods, Method 3546: Microwave Extraction; USEPA: Washington, DC, USA, 2007.
  48. Dai, R.; Wu, J.; Xu, J.; Yu, M.; Shi, J. Improvement of determination dehydrogenase activity in wheat rhizospheric soil. Jiangsu J. Agric. Sci. 2013, 29, 772–776. [Google Scholar]
  49. Guo, H.; Yao, J.; Cai, M.; Qian, Y.; Guo, Y.; Richnow, H.H.; Blake, R.E.; Doin, S.; Ceccanti, B. Effects of petroleum contamination on soil microbial numbers, metabolic activity and urease activity. Chemosphere 2012, 87, 1273–1280. [Google Scholar] [CrossRef]
  50. Alvarez, H.M. Relationship between β-oxidation pathway and the hydrocarbon-degrading profile in actinomycetes bacteria. Int. Biodeterior. Biodegrad. 2003, 52, 35–42. [Google Scholar] [CrossRef]
  51. Calvo, C.; Silva, C.G.A.; Uad, I.; Manzanera, M.; Perucha, C.; Laguna, J.; Gónzalez, L.J. Biostimulation combined treatments for remediation of diesel contaminated soil. WIT Trans. Ecol. Environ. 2010, 132, 111–119. [Google Scholar] [CrossRef] [Green Version]
  52. Abraham, J.; Gea, T.; Vicent, T. Impact of Biostimulation and Bioaugmentation as Bioremediation Systems on Diesel Contaminated Soil. Environ. Eng. Manag. J. 2016, 15, 1743–1753. [Google Scholar] [CrossRef]
  53. Bosco, F.; Casale, A.; Mazzarino, I.; Godio, A.; Ruffino, B.; Mollea, C.; Chiampo, F. Microcosm evaluation of bioaugmentation and biostimulation efficacy on diesel-contaminated soil. J. Chem. Technol. Biotechnol. 2020, 95, 904–912. [Google Scholar] [CrossRef]
  54. Suja, F.; Rahim, F.; Taha, M.R.; Hambali, N.; Razali, R.; Khalid, A.; Hamzah, A. Effects of local microbial bioaugmentation and biostimulation on the bioremediation of total petroleum hydrocarbons (TPH) in crude oil contaminated soil based on laboratory and field observations. Int. Biodeterior. Biodegrad. 2014, 90, 115–122. [Google Scholar] [CrossRef]
  55. Knowles, R.; Wishart, C. Nitrogen-fixation in arctic marine-sediments-effect of oil and hydrocarbon fractions. Environ. Pollut. 1977, 13, 133–149. [Google Scholar] [CrossRef]
  56. Padayachee, D.; Lin, J. The effect of fertilizer amendment on diesel biodegradation in contaminated soils. Afr. J. Microbiol. Res. 2011, 5, 1729–1739. [Google Scholar] [CrossRef]
  57. Greenwood, P.F.; Wibrow, S.; George, S.J.; Tibbett, M. Hydrocarbon biodegradation and soil microbial community response to repeated oil exposure. Org. Geochem. 2009, 40, 293–300. [Google Scholar] [CrossRef]
  58. Zhang, Q.R.; Zhou, Q.X.; Ren, L.P.; Zhu, Y.G.; Sun, S.L. Ecological effects of crude oil residues on the functional diversity of soil microorganisms in three weed rhizospheres. J. Environ. Sci. 2006, 18, 1101–1110. [Google Scholar] [CrossRef]
  59. Ramsay, M.A.; Swannell, R.P.J.; Shipton, W.A.; Duke, N.C.; Hill, R.T. Effect of bioremediation on the microbial community in oiled mangrove sediments. Mar. Pollut. Bull. 2000, 41, 413–419. [Google Scholar] [CrossRef]
  60. Harayama, S.; Kasai, Y.; Hara, A. Microbial communities in oil-contaminated seawater. Curr. Opin. Biotechnol. 2004, 15, 205–214. [Google Scholar] [CrossRef]
Figure 1. Schematic diagram of contaminated site.
Applsci 11 06305 g001
Figure 2. The changes of diesel contents and functional genes during different bioremediation processes.
Applsci 11 06305 g002
Figure 3. The changes of enzyme activity during different bioremediation processes.
Applsci 11 06305 g003
Figure 4. Diesel content and structural composition of different treatment methods.
Applsci 11 06305 g004
Figure 5. Picture of the contaminated filed.
Applsci 11 06305 g005
Figure 6. Changes in functional genes and enzyme activities during biodegradation.
Applsci 11 06305 g006
Figure 7. The microbial community of the soil samples.
Applsci 11 06305 g007
Figure 8. Flow chart of biostimulation-bioaugmentation joint remediation process to deal with diesel-contaminated soil.
Applsci 11 06305 g008
Table 1. Mass spectrometric analysis results of soil residual diesel components.
NumberComponentNumberComponentNumberComponent
1C12H247C15H3213C19H40
2C7H5N8C14H30O14C20H42
3C13H289C16H3415C21H44
4C12H24O10C15H32O16C22H46
5C14H3011C17H3617C23H48
6C7H12O212C18H3818C24H50
Publisher’s Note: MDPI stays neutral with regard to jurisdictional claims in published maps and institutional affiliations.

