Article

Exploring the Bioethanol Production Potential of Miscanthus Cultivars

1
School of Applied Science, University of Huddersfield, Queensgate, Huddersfield HD1 3DH, UK
2
Terravesta, Unit 4 Riverside Court, Skellingthorpe Road, Saxilby, Lincoln LN1 5AB, UK
*
Author to whom correspondence should be addressed.
Appl. Sci. 2021, 11(21), 9949; https://doi.org/10.3390/app11219949
Submission received: 31 August 2021 / Revised: 11 October 2021 / Accepted: 18 October 2021 / Published: 25 October 2021
(This article belongs to the Special Issue Advances in Biorefinery and Bioenergy)

Abstract

:
Miscanthus is a fast-growing perennial grass that attracts significant attention for its potential application as a feedstock for bioethanol production. This report explores the difference in the lignocellulosic composition of various Miscanthus cultivars, including Miscanthus × giganteus cultivated at the same location (mainly Lincoln, UK). It also assesses the sugar release profiles and mineral composition profiles of five Miscanthus cultivars harvested over a growing period from November 2018 to February 2019. The results showed that Miscanthus × giganteus contains approximately 45.5% cellulose, 29.2% hemicellulose and 23.8% lignin (dry weight, w/w). Other cultivars of Miscanthus also contain high quantities of carbohydrates (cellulose 41.1–46.0%, hemicellulose 24.3–32.6% and lignin 21.4–24.9%). Pre-treatment of Miscanthus using dilute acid followed by enzymatic hydrolysis released 63.7–80.2% of the theoretical glucose content. Fermentation of a hydrolysate of Miscanthus × giganteus using Saccharomyces cerevisiae NCYC2592 produced 13.58 ± 1.11 g/L of ethanol from 35.13 ± 0.46 g/L of glucose, corresponding to a yield of 0.148 g/g dry weight Miscanthus biomass. Scanning electron microscopy was used to study the morphology of raw and hydrolysed Miscanthus samples, which provided visual proof of Miscanthus lignocellulose degradation in these processes. The sugar release profile showed that a consequence of Miscanthus plant growth is an increase in difficulty in releasing monosaccharides from the biomass. The potassium, magnesium, sodium, sulphur and phosphorus contents in various Miscanthus cultivars were analysed. The results revealed that these elements were slowly lost from the plants during the latter part of the growing season, for a specific cultivar, until February 2019.

1. Introduction

The use of fossil fuels has been crucial to the development of modern civilisation and is an indispensable resource to the global population. However, due to the increasing concerns on energy shortage and environmental pollution, the development of alternative renewable energy has attracted increasing interest worldwide. Bioenergy is energy generated from biological resources and can directly replace fossil fuels in most applications. Miscanthus spp. grass has become a popular bioenergy feedstock in the UK and worldwide due to its high crop yield (8–32 tonne/ha) and high energy output (140–560 GJ/ha) relative to other feedstocks [1]. It has also been cultivated for environmental remediation, such as CO2 fixation [2] and heavy metal remediation [3].
Miscanthus is a genus of perennial grass native to the upland plateaux of Asia, first documented in Japanese poetry over a thousand years ago [4]. Several other genotypes of Miscanthus have also been identified across Asia and cultivated worldwide for use as an ornamental plant. The first Miscanthus genotype to be introduced in Europe was a sterile hybrid from Yokohama in Japan, brought to Denmark in 1935 by Aksel Olsen [5]. Later named Miscanthus × giganteus, the grass was a hybrid of the M. sinensis and M. sacchariflorus genotypes. Miscanthus is now grown commonly on most continents. It was not until the 1970s that Miscanthus was considered a potential biomass feedstock, particularly Miscanthus × giganteus, due to its physiological characteristics.
In order to assess the potential of the Miscanthus species for biofuel production, especially fermentative bioethanol production, various studies have been carried out to characterise the plant cell wall composition of Miscanthus [6,7], hydrolyse Miscanthus biomass into a fermentable sugar solution [8,9] and then ferment the feedstock into bioethanol [10,11]. An analysis of the lignocellulosic composition of 15 Miscanthus genotypes was carried out in 2010, which concluded that the average cellulose, hemicellulose and lignin contents were in the range of 41.2–52.9%, 23.5–33.8% and 7.6–11.5%, respectively [7]. Further study in the group found that a higher holocellulose (cellulose and hemicellulose) to lignin ratio was positively correlated to a potentially higher release of fermentable sugar from Miscanthus biomass and, therefore, a higher potential bioethanol yield [9]. Theoretical analysis indicated that a maximum bioethanol yield of ~0.23 g/g dry weight biomass could be obtained by converting the cellulose component to bioethanol via yeast fermentation [10]. In practical terms, a bioethanol yield of up to 0.19 g/g dry weight Miscanthus was achieved using a mild alkali pre-treatment (4% NaOH at 50 °C) followed by enzymatic hydrolysis and yeast fermentation [11].
Although various Miscanthus species have been analysed for their carbohydrate content, the studies have been heavily focused on Miscanthus × giganteus and on the factors such as the location of the crop and cultivation conditions [8,11]. The composition difference of different cultivars of Miscanthus sp. cultivated at the same location has not yet been reported. Furthermore, most of the reports only selected an early harvest sample and a late harvest sample to compare the sugar composition [12,13,14]. As a consequence, the sugar and mineral composition profile of the plant during the harvest is not clear.
In Terravesta Ltd., Lincoln, UK, a variety of Miscanthus hybrids and cultivars were cultivated. In this paper, the lignocellulosic compositions of 7 Miscanthus cultivars harvested by Terravesta over the winter season are initially analysed. Then, the hydrolysis of Miscanthus into a fermentable feedstock is carried out. Bioethanol production using the hydrolysates derived from a Miscanthus sample is performed. To gain a better understanding of the degradation process of the lignocellulosic structure in Miscanthus, its cell morphology is analysed at various states of degradation using SEM. This paper also reports the sugar and mineral composition profiles of 5 Miscanthus cultivars during the November 2018 to February 2019 season, providing the information for the selection of the best harvest point of the biomass.

2. Materials and Methods

2.1. Miscanthus Samples

Seven cultivars of Miscanthus samples were provided by Terravesta Ltd., Lincoln, UK, as shown in Table 1. The whole aerial part of Miscanthus plant was used; prior to analysis, it was dried and milled into a fine powder using a ball mill and shipped to the University of Huddersfield. Samples were oven-dried before analysis in order to obtain accurate dry weights for quantification.

2.2. Lignin Composition Analysis

2.2.1. Lignin Composition Analysis by the Klason Method

1 g oven-dried milled Miscanthus was placed in a 100 mL beaker, and 20 mL sulphuric acid (72% v/v) was added. The sample was triturated with a glass rod to ensure that the milled fibres were mixed thoroughly with the sulphuric acid solution. The sample was left at room temperature to digest for 2 h and then flushed into a 500 mL round-bottomed flask with 345 mL deionised water. The flask was placed on a thermo-mantle (Fisher Scientific), and the sample was refluxed for four hours. The sample was then vacuum-filtered through pre-weighed glass fibre filter paper. Deionised water was used to wash the product from the flask. The sample was dried overnight in an oven (50 °C) and weighed to determine the quantity of lignin.

2.2.2. Lignin Analysis by the Acetyl Bromide Soluble Lignin Method (ABSL)

Lignin standard solutions were prepared by weighing out a lignin standard (Sigma-Aldrich, UK) (10 mg) and dissolving them in dioxane (5 mL, 80% v/v) in a volumetric flask. Then, 0.2, 0.3, 0.4, 0.5 and 0.6 mL lignin solutions were pipetted into a 50 mL Teflon-capped tube, respectively. A control tube was prepared with dioxane (0.2 mL, 80% v/v) only. Acetyl bromide in glacial acetic acid (0.5 mL, 25% v/v) was added to each tube and mixed thoroughly. The reaction tubes were incubated in a water bath at 50 °C for 30 min and then cooled to room temperature. Once cooled, glacial acetic acid (2.5 mL), sodium hydroxide (1.5 mL, 0.3 M) and hydroxylamine HCl (0.5 mL, 0.5 M) were added. The solutions were made up to 10 mL final standard solutions with glacial acetic acid.
Then, 100 mg samples of milled Miscanthus were placed in 50 mL Teflon-capped tubes. A solution of acetyl bromide in glacial acetic acid (4 mL, 25% v/v) was added to the tubes, which were then placed in a 50 °C water bath. The tubes were incubated for 2 h with occasional mixing. The tubes were then cooled to room temperature, and glacial acetic acid (12 mL) was added. The samples were decanted into Eppendorf tubes and centrifuged for 5 min at 4750 g at room temperature.
After that, 0.5 mL of the sample solution was added to a reaction tube. Glacial acetic acid (0.5 mL), sodium hydroxide (1.5 mL, 0.3 M) and hydroxylamine HCl (0.5 mL, 0.5 M) were added and thoroughly mixed. The solution was then made up to 10 mL with glacial acetic acid.
The optical density of standards and the control sample and test samples were measured at 280 nm using a Shimadzu UV mini-1240 UV spectrometer and a Hellma high precision 10 mm cuvette.

2.3. α-Cellulose and Hemicellulose Analysis

First, 1 g of Miscanthus sample was placed in a 50 mL Ehrlenmeyer flask. Deionised water (80 mL), glacial acetic acid (0.5 mL) and sodium chloride solution (10 mL, 15% w/v) were added. A small conical flask was inverted in the neck of the Erhlenmeyer flasks to contain the liberated chlorine gas. The flasks were then placed in a water bath set at 75 °C. The temperature was maintained for one hour, and the flasks were swirled gently periodically. After one hour, glacial acetic acid (0.5 mL) and sodium chlorite (10 mL) were added; this step was repeated twice subsequently. The samples were then cooled to below 10 °C by placing the flask in an ice bath. Once cooled, the suspension was filtrated through a pre-weighed sintered crucible and washed with ethanol (50 mL), ice water (50 mL) and, finally, acetone (50 mL) before being placed in an oven at 50 °C to dry overnight. The sinter crucibles were reweighed to determine the quantity of holocellulose in each sample.
The holocellulose samples from the previous reaction (approximately 0.7 g) were placed in a 250 mL Ehrlenmeyer flask. Sodium hydroxide solution (20 mL, 17.5% w/v) was added to the flask, which was then sealed with parafilm. The sample was incubated for 2 h at room temperature with occasional agitation. The solids were vacuum-filtered through a pre-weighed sintered crucible and washed consecutively with deionised water (50 mL), methanol (50 mL) and acetone (50 mL). The sinter crucibles were dried overnight at 100 °C and reweighed to determine the quantity of α-cellulose.
The hemicellulose content was calculated by subtracting the α-cellulose weight from the holocellulose weight.

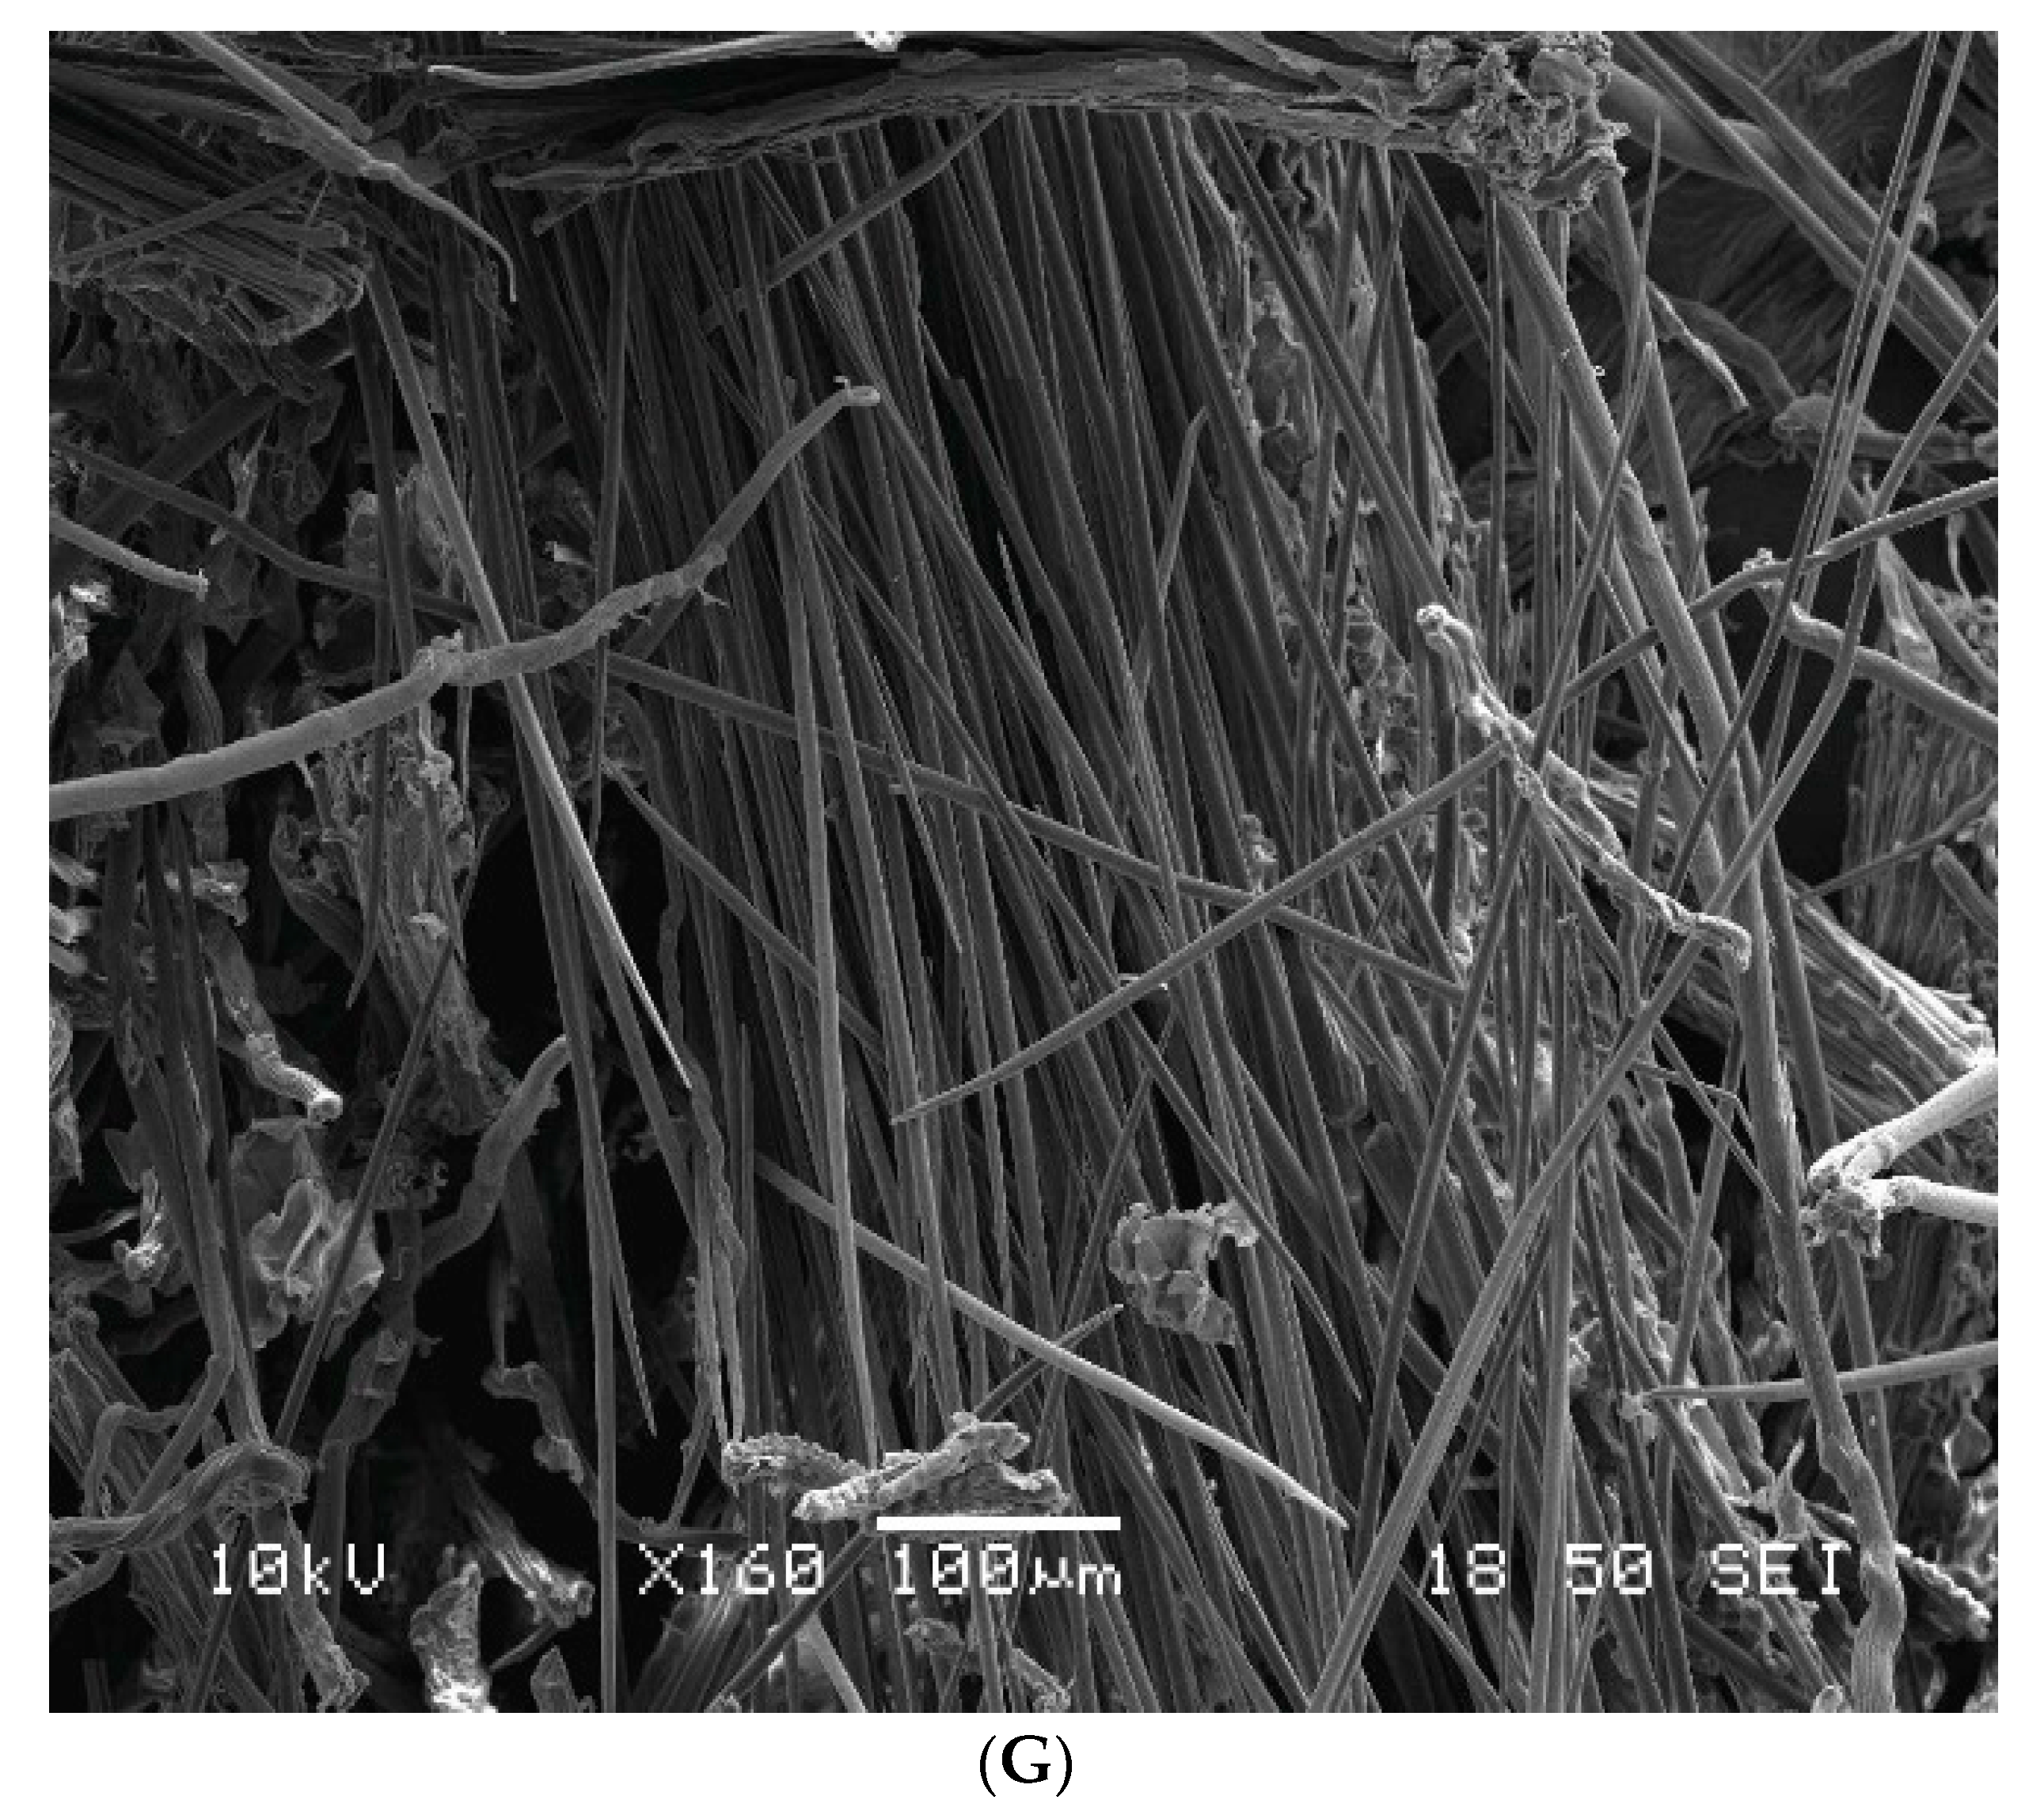
2.4. Miscanthus Morphology Analysis Using Scanning Electron Microscopy

Samples of raw milled Miscanthus, dilute acid pre-treated Miscanthus, lignin, holocellulose and α-cellulose (obtained from reactions described above) were analysed. A small amount of material was fixed on a specimen stub using double-sided carbon tape. The sample was then coated with gold (as a conducting material) using a Quorom sc7620 sputter coating machine (Quorom, Laughton, UK). Images were captured using a JEOL JSM-6060LV scanning electron microscope (JEOL UK Ltd, Hertfordshire, UK) with a back-scatter detector at high vacuum mode, working distance 19 mm, spot size 50 and an FEI Quanta FEG 250 scanning electron microscope (FEI, Hillsboro, USA) with back-scatter and Everhart-Thornley detectors at high vacuum mode, working distance 11–13 mm and spot size 3.5.

2.5. Miscanthus Pre-Treatment and Enzymatic Saccharification

Miscathus samples were suspended in 1% sulphuric acid (w/v) at a 1:10 solid loading ratio (w/v) and autoclaved at 121 °C for 30 min. After autoclaving, the biomass was filtered using Whatman No. 1 filter paper and the hydrolysates were stored at 4 °C until further use. The solid fraction was further dried at 30 °C overnight and examined by SEM.
Enzyme digestions of pre-treatment residues were conducted at 50 °C for 24 h with agitation at 150 rpm. For the saccharification potential of pre-treated biomass, the assessment was conducted using a low solid loading ratio of 2.5% (w/v) with lyophilised Celluclast® cellulase from Trichoderma reesei (ATTC 26921, Sigma-Aldrich, UK) using a high enzyme-loading ratio of 50 FPU/g biomass to determine the maximum sugar that can be hydrolysed. Pre-treated residue (1 g) was mixed with 40 mL of diluted Celluclast® solution in 50 mM sodium citrate buffer (pH 4.8) and incubated at 50 °C for 24 h. Samples were centrifuged at 3500× g for 10 min, and the sugar contents were analysed by HPLC. For the generation of a fermentation medium, saccharification was carried out using a solid loading ratio of 12.5% (w/v) and an enzyme loading ratio of 50 FPU/g biomass to achieve a higher initial sugar concentration. For the comparison of the sugar release profile of Miscanthus cultivars harvested at various points during the growing season, saccharification was carried out using a solid loading ratio of 10% (w/v) and an enzyme loading ratio of 30 FPU/g biomass.

2.6. Yeast Fermentation

Fermentations were conducted in 100 mL (working volume) mini-fermentation vessels (MFV), as described previously [17]. Briefly, cryopreserved Saccharomyces cerevisiae NCYC2592 cultures were streaked onto YPD plates and incubated at 30 °C for 48 h. A single colony was inoculated into 5 mL YPD broth and incubated at 30 °C, 200 rpm for 24 h. Cells were harvested and washed three times with sterile RO water, and 1.5 × 10⁷ cells/mL were inoculated in 100 mL of Miscanthus hydrolysate with the addition of a 5 g/L yeast nitrogen base. Fermentations were conducted at 30 °C at 200 rpm. After fermentation, samples were taken, centrifuged at 17,000× g to remove cellular biomass and filtered using a 0.45 μm filter (Millex-HV, Millipore, Burlington, MA, USA) for sugar and ethanol analysis. All experiments were performed in triplicate.

2.7. Sugar and Ethanol Analysis

The sugar concentration was analysed using a Dionex ICS3000 HPLC, as described in Greetham et al., 2020 [18]. A Dionex CarboPac PA20 3 × 150 mm analytical column was used. Ethanol concentration in the fermentation broth was detected using a Bruker CP 3900 gas chromatograph (Agilent, Santa Clara, CA, USA), as described in Greetham et al. (2020).

2.8. Element Content Analysis Using ICP-MS

Briefly, 0.1 g of Miscanthus sample was transferred to a Mars Xpress digestion vessel, where 10 mL of nitric acid was added. The sample was swirled and left for 15 min and then transferred to a Mars 6 CEM digestion machine, whereby it was digested for 15 min at 1050 W, 800 psi and 200 °C. The mineral and elemental composition of several elements (K, Mg, Na, P and S) were analysed.

3. Results and Discussion

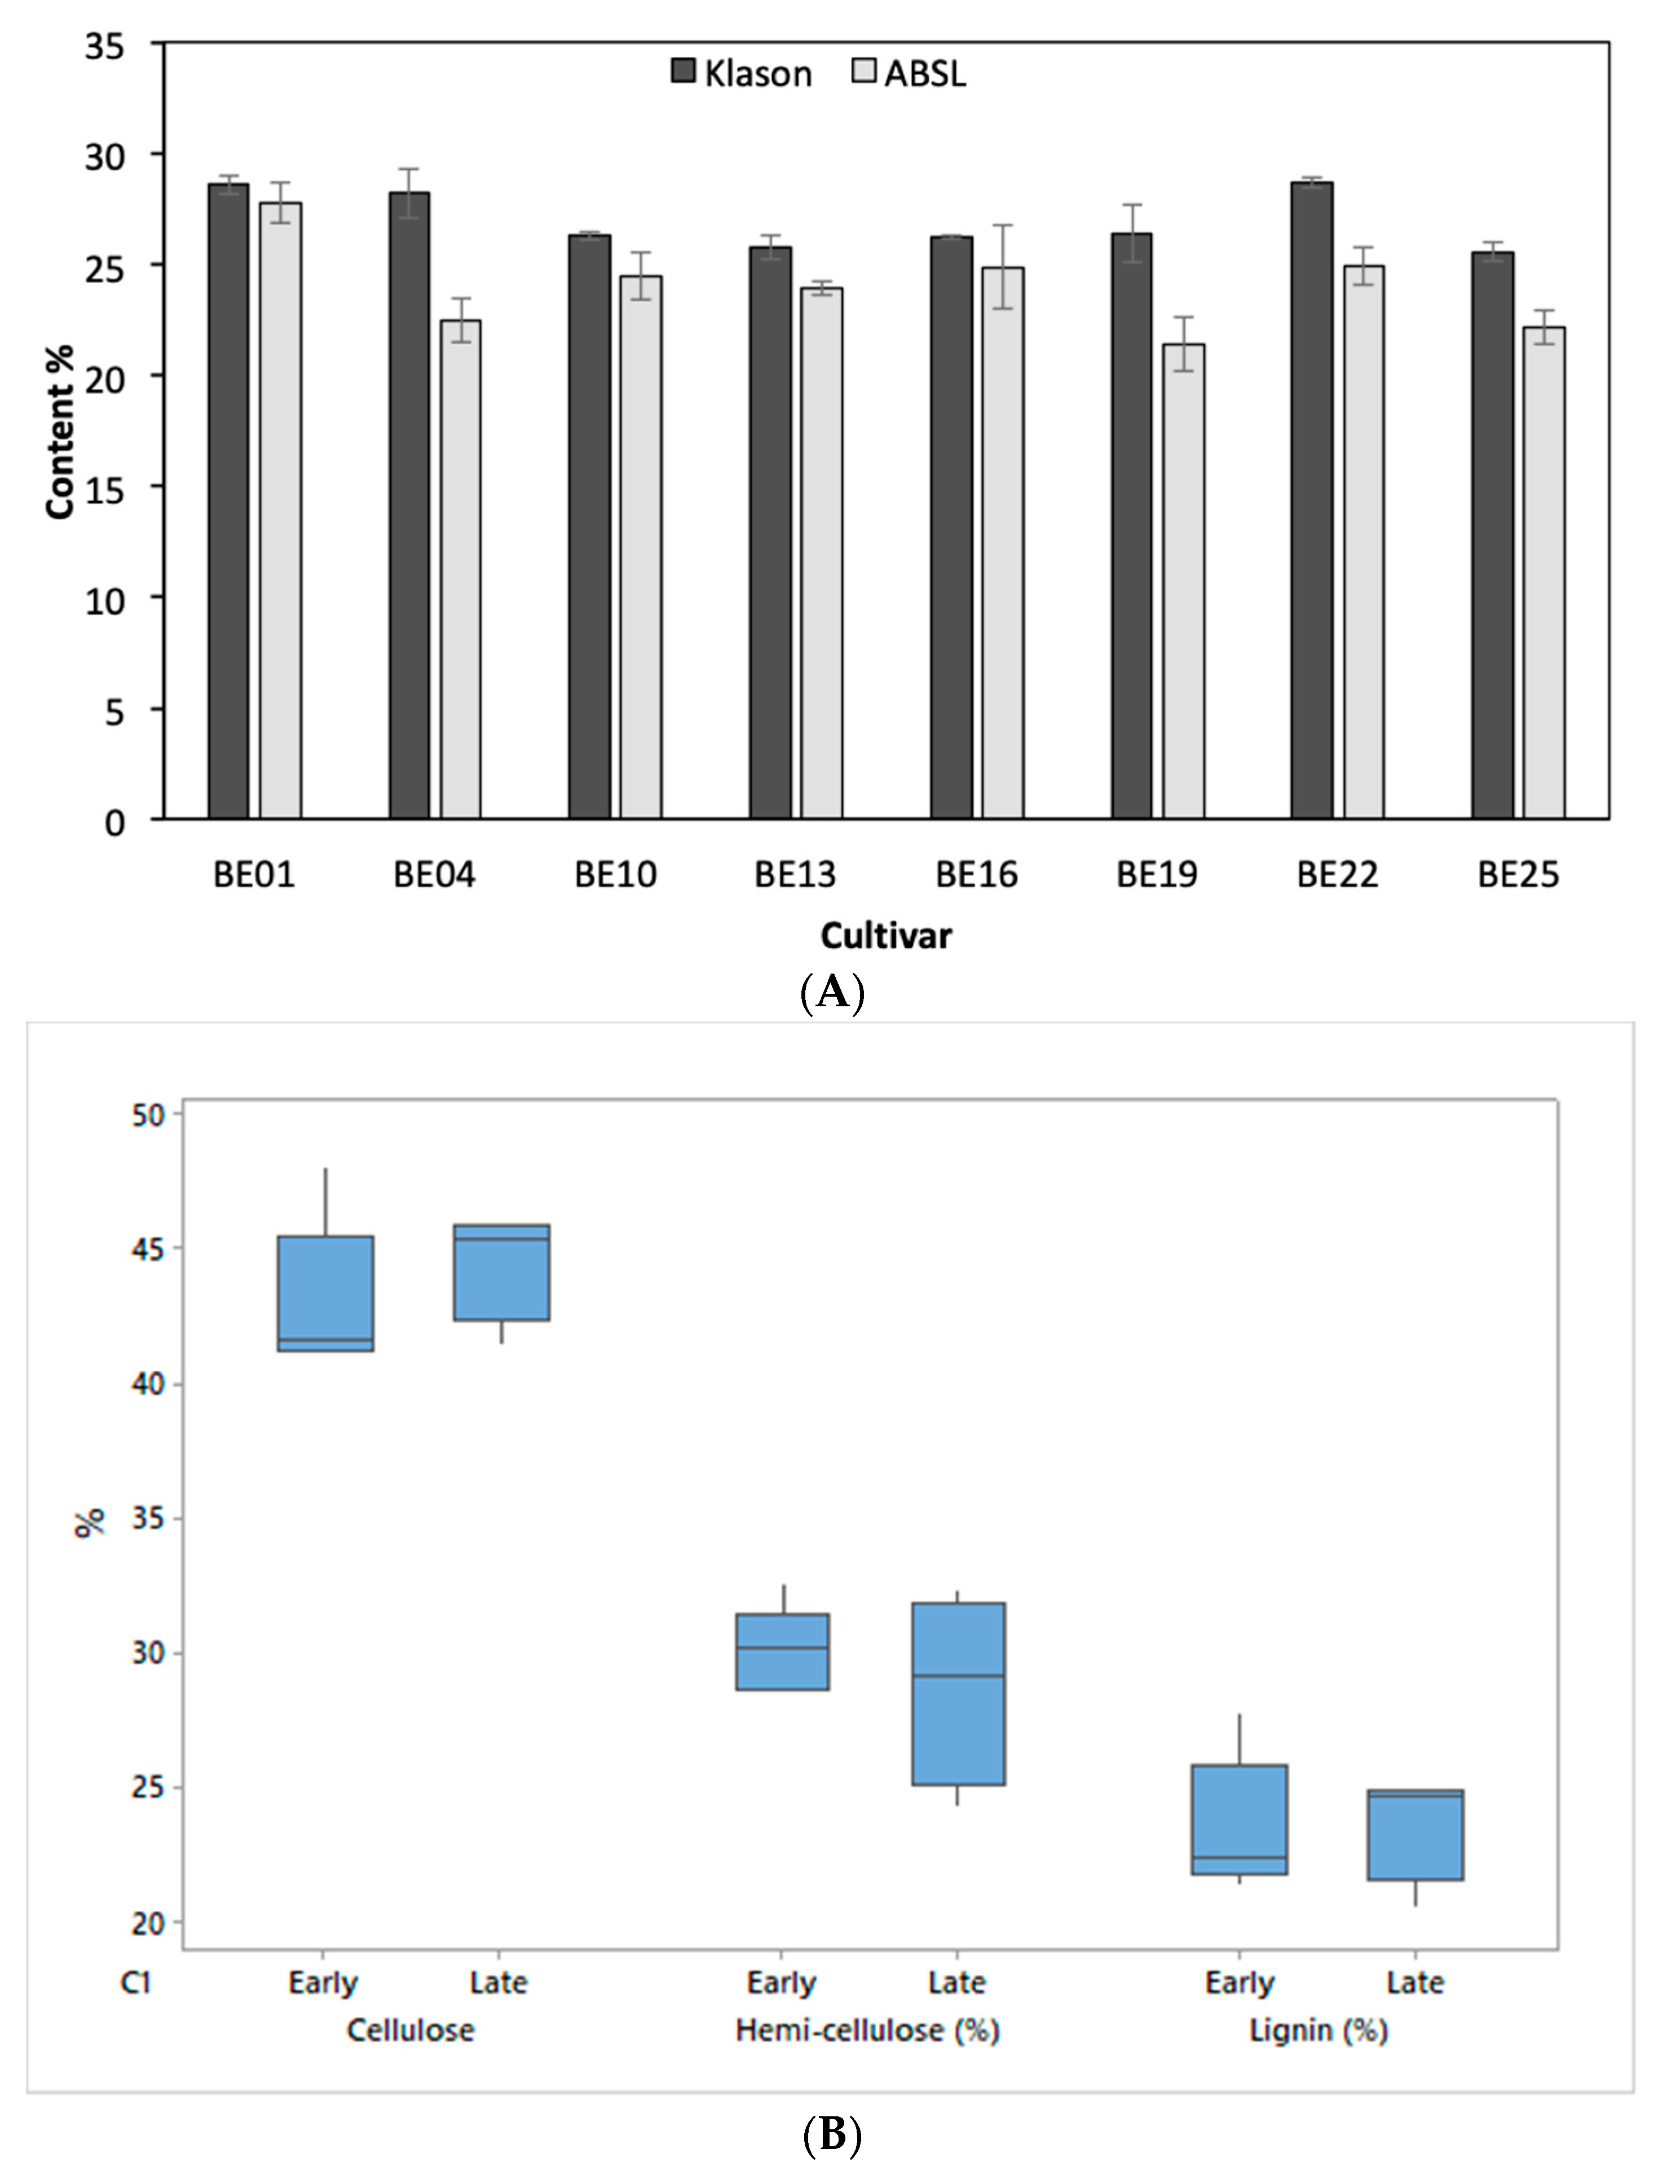
3.1. Comparison of Lignin Content Using the Klason Method or ABSL Method

The lignin content of 7 Miscanthus cultivars was analysed using both the Klason method and the ABSL method. In general, lignin determination using the Klason method was higher (25.76–28.66%) than that observed using the ABSL method (21.42–27.78%, Figure 1A). This could be due to the interference of recalcitrant cellulose on the lignin analysis using the Klason method. The highly crystalline nature of the cellulose present in the lignocellulosic matter of Miscanthus might not have completely degraded during the acid treatment and, therefore, would be measured as lignin content in the Klason method as weight loss is the method of quantification. The difference in lignin composition between the two methods was also previously observed in a study of the cell wall polymer for Miscanthus spp. leaves and shoots [19]. The lignin values reported here are significantly higher than that observed by Hodgson et al. (2011; 9.2–12.6%) [20] and Kam et al. (2020; 15–20%) [14] but are similar to results reported by Kim et al. (2012; 21.4–27.7%) [21] for the Miscanthus × giganteus and Miscanthus sinensis genotypes and also by Lee and Kuan (2015; 22.3–26.3%) [10]. As shown in Table 2, the lignin content determined using the ABSL method correlated better with the cellulose and hemicellulose analytical results, showing a total carbohydrate content in the range of 94–100%. In comparison, when the lignin content results from the Klason method was used, five out of nine samples showed a total carbohydrate content of over 100%.
Determining lignin content using the Klason method has the advantage of producing isolated lignin, which proved suitable for further morphology analysis via scanning electron microscopy. The method also facilitates the analysis of cellulose and hemicellulose contents as the biomass is hydrolysed during the lignin analysis process. In comparison with the ABSL method, the Klason method is not suitable for the analysis of a large number of samples. Using the Klason method, the number of samples that can be analysed simultaneously is limited by the capacity of the lab (e.g., availability of heating mantles and lab space). It is a lengthy process as the samples need to be measured as a dry weight; therefore, samples should be dried overnight and weighed a day later. Although the ABSL method uses several reagents, it has a much simpler apparatus set-up than that of the Klason method. The most distinct advantages are the much shorter reaction time and the larger number of samples that can be analysed simultaneously. The ABSL method can be performed in approximately 3 h. This method is also advantageous if only a small quantity of biomass is available as only around 100 mg is used in each analysis compared to the minimum of 1 g required for the Klason method for a reliable result.

3.2. Carbohydrate Composition of Miscanthus Cultivars

The carbohydrate compositions of the lignocellulose for each Miscanthus cultivar are shown in Table 2. When using lignin content data generated by the ABSL method, the total lignocellulose accounted for approximately 95% of the biomass; the unaccounted 5% would consist of ash and extractives.
The α-cellulose content of all these Miscanthus cultivars is in the range of 41.15–48.09% (w/w). This is higher than those reported by Kim et al. (2012; 24.5–44%) [21] but in agreement with Hodgson et al. (2011; 43.1–52.2%) [20]. Regarding the impact of harvest time, the majority of samples appear to fit the trends noted by Hodgson et al. (2011) [20]; late-harvested Miscanthus cultivars (February) have higher cellulose and lignin contents (Table 2). However, the difference was not statistically significant (cellulose p = 0.4 and lignin p = 0.72). The analysis also revealed that Miscanthus cultivar B (BE04) had the highest α-cellulose content (48.09 ± 0.26%), and, unlike the other cultivars, the early harvest sample (BE04) had a higher cellulose content compared to the late-harvested sample (BE10). The hemicellulose content of the Miscanthus biomass was in the range of 24.27–32.62% (w/w), which was concordant with the results of previous reports [10,20,21].
Comparing the carbohydrate content of the various cultivars, Miscanthus cultivar D contained a relatively low cellulose content but with relatively high hemicellulose in both early and late harvest. Figure 1B compares the impact of early harvest and late harvest on the carbohydrate composition of the samples analysed; no statistical difference was observed. This result agreed with an early report on Miscanthus × giganteus cultivated in France [12]. However, an accumulation of lignin along with Miscanthus growth in the harvest season was also reported [14]. A more detailed study carried out by Bergs et al. (2019) indicated that the lignin structure was influenced by the harvest date, with an increasing p-hydroxyphenyl component and a decreasing guaiacyl component [22].

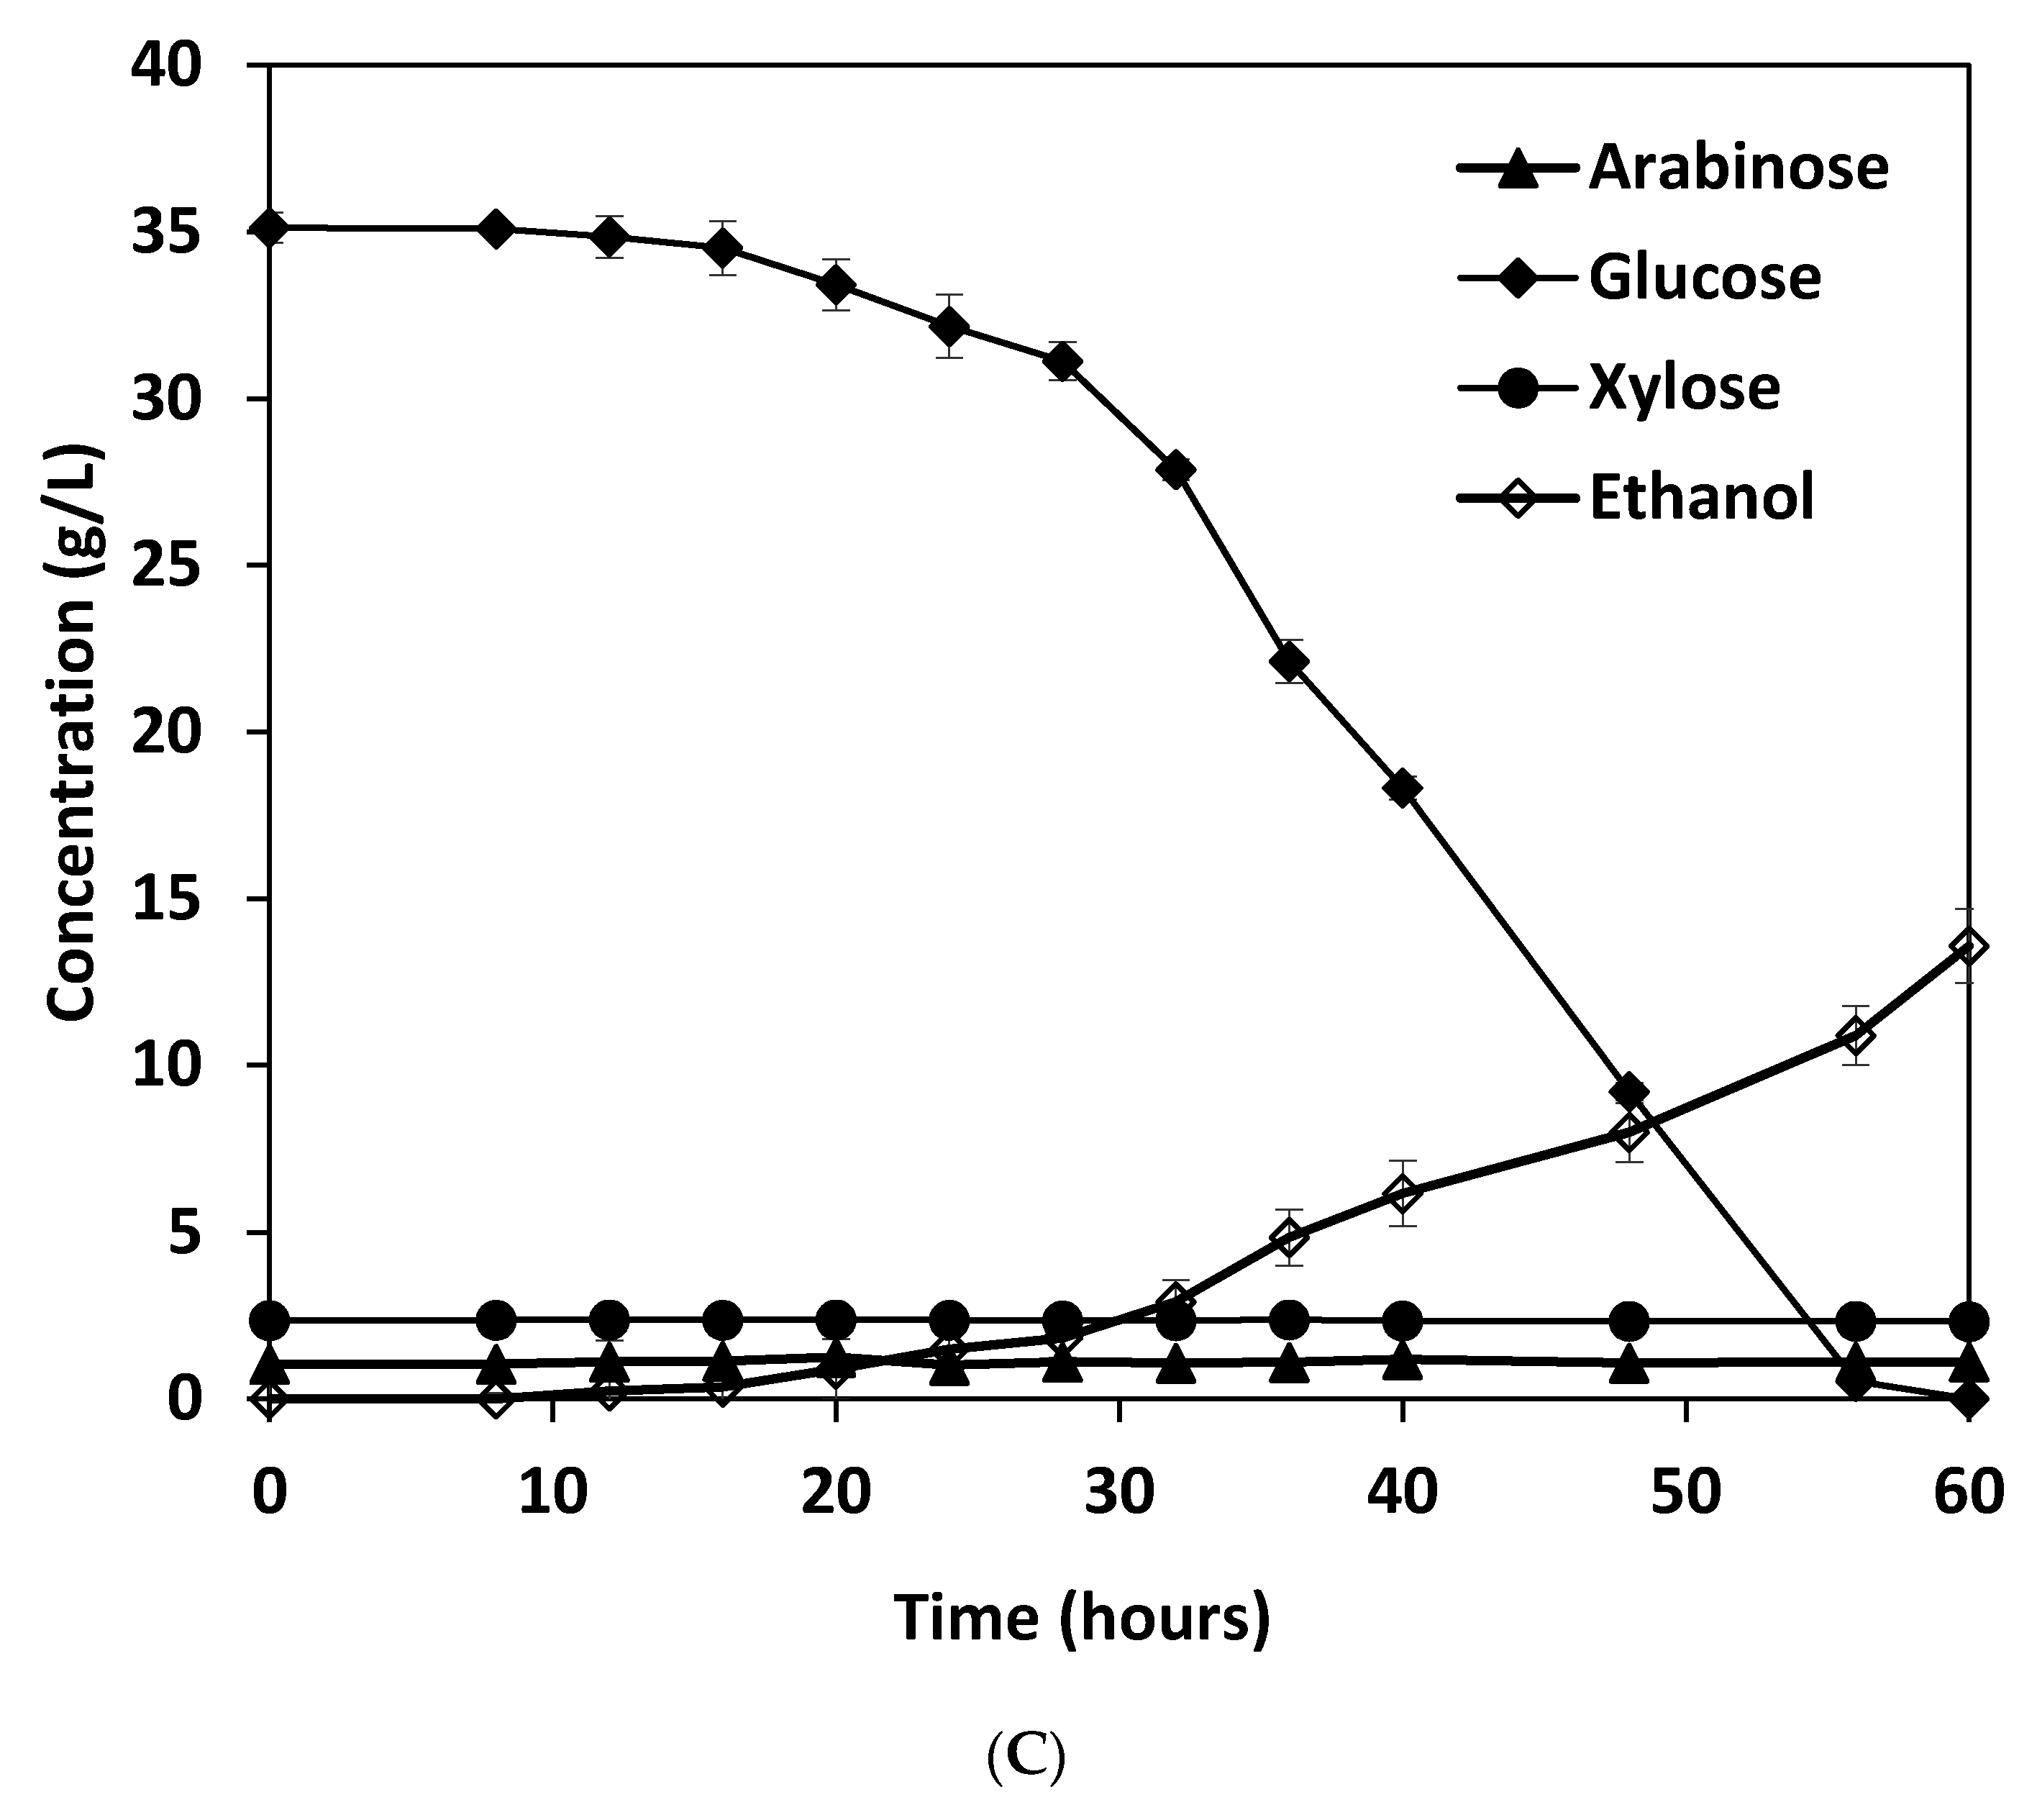
3.3. Miscanthus Cultivar Hydrolysis and Fermentation

The determination of cellulose content revealed that all Miscanthus samples contained promising amounts of cellulose for bioethanol production. Dilute acid pre-treatment of various Miscanthus cultivars revealed that xylose (3.9–24 g/L) was the predominant sugar, with low glucose present (<3.4 g/L) (Figure 2A). After enzymatic saccharification, glucose was obtained as the main sugar as the cellulose component in the pre-treated biomass was degraded. The hydrolysate derived from Miscanthus cultivar B (BE04) showed the highest glucose content with a good cellulose hydrolysis yield of 75.8%. Overall, saccharification released 63.7–80.2% theoretical glucose (Figure 2B) from various Miscanthus cultivars.
A hydrolysate prepared using Miscanthus cultivar B (sample BE04) was selected for bioethanol fermentation assessment using S. cerevisiae NCYC2592. Data showed that a relatively long lag phase (~24 h) occurred when compared with this yeast fermenting an analogous glucose load and yeast media (<6 h) [17]. However, when the cell started to grow, the available glucose was consumed rapidly (Figure 2C). By the end of the fermentation, 13.58 ± 1.11 g/L of ethanol was produced from 35.12 ± 0.46 g/L of glucose. Overall, a bioethanol fermentation yield of 0.387 g/g sugar was observed. The fermentation yield (75.6% of theoretical yield) is higher than that reported by Brosse et al. (2009; 70%) [23], but lower than that reported by Han et al. (2011; 83.9%) [24]. For efficient bioethanol production, a higher ethanol yield, e.g., over 90% and a higher ethanol titre, e.g., over 80 g/L, should be achieved.

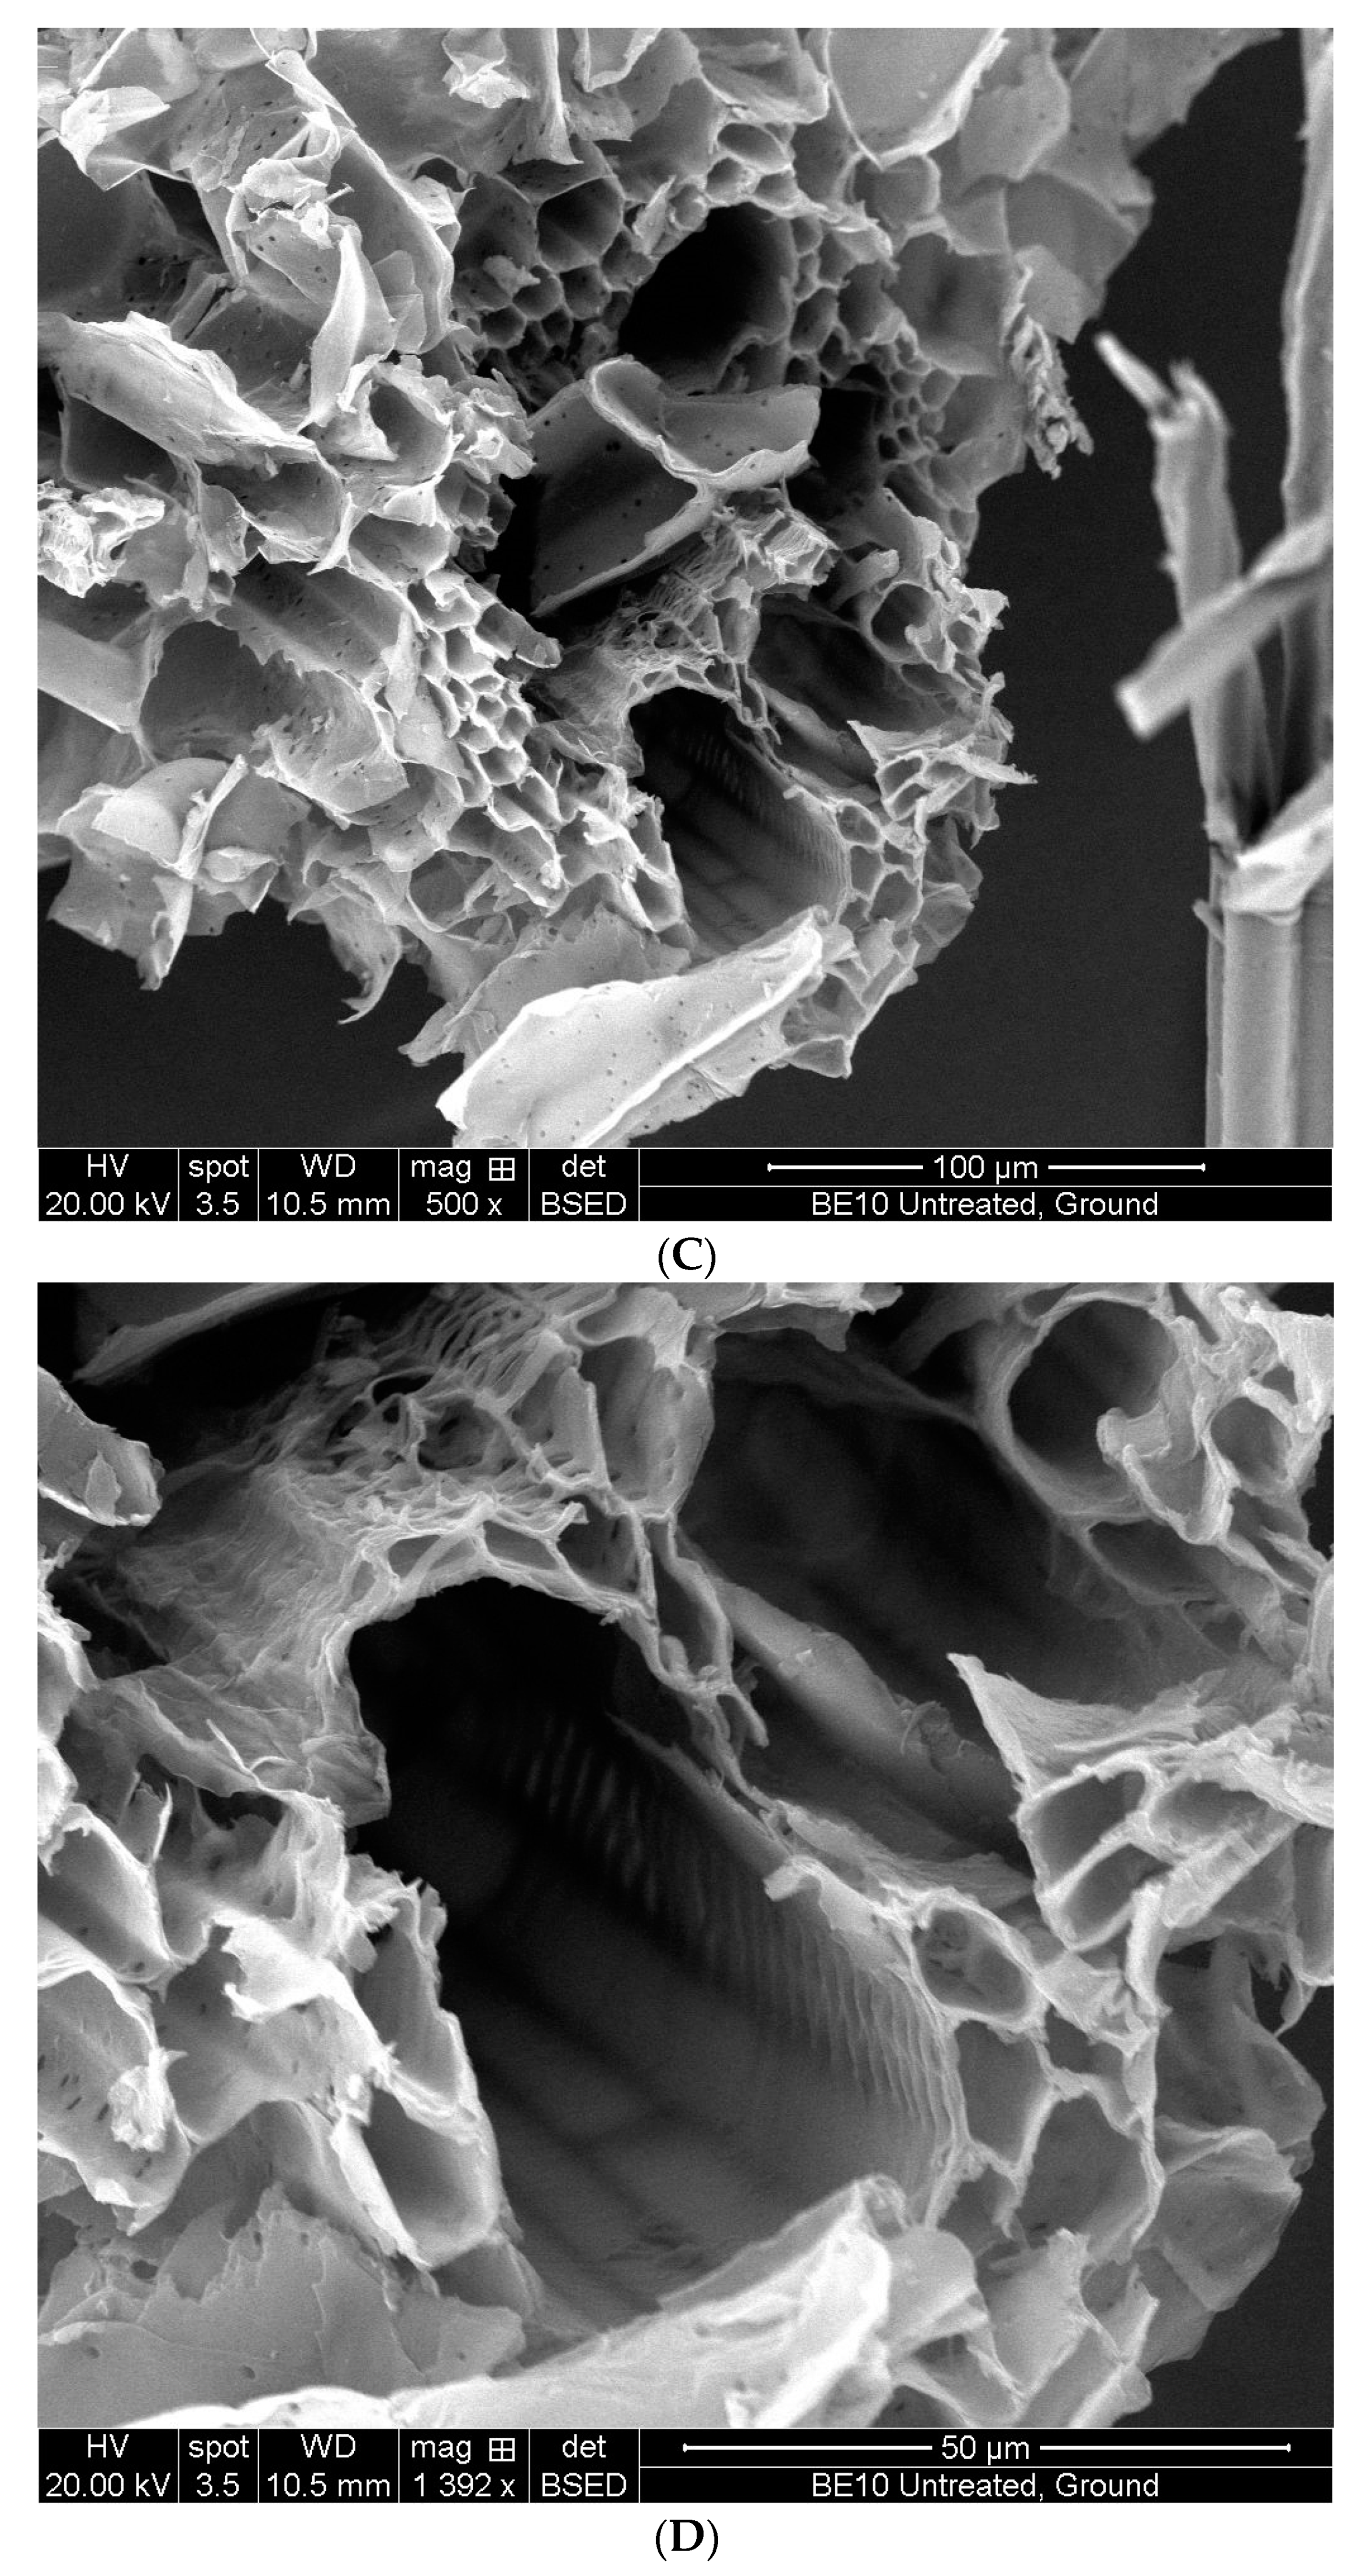
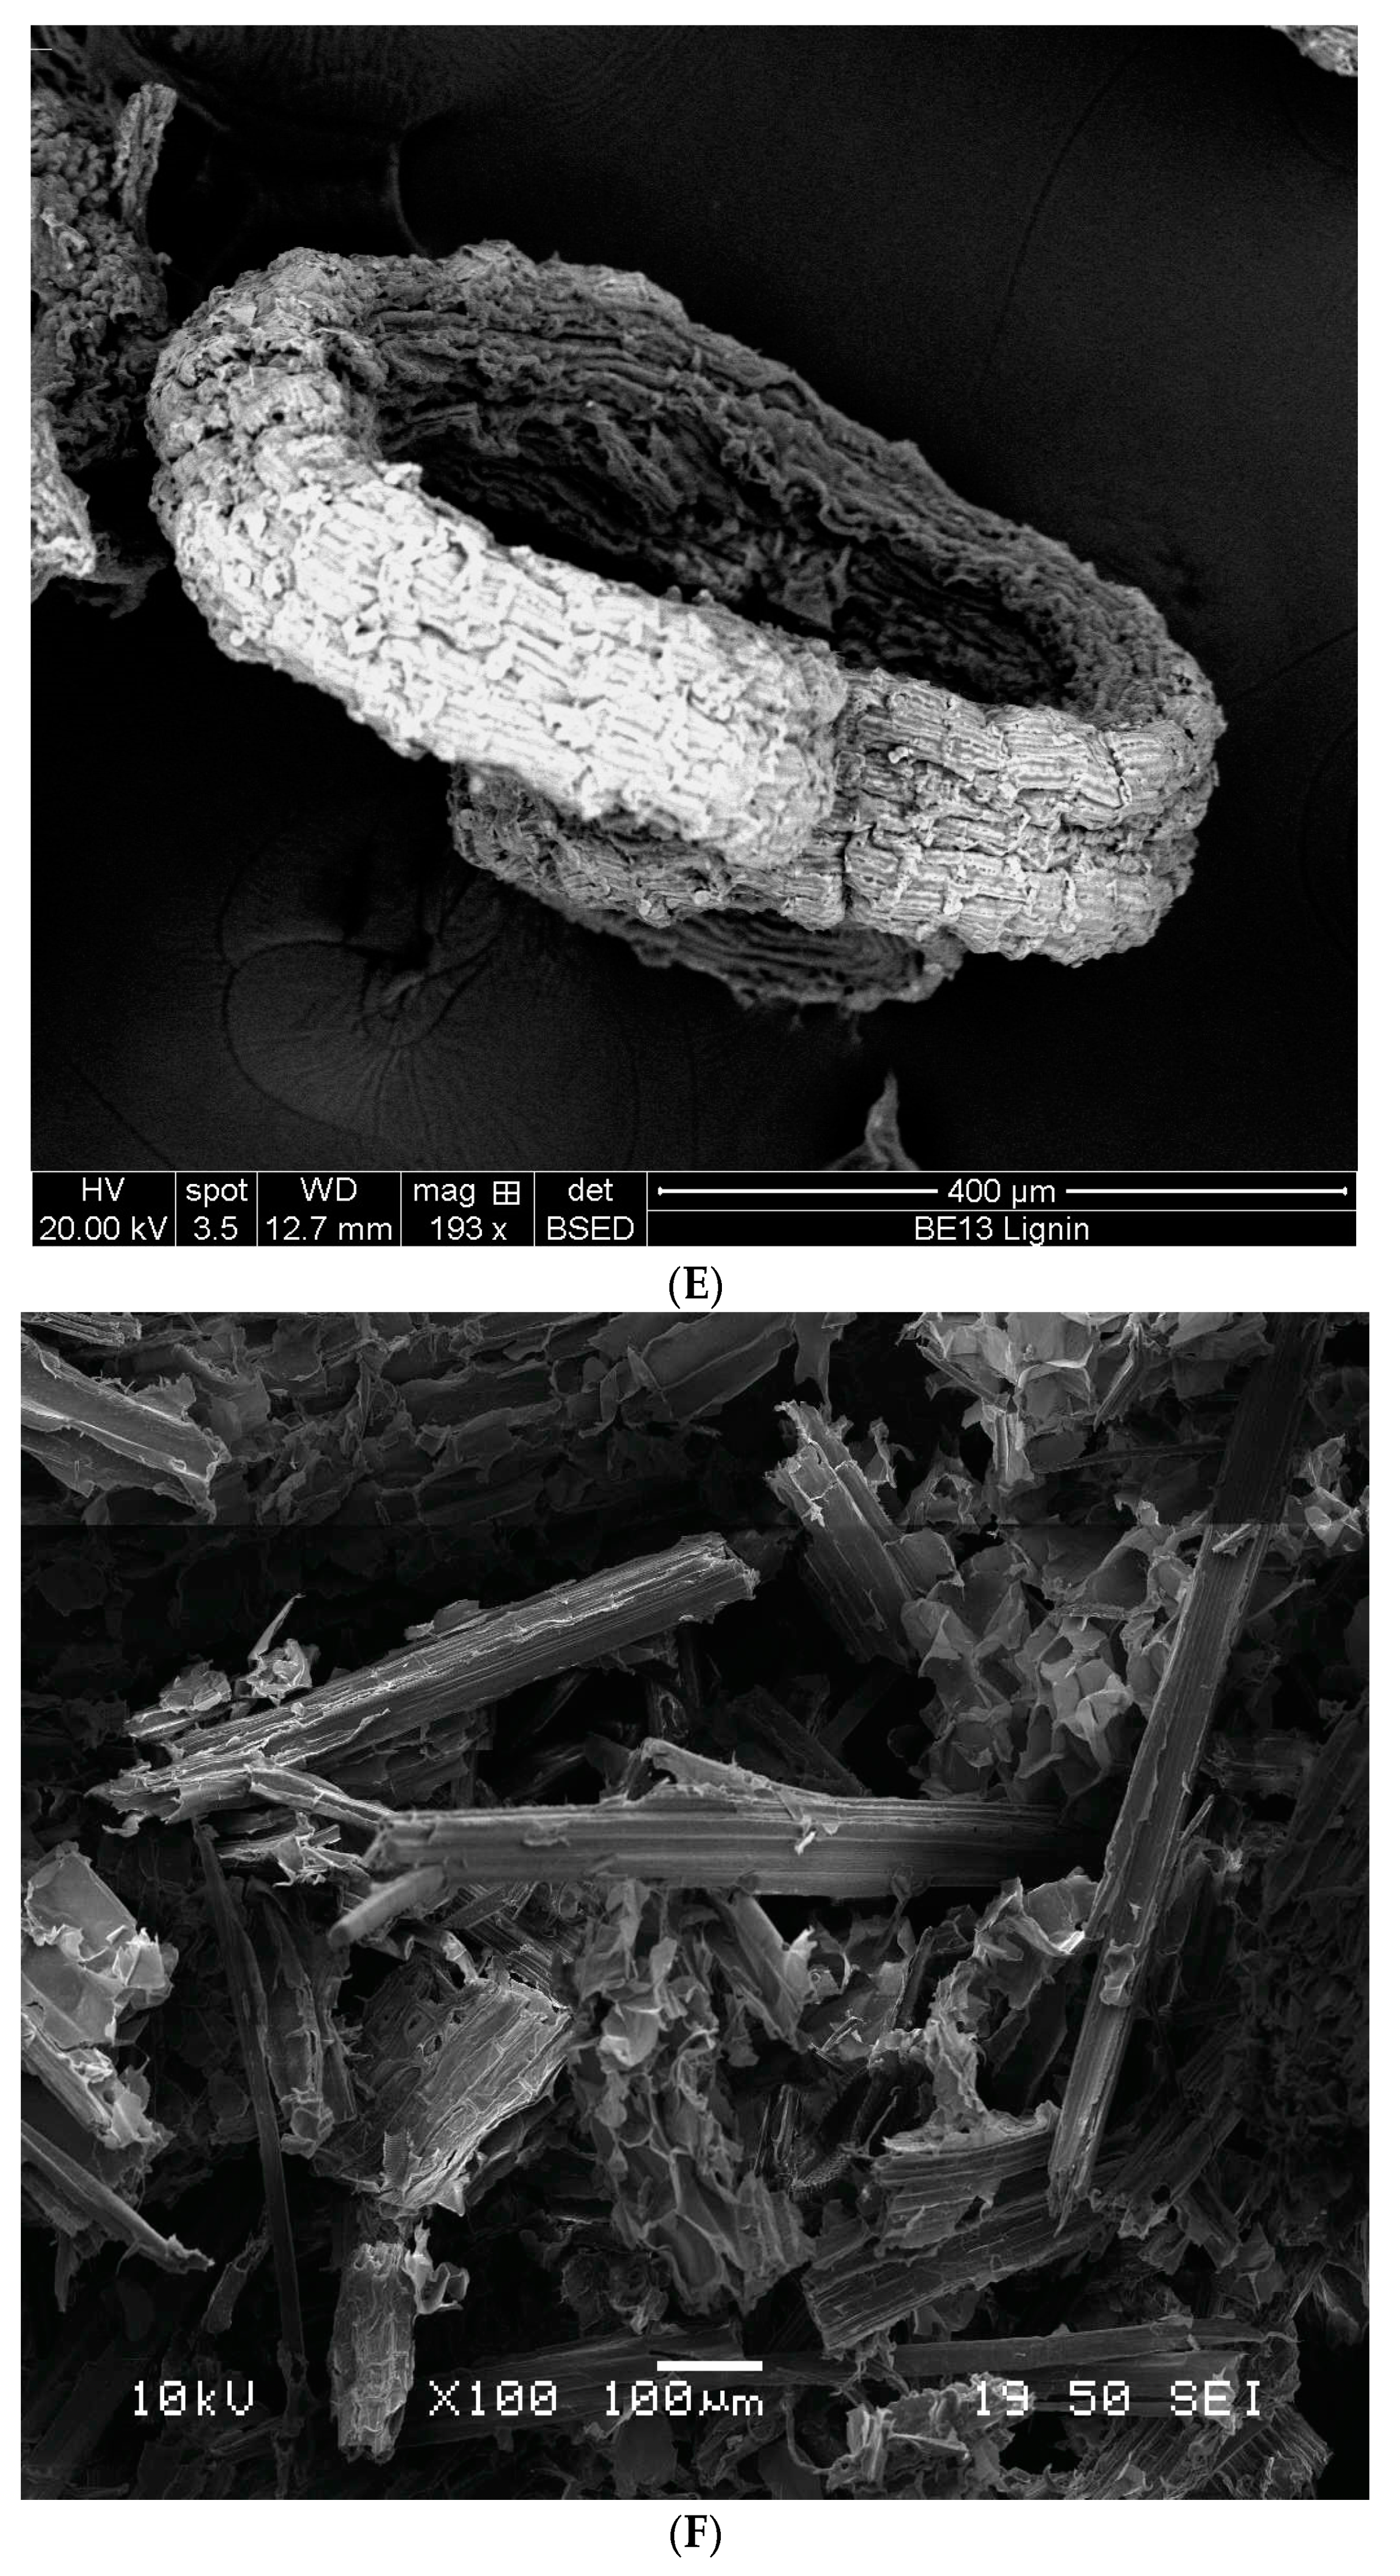
3.4. Analysis of Miscanthus Structure Using Scanning Electron Microscopy

Scanning electron microscopy was used to observe the cell wall structure before and after the diluted acid pre-treatment and also after the isolation of holocellulose, α-cellulose and Klason lignin, respectively. There were no distinguishing features observed between cultivars of Miscanthus.
There were, however, pronounced differences observed following different methods. The raw samples (untreated) Miscanthus had been milled, causing some mechanical damage to the material. Each milled sample consisted of fragments approximately 1–2 mm long (Figure 3A,B). The tissues of untreated samples were largely intact; the epidermal layers were visible and covered in phytoliths (microscopic deposits of silica found in plants) (Figure 3A,B). Following acid pre-treatment, considerably more degradation was observed. While some pieces of Miscanthus stem looked unchanged, most of the material had disintegrated into smaller pieces. There were fewer surface layers visible, and the internal structures were much more easily observed (Figure 3C,D).
After acid degradation using the Klason method, the α-cellulose and hemicellulose were removed and the lignin–carbohydrate complex disintegrated. The lignin content exhibited a highly deformed structure. Cellulose provides the structural rigidity and overall morphology of the plant; lignin merely reinforces it. With the cellulose removed, the lignin structure appeared to have curled, and the apparent cellular structure could not be distinguished (Figure 3E).
The structure of the holocellulose appears similar to the acid pre-treated biomass when observed using SEM; the structure was highly disintegrated, and the internal cellular structure of the plant was easily distinguished. There is, however, one distinct difference. Holocellulose determination involves the chlorination and extraction of lignin. There were no visible lignin structures in any of the samples; the vascular bundles were not apparent, and there was no annular strengthening visible in the holocellulose samples (Figure 3F).
To obtain α-cellulose from holocellulose, the hemicelluloses are removed with an alkaline solution, and all that remains is insoluble cellulose. Hemicellulose is found throughout the secondary cell wall; therefore, when lignin and hemicellulose were removed, there was nothing left to hold the cellulose together and the fibres separated (Figure 3G).

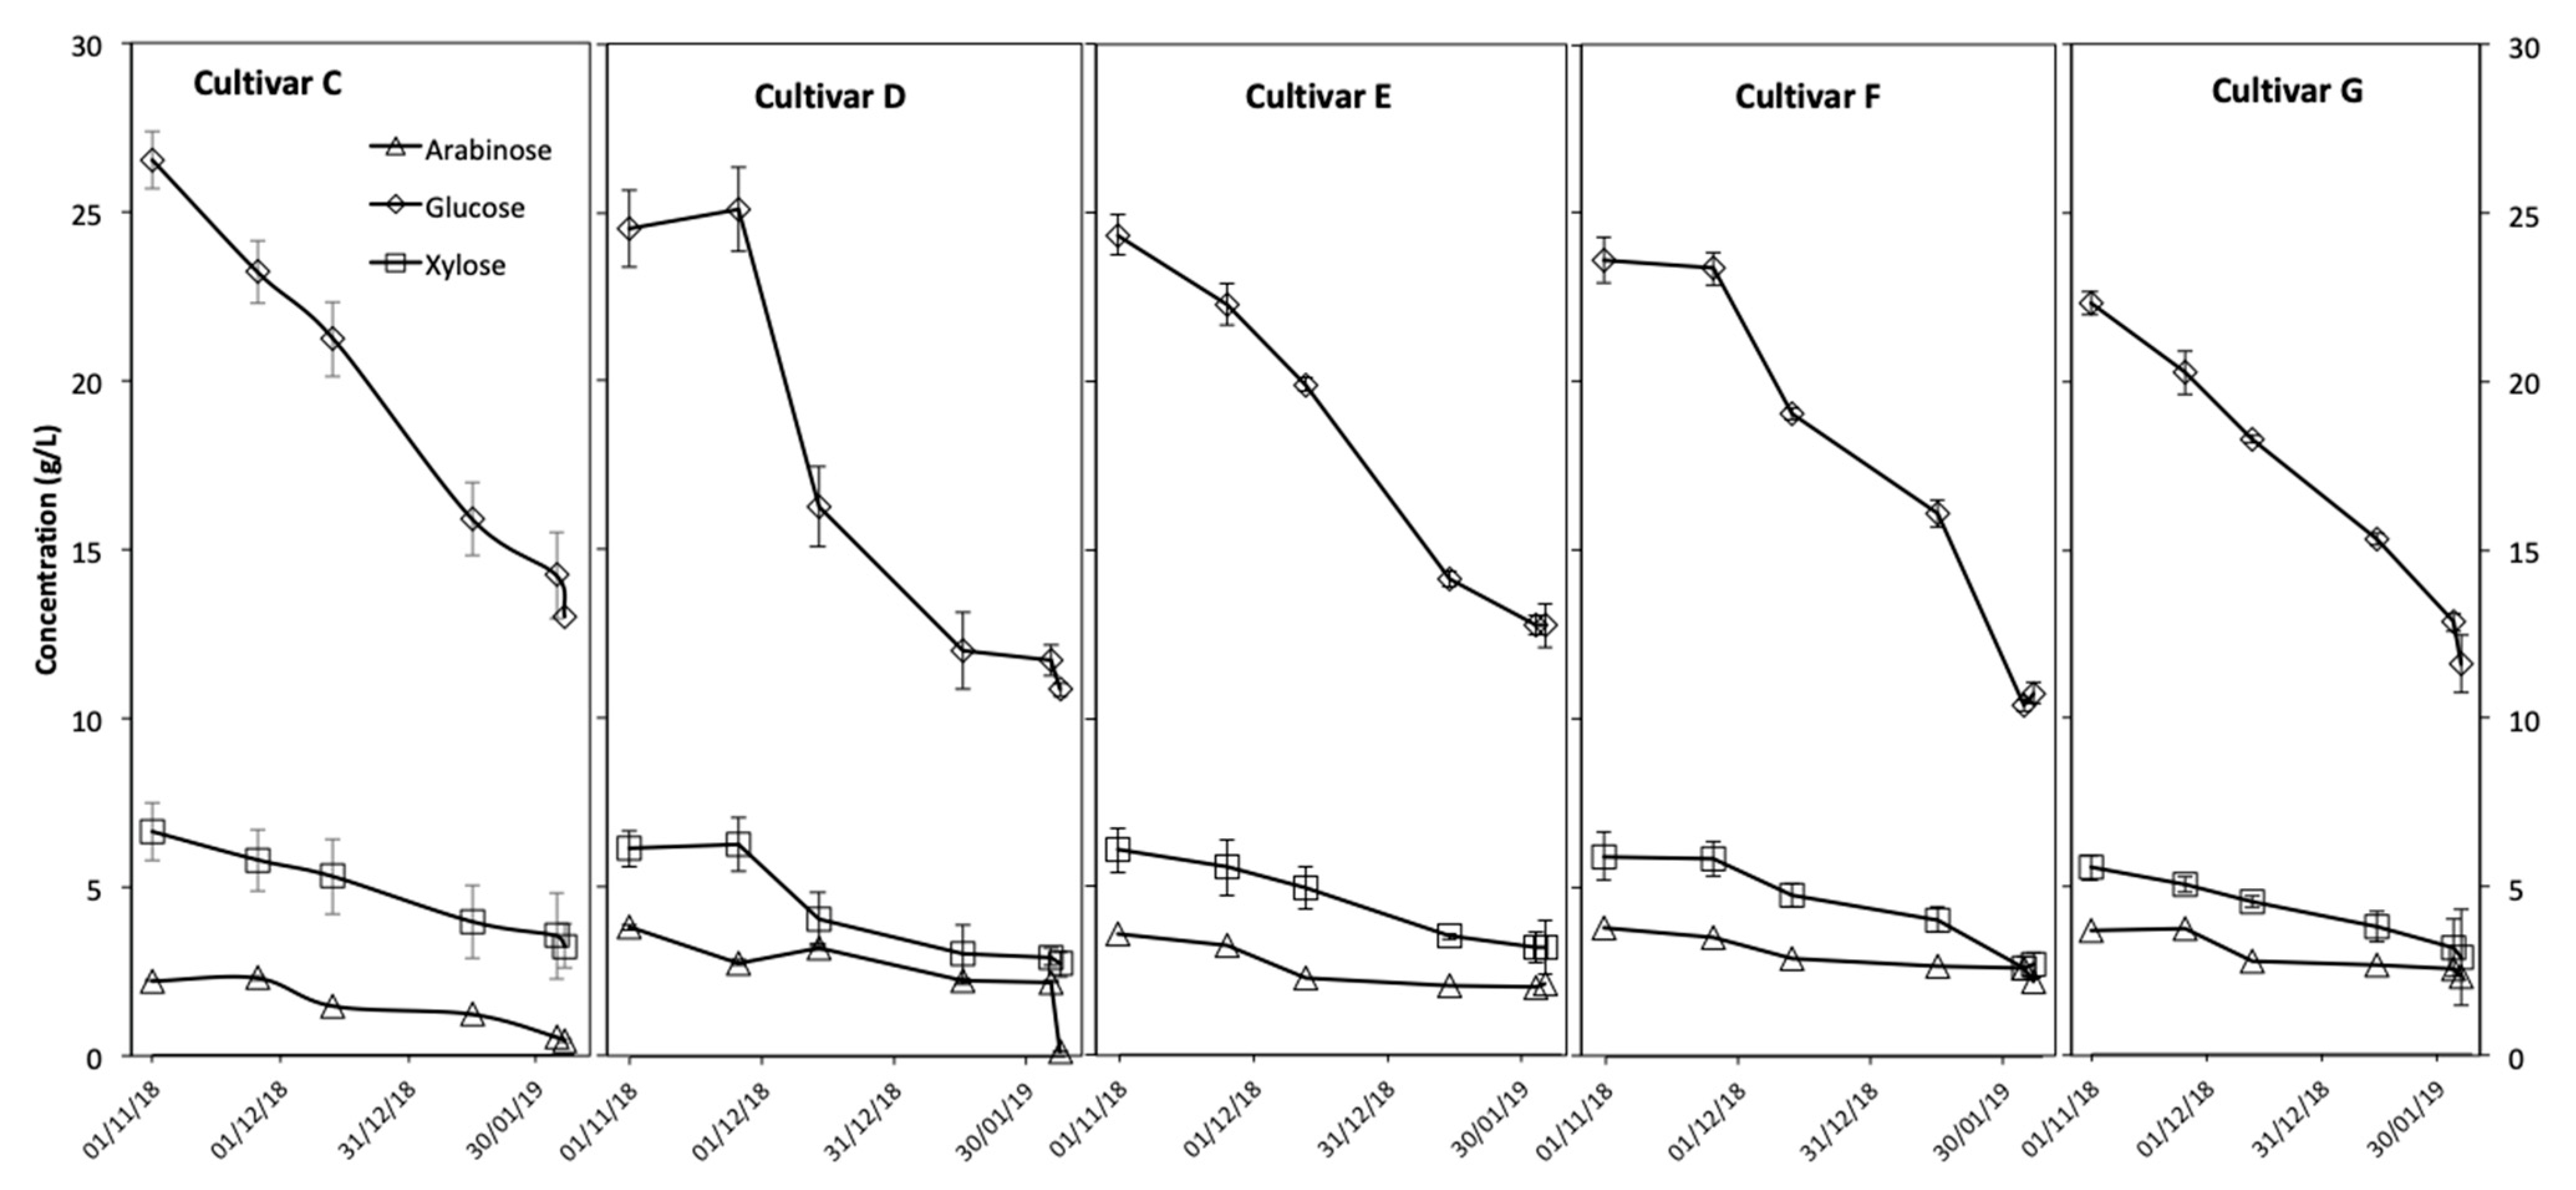
3.5. Sugar Profiles of Miscanthus Cultivars through a Growing Season

Analysis of the sugars released from Cultivars C, D, E, F and G was conducted following acid pre-treatment and enzymatic saccharification; for each cultivar, the samples used were collected at different harvest points during the growing season (1 November 2018 to 07 February 2019). Determining sugar profiles for the cultivars over the growing season revealed that these cultivars had similar sugar profiles at the first point of harvest (31.6–35.4 g/L), with glucose levels of between 22.3 and 26.5 g/L. Analysis of the sugar profile for these cultivars over the growth period revealed that hydrolysates derived from the cultivars released progressively less sugar over time (Figure 4), with hydrolysates produced from cultivars harvested on 7 February 2019 having between 13.7–18.1 g/L of total sugars (Figure 4). The results also indicated that Cultivar D had a very rapid loss of released sugars between 26 November 2018 and 14 December 2018 and had the lowest released sugars by the end of the assay. Cultivars C, E, F and G, had a slower loss of released sugars following pre-treatment.
The lignin content of selected samples in these cultivars was analysed with the aim of investigating whether the loss of monosaccharide is due to the accumulation of lignin along with Miscanthus growth. As shown in Table 3, all late harvest samples, with the exception of cultivar C, contained similar or higher lignin content than that of early harvest samples. Similar results to several reports [14,20] were also obtained when lignin content was analysed for Miscanthus cultivars harvested in a different growing period (Table 2). The amount of lignin in the Miscanthus samples could be a contributing factor to the prevention of monosaccharide release in the hydrolysis process. The cellulose and hemicellulose contents of these Miscanthus samples were not determined. Previous results (Figure 1B) indicated that there was no significant difference detected between early harvest and late harvest. The reduction of monosaccharide obtained from Miscanthus biomass could be due to the change of morphology of the grass and tighter binding of the cellulose, hemicellulose and lignin with increasing age, which would require harsher hydrolysis/saccharification conditions for adequate degradation. For Cultivar 3, the lignin content of the early harvest sample was higher than that of the late harvest sample (Table 3). Two further repeat analyses were conducted, and similar results were obtained. It is not known why this sample displayed an opposite trend to other cultivars.

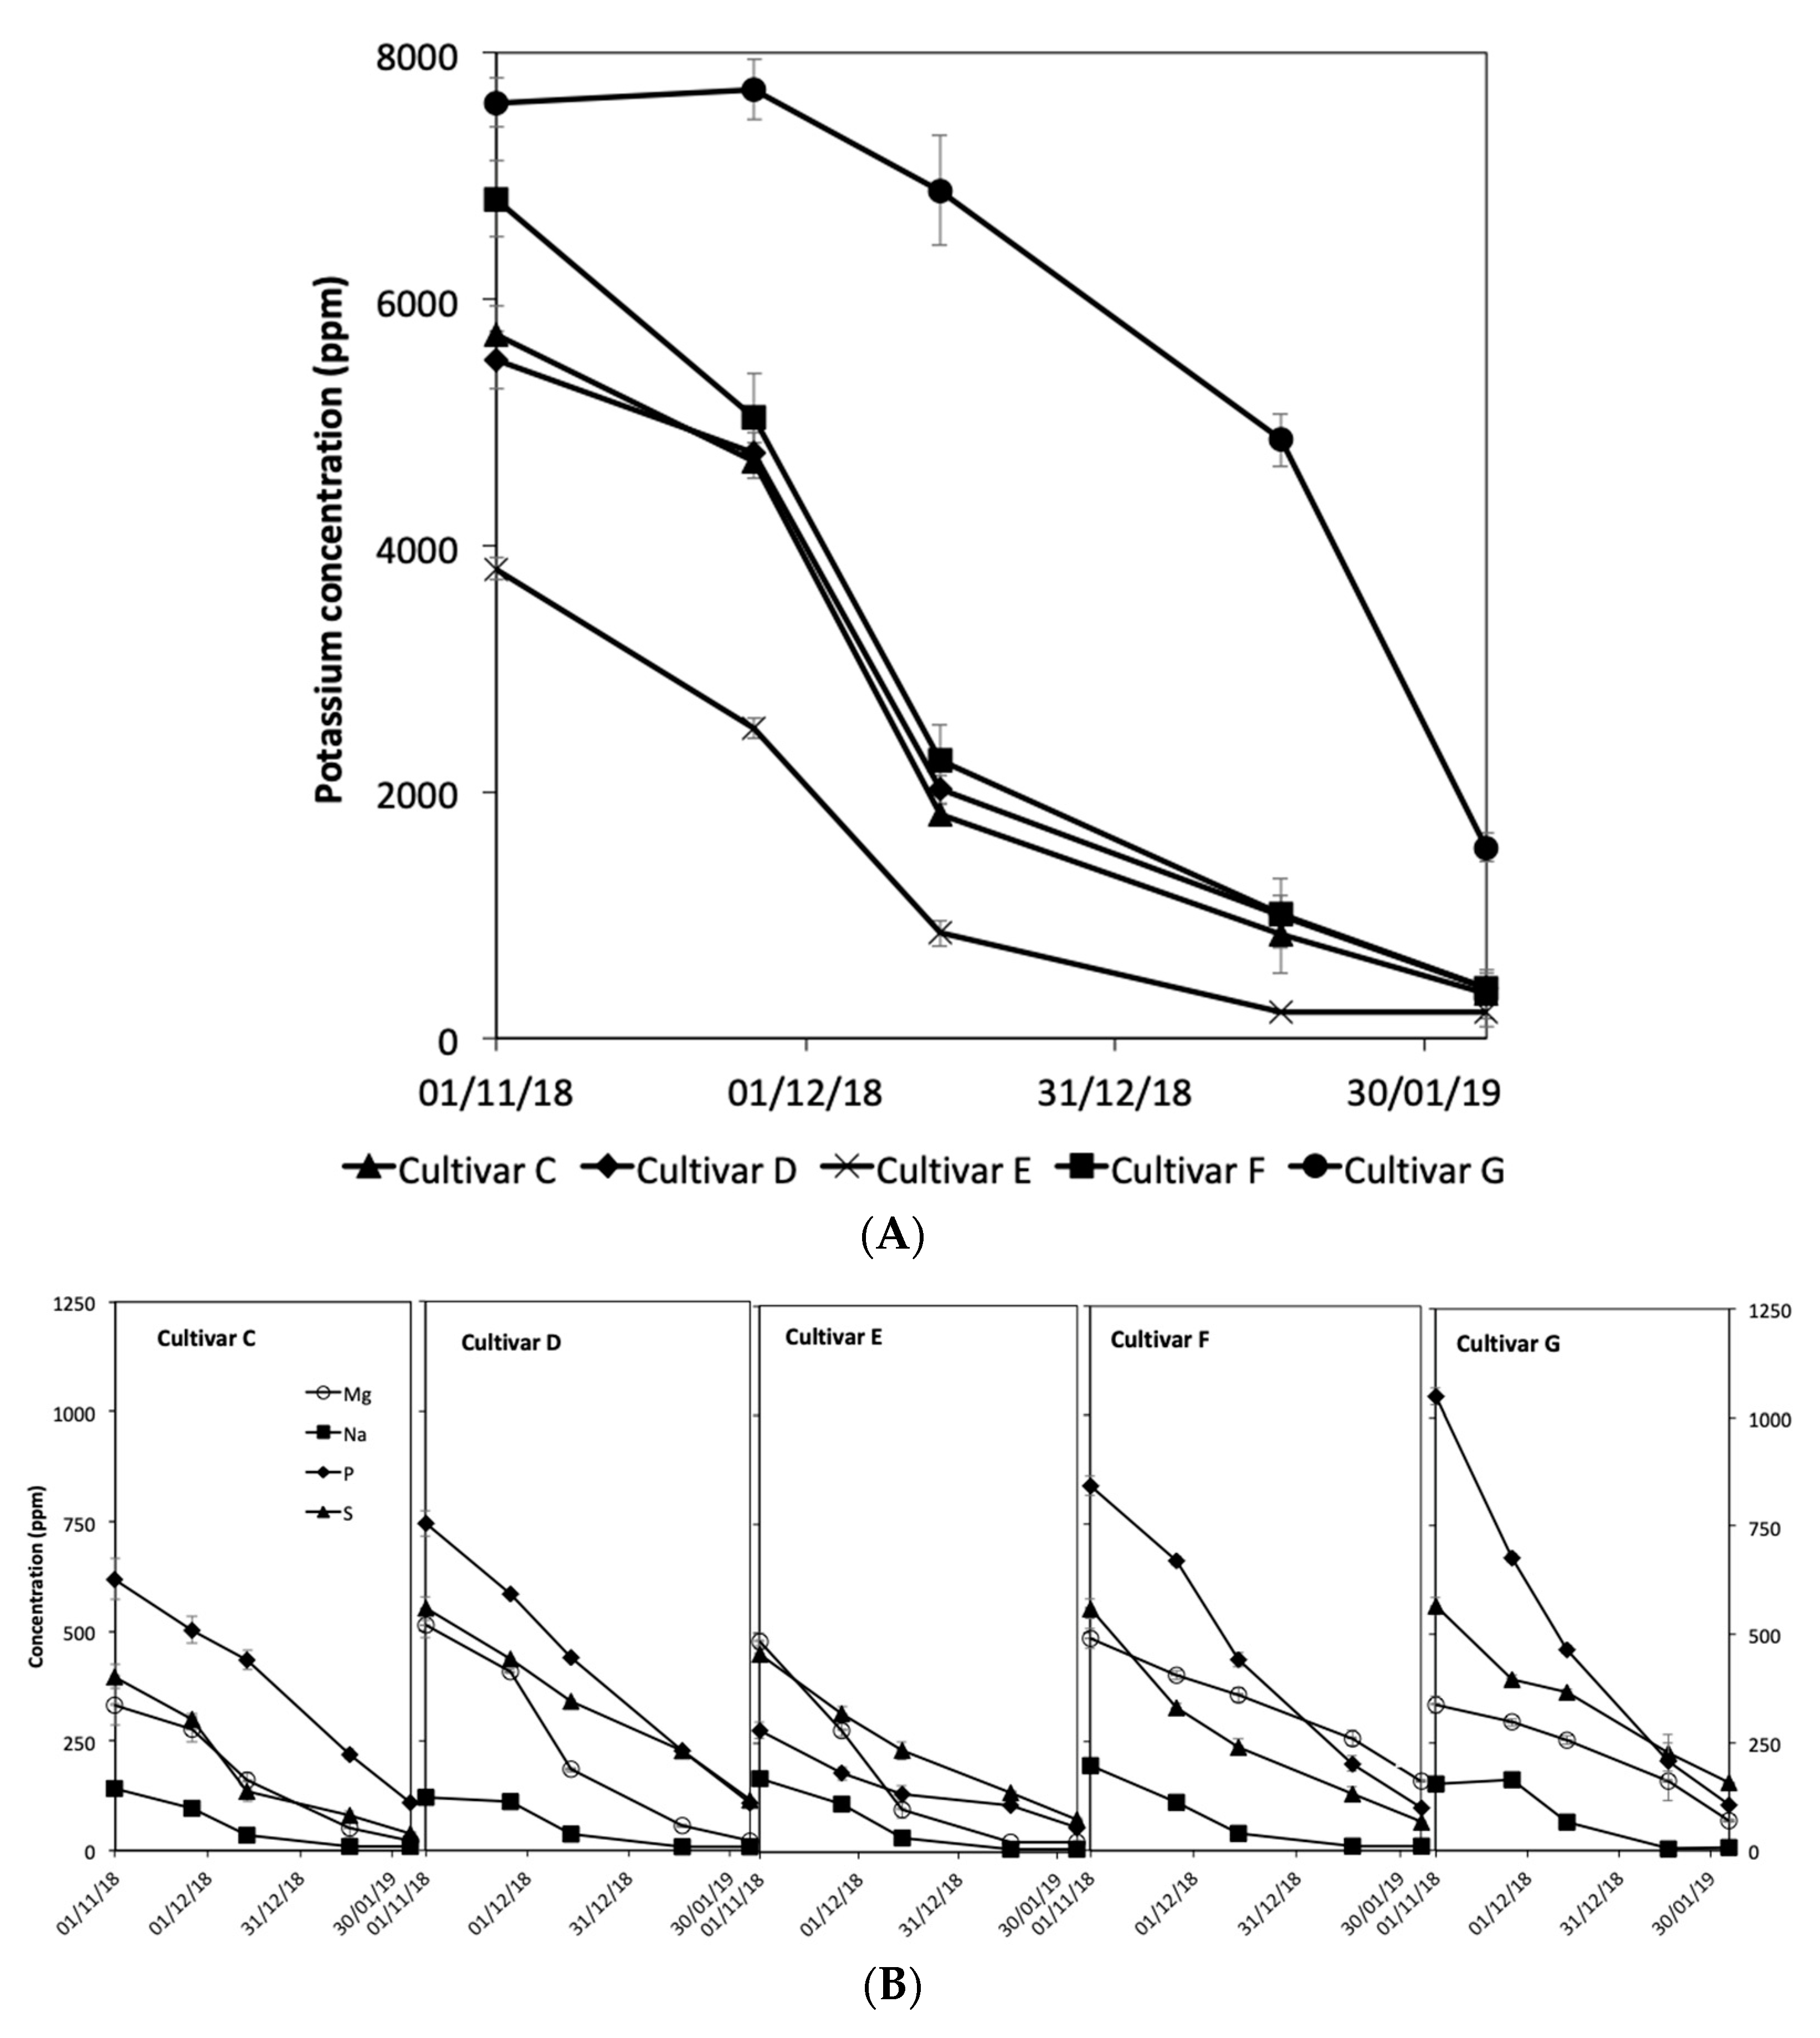
3.6. Elemental Composition of Cultivars through the Growing Season

The elemental composition of the Miscanthus cultivars was measured during the growing season, and analysis revealed a decrease in the presence of elements over the time period. Analysis also revealed that there were differences in the element levels between the cultivars. Determining the presence of potassium, magnesium, sodium, sulphur and phosphorus revealed a significantly higher potassium concentration compared to other elements (Figure 5A–E). Analysis revealed that elements are slowly lost from the plants during the growing season. The majority of the elements (Mg, S, P and Na) exhibited a constant reduction over the time period; however, potassium levels appeared to drop significantly between the harvest points of 26 November 2018 and 14 December 2018 and in Cultivars C–F (Figure 5A–D). Cultivar G had significantly higher initial potassium levels (7596 ± 198 ppm) compared with the other cultivars (3800–6800 ppm); this cultivar also had the highest phosphorus levels, but sodium, magnesium and sulphur contents were analogous with other cultivars. Cultivar G also had higher potassium levels during the growing season; this cultivar only showed a reduction in potassium levels at a later harvest date (16 January 2019). Cultivar E had significantly lower phosphorus content (278.8 ± 17.9) when compared with the other cultivars at the early time-points (619–1048 ppm).
In the UK, typical seasonal changes result in the senescence of Miscanthus before the initial harvest date in November. During senescence, the translocation of minerals and nutrients occurs from the leaves and stems into the plants’ rhizomes. It is documented that between November and February harvests, there are minimal changes to the above-ground plant, once it has senesced, until spring and summer, when the plant begins to grow again [25]. However, the results obtained in this study suggested later senescence occurred between November and February. For Cultivar G, the grass normally remains green until February; this fits the potassium profile (Figure 5A) very well. Another possible explanation of the decrease in mineral composition in the sample is the result of leaf abscission, as the samples used in this study were a mixture of milled stems and leaves. Therefore, the ratio of leaf-to-stem matter could vary between samples harvested at different dates, resulting in changes to the nutrient and mineral contents in the same plant [26]. This could also contribute to the variances seen between cultivars.

4. Conclusions and Future Work

This paper analysed the compositions of five cultivars of Miscanthus sp., cultivated at the same location, to explore the impact of cultivar difference while eliminating the potential impact of cultivation climate and soil type. The result demonstrated that the selected 5 Miscanthus cultivars all contain promising amounts of cellulose and hemicellulose for biofuel production. However, significant differences in lignocellulosic composition were observed between different Miscanthus cultivars, indicating that some cultivars have a higher potential for industrial bioethanol production. Dilute acid hydrolysis of Miscanthus spp., followed by enzymatic hydrolysis, released up to 80% glucose, while a trial fermentation achieved a bioethanol production yield of 75.6%, corresponding to 0.148 g bioethanol/g dry weight Miscanthus biomass. Sugar release profiles of 5 Miscanthus cultivars showed that it was increasingly difficult to release monosaccharides from the plant cell wall during the harvest season from November 2018 to February 2019. The mineral profile suggested late senescence occurred between November 2018 and February 2019 for some Miscanthus cultivars. The comparison of two lignin analysis methods indicated that the lignin content obtained by the Klason method was higher than that obtained by the ABSL method (~3% on average). The paper also provided visual SEM images of various hydrolysed Miscanthus samples that supported the explanation of Miscanthus lignocellulose degradation processes.
In order to further demonstrate bioethanol production potential using Miscanthus spp., a demonstration bioethanol production plant should be constructed to confirm the finding in various lab-scale experiments. As the cellulose content of different Miscanthus spp. could have a difference of ~20%, high cellulose species should be selected for large-scale cultivation. An early harvest resulted in higher sugar content and easier sugar release. However, other factors, such as moisture content, total biomass yield and recovery of minerals for next season’s cultivation, should also be considered to determine a suitable harvest date.

Author Contributions

Conceptualization, W.T., D.G., M.M. and C.D.; methodology, W.T. and D.G.; writing—original draft preparation, W.T. and D.G.; writing—review and editing, all.; supervision, M.M., M.S., J.K. and C.D.; funding acquisition, M.M., M.S., J.K. and C.D. All authors have read and agreed to the published version of the manuscript.

Funding

D.G. and C.D. would like to thank the University of Huddersfield URF (URF2015/24) for this research. WT would like to acknowledge the University of Huddersfield for the University’s PhD scholarship. The authors would like to thank Richard Hughes and James Rooney for their help on the HPLC/GC and ICP-MS analysis. Miscanthus cultivars used in this project were developed with support from the UK’s Biotechnology and Biological Sciences Research Council (BBSRC) and Department for Environment, Food and Rural Affairs (DEFRA) through the GIANT-LINK project (LK0863) and by the Innovate UK/BBSRC ‘MUST’ BB/N016149/1 project. We also thank Dick Flavell and Ceres for the uses of the Miscanthus cultivars, which were bred at Aberystwyth University, IBERS, under the leadership of John Clifton-Brown, the research group leader for Plant Biology for the Sustainable Bio-economy; in addition, we thank William Cracroft-Ely of Terravesta for hosting the trials from which samples were collected and Sam Buckby of Terravesta for collecting the samples.

Informed Consent Statement

Not applicable.

Data Availability Statement

All data is available upon request, and the authors declare that they have no competing interests.

Conflicts of Interest

The authors declare no conflict of interest.

Nomenclature

ABSLAcetyl Bromide Soluble Lignin
FPUFilter Paper Unit
HPLCHigh Performance Liquid Chromatography
ICP-MSInductively Coupled Plasma–Mass Spectrometry
MFVMini Fermentation Vessel
ROReverse Osmosis
SEMScanning Electron Microscopy
YPDYeast Extract, Peptone, Dextrose

References

  1. Chung, J.H.; Kim, D.S. Miscanthus as a potential bioenergy crop in East Asia. J. Crop. Sci. Biotechnol. 2012, 15, 65–77. [Google Scholar] [CrossRef]
  2. Adjuik, T.; Rodjom, A.M.; Miller, K.E.; Reza, M.T.M.; Davis, S.C. Application of hydrochar, digestate, and synthetic fertilizer to a Miscanthus x giganteus crop: Implications for biomass and greenhouse gas emissions. Appl. Sci. 2020, 10, 8953. [Google Scholar] [CrossRef]
  3. Edgar, V.N.; Fabián, F.L.; Julián Mario, P.C.; Ileana, V.R. Coupling plant biomass derived from phytoremediation of potential toxic-metal polluted soils to bioenergy production and high-value by-products—A review. Appl. Sci. 2021, 11, 2982. [Google Scholar] [CrossRef]
  4. Stewart, J.R.; Toma, Y.; Fernándes, F.G.; Nishiwaki, A.; Yamada, T.; Bollero, G. The ecology and agronomy of Miscanthus sinensis, a species important to bioenergy crop development, in its native range in Japan: A review. Glob. Chang. Biol. Bioenergy 2009, 1, 126–153. [Google Scholar] [CrossRef]
  5. Heaton, E.A.; Dohleman, F.G.; Miguez, A.F.; Juvik, J.A.; Lozovaya, V.; Widholm, J.; Zabotina, O.A.; Mcisaac, G.F.; David, M.B.; Voigt, T.B.; et al. Miscanthus: A promising biomass crop. Adv. Bot. Res. 2010, 56, 75–137. [Google Scholar] [CrossRef]
  6. Lewandowski, I.; Heinz, A. Delayed harvest of Miscanthus—Influences on biomass quantity and quality and environmental impacts of energy production. Eur. J. Agron. 2003, 19, 45–63. [Google Scholar] [CrossRef]
  7. Hodgson, E.M.; Lister, S.J.; Bridgwater, A.V.; Clifton-Brown, J.; Donnison, I.S. Genotypic and environmentally derived variation in the cell wall composition of Miscanthus in relation to its use as a biomass feedstock. Biomass Bioenergy 2010, 34, 652–660. [Google Scholar] [CrossRef]
  8. Wang, C.; Kong, Y.; Hu, R.; Zhou, G. Miscanthus: A fast-growing crop for environmental remediation and biofuel production. Glob. Chang. Biol. Bioenergy 2020, 13, 58–69. [Google Scholar] [CrossRef]
  9. Alam, A.; Zhang, R.; Liu, P.; Huang, J.; Wang, Y.; Hu, Z.; Madadi, M.; Sun, D.; Hu, R.; Ragauskas, A.J. A finalized determinant for complete lignocellulose enzymatic saccharification potential to maximize bioethanol production in bioenergy Miscanthus Biotechnol. Biofuels 2019, 12, 99. [Google Scholar] [CrossRef] [PubMed] [Green Version]
  10. Lee, W.C.; Kuan, W.C. Miscanthus as cellulosic biomass for bioethanol production. Biotechnol. J. 2015, 10, 840–854. [Google Scholar] [CrossRef] [PubMed]
  11. Adams, J.M.M.; Winters, A.L.; Hodgson, E.M.; Gallagher, J.A. What cell wall components are the best indicators for Miscanthus digestibility and conversion to ethanol following variable pretreatments? Biotechnol. Biofuels 2018, 11, 67. [Google Scholar] [CrossRef] [Green Version]
  12. Le Ngoc Huyen, T.; Remond, C.; Dheilly, R.M.; Chabbert, B. Effect of harvesting date on the composition and saccharification of Miscanthus × giganteus. Bioresour. Technol. 2010, 101, 8224–8231. [Google Scholar] [CrossRef]
  13. Larsen, S.U.; Jørgensen, U.; Kjeldsen, J.B.; Lærke, P.E. long-term Miscanthus yields influenced by location, genotype, row distance, fertilization and harvest season. Bioenergy Res. 2014, 7, 620–635. [Google Scholar] [CrossRef]
  14. Kam, J.; Thomas, D.; Pierre, S.; Ashman, C.; McCalmont, J.P.; Purdy, S.J. A new carbohydrate retaining variety of Miscanthus increases biogas methane yields compared to M. × giganteus and narrows the yield advantage of maize. Food Energy Secur. 2020, 9, e224. [Google Scholar] [CrossRef]
  15. Mangold, A.; Lewandowski, I.; Möhring, J.; Clifton-Brown, J.; Krzyzak, J.; Mos, M.; Pogrzeba, M.; Kiesel, A. Harvest date and leaf:stem ratio determine methane hectare yield of Miscanthus biomass. Glob. Chang. Biol. Bioenergy 2019, 11, 21–33. [Google Scholar] [CrossRef]
  16. Hastings, A.; Mos, M.; Yesufu, J.A.; McCalmont, J.; Schwarz, K.; Shafei, R.; Ashman, C.; Nunn, C.; Schuele, H.; Cosentino, S.; et al. Economic and environmental assessment of seed and rhizome propagated Miscanthus in the UK. Front. Plant Sci. 2017, 8, 1058. [Google Scholar] [CrossRef] [Green Version]
  17. Greetham, D.; Zaky, A.S.; Du, C. Exploring the tolerance of marine yeast to inhibitory compounds for improving bioethanol production. Sustain. Energy Fuel 2019, 3, 1545–1553. [Google Scholar] [CrossRef] [Green Version]
  18. Greetham, D.; Adams, J.M.; Du, C. The utilization of seawater for the hydrolysis of macroalgae and subsequent bioethanol fermentation. Sci. Rep. 2020, 10, 9728. [Google Scholar] [CrossRef]
  19. Schafer, J.; Sattler, M.; Iqbal, Y.; Lewandowski, I.; Bunzel, M. Characterization of Miscanthus cell wall polymers. Glob. Chang. Biol. Bioenergy 2019, 11, 191–205. [Google Scholar] [CrossRef] [PubMed] [Green Version]
  20. Hodgson, E.M.; Nowakowski, D.J.; Shield, I.; Riche, A.; Bridgwater, A.V.; Clifton-Brown, J.C.; Donnisona, I.S. Variation in Miscanthus chemical composition and implications for conversion by pyrolysis and thermo-chemical bio-refining for fuels and chemicals. Bioresour. Technol. 2011, 102, 3411–3418. [Google Scholar] [CrossRef] [PubMed]
  21. Kim, S.J.; Kim, M.Y.; Jeong, S.J.; Jang, M.S.; Chung, I.M. Analysis of the biomass content of various Miscanthus genotypes for biofuel production in Korea. Ind. Crop. Prod. 2012, 38, 46–49. [Google Scholar] [CrossRef]
  22. Bergs, M.; Völkering, G.; Kraska, T.; Pude, R.; Do, X.T.; Kusch, P.; Monakhova, Y.; Konow, C.; Schulze, M. Miscanthus × giganteus Stem Versus Leaf-Derived Lignins Differing in Monolignol Ratio and Linkage. Int. J. Mol. Sci. 2019, 20, 1200. [Google Scholar] [CrossRef] [PubMed] [Green Version]
  23. Brosse, N.; Sannigrahi, P.; Ragauskas, A. Pretreatment of Miscanthus × giganteus using the ethanol organosolv process for ethanol production. Ind. Eng. Chem. Res. 2009, 48, 8328–8334. [Google Scholar] [CrossRef]
  24. Han, M.; Kim, Y.; Koo, B.; Choi, G.W. Bioethanol production by Miscanthus as a lignocellulosic biomass: Focus on high efficiency conversion to glucose and ethanol. BioResources 2011, 6, 1939–1953. [Google Scholar]
  25. Jensen, E.; Robson, P.; Farrar, K.; Jones, S.T.; Clifton-Brown, J.; Payne, R.; Donnison, I. Towards Miscanthus combustion quality improvement: The role of flowering and senescence. Glob. Chang. Biol. Bioenergy 2016, 9, 891–908. [Google Scholar] [CrossRef] [Green Version]
  26. Smith, R.; Slater, F. Mobilisation of minerals and moisture loss during senescence of the energy crops Miscanthus × giganteus, Arundo donax and Phalaris arundinacea in Wales, UK. Glob. Chang. Biol. Bioenergy 2011, 3, 148–157. [Google Scholar] [CrossRef]
Figure 1. Lignocellulosic composition of various Miscanthus cultivars: (A) lignin content of Miscanthus cultivars using either the Klason method or the ABSL method; (B) comparison of cellulose, hemicellulose and lignin of Miscanthus samples harvested in early and late harvests. Data representative of triplicate values.
Applsci 11 09949 g001
Figure 2. Pre-treatment of Miscanthus and the fermentation profile of Miscanthus hydrolysate. (A) Xylose and glucose concentrations of Miscanthus cultivars following an acid pre-treatment; (B) cellulose hydrolysis yield of Miscanthus cultivars following saccharification (% of theoretical yield). (C) Fermentation profile of S. cerevisiae NCYC2592 on a hydrolysate derived from Miscanthus cultivar B (BE04). Data representative of triplicate values.
Applsci 11 09949 g002aApplsci 11 09949 g002b
Figure 3. Scanning electron microscopy images of Miscanthus spp. (A,B) raw milled samples (cultivar C), (C,D) after 1% sulphuric acid pre-treatment (cultivar B); (E) after degradation of cellulose and hemicellulose in Klason lignin analysis (cultivar C); (F) after lignin extraction in cellulose measurement (cultivar B); (G) after lignin and hemicellulose extracted in cellulose measurement (cultivar B).
Applsci 11 09949 g003aApplsci 11 09949 g003bApplsci 11 09949 g003cApplsci 11 09949 g003d
Figure 4. Sugar profiles of the hydrolysate of various Miscanthus cultivars harvested at specific time-points. Data representative of triplicate values. Harvest dates are 1 November 2018, 20 November 2018, 14 December 2018, 16 January 2019, 5 February 2019 and 7 February 2019.
Applsci 11 09949 g004
Figure 5. Elemental composition of potassium (A), magnesium, sodium, phosphorus and sulphur (B) (ppm) of Miscanthus cultivars harvested at specific time-points. Data representative of triplicate values. Harvest dates are 1 November 2018, 20 November 2018, 14 December 2018, 16 January 2019 and 5 February 2019.
Applsci 11 09949 g005
Table 1. Miscanthus cultivars analysed in this study.
GENOTYPESamples CodeHarvest PointReference
Miscanthus Cultivar A M. × giganteusBE01Early season *
Miscanthus Cultivar A M. × giganteusBE07Late season *
Miscanthus Cultivar B M. × giganteusBE04Early season *
Miscanthus Cultivar B M. × giganteusBE10Late season *
Miscanthus Cultivar C (GNT3)BE13Early season *[15]
Miscanthus Cultivar C (GNT3)BE16Late season *[15]
Miscanthus Cultivar C (GNT3) Various harvest points **
Miscanthus Cultivar D (GNT5)BE19Early season *[16]
Miscanthus Cultivar D (GNT5)BE22Late season *[16]
Miscanthus Cultivar D (GNT5) Various harvest points **
Miscanthus Cultivar E Various harvest points **
Miscanthus Cultivar F Various harvest points **
Miscanthus Cultivar G (GNT14)BE25Early season *[14]
Miscanthus Cultivar G (GNT14) Various harvest points **
* Harvested in the 2016–2017 season; ** Harvested in the 2018–2019 season, specifically on 1 November 2018, 20 November 2018, 14 December 2018, 16 January 2019, 5 February 2019 and 7 February 2019.
Table 2. Cellulose, hemicellulose and lignin content (%, w/w) of Miscanthus cultivars.
SampleTotal (Klason)Total (ABSL)CelluloseHemicelluloseLignin (Klason)Lignin (ABSL)
BE0198.5597.7741.27 ± 1.3928.70 ± 2.9028.58 ± 0.7327.78 ± 0.90
BE04104.8299.0848.09 ± 0.2628.53 ± 0.2528.20 ± 1.9422.46 ± 0.97
BE07N/AN/A45.64 ± 0.0327.76 ± 0.55N/AN/A
BE10102.08100.2945.24 ± 0.2530.58 ± 0.4026.26 ± 0.2824.47 ± 1.07
BE1399.0897.2443.00 ± 0.3730.32 ± 0.3925.76 ± 0.9823.92 ± 0.33
BE1696.5295.1446.02 ± 0.9524.27 ± 1.0126.23 ± 0.1624.85 ± 1.89
BE19100.9795.1941.15 ± 0.2732.62 ± 0.3327.20 ± 1.9821.42 ± 1.23
BE22102.498.6541.46 ± 0.8332.28 ± 0.8128.66 ± 0.4224.91 ± 0.87
BE2597.4494.0441.65 ± 1.0430.25 ± 0.6225.54 ± 0.7422.14 ± 0.75
N/A: no valid result was obtained.
Table 3. Lignin content of Miscanthus Cultivars C–G.
CultivarsLignin (ABSL) (%, w/w)
NovemberFebruary
Cultivars C25.0021.38
Cultivars D18.7822.43
Cultivars E22.2222.25
Cultivars F21.5623.71
Cultivars G17.5621.98
Publisher’s Note: MDPI stays neutral with regard to jurisdictional claims in published maps and institutional affiliations.

