1. Introduction
As the key subsystem of train control system, the balise transmission system (BTS) completes the information transmission between ground balise and onboard equipment by means of electromagnetic induction, so as to realize train positioning and line information identification. The BTS has been widely used in the world’s railway signal systems. Europe and China have issued specifications for BTS, which stipulate the conditions that BTS should meet [
1,
2,
3]. However, with the deepening of international railway exchanges and the increasing use of transnational trains, the communication quality between the balise and the onboard equipment is facing new challenges. These balises and the onboard antenna unit (OAU) from different countries and manufacturers adopt different design concepts, which may lead to the loss of transmission performance due to unsatisfactory matching after these devices work together [
4]. These problems further reduce the reliability of the BTS and threaten the safety of train operation [
5]. Therefore, the electromagnetic coupling characteristics between the OAU and the balise of the BTS need to be fully analyzed.
In recent years, some scholars have studied the electromagnetic coupling process of the BTS. In [
6], the static model of balise uplink data transmission was established by the finite element method, and the electromagnetic field distribution of the process was obtained by electromagnetic simulation. In [
7], the dynamic process of uplink data transmission was modeled and analyzed using electromagnetic field theory, and the corresponding optimization suggestions were put forward from the perspective of installation height and installation mode between the OAU and the balise. According to the test method recommended by the standard, the electromagnetic coupling characteristics of BTS were tested and analyzed in [
8]. The electromagnetic coupling model of the BTS was established in [
9], and the reason for the induced voltage amplitude envelope of the onboard receiving antenna in the coupling process was analyzed. Reference [
10] established the calculation model of the balise operating distance, and analyzed the influence of different installation modes on electromagnetic coupling characteristics. In [
11], a transmission performance evaluation method based on an equivalent impedance model was proposed to monitor the downlink transmission quality of the BTS. In [
12], a calculation model of the inductive voltage amplitude envelope of the balise downlink receiving antenna during the coupling process was established, and the sidelobe effect was analyzed using the model. In addition, Subset-036 provides some requirements for the BTS, but these requirements usually have a larger allowable range.
However, although the electromagnetic coupling process of the BTS has been discussed and analyzed in the literature mentioned above, the problem of system matching under different engineering application conditions has not been completely solved. The influence of different installation modes, vertical distance, and lateral deviation between the OAU and the balise on the transmission characteristics of uplink telegram signal has not been fully studied. In addition, the intensity of downlink tele-powering signal also has an impact on the transmission characteristics of uplink telegram signal, but this has not been discussed in any literature. In order to fully understand the complex coupling relationship among various factors involved in the electromagnetic coupling process of the BTS and establish the electromagnetic coupling model that unifies the above factors, it is necessary to find a new research method to achieve this purpose.
Digital twin (DT) is an important technology for portraying, simulating, optimizing, and visualizing the physical world in the information world. The concept of DT was first proposed by Grievers in 2003 [
13], which was first applied in the aerospace field. In recent years, with the deepening of the research on DT, it has become increasingly apparent that the most significant advantage of the DT is that it can closely and timely reflect the actual service state of physical entities to enhance information-based services in the life cycle of entities [
14]. In [
15], a digital twin model of lithium-ion batteries was proposed to evaluate the degradation of battery performance. In [
16], a ship digital twin model was established based on the data collected by sensors, and the speed loss caused by marine pollution was successfully estimated by the model. Reference [
17] proposes a proprietary framework for production line performance prediction based on digital twin technology, which can monitor the performance of the production line when production demand changes suddenly. In [
18], a fuselage DT model was established to predict the fracture probability of critical components of the fuselage. In [
19], the DT technology was used to model highway bridges for safety risk assessment. The above research proves the great potential of DT in predicting the bad behavior of complex systems [
20].
In addition, the characteristic of DT technology is that it can describe the model comprehensively from four aspects: three-dimensional structure, physical characteristics, behavior patterns, and norm restrictions [
21]. The electromagnetic coupling process of BTS is a dynamic interactive process, which cannot be fully explained by traditional static model. DT is a good way to overcome this contradiction. Through the DT method, this dynamic process can be fully analyzed and discussed from the different aspects mentioned above.
The purpose of this study was to quantitatively analyze the electromagnetic coupling characteristics of the BTS using digital twin technology. In this paper, the electromagnetic coupling process of the BTS was introduced, and the main factors involved in the electromagnetic coupling process were qualitatively analyzed using the fishbone diagram method. Then, according to these sensitive factors, the analytical model or fitting model of each module in the transmission coupling process was established. By combining these modularized models, a digital twin model to quantitatively analyze these sensitive factors was successfully established. Experiments were designed to verify the validity and accuracy of the digital twin model. Finally, the digital twin model was used to quantitatively evaluate the influence of some sensitive parameters on the electromagnetic coupling characteristics of the BTS.
The rest of this paper is organized as follows: In
Section 2, the electromagnetic coupling process of BTS is reviewed, and the key factors on the electromagnetic coupling process are discussed in the fishbone diagram.
Section 3 establishes a high-precision electromagnetic coupling model of the BTS. In
Section 4, two experiments are designed to verify the digital twin model. Then, the influence of some sensitive parameters on the electromagnetic coupling process is analyzed quantitatively in
Section 5.
Section 6 is the discussion and conclusion.
2. Modeling Foundation of the Digital Twin
2.1. Basic Working Principle of the BTS
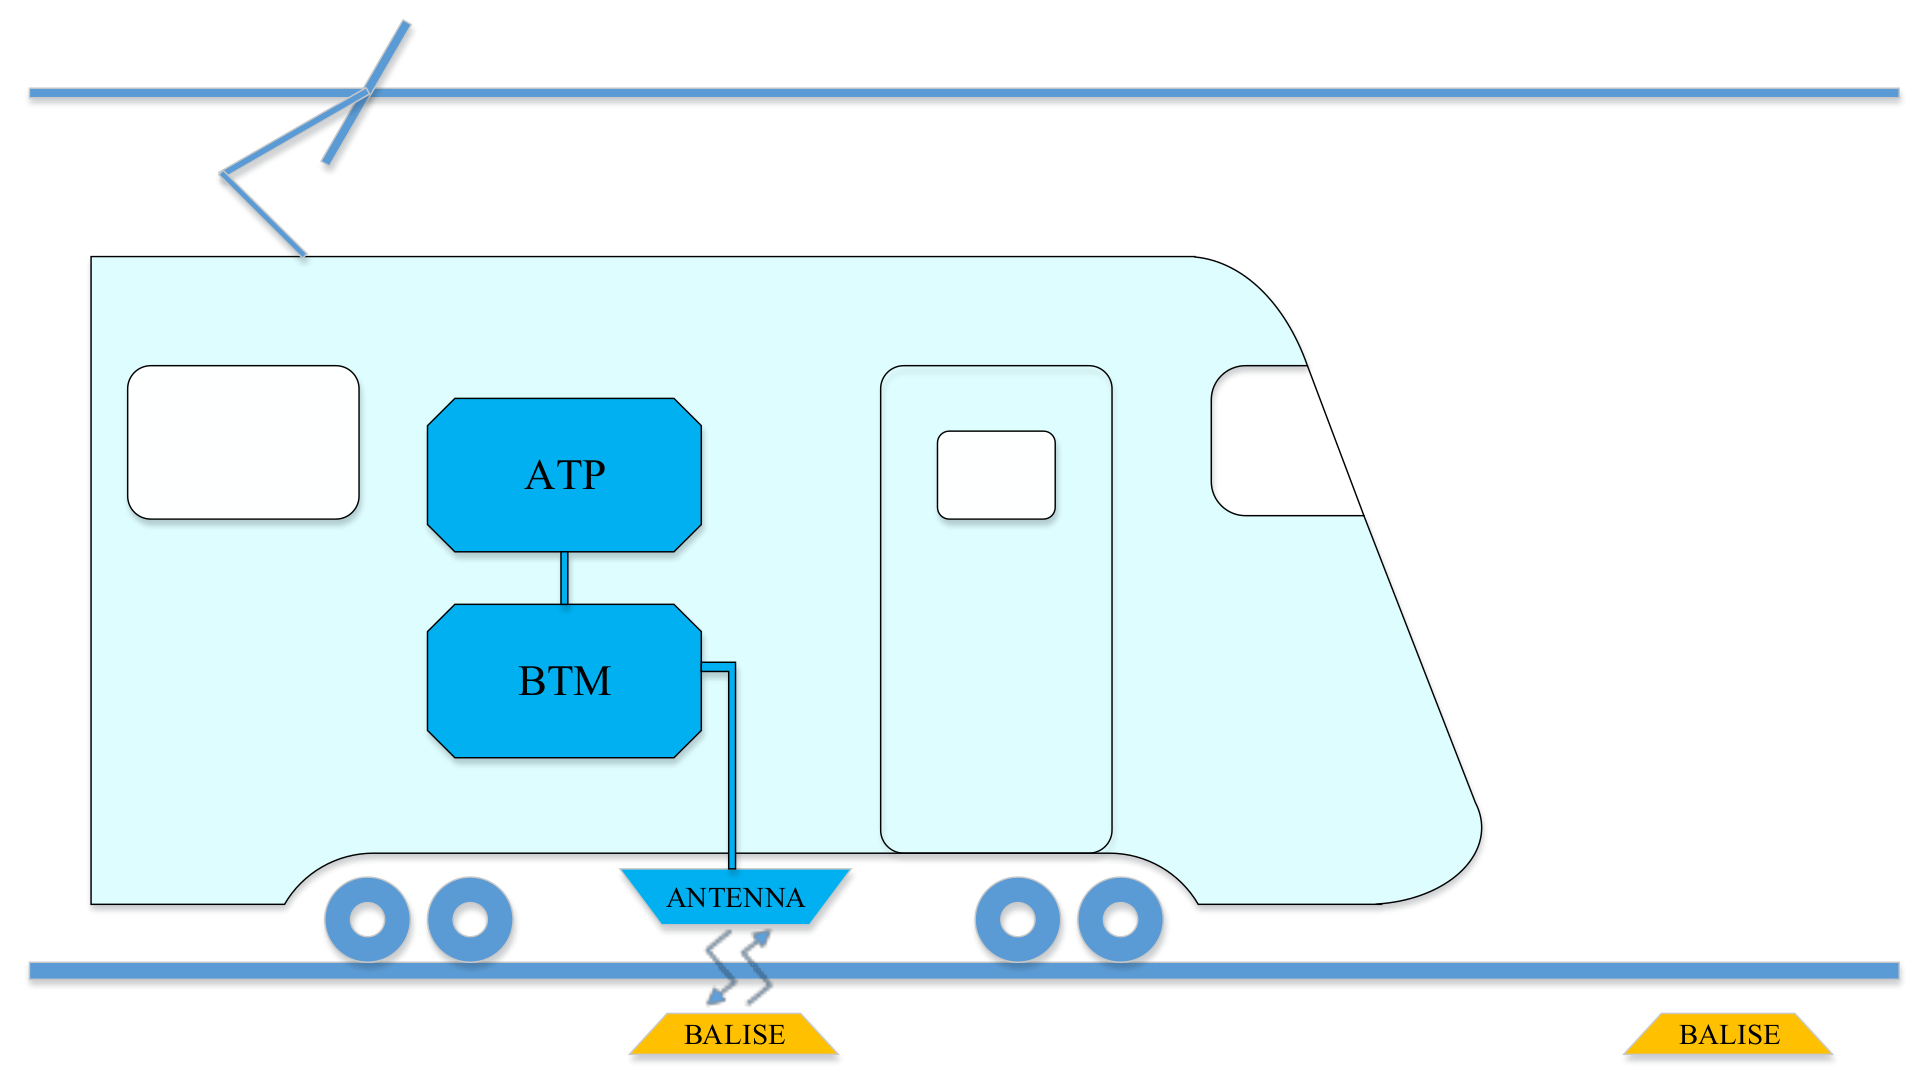
The BTS is an essential carrier for the train to get the information of the current running state in time. The BTS consists of onboard equipment (balise transmission module (BTM) and OAU which includes transmitting antenna and receiving antenna) and ground equipment (passive balise, active balise, and lineside electronic unit). The working diagram of the BTS is shown in
Figure 1.
During the train operation, the onboard transmitting antenna continuously sends tele-powering signals to the ground. When the train approaches the passive balise, the balise is activated from dormant state. After entering the active mode, the balise sends the stored telegram signals according to the specified format, modulation, and bit rate. The received tele-powering signals are converted into voltage supply signals for the passive balise. When the tele-powering signal is too weak to ensure the operation of the passive balise, the process of sending telegram signals ends. During balise activation, telegram signals are sent in a circular manner. For active balise, its power supply is provided by lineside electronic unit. The BTM obtains telegram signals through the onboard receiving antenna. The received signals whose amplitude exceeds the threshold level of BTM will be sent to the subsequent circuit module for processing. BTM performs the following functions: balise power supply, signal acquisition, filtering, amplification, demodulation, and decoding, and finally reports the decoding results to the kernel of automatic train protection (ATP). Thus, the ATP kernel could adjust the train operation state in time by combining the information of telegram and other sensors.
In the communication process of the BTS, the transmission quality of uplink telegram signal is related to whether the ATP kernel can obtain effective telegram signals successfully. In SUBSET-036, several parameters that affect the signal transmission characteristics were discussed. The vertical distance between the OAU and the balise should range from 220 to 460 mm. The balise can be installed in the middle of the track in longitudinal or transverse ways. In addition, the specification does not put forward specific requirements for the shape and size of the onboard antennas. The current intensity of the tele-powering signal on the onboard transmitting antenna is also limited indirectly.
In fact, according to the previous research, the change of uplink telegram signal power with the train movement direction directly affects the effective transmission distance and effective transmission time of the uplink telegram signal [
5]. Therefore, the electromagnetic coupling characteristic discussed in this paper refers to the variation of the uplink telegram signal power received by the onboard receiving antenna with the antenna displacement.
2.2. Factor Analysis of Electromagnetic Coupling Process
In order to establish the high-fidelity electromagnetic coupling model of BTS, it is necessary to find all the key factors that affect the electromagnetic induction process through qualitative analysis. Concerning the requirements in [
1] and the discussion of the system workflow in the previous section, the key factors affecting the uplink signal reception are analyzed by the fishbone diagram analysis method.
According to their attributes, the
Figure 2 classifies all factors: normative restrictions, determined by the manufacturer, and uncontrolled. Moreover, they are represented by the letters N, D, and U, respectively.
The uplink signal received by BTM depends on four aspects: balise transmitting antenna, uplink transmitting current, onboard receiving antenna, and spatial property of the transmission antennas.
The characteristics of balise transmitting antenna and onboard receiving antenna depends on the shape, size, and matching circuits of each antenna. However, except that the shape and size of the balise antenna are required in SUBSET-036, the design of the OAU does not have too many restrictions. For the OAU, it only needs to pass the relevant tests in SUBSET-085 to meet the basic performance required by the test specification. Therefore, for the parameters that are not specified in the specification, the equipment manufacturer can use different designs to achieve the required performance of the equipment.
During the operation of the train, the uplink transmission current of the passive balise is not constant. This situation may further lead to the loss of signal transmission quality. The uplink current depends on the onboard transmitting antenna, tele-powering signal, balise receiving antenna, and its internal conversion circuits. Among them, the properties of the conversion circuit can be tested according to the balise input and output characteristic test in SUBSET-085.
The spatial property between the transmitting antenna and the balise antenna in the 3D space depends on the longitudinal (train running direction), lateral (perpendicular to the track), vertical (installation height) displacement, and debris (such as ice and snow, gravel, metal block) in the adjacent space of the antenna.
The above-mentioned factors together have an important influence on the transmission quality of the uplink telegraph signal. How to deal with the relationship among these factors and the DT model is discussed in the following chapters.
3. DT Model of the Electromagnetic Coupling Process of the BTS
3.1. Structural Design of DT Model of Electromagnetic Coupling Process of the BTS
The equipment components of the BTS and their operating principles were discussed in
Section 2.1. The factors influencing the electromagnetic coupling process of the BTS were discussed qualitatively in
Section 2.2. On the basis of these two subsections, this subsection discusses the DT model structure of the electromagnetic coupling process of the BTS. Then the design scheme of the system-level model is proposed, and the modeling objectives and tasks of each sub-model are specified. The mapping relationship between the real-world BTS and the DT model of the system’s electromagnetic coupling process is shown in
Figure 3.
The downlink excitation circuit of the BTM sends the RF power signal to the balise through the onboard transmitting antenna, and the balise receiving antenna receives the downlink magnetic flux. The transmission process of this RF power signal requires a downlink transmission model for describing the effect on the magnetic flux received by the balise receiving antenna due to the RF power signal current strength, the antenna shape and size, and the relative position change of the antennas during the train movement.
After the balise receiving antenna receives the RF power signal, the balise is activated from the dormant state. The internal conversion circuit of the balise processes the RF power signal to provide the transmitting current for the uplink signal to the passive balise transmitting antenna. This process requires an equivalent current model of the passive balise that describes the mapping of the magnetic flux strength received by the balise receiving antenna to the uplink signal current strength of the balise transmitting antenna.
The onboard receiving antenna receives the uplink signal from the balise transmitting antenna through the air gap interface. The magnetic flux received by the onboard receiving antenna is affected by the antenna shape and size, the current strength on the balise transmitting antenna, and the relative position between the antennas. This process requires an uplink transmission model.
The matching circuit of the onboard receiving antenna can improve the performance of the receiving antenna and reduce the loss of transmission performance caused by impedance mismatching and resonance frequency offset. Therefore, a matching circuit model of the onboard receiving antenna is needed to predict the relationship between the magnetic flux of the uplink signal received by the onboard receiving antenna and the uplink signal power on the input port of the BTM.
Since the relative positions of the OAU and balise are constantly changing during train movement, both uplink and downlink transmission models need to fully reflect the changes in signal transmission characteristics caused by such dynamic factors. The uplink and downlink transmission models have similarities and are both electromagnetic induction models. Therefore, for both models, the fundamental task was to establish an accurate model of mutual induction between the antennas.
By combining the above sub-models, a DT model of the electromagnetic coupling process of BTS can be successfully established in theory. In order to realize the quantitative analysis of the electromagnetic coupling characteristics of BTS, it is a challenging task to accurately build each of the above sub-models and realize the lossless connection of the sub-models.
3.2. Mutual Inductance Calculation between the OAU and the Balise
Balise antenna and vehicle antenna generally adopt the design of rectangular coil antenna, which belongs to electric small loop antenna. According to the research in [
22], when the OAU of the BTS is more than 11 cm away from the metal plate, the influence of the eddy magnetic field generated by the metal plate on the OAU can be ignored. Therefore, we can establish a simplified model of the uplink transmission process in the BTS, as shown in
Figure 4.
Rectangular is a balise transmitting antenna, and rectangular is an onboard receiving antenna. A three-dimensional rectangular coordinate system is established, taking the center of the balise transmitting antenna as the origin. It takes the directions parallel to the and sides of the balise transmitting antenna as the axis and the axis. Let the direction perpendicular to the balise transmitting antenna be the axis. The train speed vector is consistent with the positive direction of the axis.
Let
be the vacuum permeability, and
and
be half of the side length of the balise transmitting antenna along the
axis and the
axis, respectively. Let
and
be half of the side length of the onboard receiving antenna along the
axis and
axis, respectively.
is the coordinate of the center point of the onboard receiving antenna. An analytical model of mutual inductance between two parallel rectangular antennas at arbitrary relative positions can be obtained by applying the second-order vector potential method [
23].
Equation (1) is an essential basis for the quantitative evaluation of the electromagnetic coupling characteristics of the BTS. It explains the interaction between the onboard receiving antenna and the balise. The induced voltage of the onboard receiving antenna can also be calculated according to (1).
3.3. Modeling and Analysis of Matching Circuit
In order to ensure the transmission efficiency of telegram signals and reduce the signal distortion caused by reflection and group delay, the antennas of BTS are usually impedance matched. The equivalent circuit of the uplink signal transmission antennas using an L-type matching circuit is shown in
Figure 5.
For the uplink transmitting antenna of the balise, is the input impedance, and are the series and parallel tuning capacitors, respectively, represents the sum of the equivalent resistance of the transmitting antenna and the series loss resistance, and represents the equivalent inductance of the transmitting antenna. is the current flowing through the balise transmitting antenna. For the onboard receiving antenna, represents the equivalent inductance of the onboard receiving antenna. is the induced current on the onboard receiving antenna. represents the sum of the equivalent resistance and the series loss resistance of the onboard receiving antenna. and are the series and parallel tuning capacitors, respectively. and are resistors for impedance matching, is the load impedance. and are used to filter the tele-powering signal. is the mutual inductance between the balise transmitting antenna and the onboard receiving antenna.
This article focuses on the analysis of the equivalent circuit of the onboard receiving antenna. The purpose of the parallel tuning capacitor is to reduce the relatively large impedance connected in parallel on the right side so that the real part is equal to . The quality factor of the receiving antenna can be changed by adjusting the resistance of . The role of the series tuning capacitor is to resonate with the antenna equivalent inductance and the parallel capacitor , thereby canceling the reactance part of the circuit.
Since the onboard receiving antenna usually uses a single-turn rectangular planar loop antenna, its equivalent capacitance can be ignored, and we can calculate the equivalent inductance
[
24] as follows:
where
and
are the sizes of the long and short sides of the rectangular planar loop antenna respectively, and
is the diameter of the equivalent cylindrical conductor with the same cross-sectional perimeter of the antenna conductor.
where
is the thickness of the rectangular loop antenna conductor and
is the width of the conductor.
The quality factor
of the matching circuit can be calculated as follows:
where
can be calculated according to the circuit structure:
Therefore, once the quality factor is defined, the total resistance of the series circuit can be calculated.
The reactance value
of the matching circuit in series with the antenna and the reactance value
of the matching circuit in parallel with the antenna can be expressed as:
According to the resonant frequency of the designed circuit, the parameters of the corresponding inductor and capacitor components can be calculated.
In Equation (7), represents the inductance in the series circuit, and represents the capacitance in parallel with the output impedance ().
Because the antenna is inductive, its inductance is not equal to the calculated value of the above impedance-matched series inductance . Therefore, the inductance of the antenna itself can be used for impedance matching.
For the remaining inductance
, when
is greater than 0, the imaginary part is matched to 0 through series capacitance, so
can be calculated as follows:
The double-mesh equation of the entire equivalent circuit can be expressed as:
When the onboard receiving antenna is tuned at the center frequency of 4.234 MHz, the sum of the imaginary parts of
should be 0, and the real part of
is equal to
, so:
When
is less than 0, series inductance can be used to increase the inductance of the series circuit, so as to offset the capacitive reactance of the parallel circuit to achieve a matching state. At this time, the resonant current
of the onboard receiving antenna at the center frequency can be calculated by the same way:
Therefore, the port voltage of shunt capacitor
is:
Combining (1), (5), and (12), the port voltage of the load impedance
after matching and filtering can be obtained:
where
.
According to (13), it can be seen that the voltage of the uplink signal received by the onboard receiving antenna after good impedance matching is related to the quality factor of the antenna and has nothing to do with the reactance components in the matching circuit. The voltage is also affected by the size of the balise transmitting antenna and the onboard receiving antenna, the relative spatial position between the antennas, and the current flowing through the transmitting antenna. The received uplink signal voltage is proportional to the current intensity on the balise transmitting antenna.
3.4. Equivalent Model of Passive Balise Transmitting Current
Depending on the balise energy source, the in (13) changes accordingly. The LEU provides the current on the active balise transmitting antenna, so the current intensity can be kept constant during communication. However, the passive balise uses the received tele-powering signal as the energy source, and the magnitude of the transmitted current is affected by the received magnetic flux, which changes with the longitudinal displacement between antennas.
In order to accurately describe the change of the uplink signal transmitting current intensity of the passive balise with the magnetic flux intensity of the received downlink RF power signal, the input–output characteristics of the passive balise need to be modeled. Directly building such a model is a difficult task for balise, whose internal conversion circuits contain nonlinear devices. Fortunately, the SUBSET-085 test specification proposes a black-box test method for balise input–output characteristics. According to the balise input–output characteristic curve, the equivalent current model of the balise can be obtained by curve fitting.
When the train passes through the passive balise, the current on the balise transmitting antenna is determined by the magnetic flux
passing through the balise receiving antenna and the input–output characteristics of the balise:
is the mutual inductance between the onboard tele-powering transmitting antenna and the balise receiving antenna, which can be calculated by referring to (1). The excitation current
is an adjustable constant provided by the BTM. The balise input–output characteristic is determined by its internal conversion circuit and needs to meet the requirements of the SUBSET-036 functional interface specification [
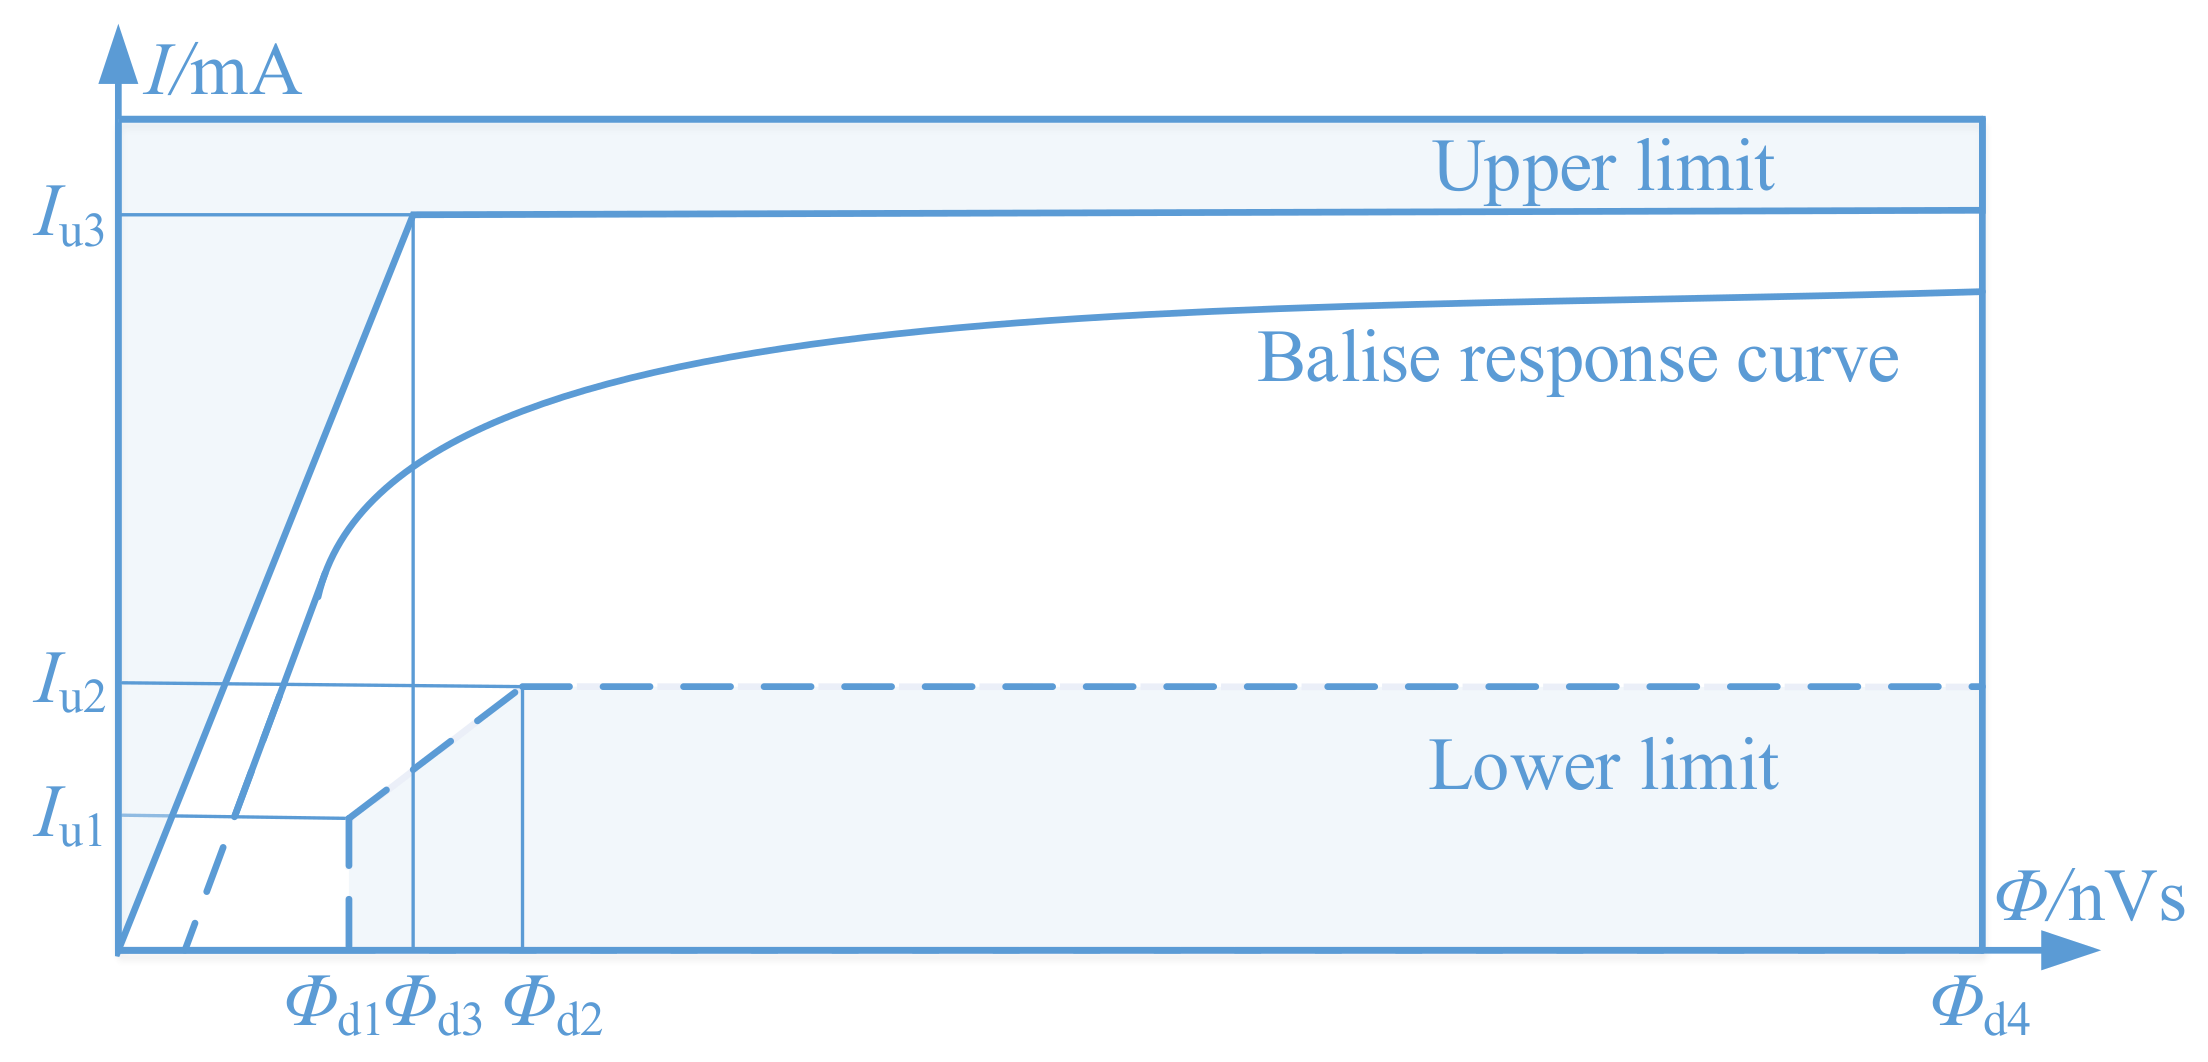
1], as shown in
Figure 6.
The abscissa represents the magnetic flux of the tele-powering signal received by the balise. The ordinate represents the current on the balise transmitting antenna, which comes from the received magnetic flux processed by the internal conversion circuits. The relevant parameter requirements of the reduced size balise in SUBSET-036 specification are shown in
Table 1.
We can fit the curve in
Figure 6 with a univariate nonlinear regression model:
In (15), , , , and are all constants, represents the magnetic flux, and represents the current on the balise transmitting antenna.
According to
Figure 6, the balise uplink current is positively correlated with the magnetic flux passing through the balise receiving antenna, but it is a nonlinear relationship. An accurate balise input–output characteristic curve is the basis for establishing the uplink current model of the passive balise. Fortunately, a method to measure this input–output characteristic curve of balise has been proposed in [
2]. Furthermore, this test is also a necessary part of the functional test of the balise. Therefore, a simplified method is to attain the balise input–output characteristic curve through testing and use (15) to fit the curve, omitting the modeling of the complex conversion circuits inside the balise.
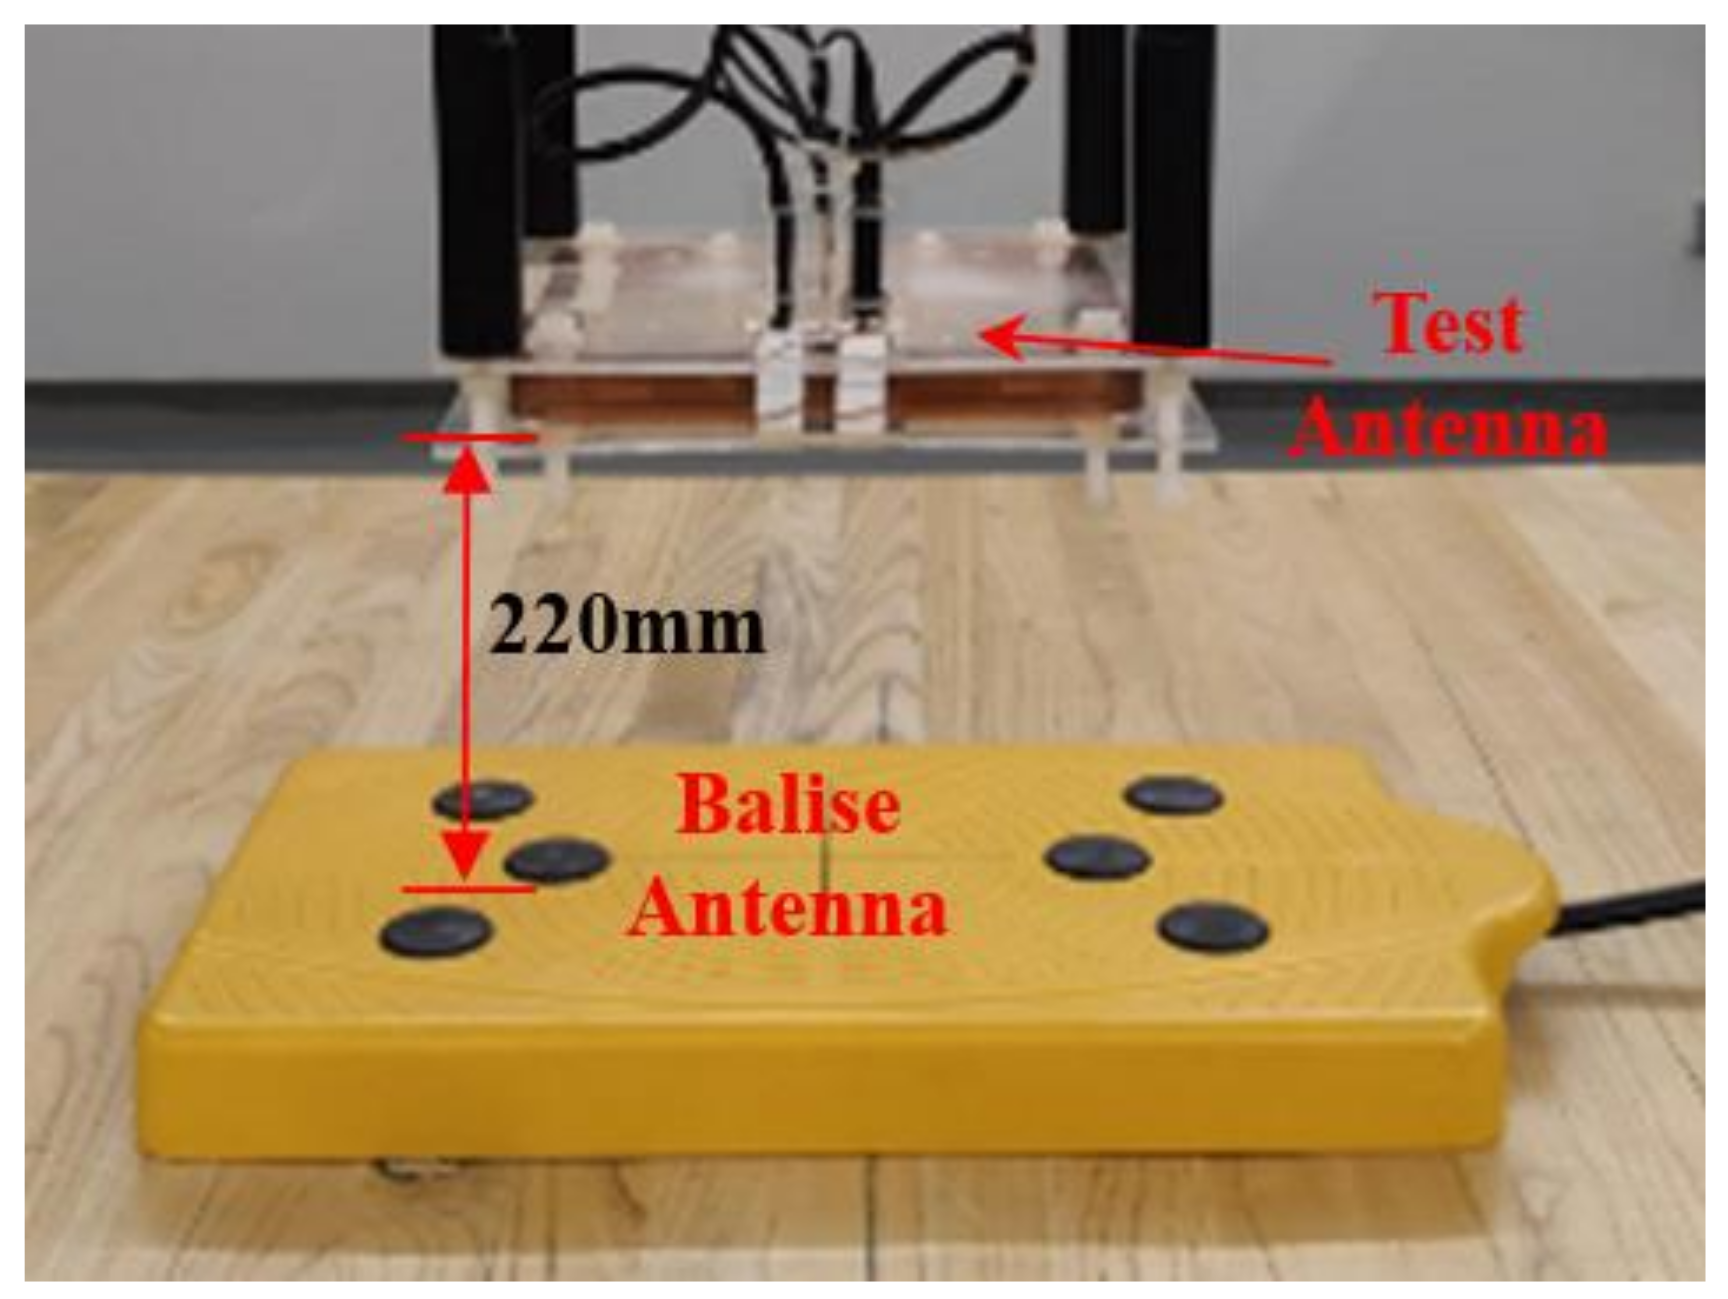
According to the requirements of the balise input–output characteristic test in the test specification, a certain type of passive balise was tested. The connection block diagram of the test equipment and the test layout are shown in
Figure 7 and
Figure 8, respectively. The test program and procedures were consistent with the requirements in the specification. It is worth noting that in this test, the vertical distance between the test antenna and the balise was 220 mm.
The test was carried out in the laboratory which could meet the requirements of the test equipment and test environment in the specification. The red star in
Figure 9 is the test result of the balise input–output characteristics. On this basis, Equation (15) was used to fit the results, and the fitting curve is shown as the blue dotted line in
Figure 9. The regression equation is as follows:
The determination coefficient R2 and root mean square error (RMSE) were used as the criteria for the goodness of fit of the model:
where
are the measurement results of the input–output characteristics of the balise,
is the total number of measurement points, and
is the corresponding fitting result calculated according to (16).
According to the calculation, the coefficient of determination R2 of the regression equation is 0.9946, and the RMSE is 0.2221. These indicators show that the curve fitting of the input–output characteristics of the balise achieved satisfactory results.
Combining (14) and (16), the expression for calculating the uplink current is as follows:
The information transmission of the BTS was realized by near-field induction coupling. The communication distance was much smaller than the signal wavelength, so we could ignore the multipath effect and doppler shift effect in the communication process. According to (13), (14), and (18), the digital twin model of electromagnetic coupling process of the BTS was successfully established. By this model, the telegram signal intensity coupled to the onboard receiving antenna when the OAU and the balise were in any relative position could be accurately calculated.
3.5. DT Model of Electromagnetic Coupling Process of BTS
The three most essential sub-models of the electromagnetic coupling process of BTS are developed in
Section 3.2.,
Section 3.3 and
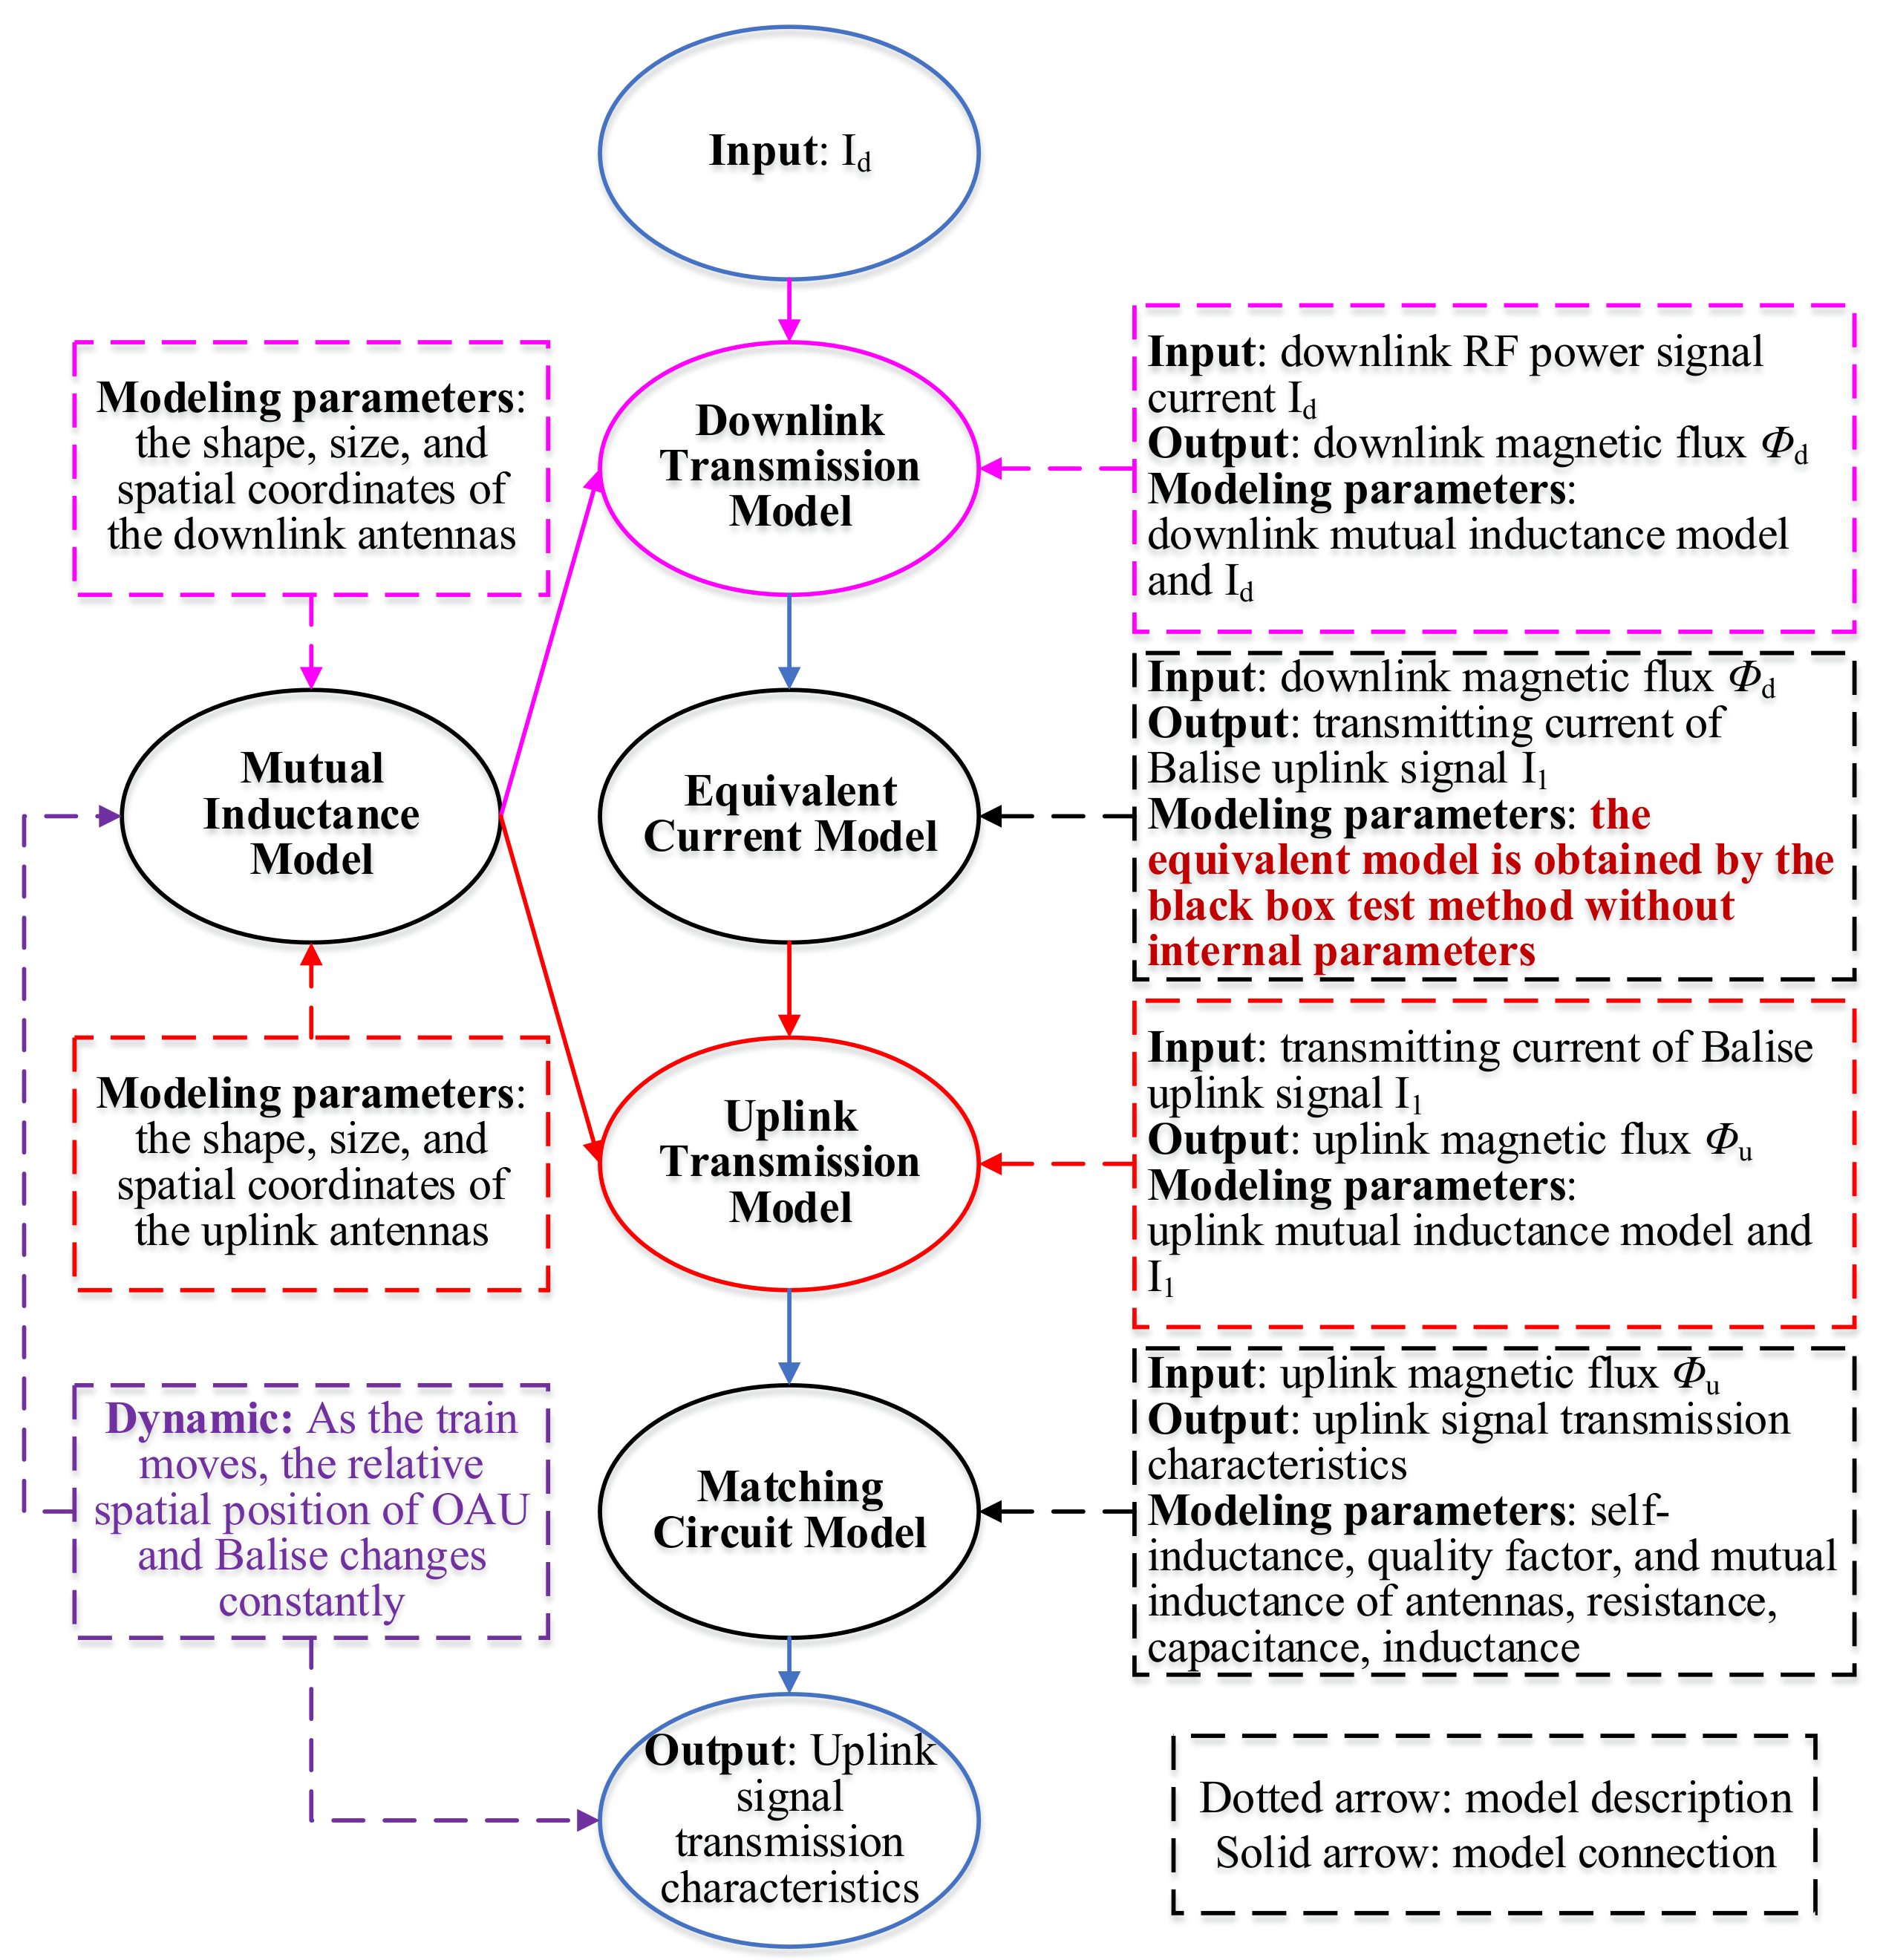
Section 3.4, respectively. In this subsection, based on the research in the previous four subsections, the sub-models are fused, and a DT model of the electromagnetic coupling process of BTS is successfully constructed, as shown in
Figure 10.
The mutual inductance model between antennas was involved in constructing the uplink or downlink transmission model. The uplink transmission model needed to calculate the mutual inductance between the onboard receiving antenna and the balise transmitting antenna, as shown in (1). For the downlink transmission model, the antennas of the mutual inductance model became the onboard transmitting antenna and the balise receiving antenna, and the corresponding antenna parameters in (1) needed to be replaced.
The downlink transmission model could be obtained according to (14). In (14), refers to mutual inductance between downlink transmission antennas, which can be calculated by referring to (1).
The equivalent current model of the passive balise was obtained by the black-box test method, as shown in (18). When the passive balise changes, we first used the black-box test method to obtain the test result curve of the input and output characteristics of the balise and then obtained the corresponding equivalent current model according to the fitting result of (15).
According to the uplink transmission model and the matching circuit model of the onboard receiving antenna, the uplink signal power received by the onboard receiving antenna at any relative position of the OAU and balise can be calculated, as shown in (13). The current in (13) is the uplink transmitting current of balise, which is consistent with in (18) for the passive balise.
The fusion of the above sub-models resulted in a system-level DT model that allowed the analysis of the electromagnetic coupling process of the BTS. The effect of the variation of different system parameters on the uplink signal transmission characteristics could be studied quantitatively using this DT model.
4. Experimental Verification of the Digital Twin Model
In this section, two experiments are designed to verify the proposed electromagnetic coupling model. The OAU and balise in the experiments came from a BTS equipment manufacturer in China. The test was carried out in a laboratory whose qualification, environment, and related test equipment all met the requirements of SUBSET-085. In order to evaluate the similarity between the calculated results of the electromagnetic coupling model and the actual measured results, the Pearson correlation coefficient and Spearman rank correlation coefficient were used as evaluation indices. However, the above two methods were only applicable to the evaluation of linear or monotonous nonlinear relations and were not good at dealing with complex nonlinear relations between different data [
25]. To make up for the above deficiencies, the maximum mutual information coefficient (MIC) [
26] was used as a supplement to judge whether there was a nonlinear correlation between the two results.
4.1. Verification of the Tele-Powering Field Conformity
Table 2 shows the dimensional parameters and typical parameters of the OAU and passive balise produced by a BTS manufacturer, in which the dimensional parameters of the onboard receiving antenna were consistent with that of the transmitting antenna.
represents the current of the tele-powering signal on the onboard transmitting antenna. For the OAU and balise in
Table 2, we measured the tele-powering field conformity in the laboratory with reference to [
2]. The test configuration and test scenario are shown in
Figure 11 and
Figure 12, respectively. The vertical distance between the OAU and the balise was set to 340 mm. During the measurement, the balise was fixed on the desktop, and the OAU moved laterally along the
X-axis.
There were two major differences from the tele-powering field conformity measurement scheme in the specification. The first was that the tele-powering signal emitted by the onboard transmitting antenna remained constant during the entire measurement process. However, the response of the balise at each measurement position needed to be measured and recorded. Second, from the measurement connection diagram, we could find that a special balise test antenna replaced the passive balise, thus eliminating the need for an additional 4.2 MHz test antenna. The specially designed balise test antenna was based on the reduced size passive balise, adding an external monitoring interface. The filter and the power meter were directly connected to the particular balise test antenna. The filter was used to isolate the influence of the 27 MHz tele-powering signal on the power meter B so that the balise response could be directly measured by the power meter B.
Except for the above two differences, the test methods and test procedures were consistent with the specification requirements. Simultaneously, using the downlink transmission model referring to (1) and (14), and the same antenna parameters in
Table 2, the change of the magnetic flux received by the balise with the longitudinal displacement of the OAU was calculated. The measurement results and calculation results are shown in
Figure 13.
The magnetic flux received by the balise is related to the relative position of the balise and the OAU. When the OAU and the balise coincided in the XOY plane, the balise received the most magnetic flux. With the increase in longitudinal displacement between the OAU and the balise, the received magnetic flux gradually decreased and reached the minimum value when the absolute value of the longitudinal displacement difference was around 50 cm. When the longitudinal displacement between the antennae further increased, the magnetic flux received by the balise first slowly increased to the maximum of the sidelobe, and then continued to decrease with the increase of the displacement.
The above phenomenon was determined by the magnetic field distribution characteristics of the rectangular antennas. When the magnetic flux received by the balise reached its minimum value, the direction of magnetic induction intensity in the balise region was reversed by increasing the longitudinal displacement of the OAU and the balise. Linhai Zhao simulated the magnetic field distribution between the balise and the onboard rectangular antenna [
7]. His simulation and analysis results also showed that the information transmission between the rectangular antennas would cause the sidelobe effect.
The longitudinal displacement–downlink flux envelope curves were very similar between the measured results and the calculated results. However, the calculated result near the longitudinal displacement was significantly larger than the measured result. The calculated value was 3.05 nVs greater than the measured value at . With the increase of longitudinal displacement, the difference decreased gradually. This phenomenon was caused by the inconsistency between the current of the tele-powering signal used in the calculation and the current on the onboard transmitting antenna during the measurement. Due to the accumulated errors in the measurement process, the current intensity of the tele-powering signal on the onboard transmitting antenna may not reach 1000 mA.
We adjusted the current intensity of
in the calculation model to 880mA, and kept all the other parameters as before. The corrected calculation result could be obtained as shown by the black dotted line in
Figure 13. The corrected calculation result curve almost coincided with the measurement result curve, and the difference between the corrected calculation result and the measurement result was only 0.23 nVs at
. This confirmed the previous conjecture that the error was caused by the difference in the current of the tele-powering signal.
The Pearson correlation coefficient, Spearman rank correlation coefficient, and maximum mutual information coefficient were 0.9998, 0.9786, and 0.9999, respectively, for the corrected curve and the measured curve. This indicates that the electromagnetic coupling calculation model proposed in this paper can accurately predict the tele-powering field conformity measurement results.
4.2. Verification of the Uplink Field Conformity
The OAU and the balise in this verification are the same as the antennas in
Table 2. The difference is that this verification is to test the uplink signal transmission characteristics.
Some typical parameters of the uplink receiving antenna matching circuit obtained from the manufacturer are shown in
Table 3. With these parameters, the signal power of the uplink receiving antenna port can be calculated according to (13).
The uplink field conformity test configuration is shown in
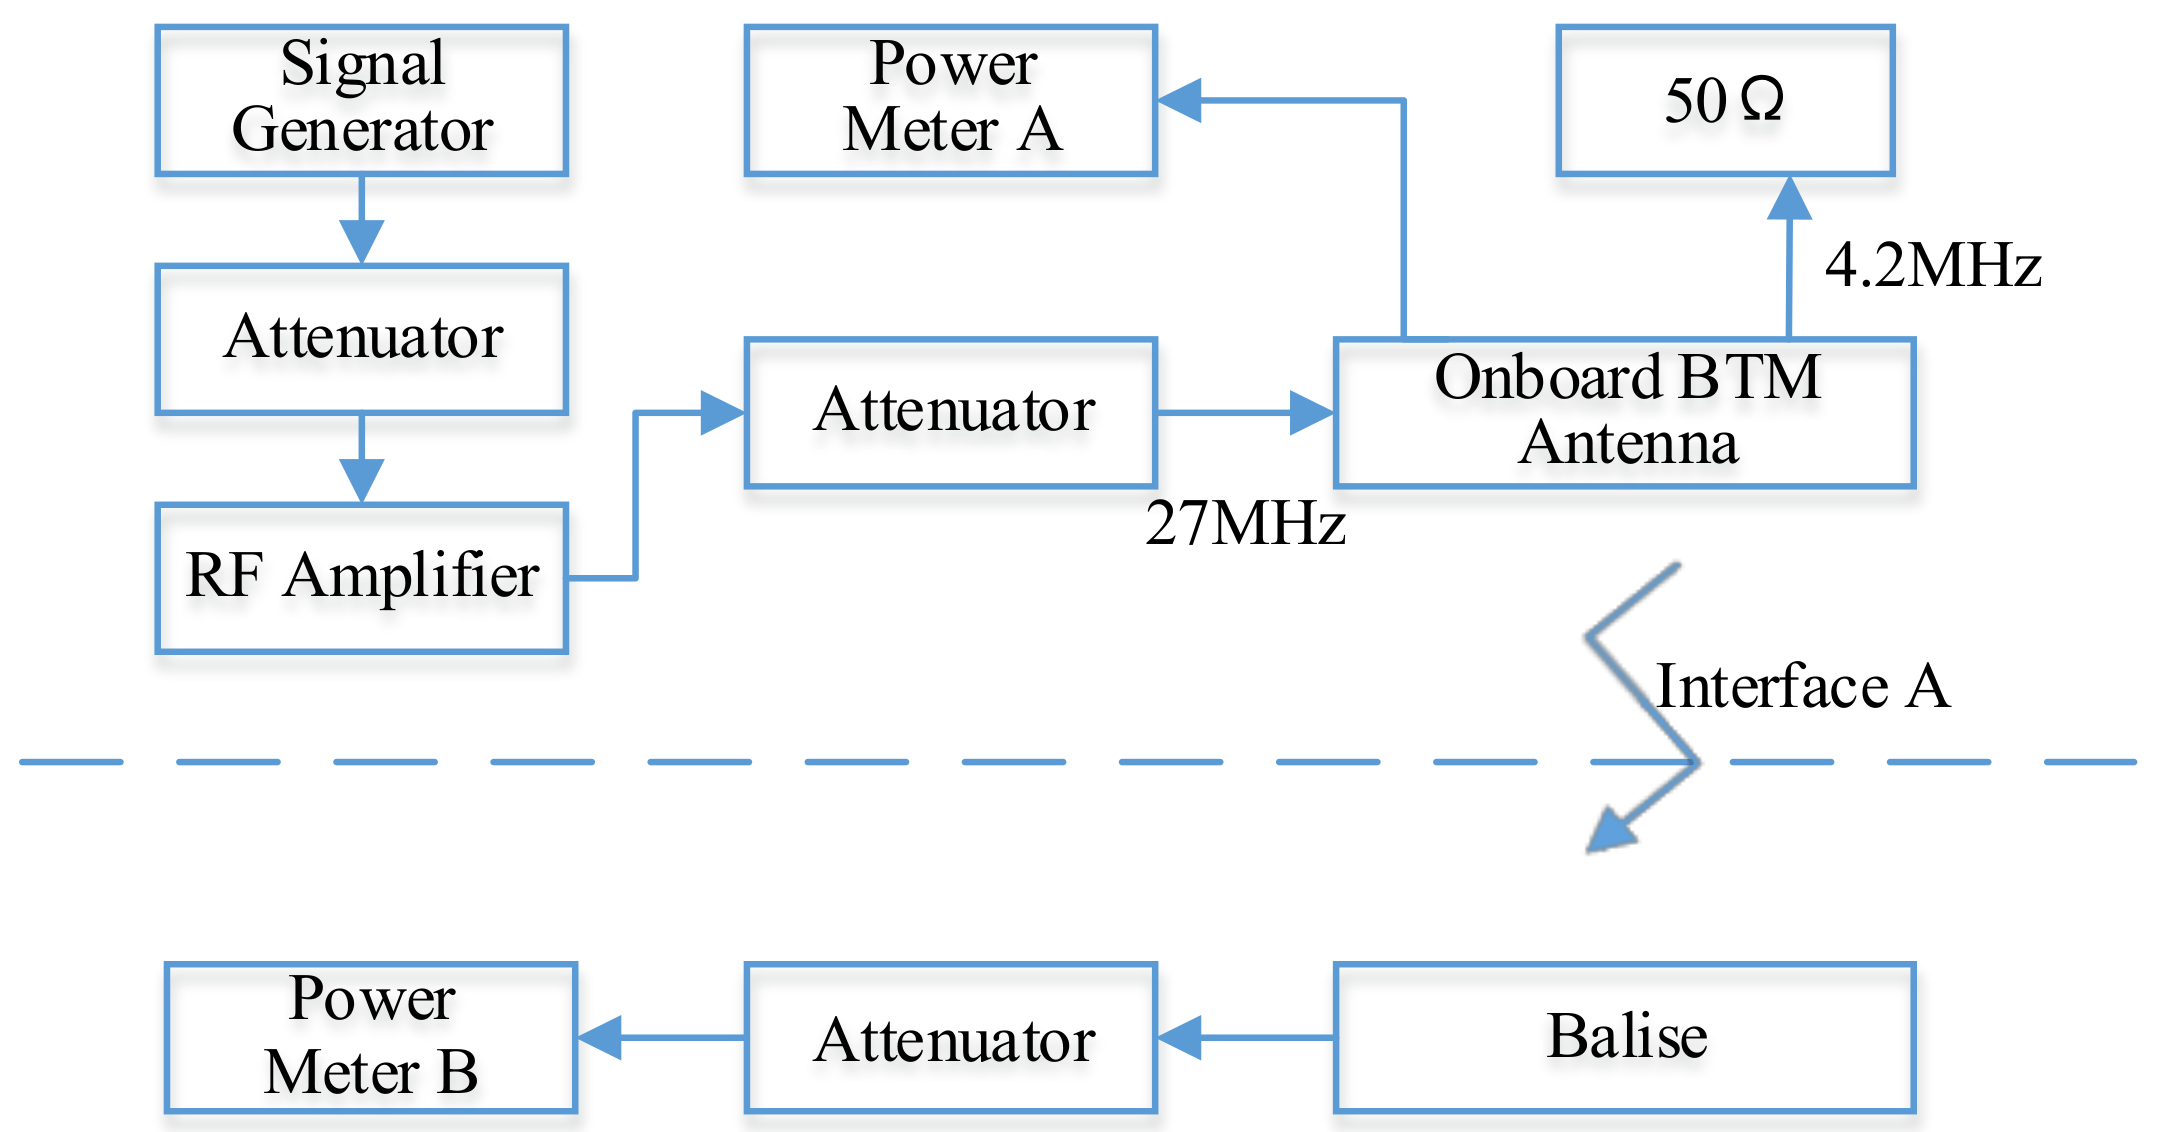
Figure 14. The signal generator sent the telegram signal with the center frequency of 4.2 MHz to the balise, and the attenuator was used to isolate and protect the signal generator. We adjusted the output power of the signal generator and observed the power meter A to make the uplink signal current intensity on the balise transmit antenna reach 59 mA. The 27 MHz tele-powering transmitting antenna was impedance-matched with a 50-ohm load. We attained the signal power of the uplink receiving antenna port by power meter B.
The test scenario was consistent with
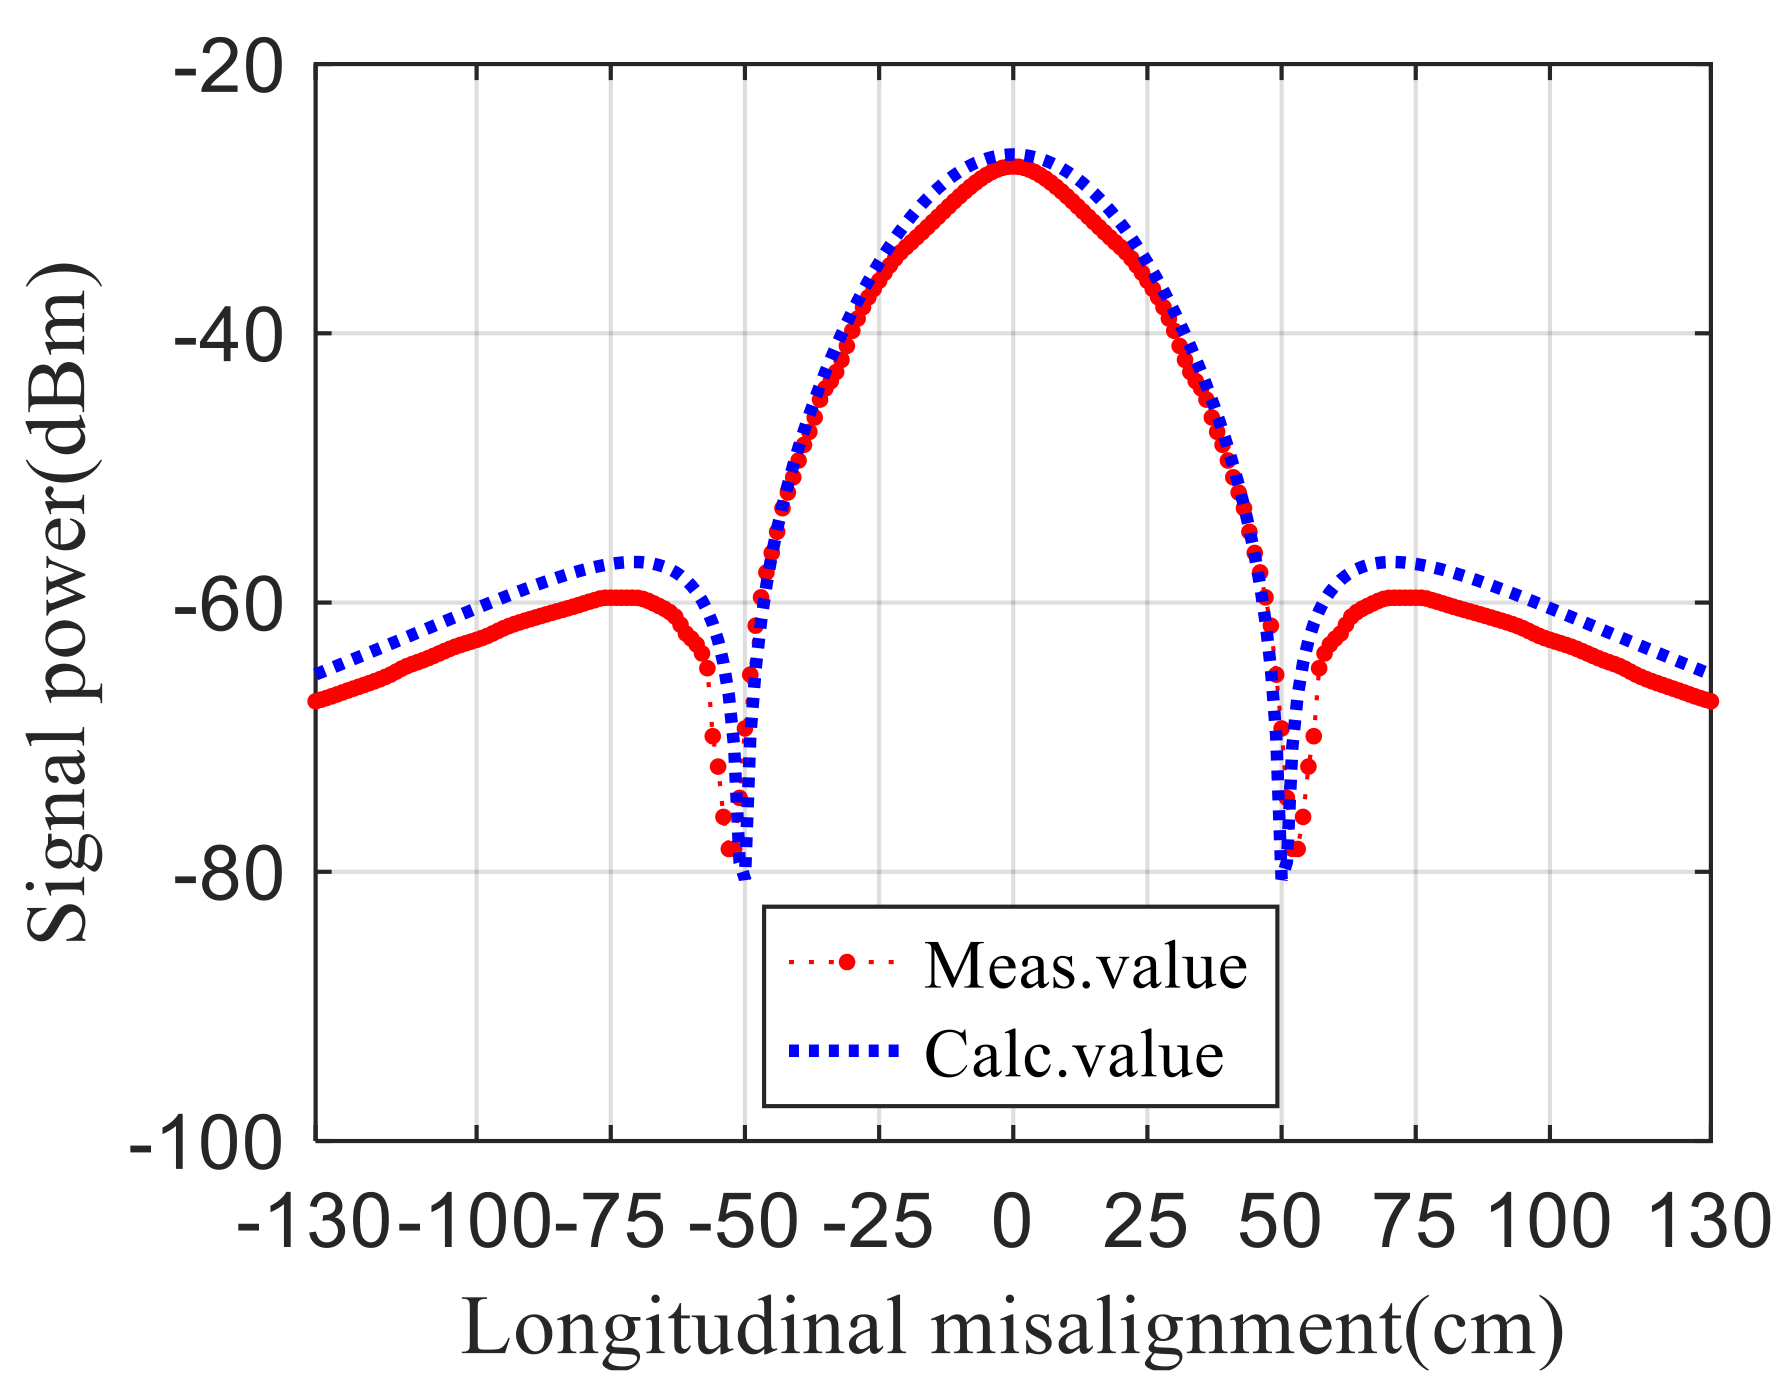
Figure 12. During the measurement process, the current intensity of the uplink signal on the balise transmitting antenna remained the same. The signal power of the onboard receiving antenna port at each position needed to be measured and recorded. The rest of the measurement steps were consistent with the measurement scheme of uplink field conformity in the test specification. The results of measurement and calculation are shown in
Figure 15. The cause of the sidelobe effect in
Figure 15 is the same as that in
Figure 13, which is also by the magnetic field distribution characteristics of the rectangular antennas. Compared with
Figure 13,
Figure 15 adopts a logarithmic coordinate system so that the sidelobe effect appears more prominent. The envelope of the calculation result curve was very similar to that of the measurement result curve, and the error between the measurement and calculation results in the main lobe zone was within 2 dB.
The Pearson correlation coefficient, Spearman rank correlation coefficient, and maximum mutual information coefficient were 0.9943, 0.9971, and 0.9999, respectively, for the calculation curve and the measurement curve. This shows that the proposed electromagnetic coupling calculation model can accurately predict the uplink field conformity measurement results.
The tele-powering field conformity test and the uplink field conformity test are respectively for downlink and uplink of the BTS. Based on the verification of these two aspects, the validity and accuracy of the electromagnetic coupling model of the BTS established in this paper can be fully affirmed.
5. Quantitative Evaluation of the Influence of Some Typical Parameters on the Balise Uplink Signal
High-quality signal transmission is the basis for ensuring the reliability of the BTS. The BTS involves many system parameters. Setting these parameters and matching different parameters is done to ensure better information transmission is not accurately described in the relevant specifications, standards, and previous literature, but rather relies on engineering experience. This section provides a quantitative evaluation of the influence of some typical parameters affecting the signal power coupled to the onboard uplink receiving antenna.
Some typical parameters of a BTS composed of an OAU and a reduced size balise are shown in
Table 4.
and
are half of the two sides of the reduced size balise antenna (including transmitting antenna and receiving antenna) along the OX axis and OY axis, respectively.
and
represent half of the two sides of the OAU (the same antenna is used for downlink transmission and uplink reception) along the OX axis and OY axis, respectively. BTS-related standards and specifications do not put forward specific requirements for the size of the onboard antennas. It only needs to pass the tele-powering field conformity test and the uplink field conformity test in the test specification. The allowable range of antenna vertical distance
is 220 to 460 mm. The antenna lateral deviation is the deviation of the OAU and the balise along the OY axis. This is usually caused by the static installation of the OAU and balise and the steering and vibration during dynamic train operation. The maximum allowable deviation is specified by the manufacturer. For the balise emission current
,
.
and
are the minimum and maximum currents on the transmitting antenna when the balise is working normally, and the amplitudes are 59 and 186 mA, respectively.
By calculating the parameters in
Table 4, we can discuss the influence of the lateral or longitudinal installation mode, vertical distance, lateral deviation, uplink transmitting current intensity of active balise, and tele-powering signal current intensity of onboard transmitting antenna on the uplink signal of the system.
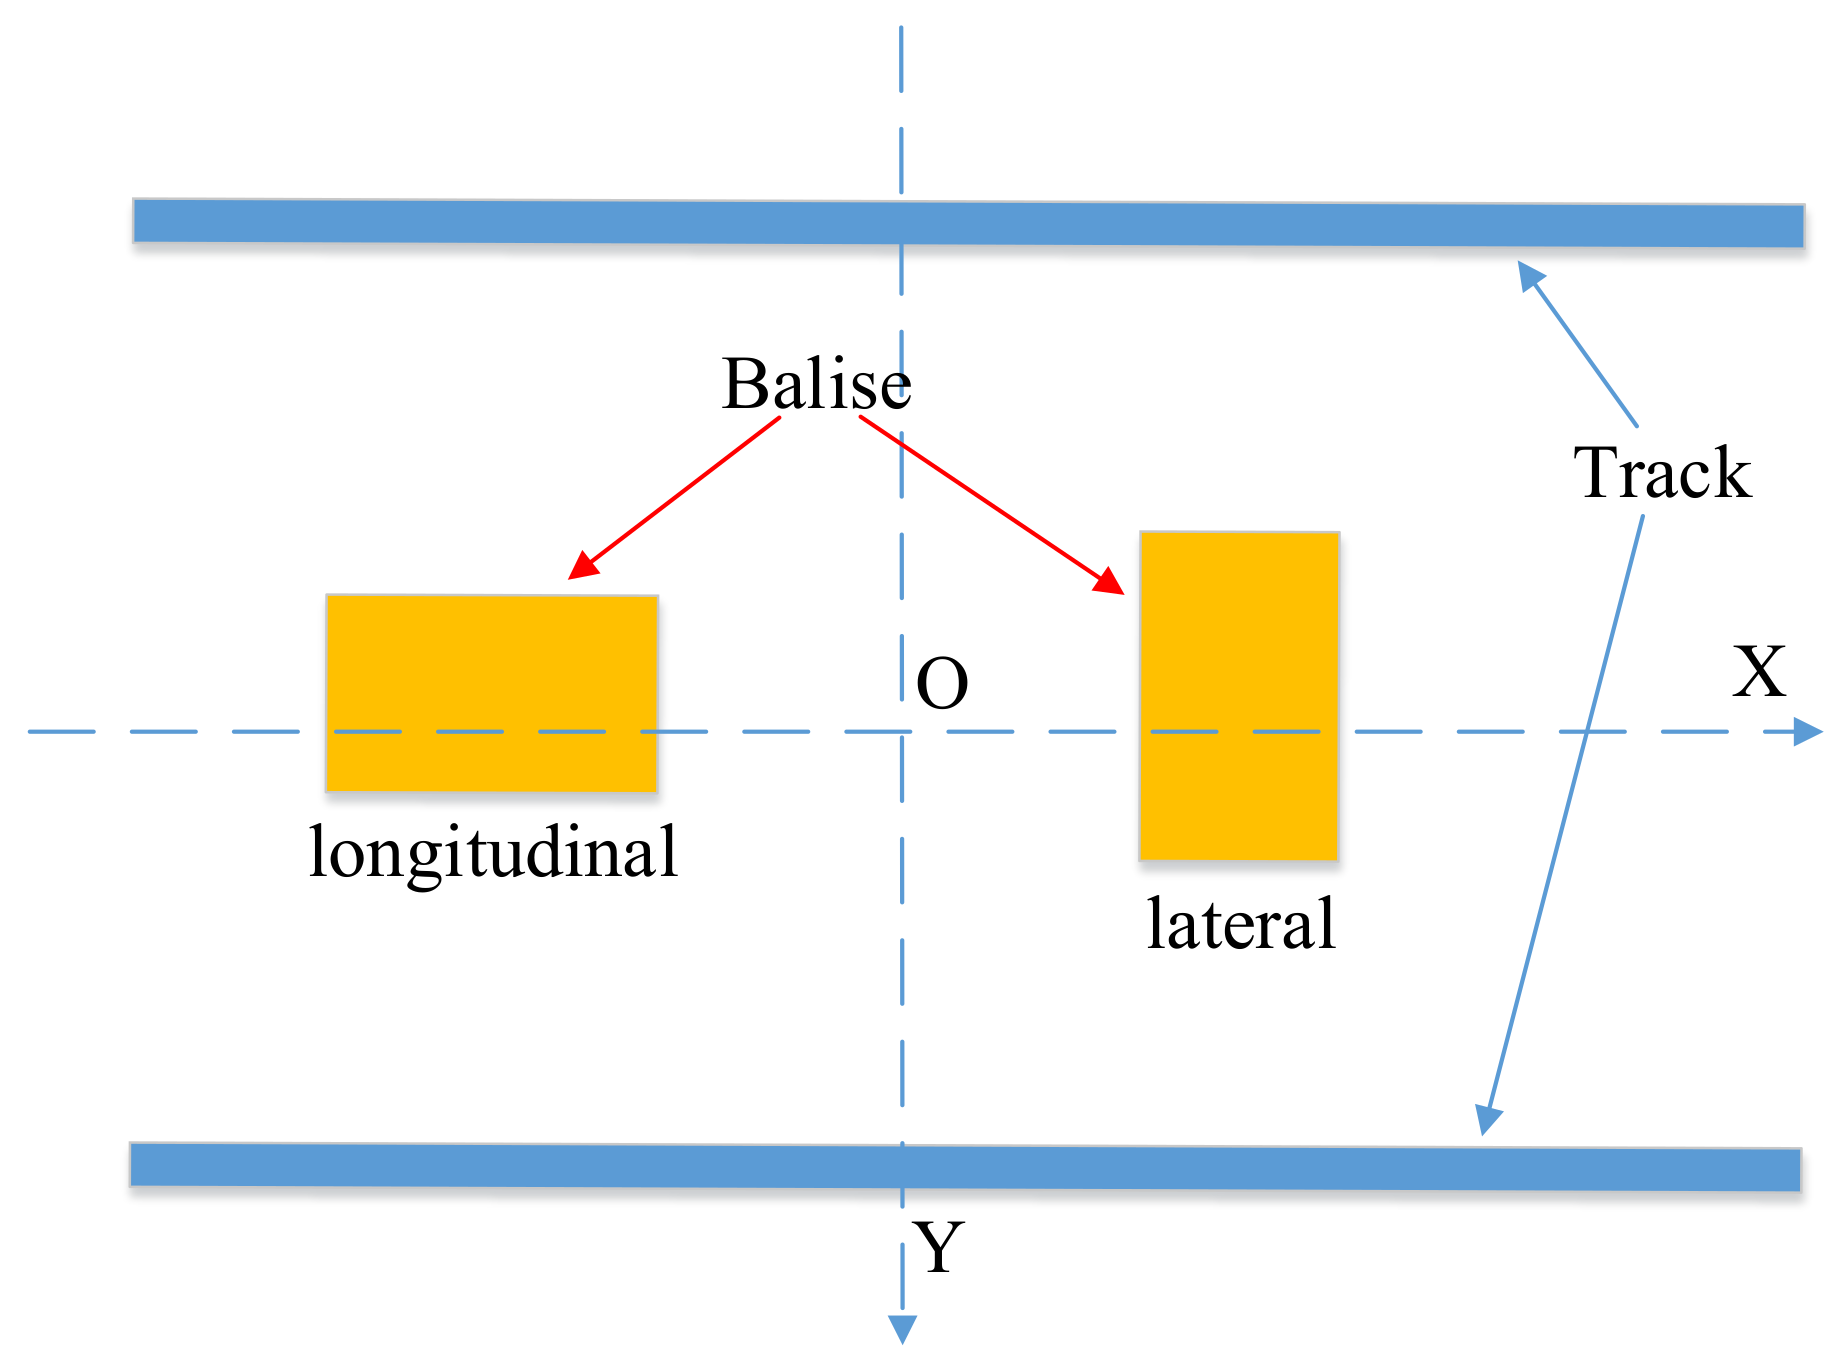
Table 5 shows the definition of installation type of the OAU and the balise. The lateral means that the long side of the OAU or balise is consistent with the
X-axis direction. The longitudinal means that the short side of the OAU or balise is consistent with the
Y-axis direction.
Figure 16 shows the corresponding layout of the balise.
For the onboard receiving antenna, the uplink transmitting current of the passive balise be calculated by (20). All parameters in
Table 4 can be calculated according to (14).
Figure 17,
Figure 18,
Figure 19,
Figure 20,
Figure 21 and
Figure 22 show the variation of the signal power at the onboard receiving antenna terminal with the longitudinal displacement of the antenna under different BTS parameters.
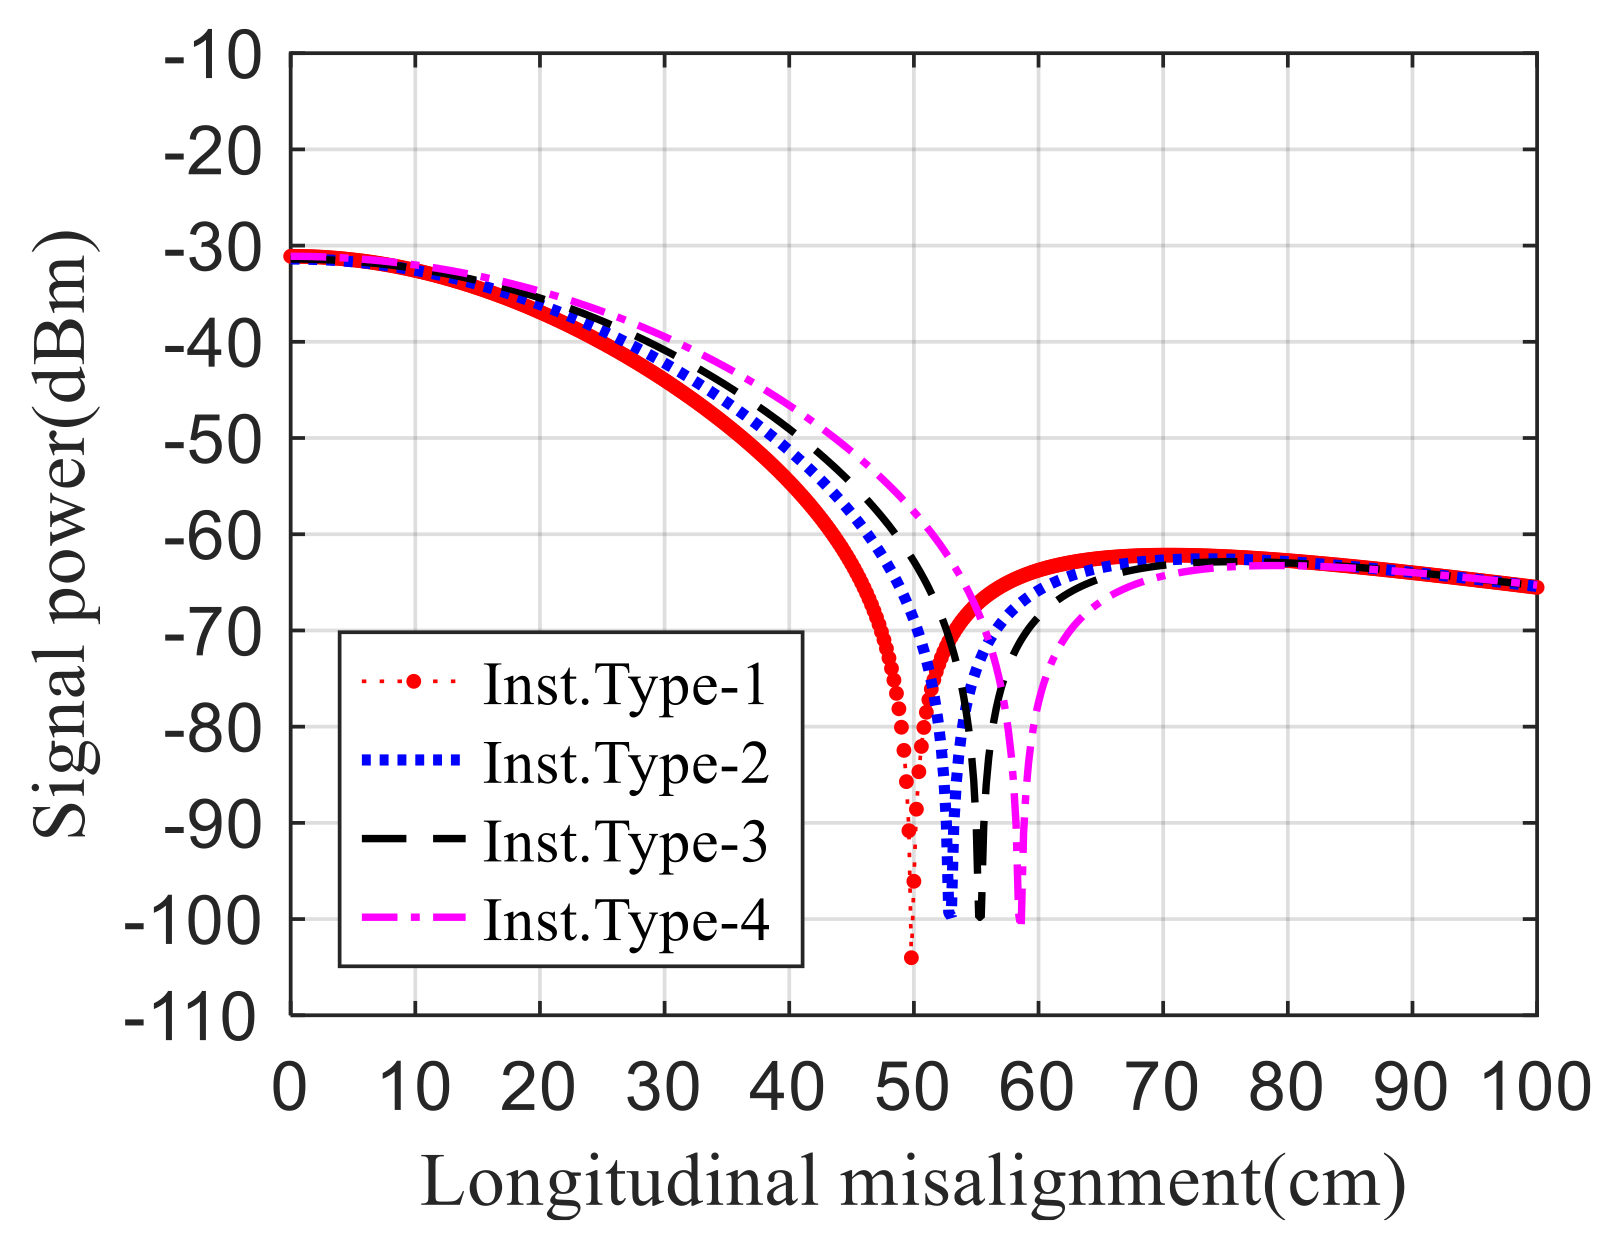
The influence of the lateral or longitudinal installation of the rectangular OAU and balise on the uplink received signal power is shown in
Figure 17. Since the signal power at the onboard receiving antenna terminal is symmetrical along the OX axis, we only needed to plot the curve of the positive half of the OX axis.
The lateral or longitudinal installation of the rectangular OAU and balise had little effect on the main lobe and side lobe peak power of the received signal. However, the null distance was obviously related to the installation of these antennas. When the OAU and balise were installed longitudinal, the null distance was 88 mm longer than the null distance when these antennas were installed lateral. Therefore, when both the OAU and the balise were installed longitudinally, the width of the main lobe of the displacement–power curve was the widest. This meant that under the same dynamic contact distance, the attenuation of the received signal power with the longitudinal displacement of the antenna was the least in this installation mode. The intensity and reliability of the received signal could be better guaranteed.
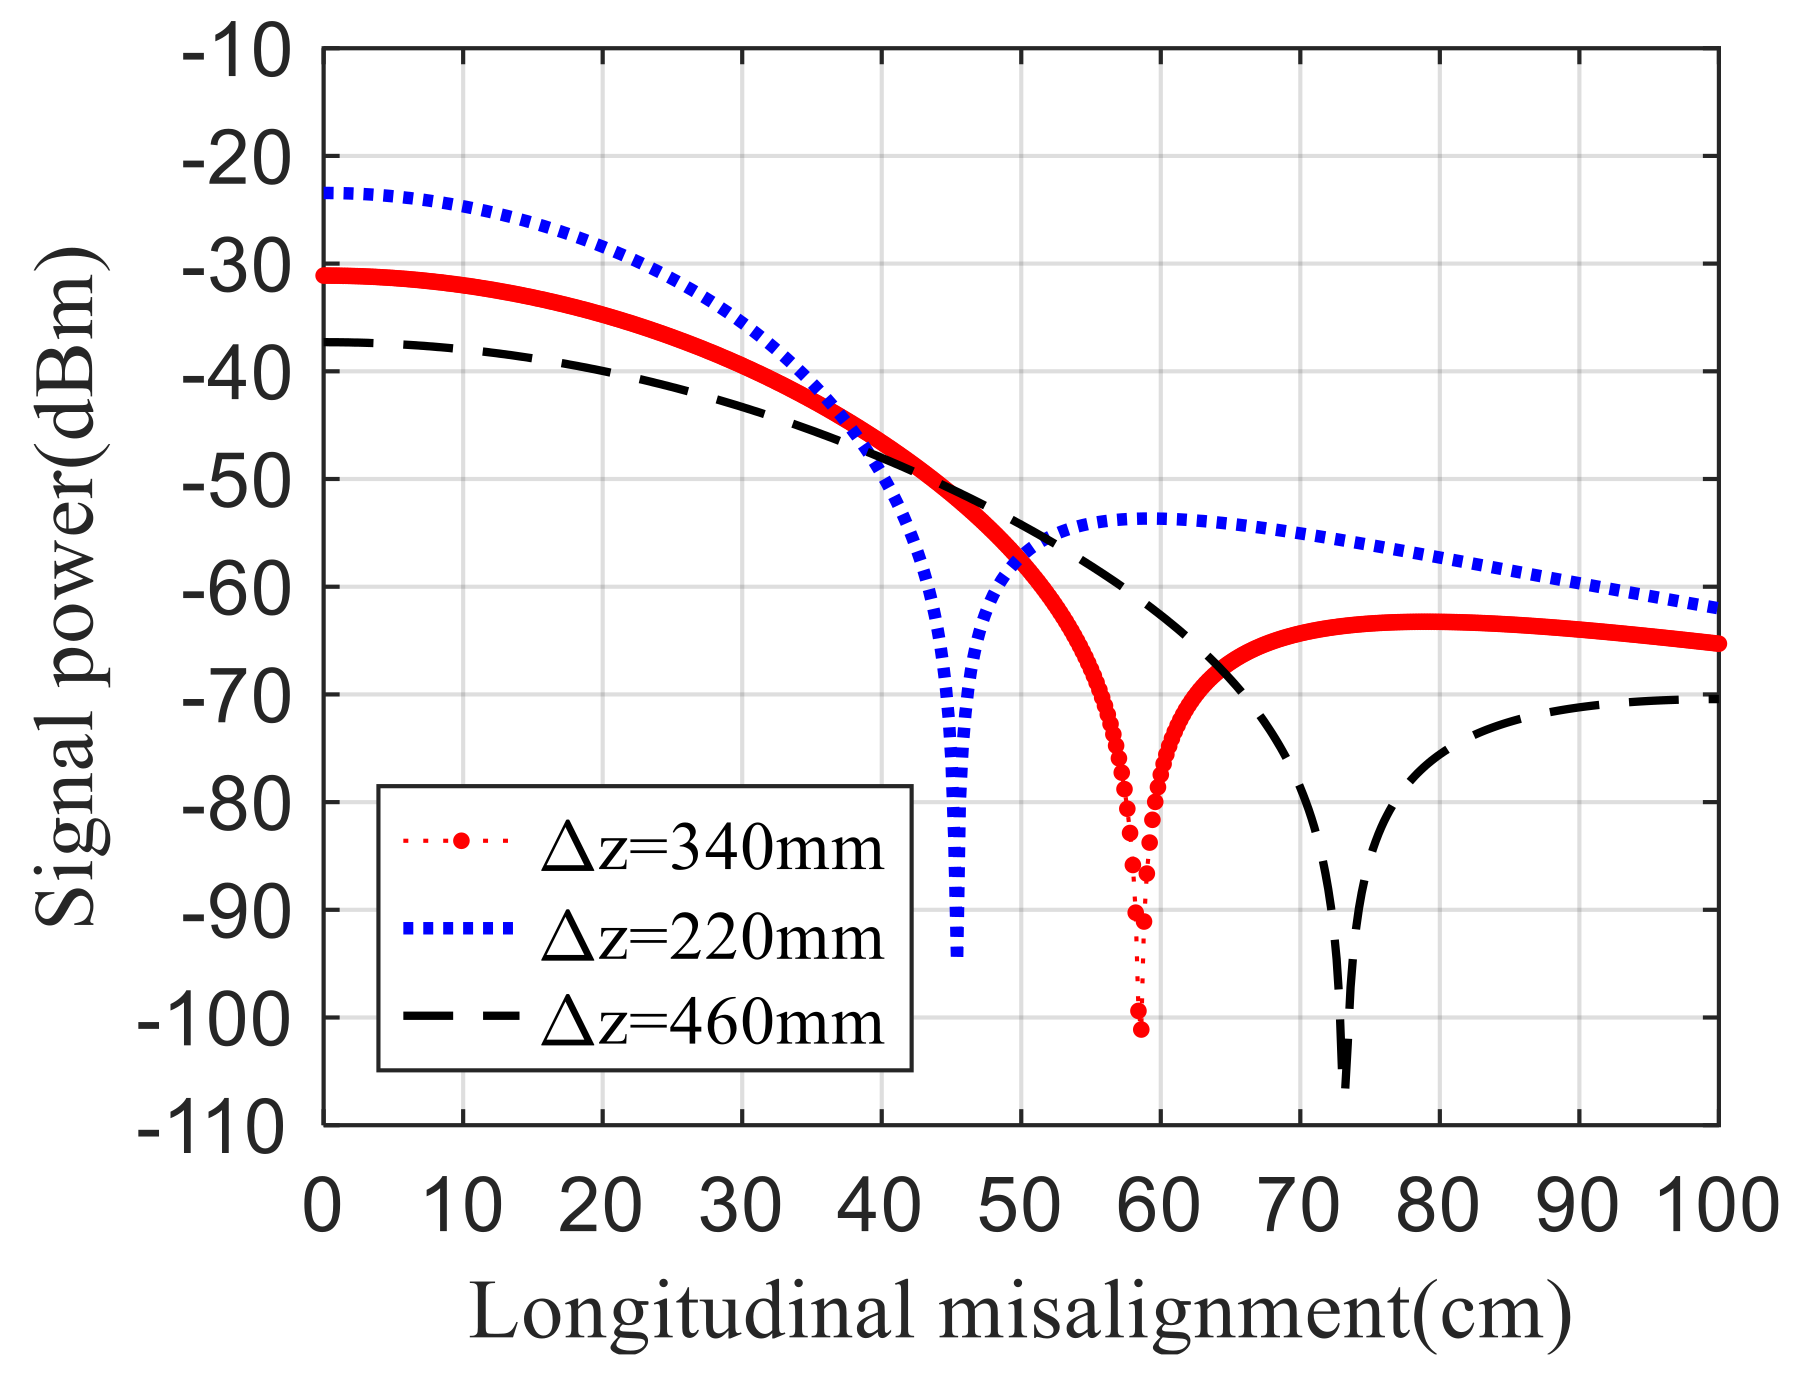
Figure 18 shows the effect of the vertical distance between the OAU and the balise on the uplink received signal power. The closer the vertical distance between the OAU and the balise, the narrower the main lobe width of the displacement–power curve, but the larger the peak power of the main lobe and the side lobe. Within the allowable range of the functional specification, the uplink received signal power with the minimum vertical distance was 13.85 db higher than that with the maximum vertical distance. However, the null distance was 278 mm smaller. Therefore, many factors should be considered in setting the vertical distance between these antennas.
The influence of the lateral deviation of the OAU on the uplink signal power is discussed in
Figure 19. According to the engineering experience, the lateral deviation between the OAU and the balise allowed by the manufacturer was generally within 100 mm. The lateral deviation of the antennas did not affect the envelope shape of the displacement-power curve in these ranges. During the lateral shift from 0 to 100 mm, the signal power at each point of the curve along the OX axis decreased by about 1.5 dB. When the lateral deviation was increased to 150 mm, the signal power decreased by about 3.2 dB.
The influence of the uplink transmitting current of the active balise on the uplink received signal power is discussed in
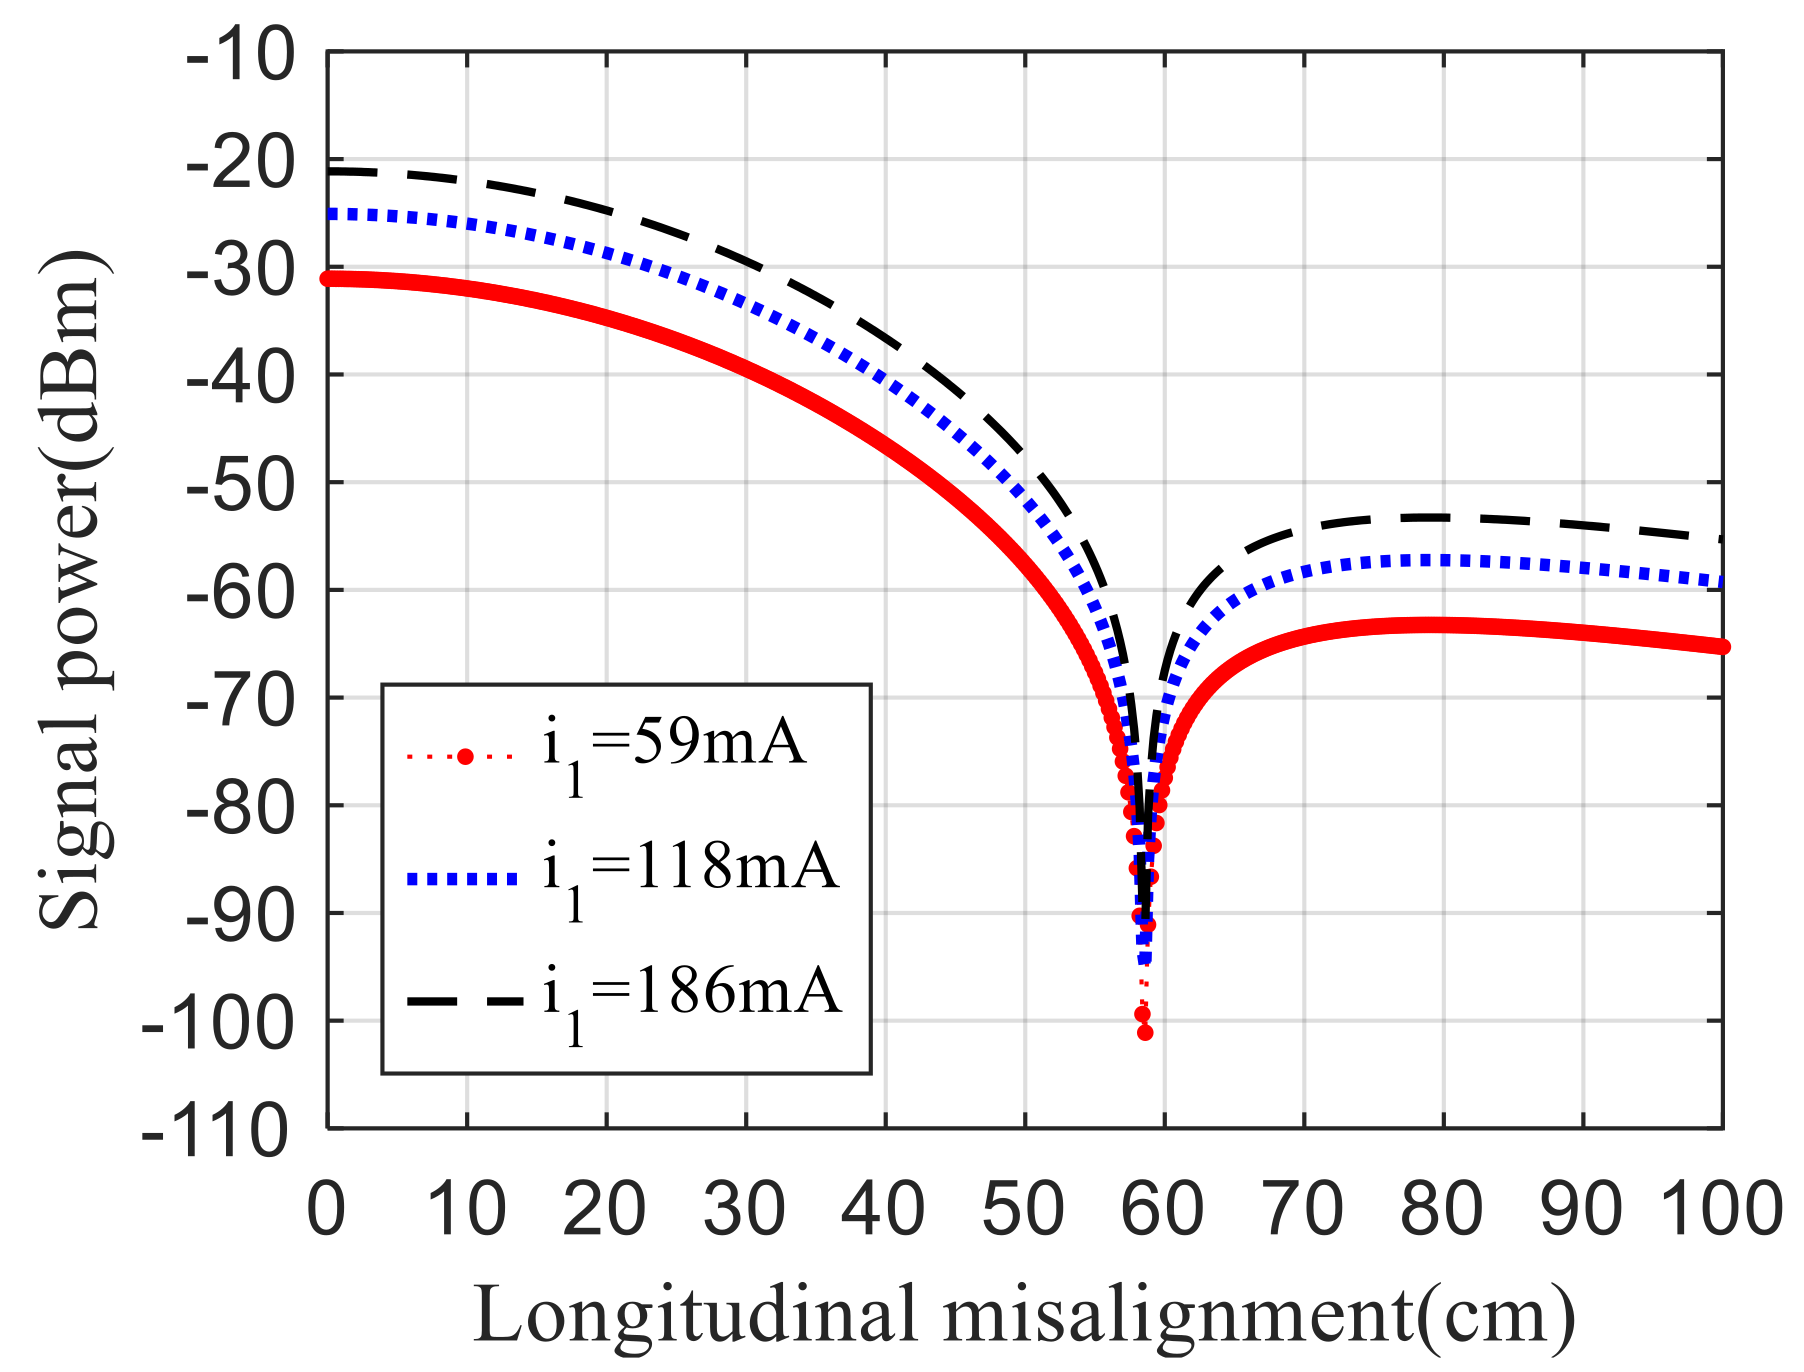
Figure 20. When the transmitting current on the balise remained constant throughout the uplink signal transmission, the magnitude of the transmitting current did not change the envelopment shape of the displacement–power curve, but was only proportional to the power of the curve at each point along the OX axis.
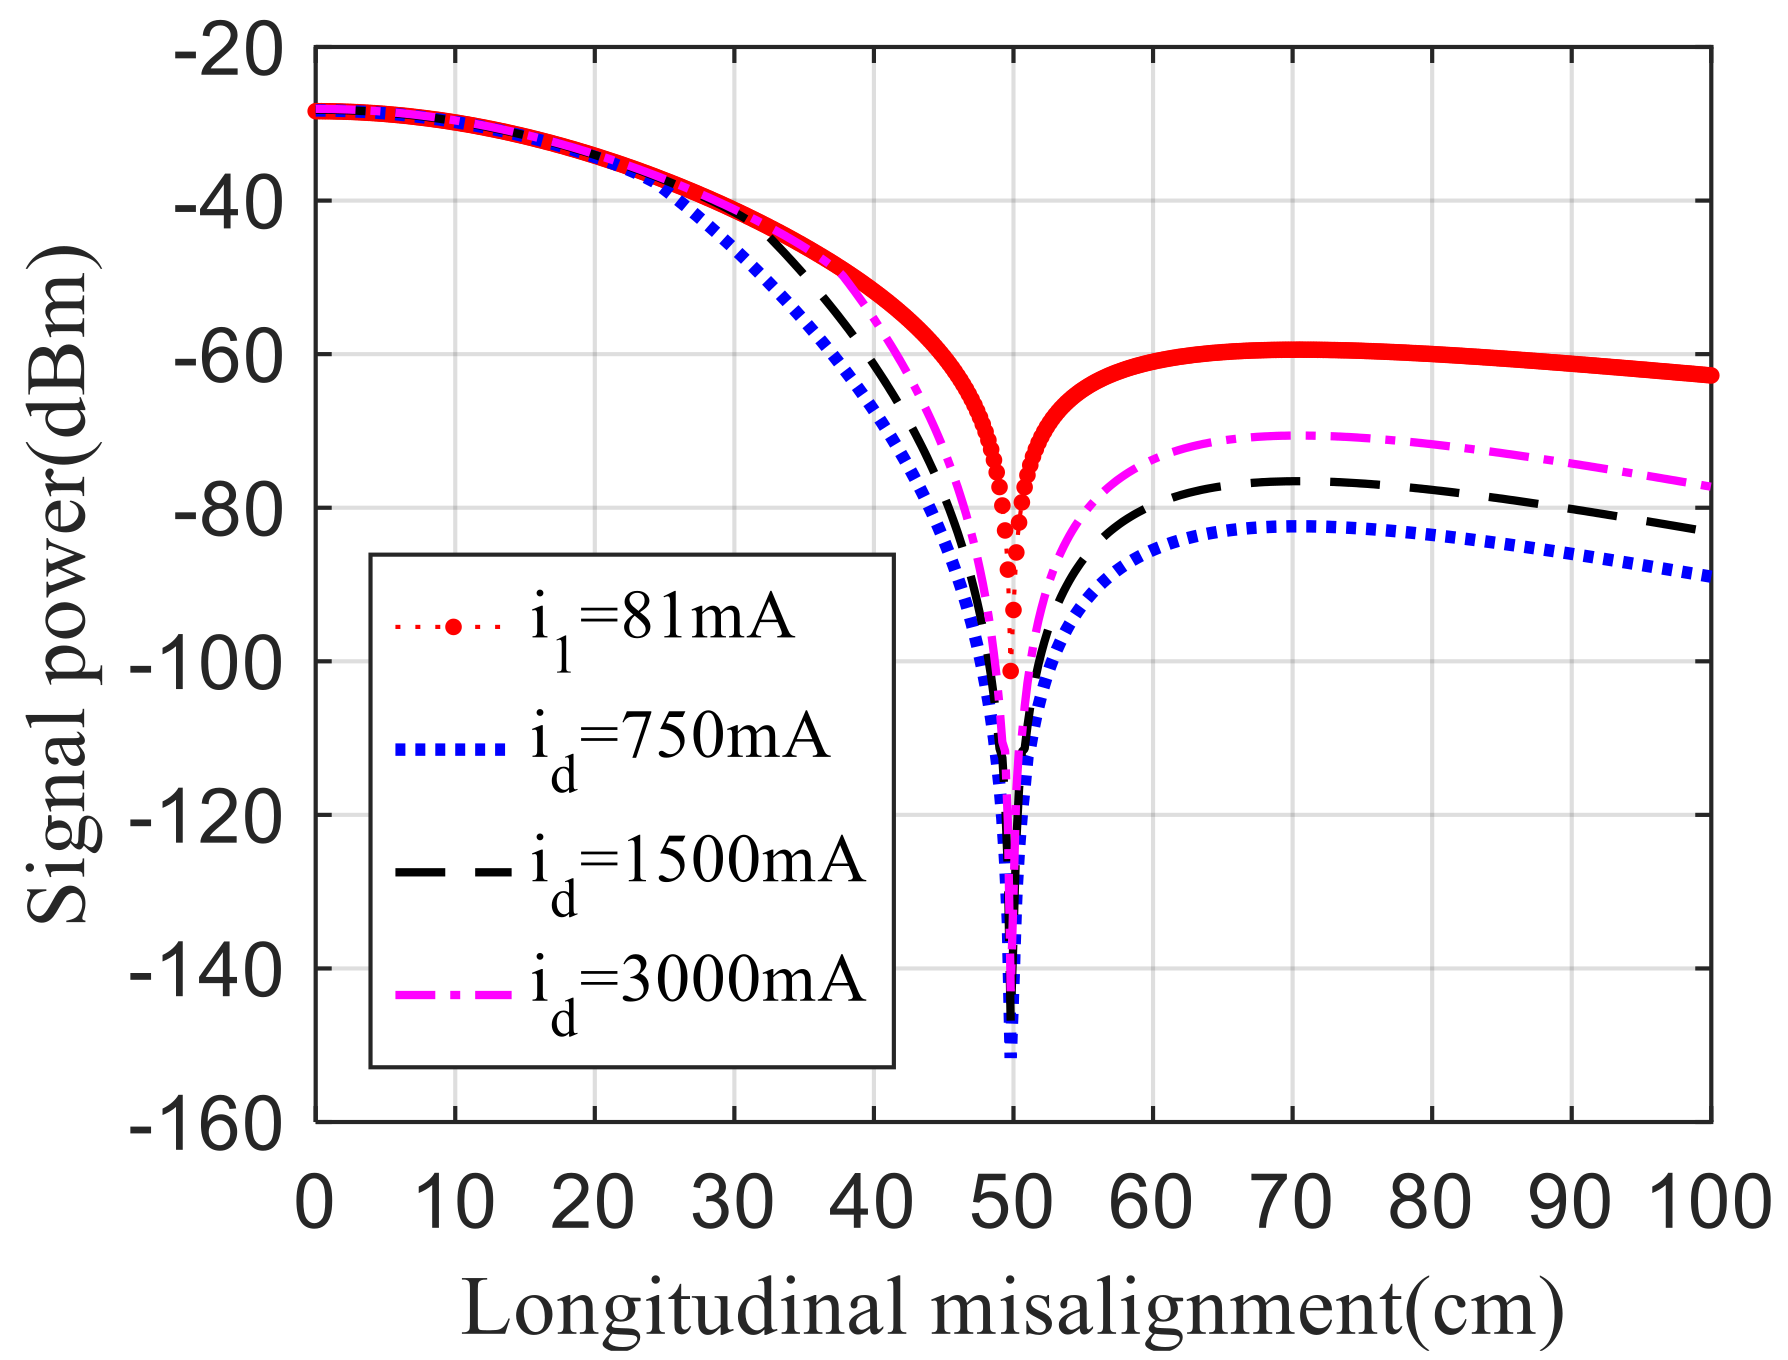
Figure 21 shows the effect of the current intensity of the 27 MHz tele-powering signal on the uplink received signal in the system composed of the OAU and passive balise.
represents the displacement–power curve of the uplink received signal of the BTS composed of active balise, and the uplink transmitting current intensity of the balise was set to the current intensity when the passive balise represented by (20) reached a stable working state. According to the requirements for tele-powering field conformity test in the specification, the current intensities of 27 MHz tele-powering signals were all within the allowable range. The results in
Figure 21 show that these four curves had the same value of main lobe peak power. However, the side lobe peak power in the active balise mode was the largest. The side lobe peak power in the passive balise mode decreased with the decrease of the 27 MHz tele-powering current intensity.
In
Figure 17, the influence of installation mode on the uplink received signal is discussed in the system composed of active balise and OAU. Compared with
Figure 17,
Figure 22 replaces the active balise with the passive balise, and other parameters are the same as those in
Figure 17. By comparing
Figure 17 and
Figure 22, it can be seen that the difference between passive and active balises in the received signal power caused by the installation mode is not obvious, and the curve envelope in the main lobe zone is very similar. However, under the passive balise condition, the signal power of the side lobe zone was significantly reduced, which was consistent with the analysis in
Figure 21.
6. Discussion and Conclusions
In this study, a DT model to quantitative analyze the electromagnetic coupling characteristics of BTS was established. The sensitive factors of the electromagnetic coupling characteristics were analyzed by using fishbone diagram method, and the suitable models for three important links in the electromagnetic coupling process were established according to the analysis results. By fusing these sub-models, a DT model of the electromagnetic coupling process of BTS was obtained. The designed two experiments proved that the proposed model had sufficient accuracy and could be used for the quantitative analysis of the main sensitive parameters involved in the electromagnetic coupling process.
The contribution of this article was twofold. First, the DT model established in this paper could accurately predict the electromagnetic coupling characteristics of the BTS. Traditionally, the electromagnetic coupling characteristics of the BTS are not clear until the uplink field conformity and the tele-powering field conformity measurements have finished. In the process of research and development of onboard equipment, the impact of the size structure of the OAU and the components of the matching circuit on the test results are more dependent on the experience of the engineers. This leads to a high cost of trial-and-error. According to the DT model proposed in this paper, how the selection of some key parameters and the matching of these parameters affect the electromagnetic coupling characteristics of BTS can be calculated directly, which helps to reduce the time and capital cost of new equipment development. Second, the influence of some parameters on the electromagnetic coupling process was quantitatively analyzed. This is not only an important basis for quantitative analysis of the information transmission reliability of the BTS, but also helps manufacturers and operators adjust their strategies to obtain better information transmission quality.
However, the entire BTS model has not yet been established. The DT model developed in this paper cannot predict whether the telegram signal can be received properly when the BTS is subjected to electromagnetic disturbance. If we can attain the digital twin model of the entire BTS, it would be possible to solve the problems on electromagnetic susceptibility and reliability of the BTS, which are very important but difficult to be analyzed by conventional methods. The authors’ next work is to build such a system level digital twin model.
In addition, the study in this paper ignored the situation where the balise surface was covered by foreign objects such as rain, snow, hail, and debris, which may occur under some severe weather conditions in reality. When these conditions occur, the uplink signal transmission performance is bound to be lost, which cannot be evaluated by the DT model established in this paper. These issues still need further study.


