Article

Fuzzy Logic Approach for Maximum Power Point Tracking Implemented in a Real Time Photovoltaic System

System Engineering and Automation Deparment, Faculty of Engineering of Vitoria-Gasteiz, Basque Country University (UPV/EHU), 01006 Vitoria-Gasteiz, Spain
*
Author to whom correspondence should be addressed.
Appl. Sci. 2021, 11(13), 5927; https://doi.org/10.3390/app11135927
Submission received: 10 June 2021 / Revised: 23 June 2021 / Accepted: 23 June 2021 / Published: 25 June 2021
(This article belongs to the Special Issue Applications of Fuzzy Optimization)

Abstract

:
Photovoltaic (PV) panels are devices capable of converting solar energy to electrical without emissions generation, and can last for several years as there are no moving parts involved. The best performance can be achieved through maximum power point tracking (MPPT), which is challenging because it requires a sophisticated design, since the solar energy fluctuates throughout the day. The PV used in this research provided a low output voltage and, therefore, a boost-converter with a non-linear control law was implemented to reach a suitable end-used voltage. The main contribution of this research is a novel MPPT method based on a voltage reference estimator (VRE) combined with a fuzzy logic controller (FLC) in order to obtain the maximum power from the PV panel. This structure was implemented in a dSpace 1104 board for a commercial PV panel, PEIMAR SG340P. The scheme was compared with a conventional perturbation and observation (P&O) and with a sliding mode controller (SMC), where the outcomes demonstrated the superiority of the proposed advanced method.

1. Introduction

The increasing degree of pollution throughout the last decades made a change of direction in the policies of energy production, where renewables are preferred over the conventional ones. Actually, it an increment of 25% in the world energy consumption is expected for 2040, and the target is that clean ones can provide 40% of the whole production [1]. Researchers also forecast that solar PV panels could generate 15% of the global demand in 2050 [2].
Despite PV panels being highly dependent on sun irradiation (which fluctuates sufficiently depending on the geographical location), major advantages include the low maintenance and a large life-span service [3]. In several applications where a PV output voltage is unsuitable, DC–DC boost converters are used to step-up this variable, thus increasing the efficiency of the whole system. The voltage growth is carried out through a switching of electric circuits which indicates that the end-user voltage is dependent on a duty cycle [4]. The switching signal can be managed by a pulse-width-modulation (PWM) generator; this implies that a suitable control law can be designed with the target of maximizing the performance of the MPPT.
Linear strategies can be a suitable first option for MPPT control. Despite the conventionality of proportional–integral–derivative (PID) controllers, they have been widely used in PV power systems. For instance, the author of [5] produced a linear simulation of a DC–DC converter with a PV panel; despite the controller being achieved through classic Bode analysis, the results reported a reduction of overshoot and settling time. Likewise, an advanced linear quadratic regulator (LQR) has been developed for boost-converters [6]; although the measurement of the performance of this algorithm needs experimental validation, the simulation outcomes revealed increments in robustness in comparison with similar strategies. However, linear controllers produce certain issues for real boost converters due to inconsistencies such as the intrinsic non-minimum phase [7]. Additionally, there are nonlinearities, such as solar energy, that depend on everyday weather; panels have assorted voltage-current oscillations and boost converters have a discontinuous action due to the switching [8,9].
Nonlinear controllers are known not only for the performance improvement of boost converters but also for their practical implementation [
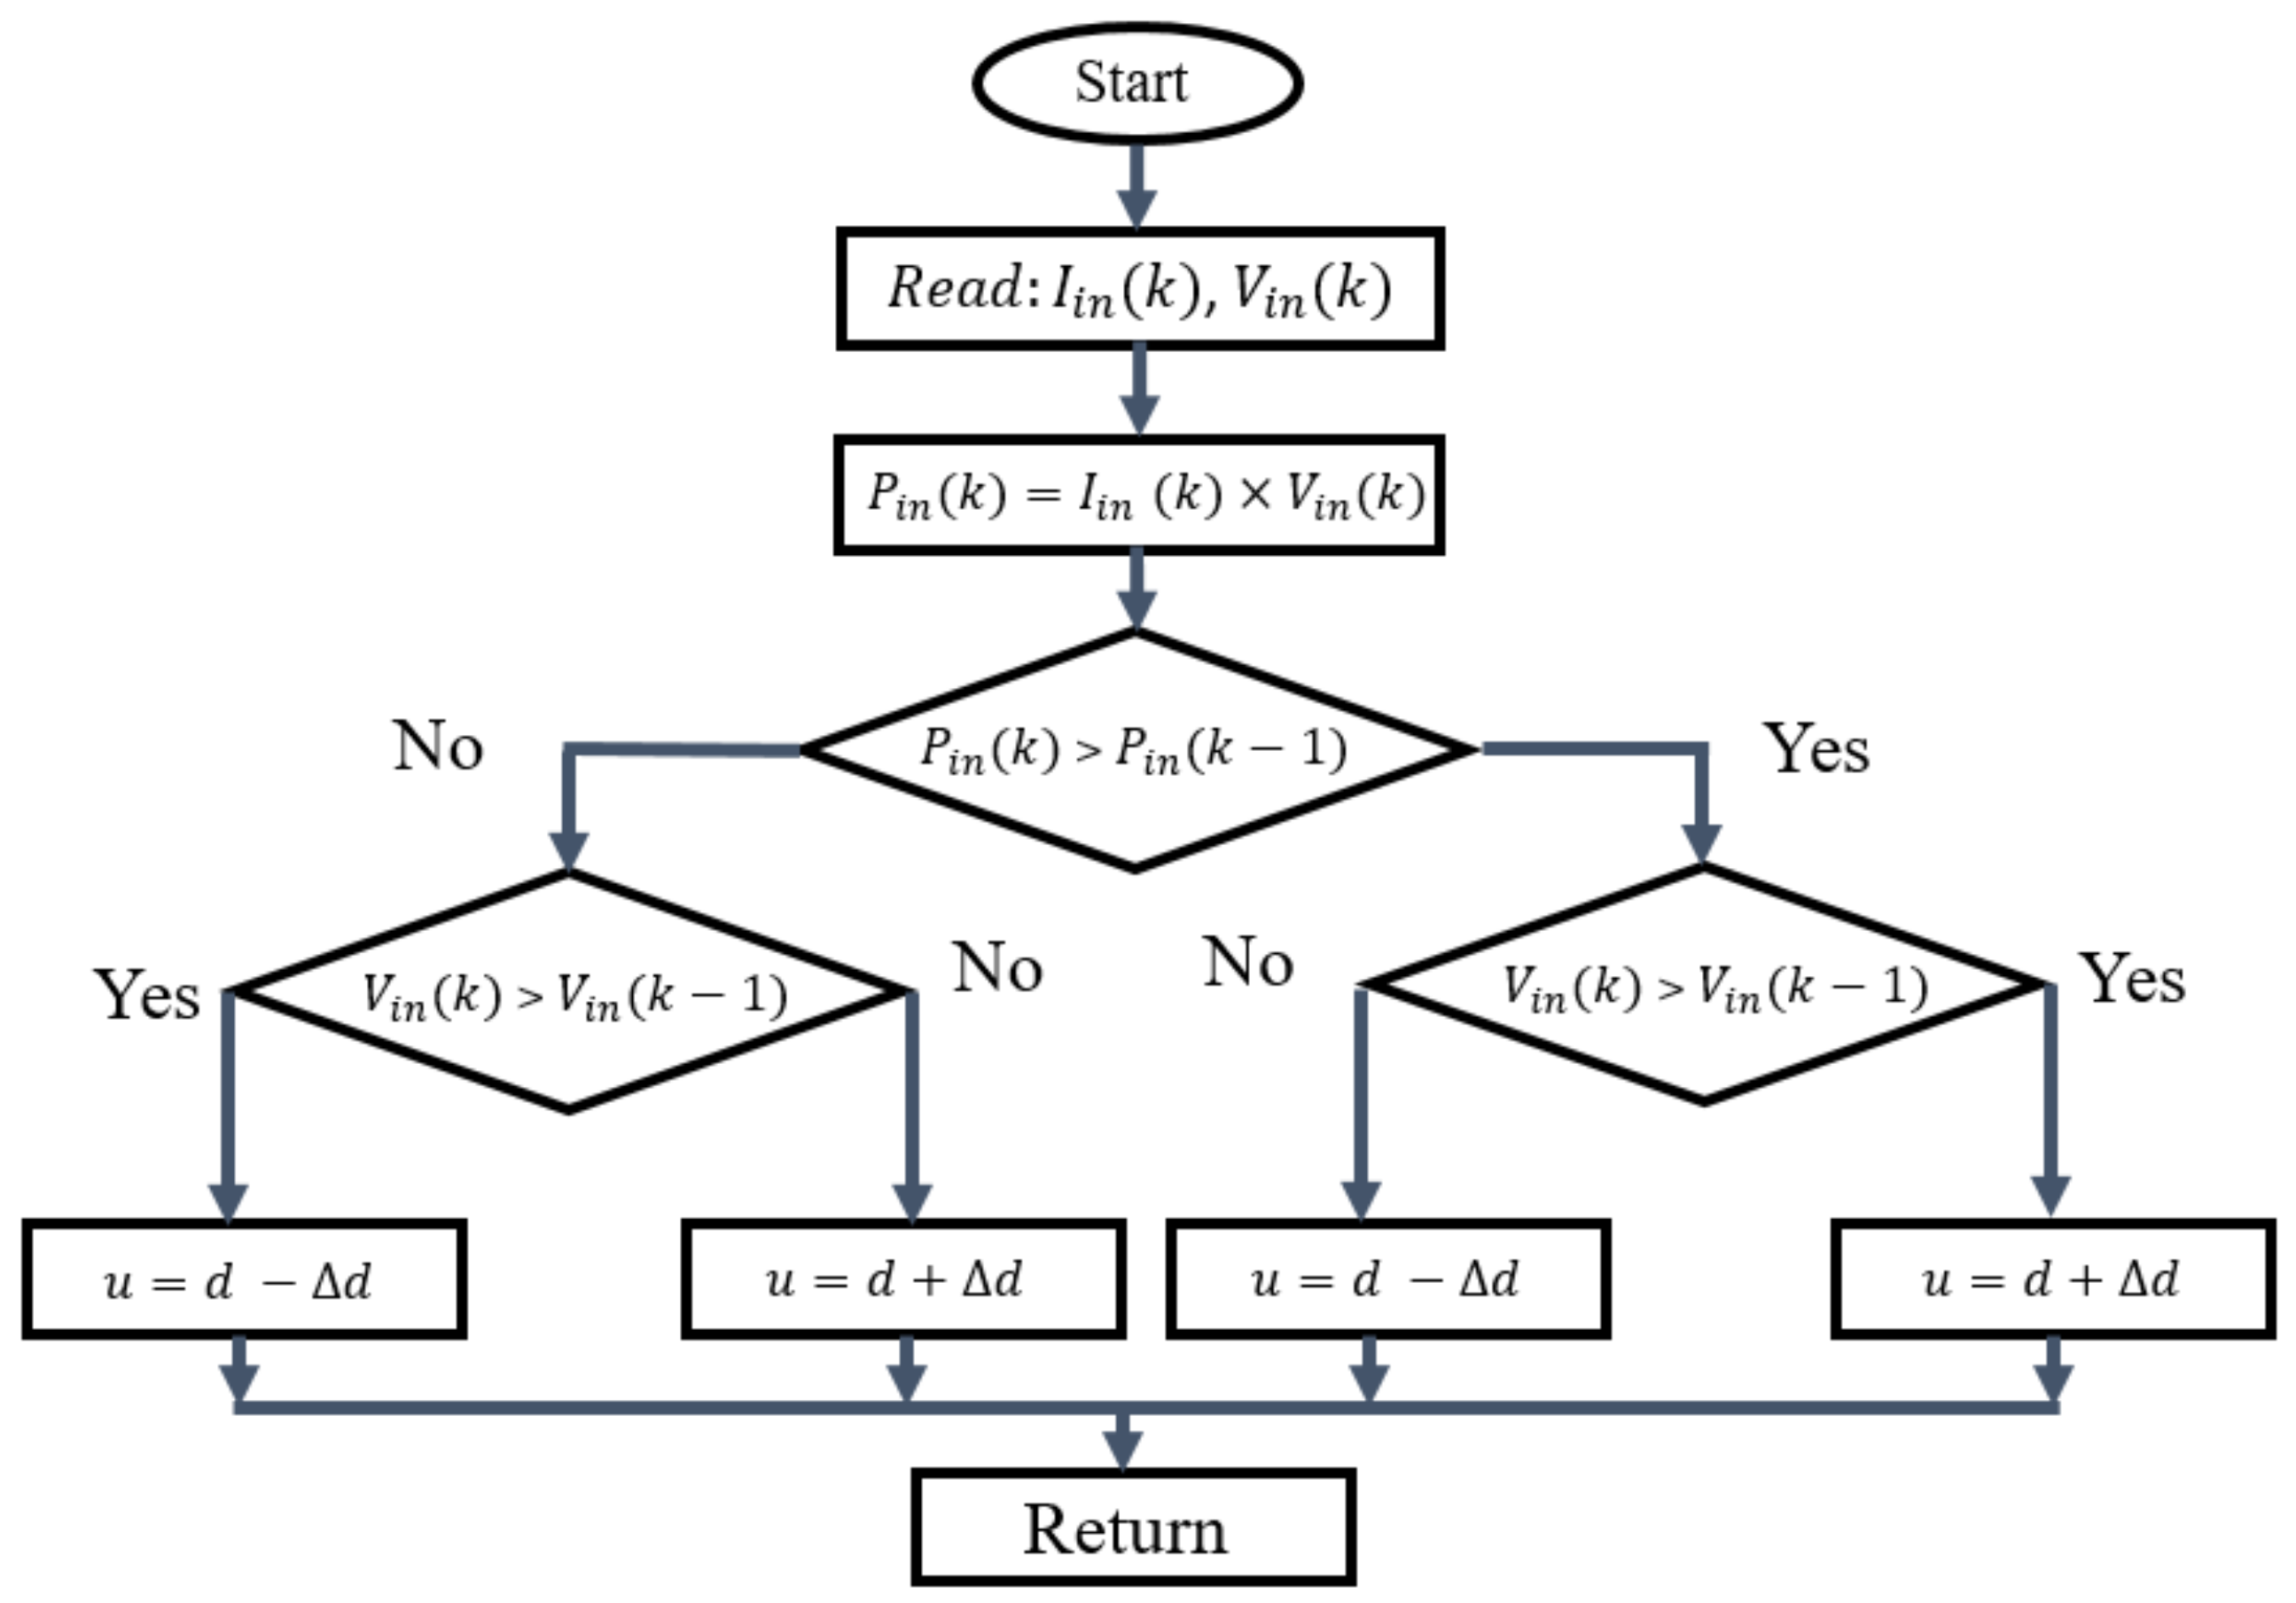
10]. The P&O algorithm is a reliable nonlinear algorithm for MPPT that compares previous power measurements to current ones to find the MPP, using the duty cycle as a variable [11]. In the field of PV panels, this algorithm has even been studied in advanced and complex systems, such as PVs in space applications, as the authors of [12] explained in their research. The combination of this algorithm with a solar tracker provided suitable results. Due to its properties, it has also been used in assorted renewable systems such as wave energy generators [13], PV based microgrids [14], wind generators [15], and so forth. Despite its robustness and practicality, the downsides of P&O are related to the generated perturbations or partial shadow cases, which can produce, respectively, oscillations around the MPP or fall to a local maximum, which produces a reduction in accuracy [16,17].
Another classic nonlinear structure is SMC, which not only enhances the dynamics of a system but also reduces the effects of disturbances and uncertainties [18]. For instance, Derbeli et al. [19] proposed SMC for a boost-converter used in a fuel cell. The outcomes showed that one of the primary disadvantages of these structures is the chattering, which causes extra energy consumption. Even though the chattering can be reduced by using high order sliding modes—which have been implemented in the past [20]—it is impossible to eliminate this phenomenon since there are always unmodeled dynamics involved with control digitalization [21]. Backstepping depicts another nonlinear structure, known for its robustness in terms of unmodeled dynamics and uncertainties, based on a Lyapunov approach by splitting the main system into subdivisions to achieve a suitable design [22]. In practical terms, backstepping has been implemented in a boost converter by the authors of [23], where the robustness and settling time have been improved; nevertheless, one of the main drawbacks of the backstepping is the complex design of the control law.
Another non-linear technique is FLC, a practical, ruled-based approach in which the configuration is dependent on the operator knowledge with regards to the main system [24,25]. FLC has been used in adaptive experimental DC–DC boost converters, where the inductor features changed to achieve high efficiencies and the outcomes showed significant enhancements [26]. In terms of PV, the research conducted by the authors of [27] was based on an analysis of the power forecast over a year, where they employed an adaptive neural fuzzy inference system and accurate results were achieved. Concerning MPPT for PV systems linked with boost converters, FLC was used by the authors of [28], where they showed that the outcomes developed a fast dynamic response and ensured the robustness. FLC has also been embedded for a PV battery system in a study based on an optimisation [29]; in this case, the state of charge and consumption were studied and the results revealed significant improvements.
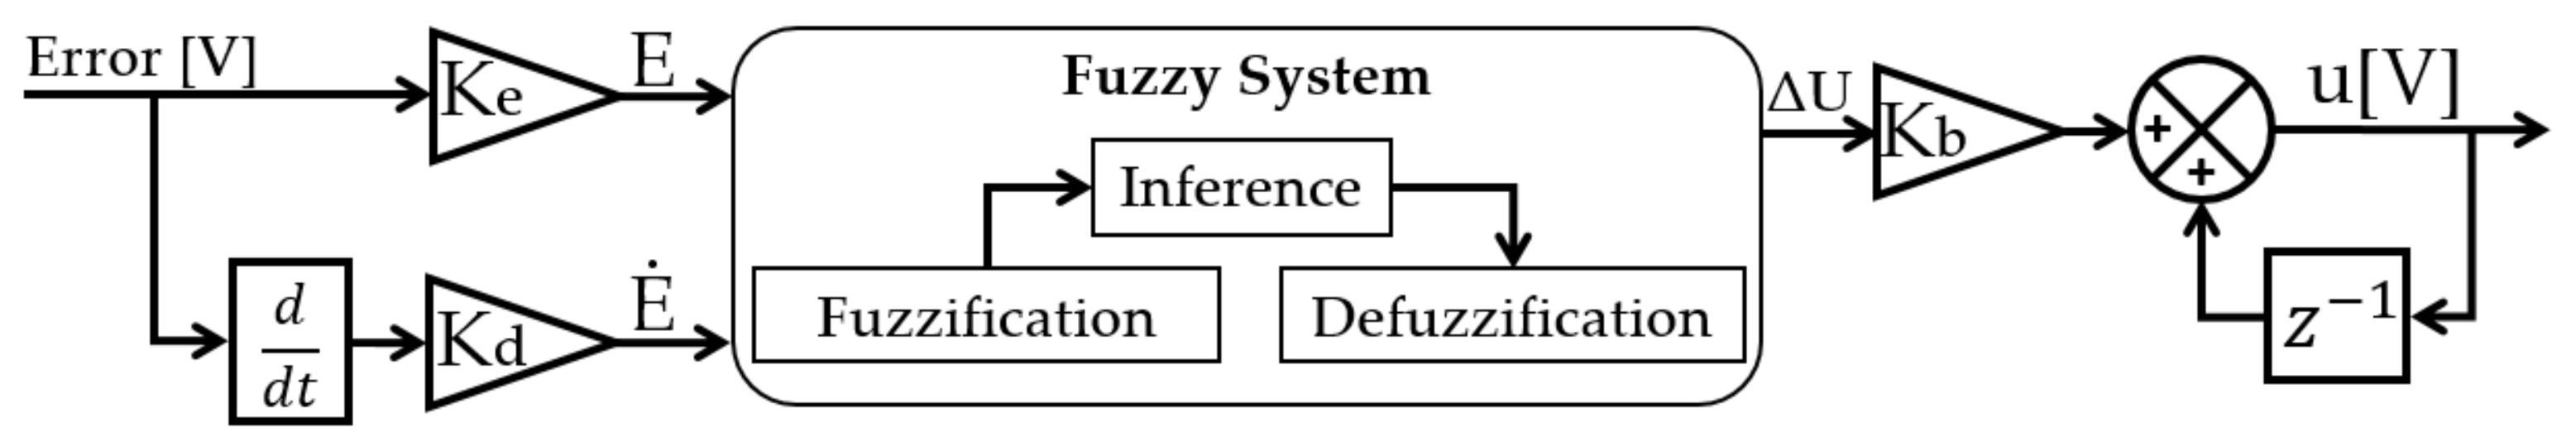
This research is focused on a type-1 FLC, which is known for its higher performance compared to conventional controllers due to its capability to manage uncertainties through rules [
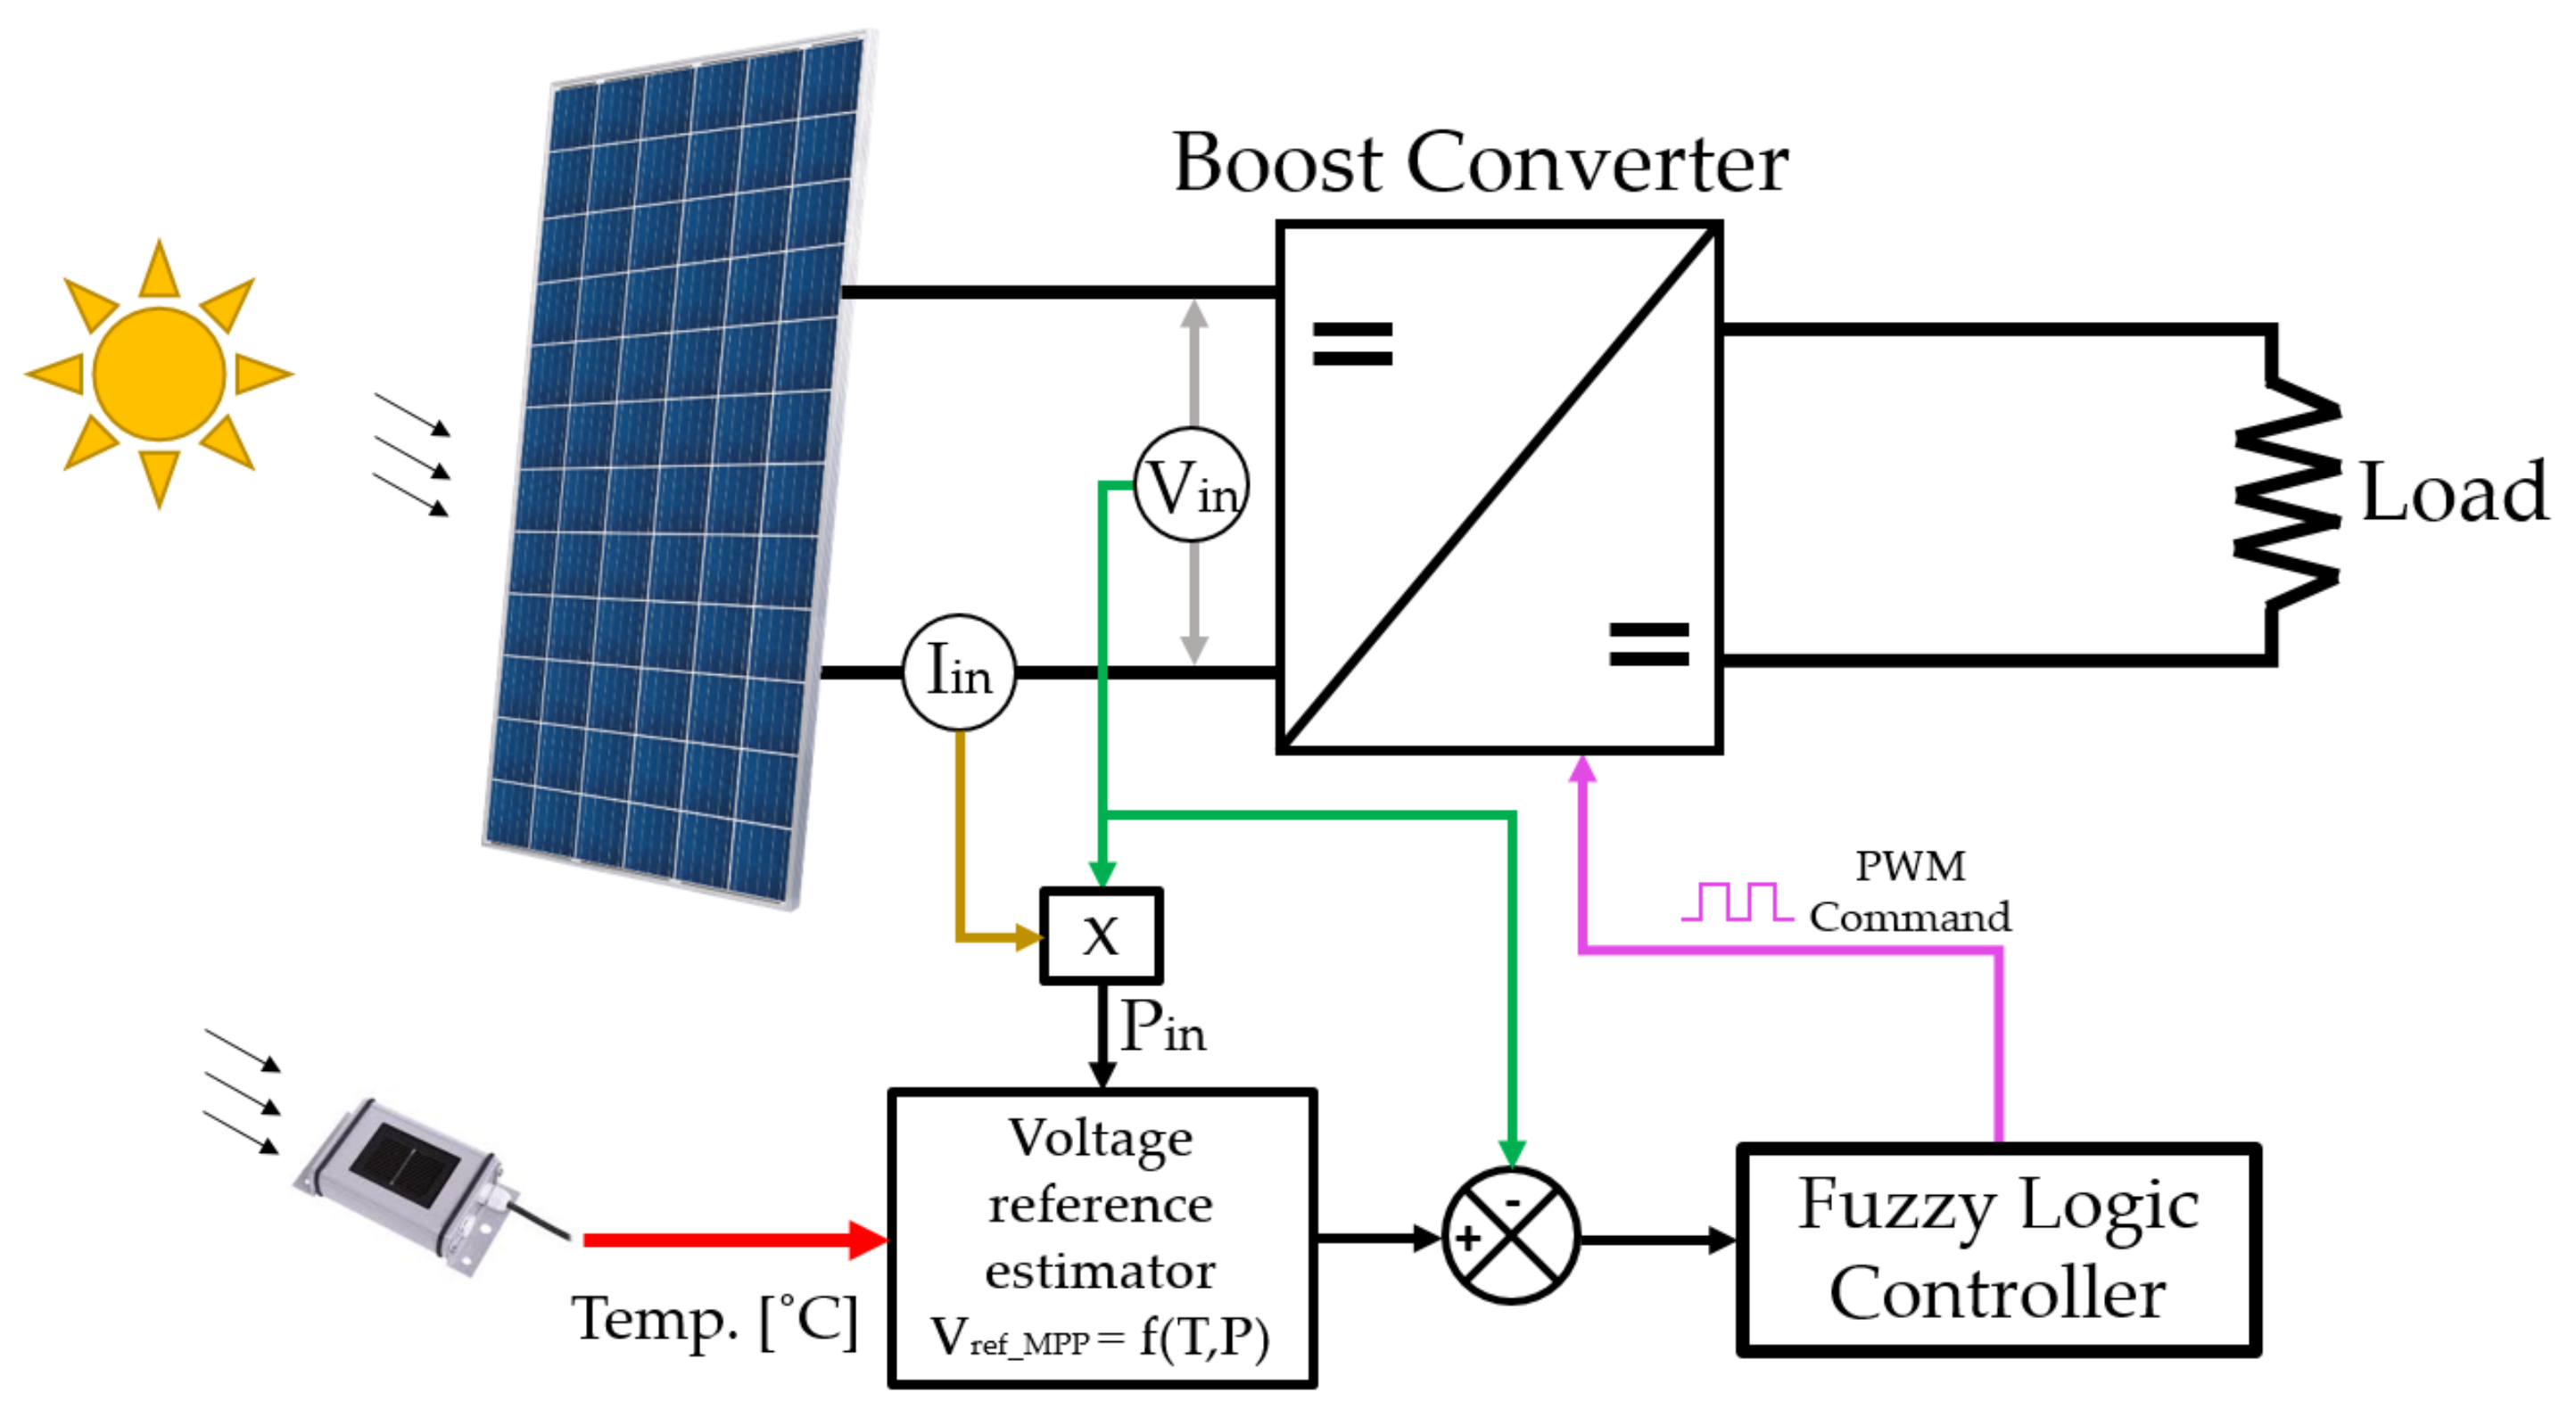
30,31]. A VRE was designed with real data from the PV panel and was assembled with a type-1 FLC, an error-based controller used for tracking. The first comparison was performed against a P&O, as it is commonly used for the comparison of new MPPT controllers [32,33]. The second contrast was executed with an SMC combined with the VRE to highlight the benefits of the proposed FLC. The drawbacks are related to sudden fluctuations around the maximum power point (MPP) due to sudden fluctuations in the irradiation or under partial shadowing conditions [33,34].
This research paper is structured as follows: 
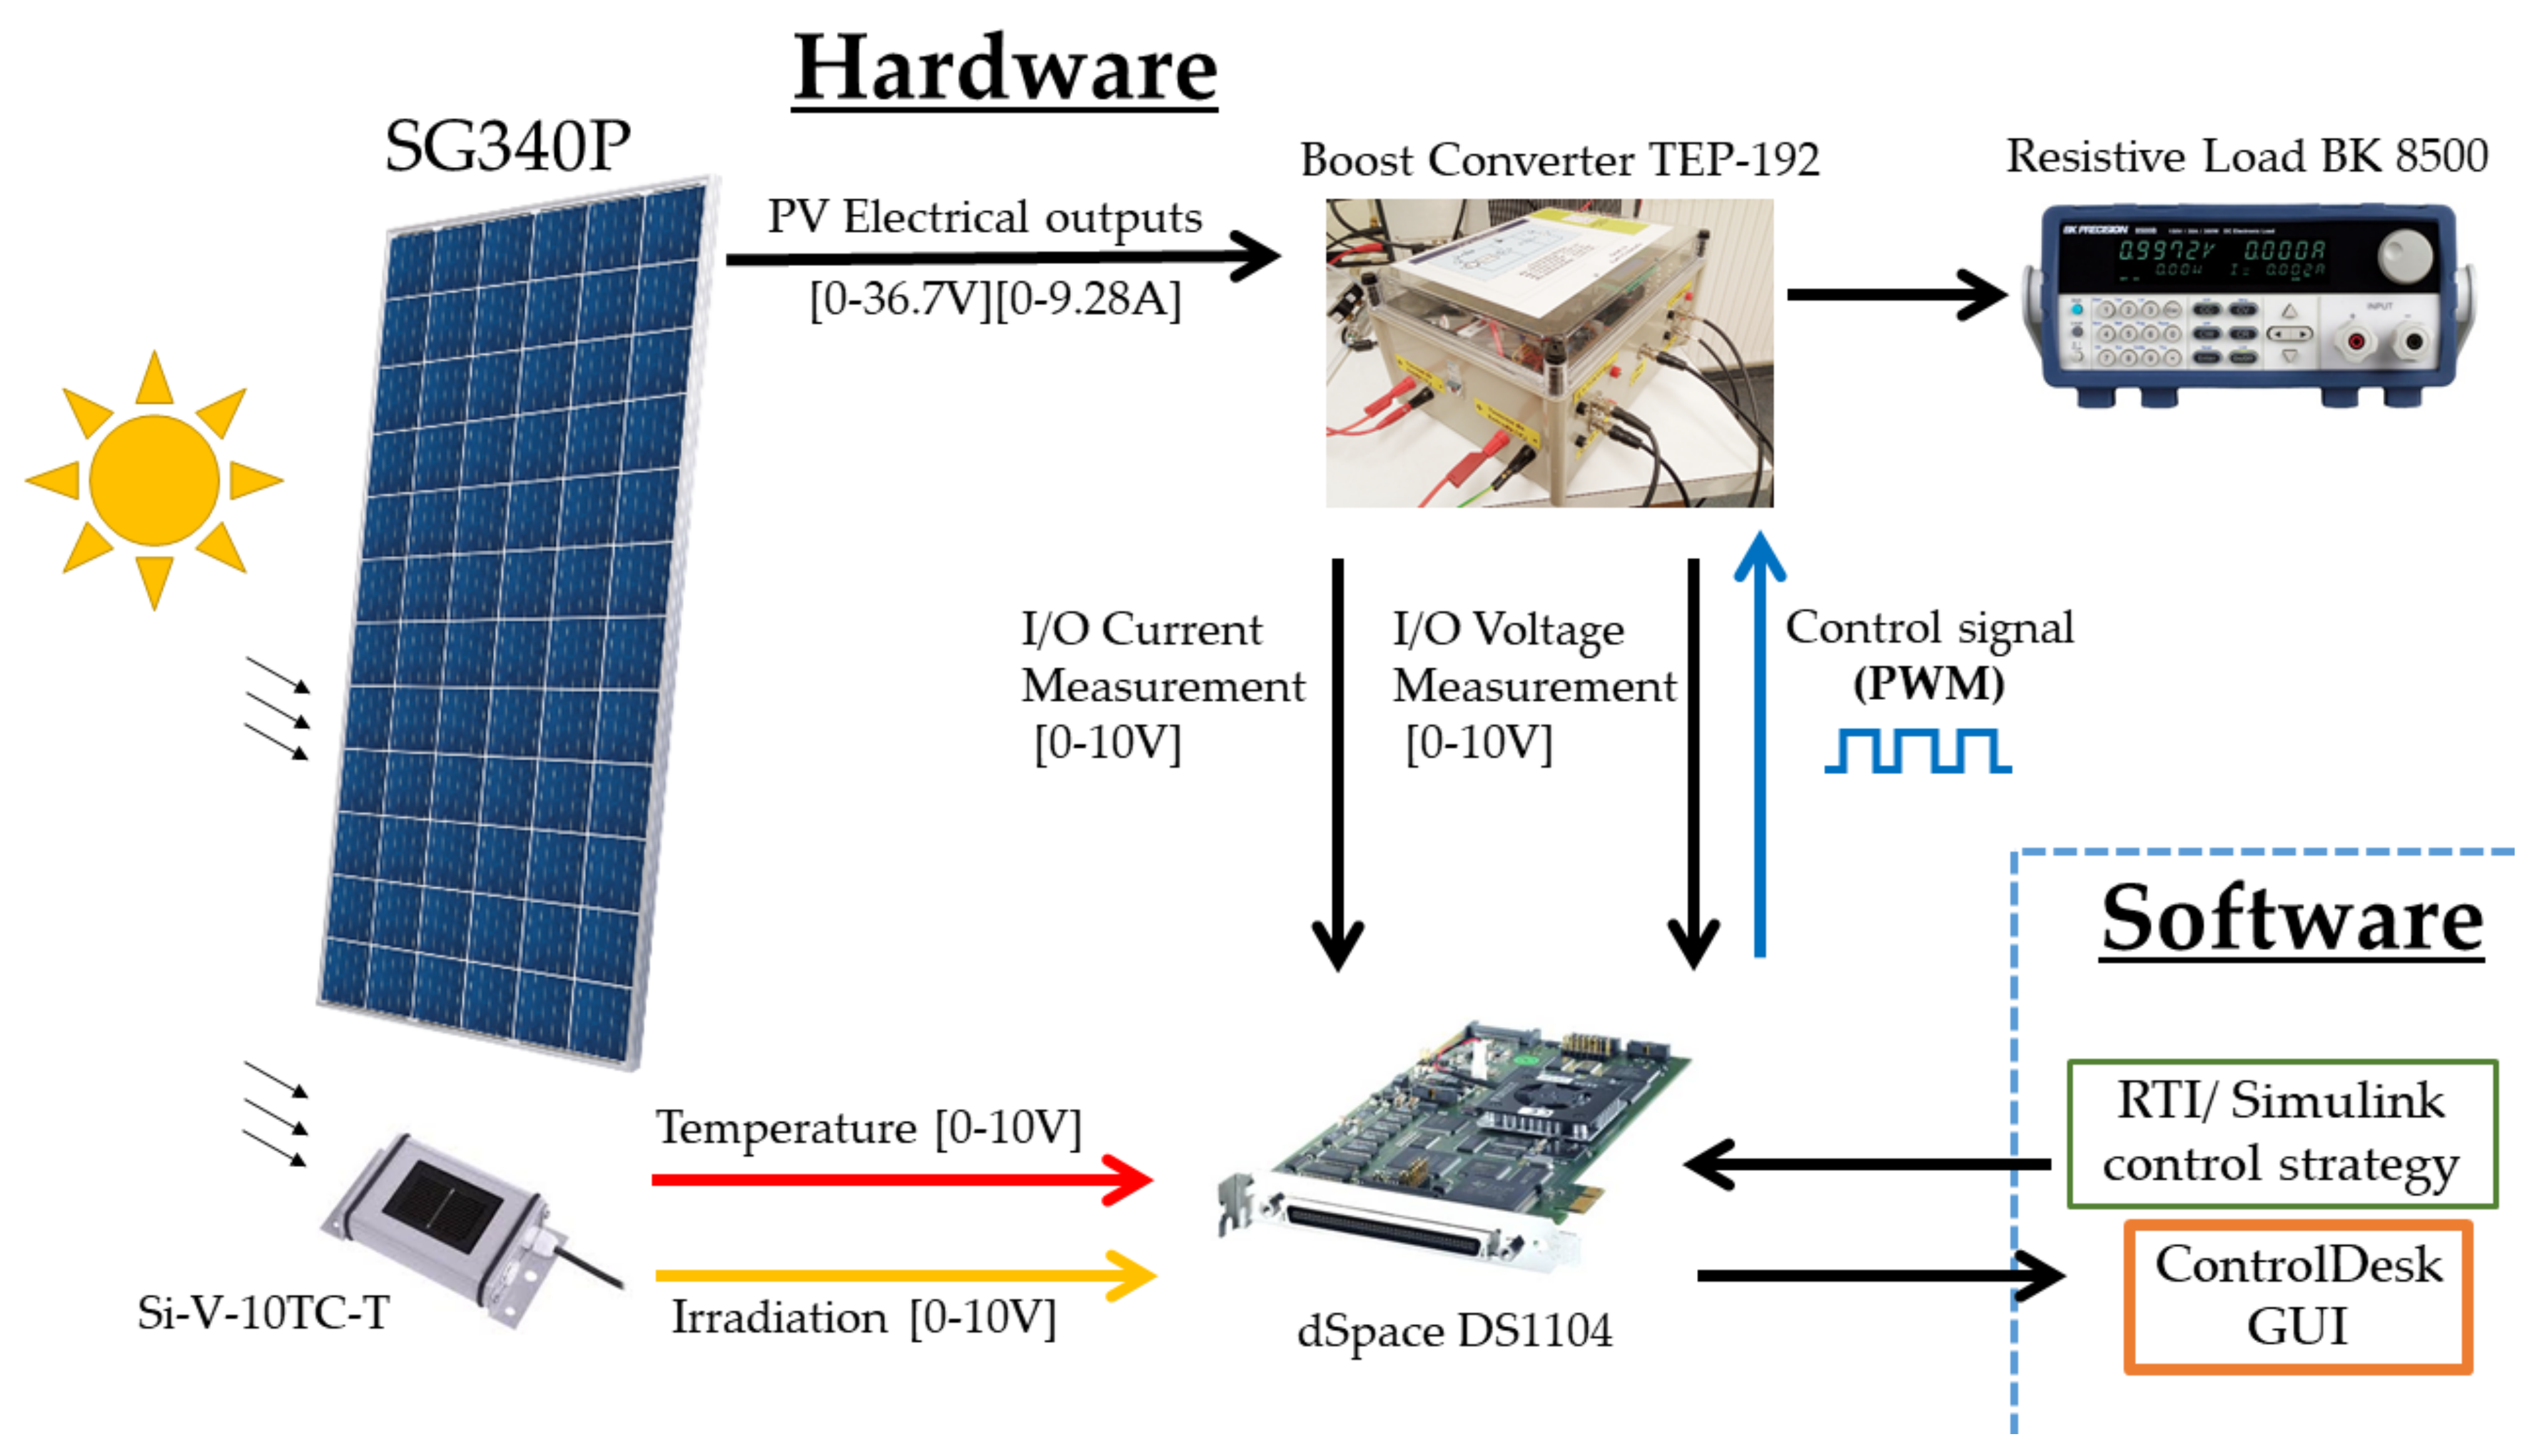
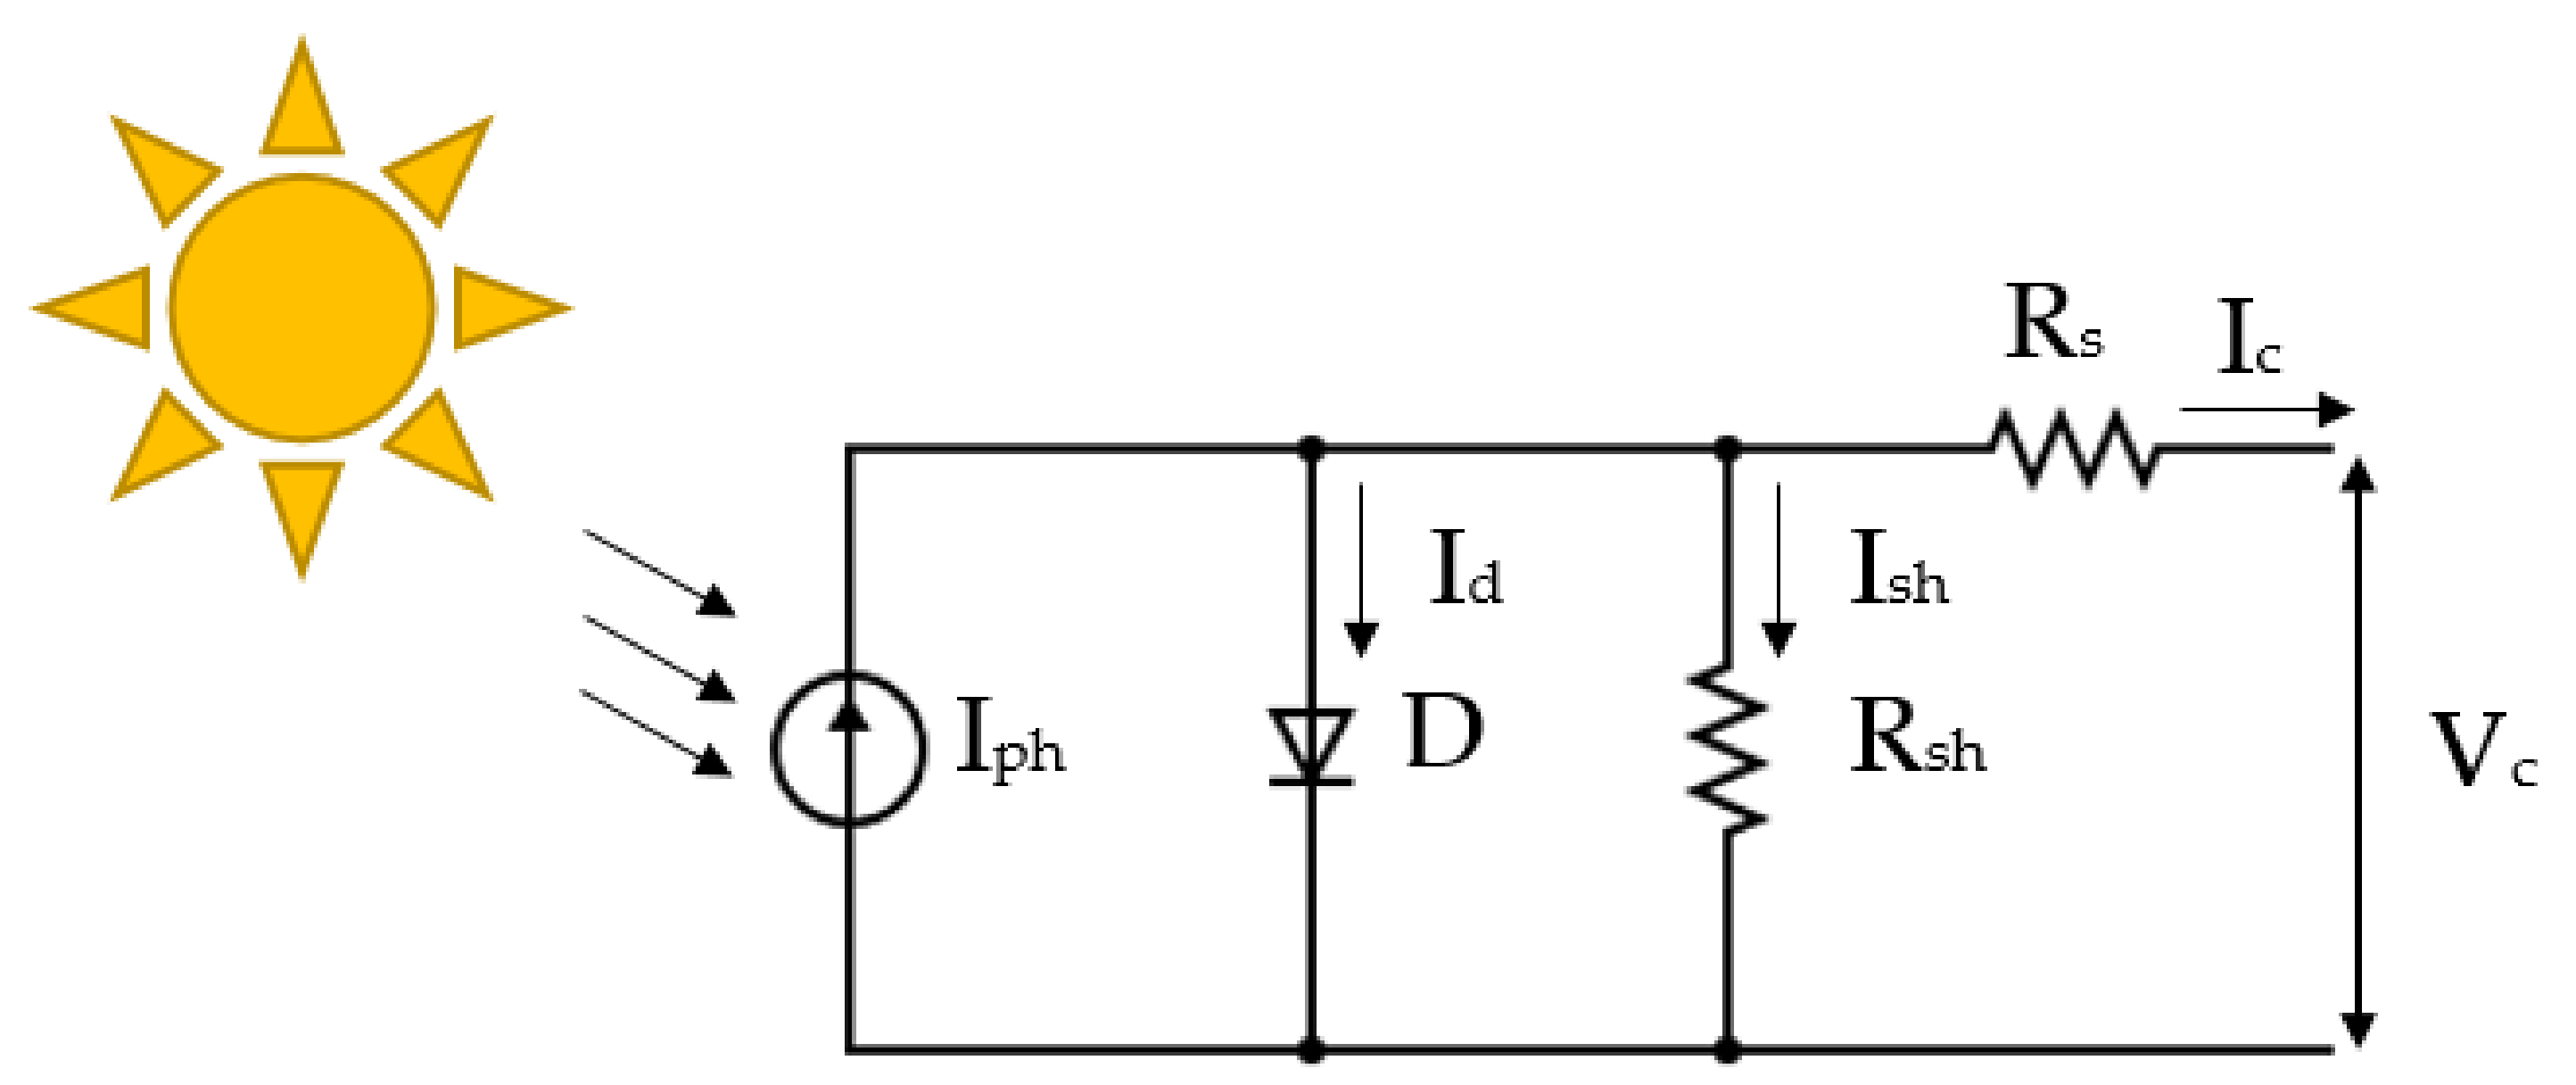
Section 2 describes the hardware used and its interconnection, and presents a theoretical explanation of the models applied for the PV and the boost converter with further details about the controllers handled for the MPPT tracking. Section 3 presents an experimental analysis of the PV features such as voltage–current and voltage–power curves, which are significant for generating a VRE. This section also concludes with the outcomes gathered with the implemented controllers. Finally, Section 4 comprises a summary of the highlights accomplished throughout this research.

2. Materials and Methods

2.1. Hardware Description

Figure 1 shows the workflow of the hardware involved in the experiments. The PV panel used was a PEIMAR SG340P, the modules of which were produced from polycrystalline silicon, which represents suitable versatility and efficiency. These panels are frequently employed in commercial, residential and industrial installations. Since the structural design is focused on the lightness and robustness, it has high stiffness and a feasible installation. Supplementary technical information about this device is detailed in Table 1.
The temperature and irradiation were measured with a silicon external sensor from the manufacturer Ingenieurbüro Si-V-10TC-T, which is reliable for PV variables monitoring. This module is formed of a monocrystalline silicon solar cell that is connected to a shunt. It is also capable of correcting the measurements due to an active temperature compensator, which works through a sensor that is laminated to the back surface of the module. As a consequence of this action, it provides additional information about the temperature. Both measured signals are transmitted as voltage variations in the range of 0–10 V. Further details are provided in Table 2.
Regarding the boost converter, a TEP-192 produced by the research group of Huelva University (Spain) was implemented in this case. This device has a PWM switching input of 20 kHz for the control process and works with input/output signals of 0–10 V. The module has two Schottky diodes MURF1560 GT, 2 TK capacitances (1500 μ F and 3000 μ F), six PVC2-564-08 inductances and an HGT40N60B3 IGBT. Voltage and current lectures are provided in signals from 0 to 10 V. Additional technical data on this converter are described in Table 3.
To close the electric circuit, an 8500B by BK Precision was used since it is a DC programmable load with wide flexibility and it is suitable for testing and evaluating DC power sources such as DC–DC boost converters, batteries, chargers and especially for PV panels. This programmable resistance includes reverse polarity protection to protect the system from temperature, power, voltage and current overruns. The technical specifications are presented in Table 4.
In the acquisition and control signal generation, a dSpace DSP1104 was linked because it is convenient hardware for collecting and generating analog signals, which vary between 0 and 10 V. Additionally, external software designed in Simulink can be embedded for control purposes. This platform also supports Real-Time-Interface (RTI) and ControlDesk, where the latter is the software used for observing data in real time. All the experiments were carried out with a sampling frequency of 10 kHz as this satisfies the requirements for the quality of the data acquired and the hardware limitations.

2.2. PV Model

The single diode model was considered for this study since it provides accuracy and simplicity [35]. This theory suggests that PV should be considered as a DC source of an electric circuit, as shown in Figure 2, which produces a current I p h , generated by the irradiation of the sun. In addition, two resistances are involved, where R s h is related to the leakage current of the diode of the p-n interface [36] and R s represents the resistance athwart the PV [37]; the latter causes a detrimental phenomenon in terms of the maximum power of the system [38].
The Kirchoff current law provides Equation (1), where the I s h and I c are defined according to the research of [39].
I c = I p h I d I s h
I c = I p h I o e q ( V + R s I c ) α K T c 1 V + R s I c R s h ,
where I o , K, q and T c are the reverse saturation current, Boltzmann constant, elementary charge and the operating temperature, respectively [40]. The generated current from the PV panel is also expressed as Equation (3), where G / G S R C represents the relation of the solar radiance measured and the radiance at standard rating conditions (SRC); the I s c _ r e f is the short circuit current of the PV and T r e f is the PV temperature, both variables at SRC [41]. The term k I _ r e f comprises a thermal factor of the short circuit current.
I p h = G G r e f I s c _ r e f + k I _ r e f ( T T r e f ) .
A PV panel was built with several modules in parallel ( N p ) and in series ( N s ), which led to an output current ( I m ) and voltage ( V m ) of the whole module based on Equation (4). Therefore, with the previous equations, the output current of the PVG can be expressed as Equation (5).
I m = N p I c V m = N s V c
I c = I p h N p N p I o e q ( V + R s I c ) α K T c 1 N p V + R s I c R s h .

2.3. Boost Converter Model

In this investigation, a converter was used to transfer the energy from the PV panel to the resistive load. The electrical configuration is a boost type that targets a voltage step up from the source to deliver a suitable end-used voltage. The relationship between the input and output is given by the duty cycle (d) through Equation (6). This variable is dependent on a PWM signal generator, which is controlled through a physical device, which, in this case, is a metal–oxide–silicon field-effect transistor (MOSFET). Certainly, the value of d was bounded between 0.1 and 0.9 for the continuous conduction mode.
V o u t = V i n 1 d .
The state–space representation of the boost converter is expressed as in Equation (7), such that x 1 = I i n and x 2 = V o u t [20].
x ˙ = 0 d c 1 L 1 d c C 1 R C x 1 x 2 + 1 L 0 V i n y = 0 1 x 1 x 2 .

2.4. Type-1 Fuzzy Controller

FLC controllers are sterling, as their configuration is based on the designer’s experience rather than knowledge of the system’s mathematical model. The implemented type-1 fuzzy controller (shown in Figure 3) uses normalized rules in its structure and, thus, scale factors K e and K d are used for the inputs, which are the error and its derivative. An extra output scale factor K b was also used to regulate the control signal in terms of the required performance.
The fuzzy block includes three consequent modules, which are the fuzzification, inference and defuzzification. The first changes the inputs into fuzzy inputs to designate the degree of the membership; for this case, overlapped triangular and uniformly discretized (between −1 and 1) functions are based on negative big (NB), negative medium (NM), negative small (NS), zero (Z), positive small (PS), positive medium (PM) and positive big (PB); this resulted in 25 adapted rules, which are shown in Table 5. The inference is the mechanism by which linguistic rules are evaluated according to the results obtained in the previous step of an if–then type [42]. Finally, the defuzzification comprises the stage at which the linguistic expressions are translated into numerical values for the output; in this case, equidistant and discretized constant outputs were configured in a range between −1 and 1.
FLC architecture was implemented as in the schematic diagram of Figure 4. The voltage reference estimator will be explained in further sections as it is related to the features gathered from the PV panel.

2.5. Perturbation and Observe Algorithm

This algorithm is based on an intentional and periodical perturbation on the control command with a following observation and evaluation of the system output [43]. Applied to the PV system, the perturbation is generated through a change in the voltage V i n ( k ) and current I i n ( k ) , such that the power of the PV is measured. This implies that the slope Δ P / Δ V can be calculated, which helps with knowing whether the MPP is achieved, as Figure 5 shows.
Based on the previous description and on the detailed logic of Figure 6, the knowledge of P i n ( k ) and V i n ( k ) and its delay in k 1 allows for the calculation of the mentioned slope. Therefore, if the latter mentioned value is positive, the duty cycle d (which modifies the voltage by Equation (6)) will increase such that the algorithm output u = d + Δ d and aims to reach the MPP; on the contrary, when the position is at the right side of the MPP, the control signal decreases through u = d + Δ d .

2.6. Sliding Mode Controller

Considering that the error is defined as Equation (8), where V r e f is the reference voltage, then an integral sliding surface is established through Equation (9) such that λ > 0 .
e = V r e f V i n ,
S = e λ e · d t .
According to Slotine et al. [44], the control signal is composed of an equivalent u e q and a switching term u s w , which is defined in Equation (10). The first mentioned is gathered through the condition S ˙ = 0 [45]; the switching, which guarantees robustness, is expressed in Equation (11).
u = u e q + u s w
u s w = K · s i g n ( S ) .
As previously mentioned, obtaining the equivalent control signal implies that the surface derivative should be equal to zero. Therefore, as the error was formerly expressed in Equation (8), and with the usage of the system in Equation (7), the equivalent control term is obtained as follows.
u e q = 1 x 2 ( V i n + λ L e x 2 ) .

3. Results

3.1. Analysis of PV Features and Voltage Reference Estimator

The characteristics curves shown in Figure 7 were obtained by a considerable value of resistance linked to the PV system; this value was decreased gradually while the data were being recorded. Simultaneously, the environment temperature and irradiation were gathered, which varied, respectively, between 14.6 C and 36.6 C and from 64 W/m2 to 808 W/m2.
Figure 7a indicates the relation between the voltage and the current where three sections are distinguished and were labeled in the research conducted by the authors of [46]. The first is called the current source part, where this feature tends to stay constant; the second one, known as the knee of the I-V curve, is the section where the MPP is achieved; and finally, the voltage source part is where the current–voltage is linearly related. Along the current source section, this tends to stay almost constant between 0 V and 35 V. However, this section is highly dependent on the irradiation, which, ideally, lean these curves upwards, whereas the temperature shifts in a horizontal movement [47]. The knee and the voltage source part are mostly conditioned by the temperature, which moves the curves to the right hand side of the graph [48].
Figure 7b shows the voltage–power curve where, in this case, the irradiation leans the curves upwards and the slope of the initial linear behaviour ascends. Nevertheless, the temperature influences a diagonal drive of the curves. Therefore, this means that the irradiation moves the MPP on a vertical axis, whereas the temperature moves the curves on an slanted axis.
Formerly, the authors have been working with a current reference estimator in power sources such as proton exchange membrane fuel cells (PEMFC), where the output reference was dependent on the temperature [23,49]. In this case, a VRE was developed by highlighting the MPP points from 790 curves like those in Figure 7b, which varied with the radiation, and then a surface V r e f _ M P P = f ( P , T ) was constructed. This function was attained with the Matlab Curve Fitting Toolbox since it employs an optimized solver to achieve suitable parameters that could reach the best fit quality for curves and surfaces. The framework provided a polynomial surface represented by Equation (13); these parameters were obtained through an optimization of performance metrics to acquire a suitable goodness of fitting (GOF); these are the sum of squared errors (SSE), R-square, adjusted R-square and root mean square of the errors (RMSE).
Table 6 provides the obtained metric values, which are appropriate because the SSE and the RMSE should be minimum whereas the R-square and its adjusted version should be near the unit [50,51,52]. Furthermore, the coefficients of Equation (13) are also exhibited with 95% confidence bounds. The representation of the surface is shown in Figure 8 based on voltage, power and temperature.
f ( x , y ) = p 00 + p 10 · x + p 01 · y + p 20 · x 2 + p 11 · x · y + p 30 · x 3 + p 21 · x 2 · y .
To verify the performance of the designed and explained VRE, two experiments were conducted in different conditions, the outcomes of which are shown in Figure 9 and Figure 10. For each figure, (c) is the output of the VRE, whereas the data of (b) and (e) are the inputs. Based on both figures, the values of temperature and the irradiation match with each curve where the MPP voltage is around 36 V and 32 V, respectively, for each condition; this is verified with the obtained results where the voltages are around the mentioned values. Surely, these are inconstant as the power fluctuates as well as being mainly affected by the irradiation and temperature; this effect is seen as a correlation between sub-figures (a) and (e).

3.2. P&O Results

The first control architecture to be embedded and tested was P&O, where the results are summarized in Figure 11. An intentional and periodical load change between 30 and 35 Ω was configured to simulate unexpected disturbances in the system. The value of resistance was acquired indirectly, since the BK Precision 8500 lacks direct measurement; therefore, it was possible to achieve the variable through the electrical relation of the output voltage and current, as Figure 11c exhibits.
Several effects can be focused on in terms of the sun irradiation and the outcomes of the system. A sudden reduction was perceived as Figure 11a reveals, of nearly 570 s, which could have been caused by a transitory cloud. This had an effect through the PV generated current, output voltage, power and duty cycle, which is shown in Figure 11e–h.
Figure 11d, which exposes the controlled voltage of the PV and advertises significant chattering with an amplitude that varied between 34 and 37 V, implies that some power was lost. This is also linked to the main drawback of this method, because an intense variation of voltage leads to a poor performance in MPP tracking. Furthermore, due to the load changes, other dynamical effects such as over–undershoots were expected, which were shadowed by the generated ripple.

3.3. SMC Results

As mentioned earlier, the second structure to be contrasted was a first order SMC; this configuration was explained in Section 2.6. The load setup was the same as that used in P&O in terms of resistance for disturbance simulation. The electrically acquired variables are summarized in Figure 12. Certainly, the atmospheric conditions were different because the tests had been carried out in diverse surroundings; these were shown in Figure 10, where the radiation and temperature values were higher than they were in the previous test.
With regards to the PV voltage, the first feature to highlight is the chattering; this reduction is visible in Figure 12b, where the amplitude was reduced to nearly 1 V without resistance changes, which is three times less in contrast to the P&O results. As a consequence, the second considered characteristic is a fairly visible overshoot through an amplitude of 3.7 V, whereas the undershoot reached nearly 7.2 V as Figure 12b shows.
It is important to notice that the voltage error was acquired in this case because the P&O algorithm control action is based on perturbation, whereas SMC is an error-based controller. The acquired error values and robustness of this scheme are reflected in Figure 13h, where prompt corrections (that reached a maximum of 7.6 V) along the dynamical changes are a main advantage of this scheme. However, the inconvenience is the error amplitude, which reaches 1.2 V on average.

3.4. FLC Results

The advanced control framework was tested in the same load conditions as with the P&O and SMC tests. Accordingly, significant improvements in the performance were accomplished; Figure 13 recaps the results. Despite this figure focusing on the main controlled results, atmospheric conditions were the same and are reflected in Figure 9, where the irradiation had less fluctuation than the previous cases.
The PV controlled voltage that is shown in Figure 13b displays a different demeanour in comparison to P&O and SMC. Initially, FLC performed better due to the chattering reduction because the voltage amplitude was 0.11 V, which means that it was diminished by several orders of magnitude. Section 2.5 explained that the P&O demeanour dimmed the overshoots and undershoots due to the resistance change because of the chattering excess, which was roughly perceived with SMC and, in this case, it could be managed with FLC. During the increase, an overshoot with an amplitude value of 2 V was observed, which had a settling time near to 8 s. At the decline, the settling time was similar in the undershoot although the slope correction was straight with an amplitude of 4.7 V.
As with SMC control, this framework is also an error-based approach where the results of this variable are displayed in Figure 13h. Subsequently, the values obtained were mostly averaged at 0 V except for periodical fluctuations, which reached an amplitude of 0.11 V and peaks of 7 V during the load rise. These were generated by the resistance changes but, in comparison to the previous analysed structure, the correction is slower.

4. Conclusions

The current research presented an analysis of a real PV system, the objective of which was to track the MPP for performance improvement. Because the atmospheric conditions, such as radiation and temperature, varied throughout each day, non-linearities were reflected within the surroundings.
Since the results were gathered through real data, an experimental rig was described in which an SG340P PV panel within a boost converter TEP-192 was the main hardware. These were linked to a resistive load, which pretended to simulate external disturbances. The temperature and irradiation, which are influential variables on the system, were acquired through an external sensor. The acquisition of information and the output controlled signal were generated by a dSpace DSP1104, which had embedded designed software to increase the system’s performance.
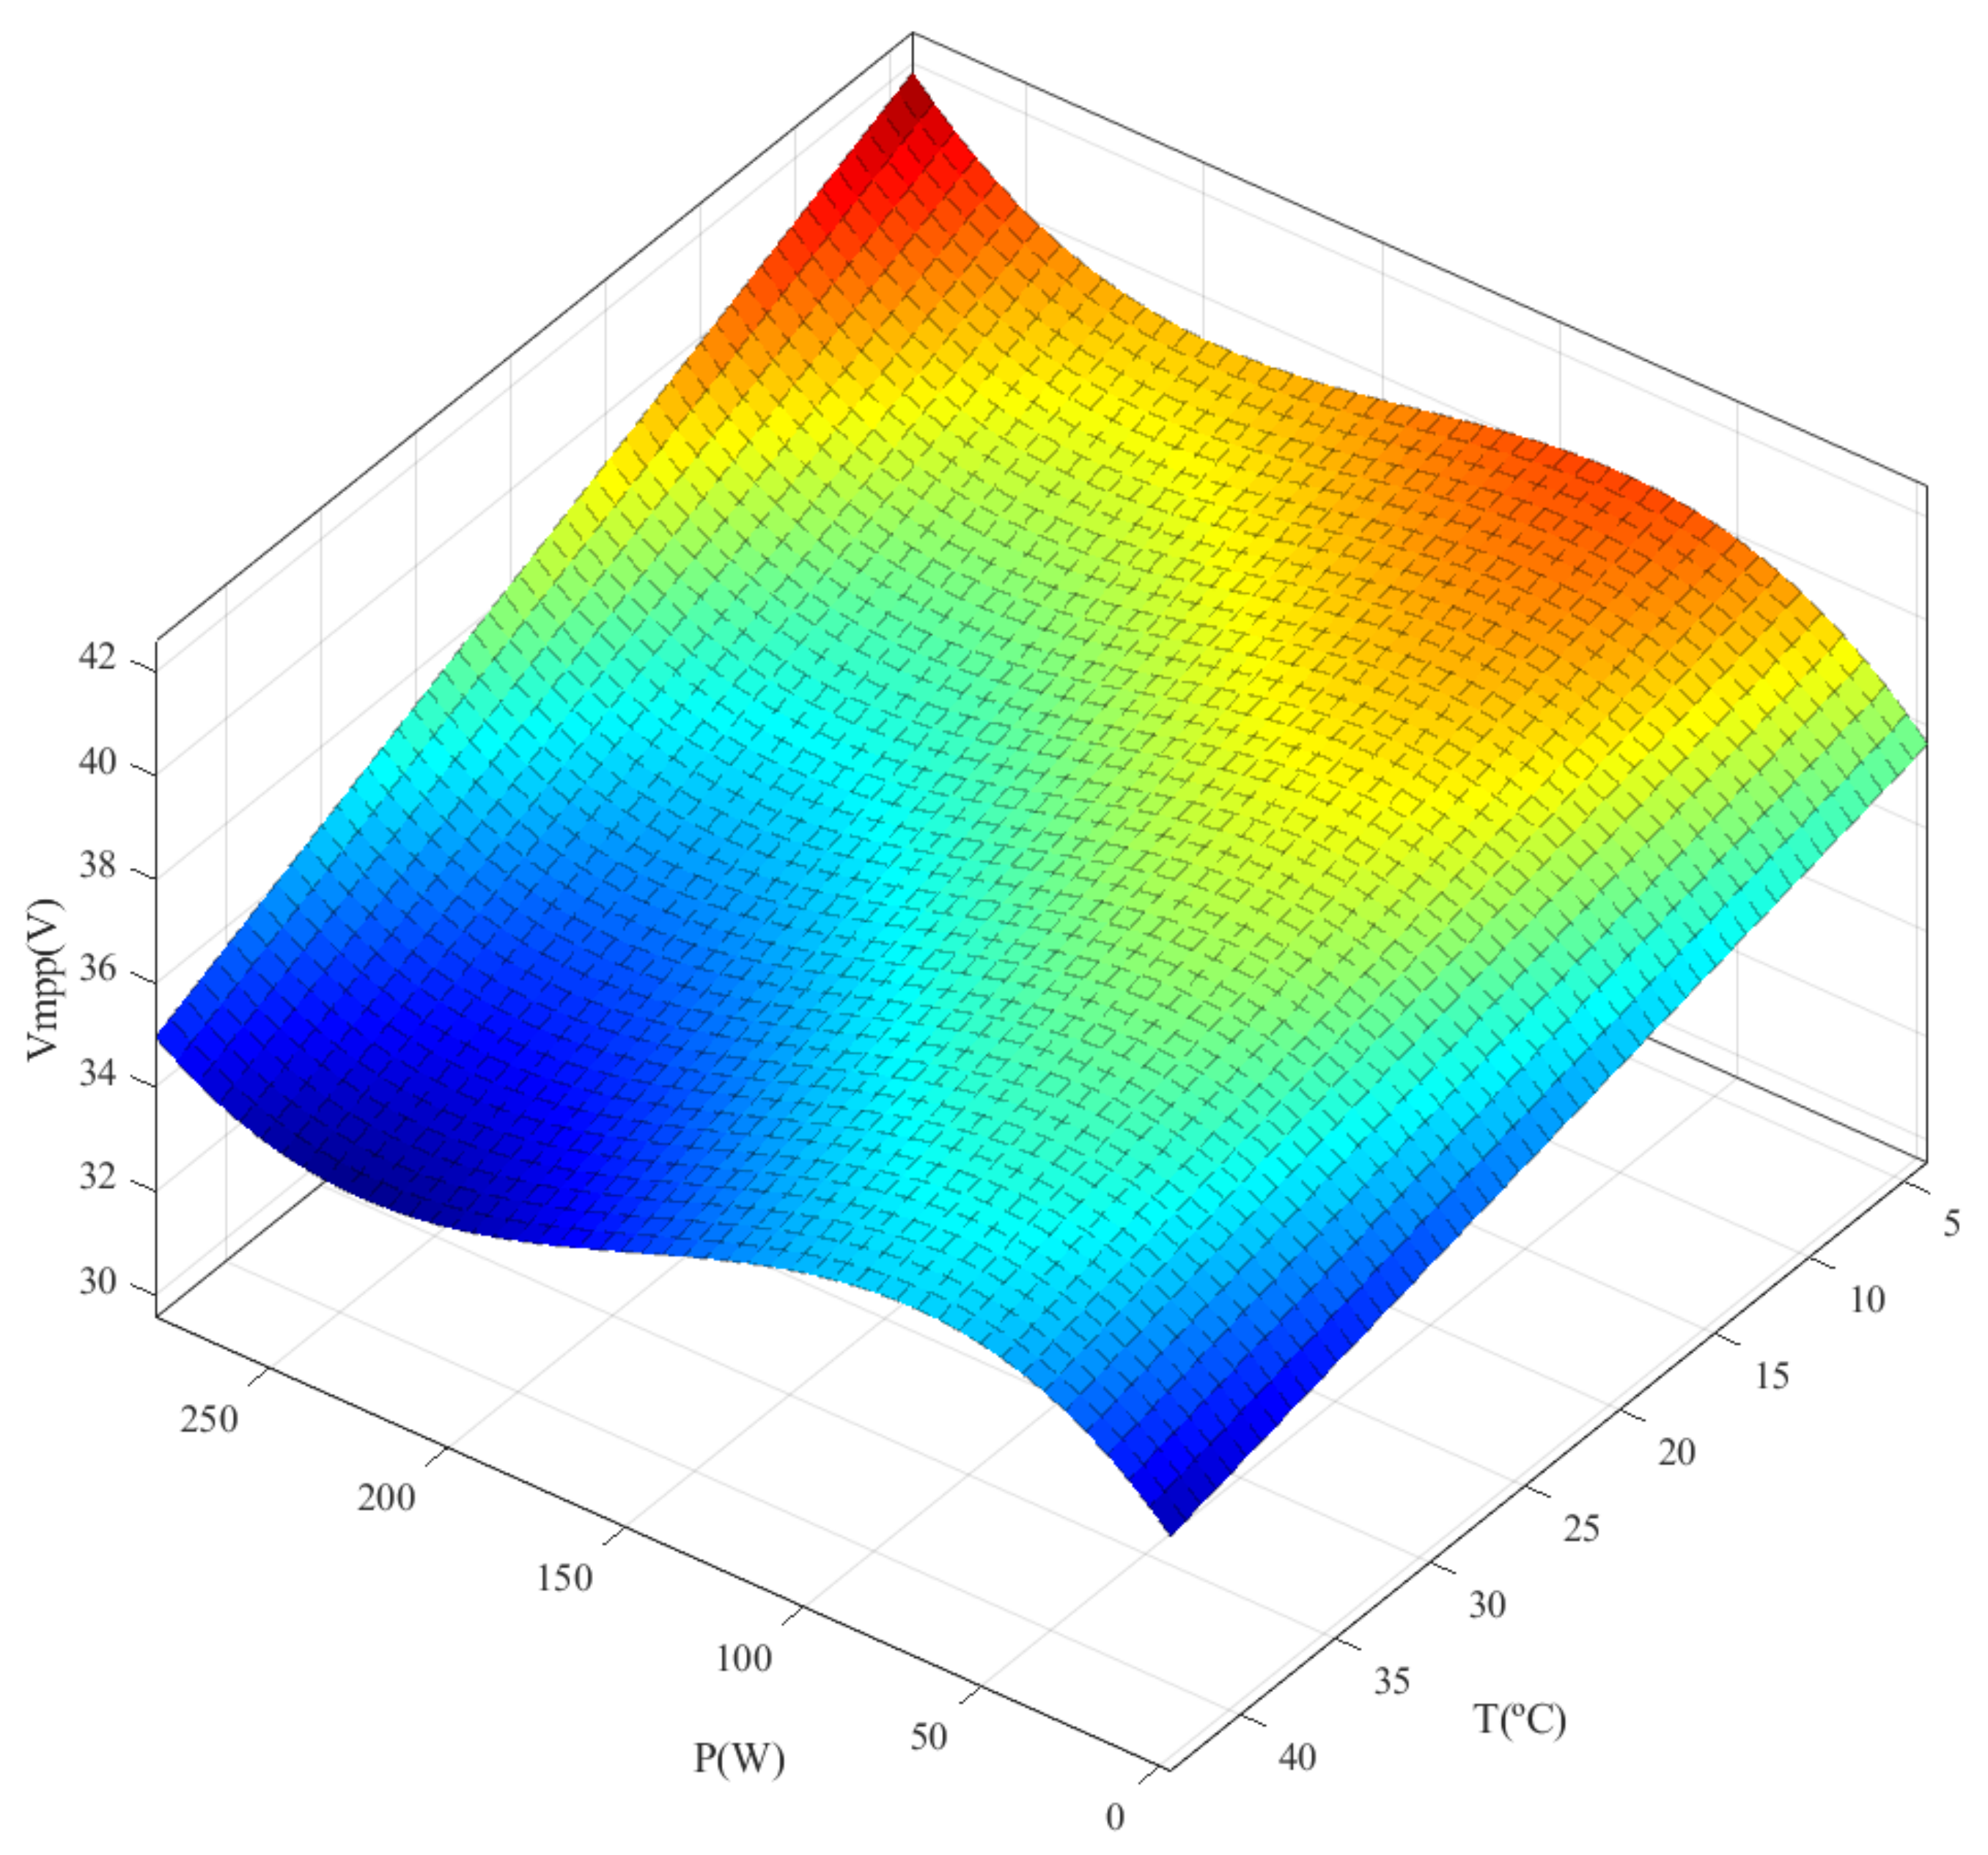
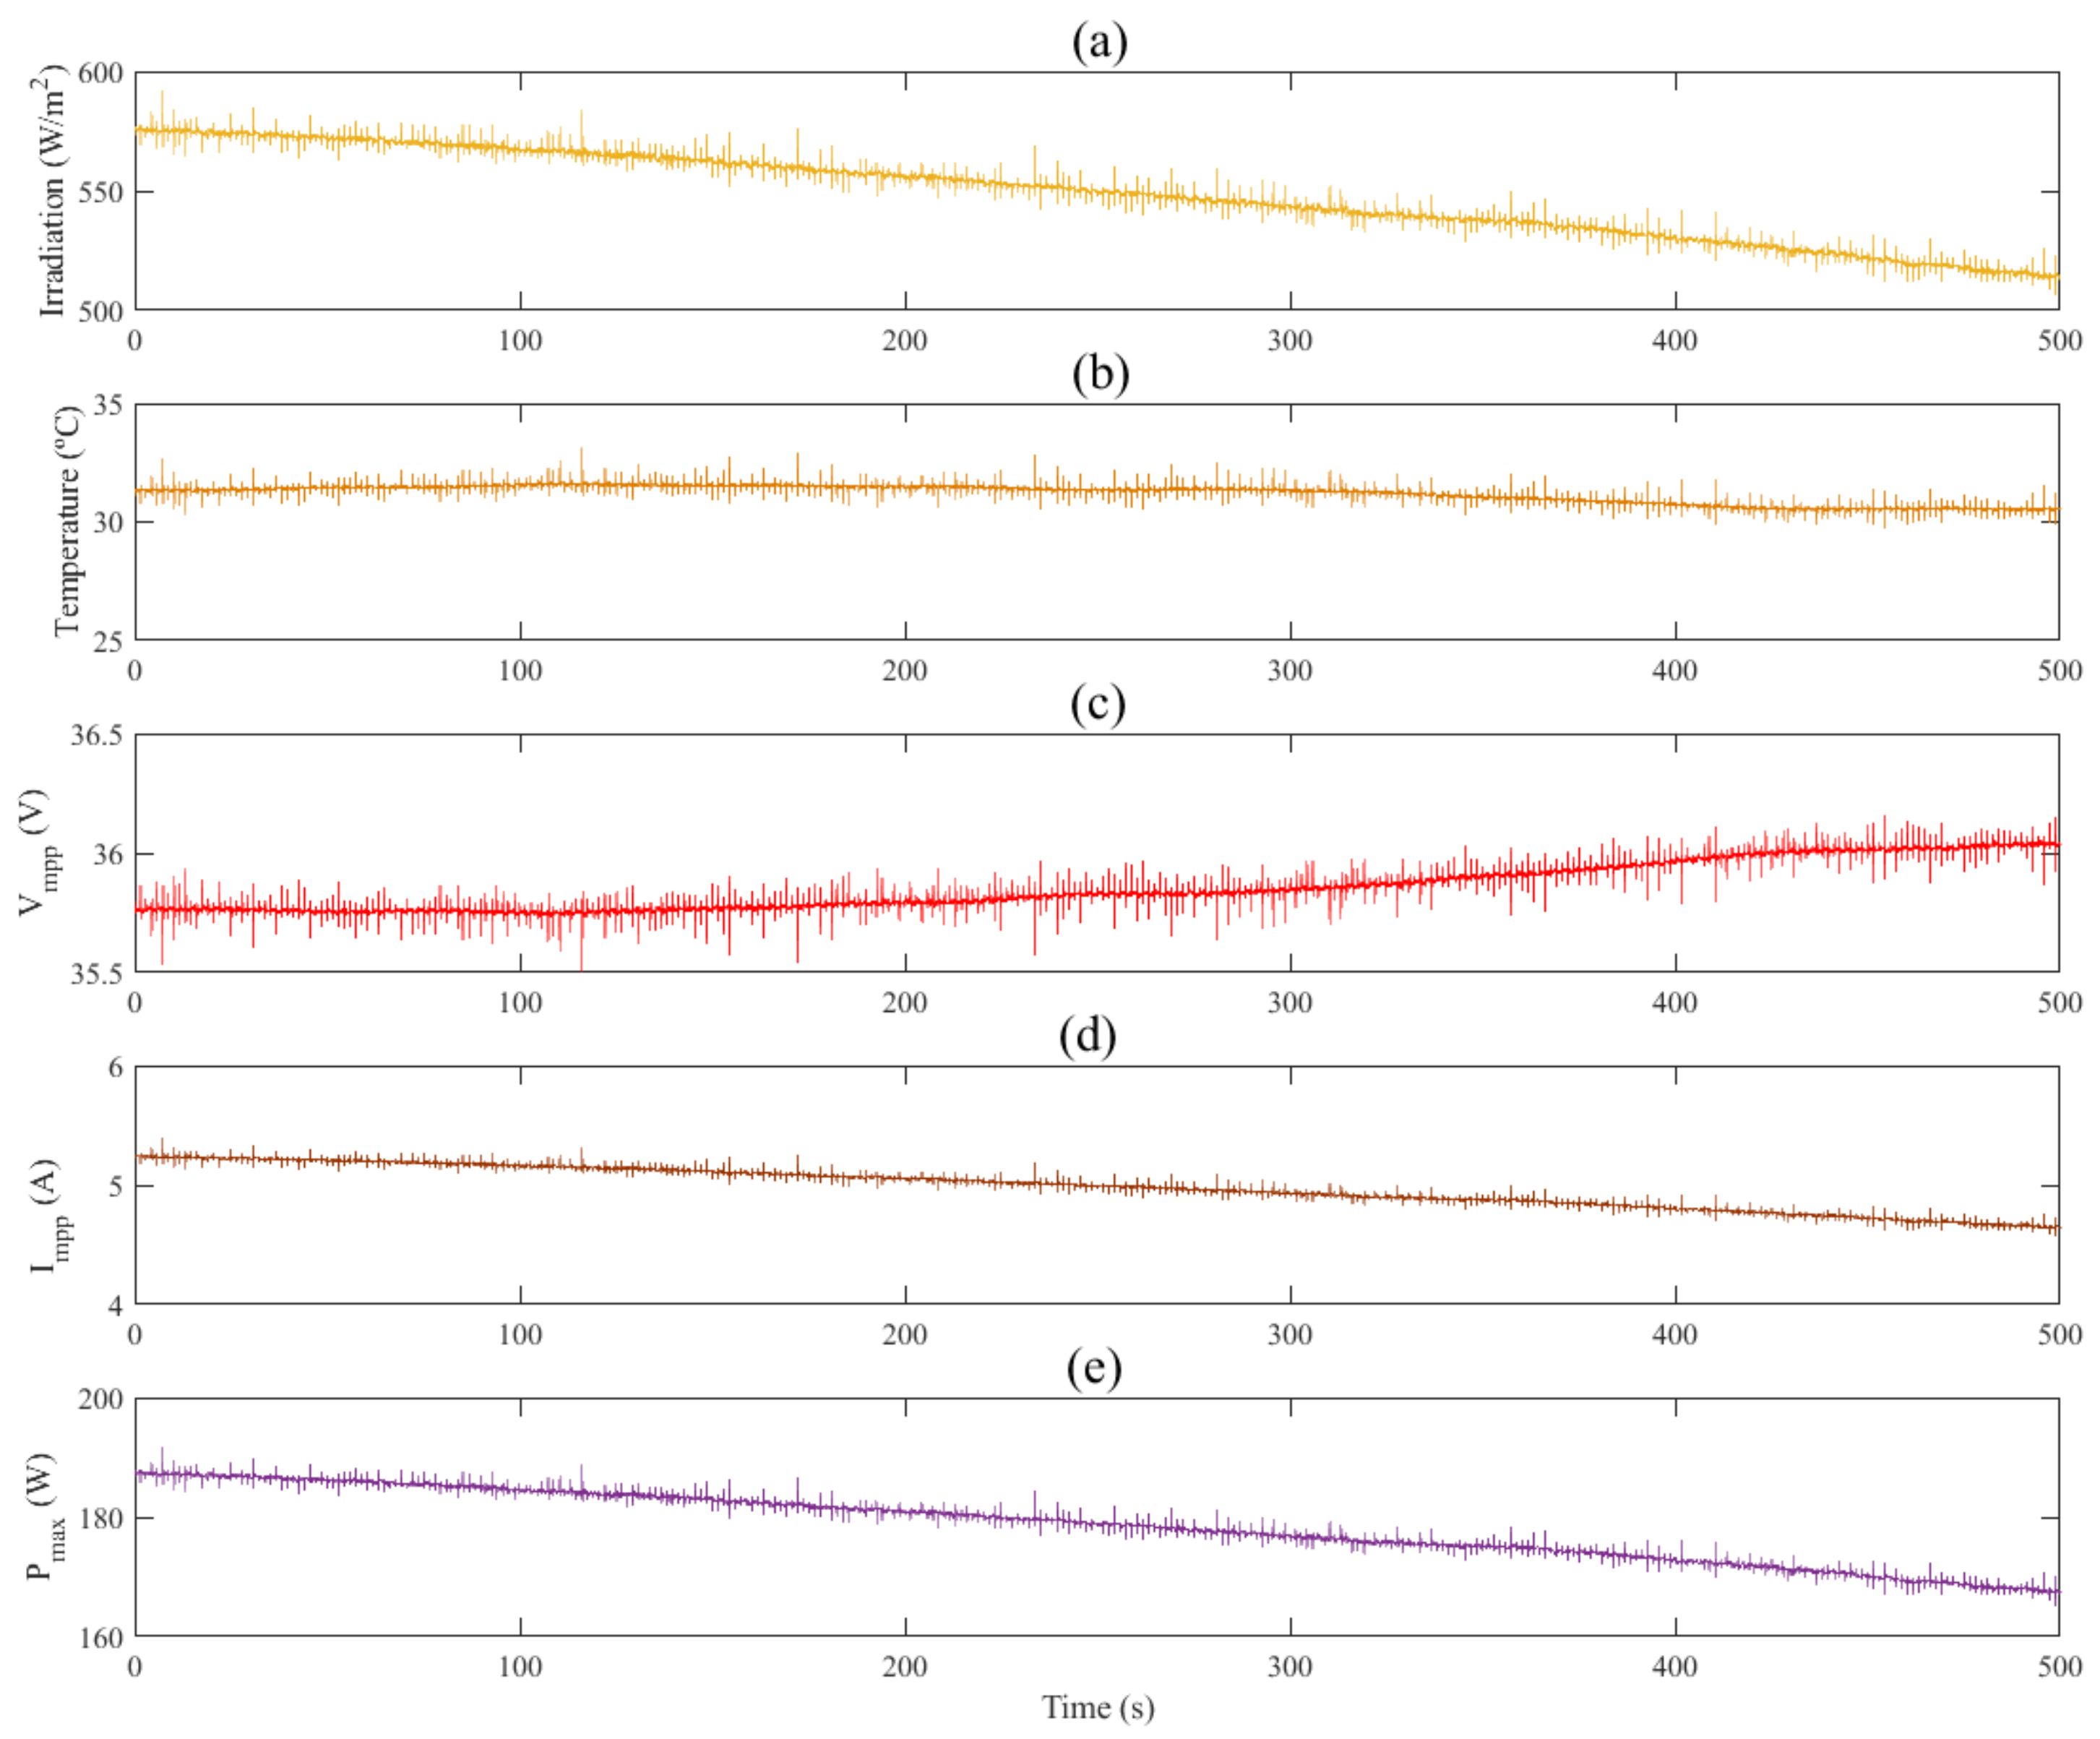
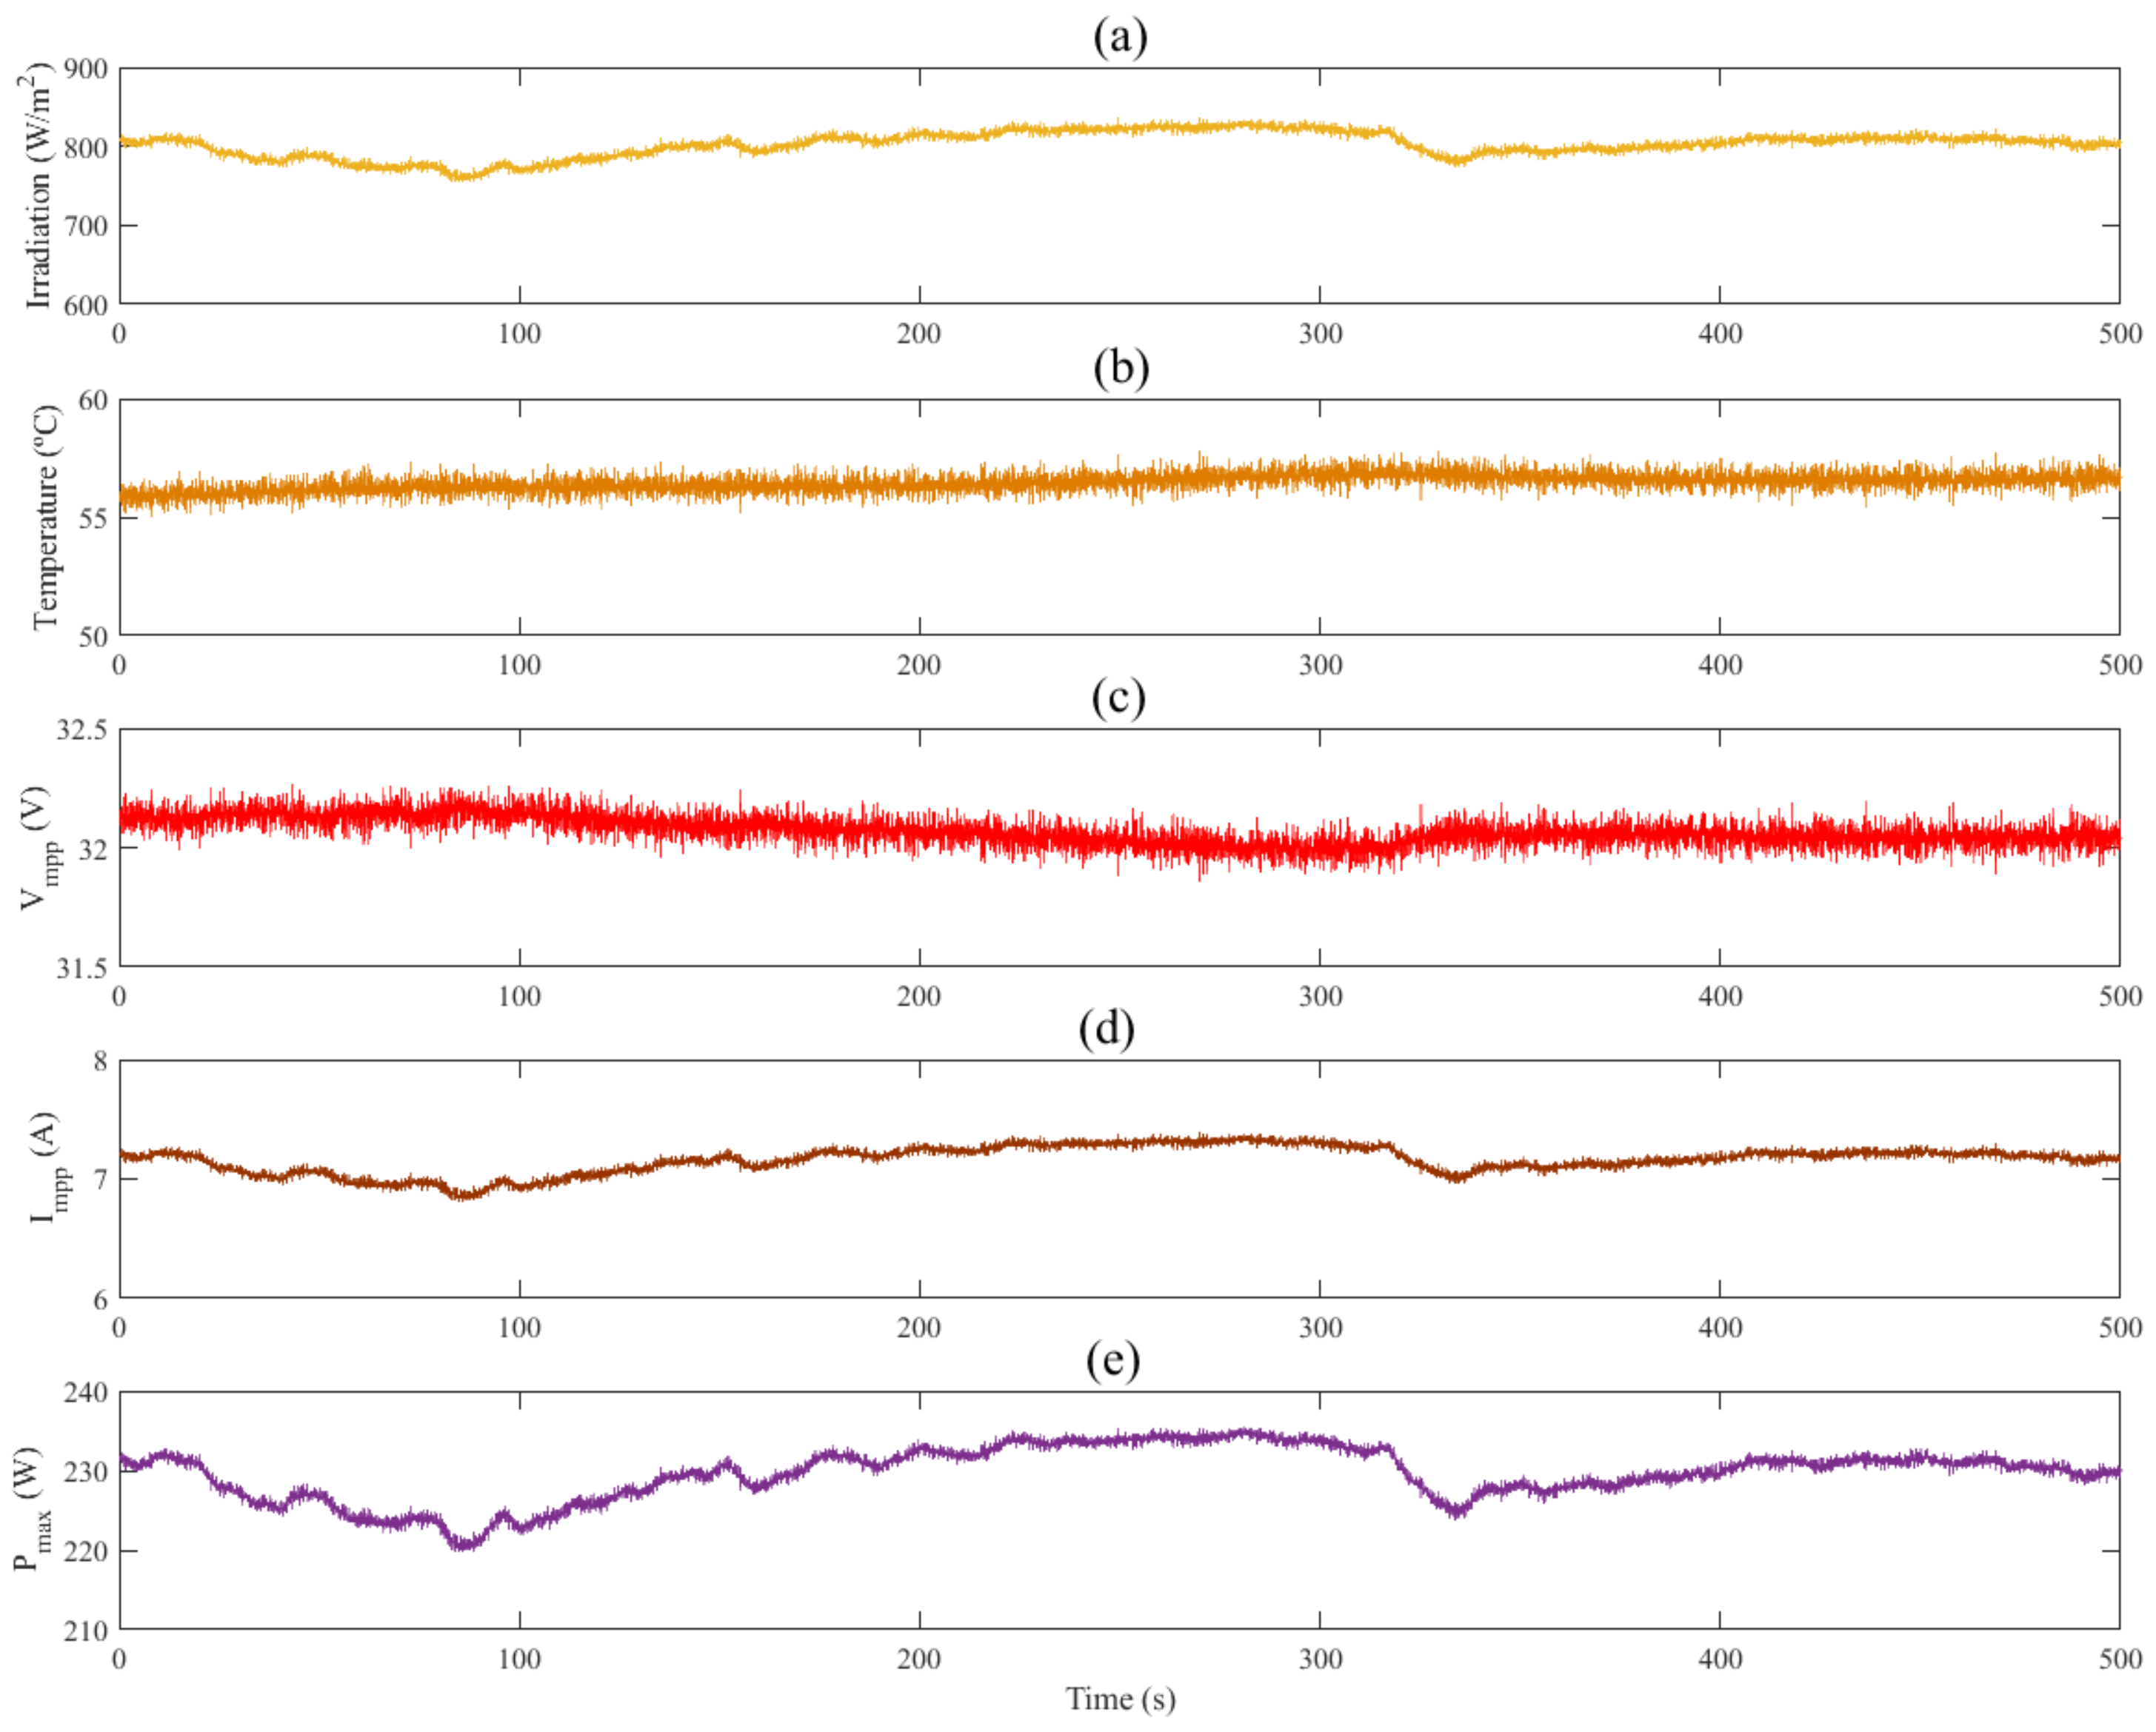
The first analysis was conducted by way of a resistance change, which provided the characteristic curves of the PV; these represent a useful tool since they define key features for further design. The voltage–current curve was analysed by taking into account the influence of the irradiation and temperature; these variables, reflected in the voltage–power curves, were essential because the MPP showed a dependence based on the irradiation and temperature. Hence, an independence of the irradiation was developed by taking the MPPs in terms of this variable, where a VRE was created by a polynomial approach based on power and temperature.
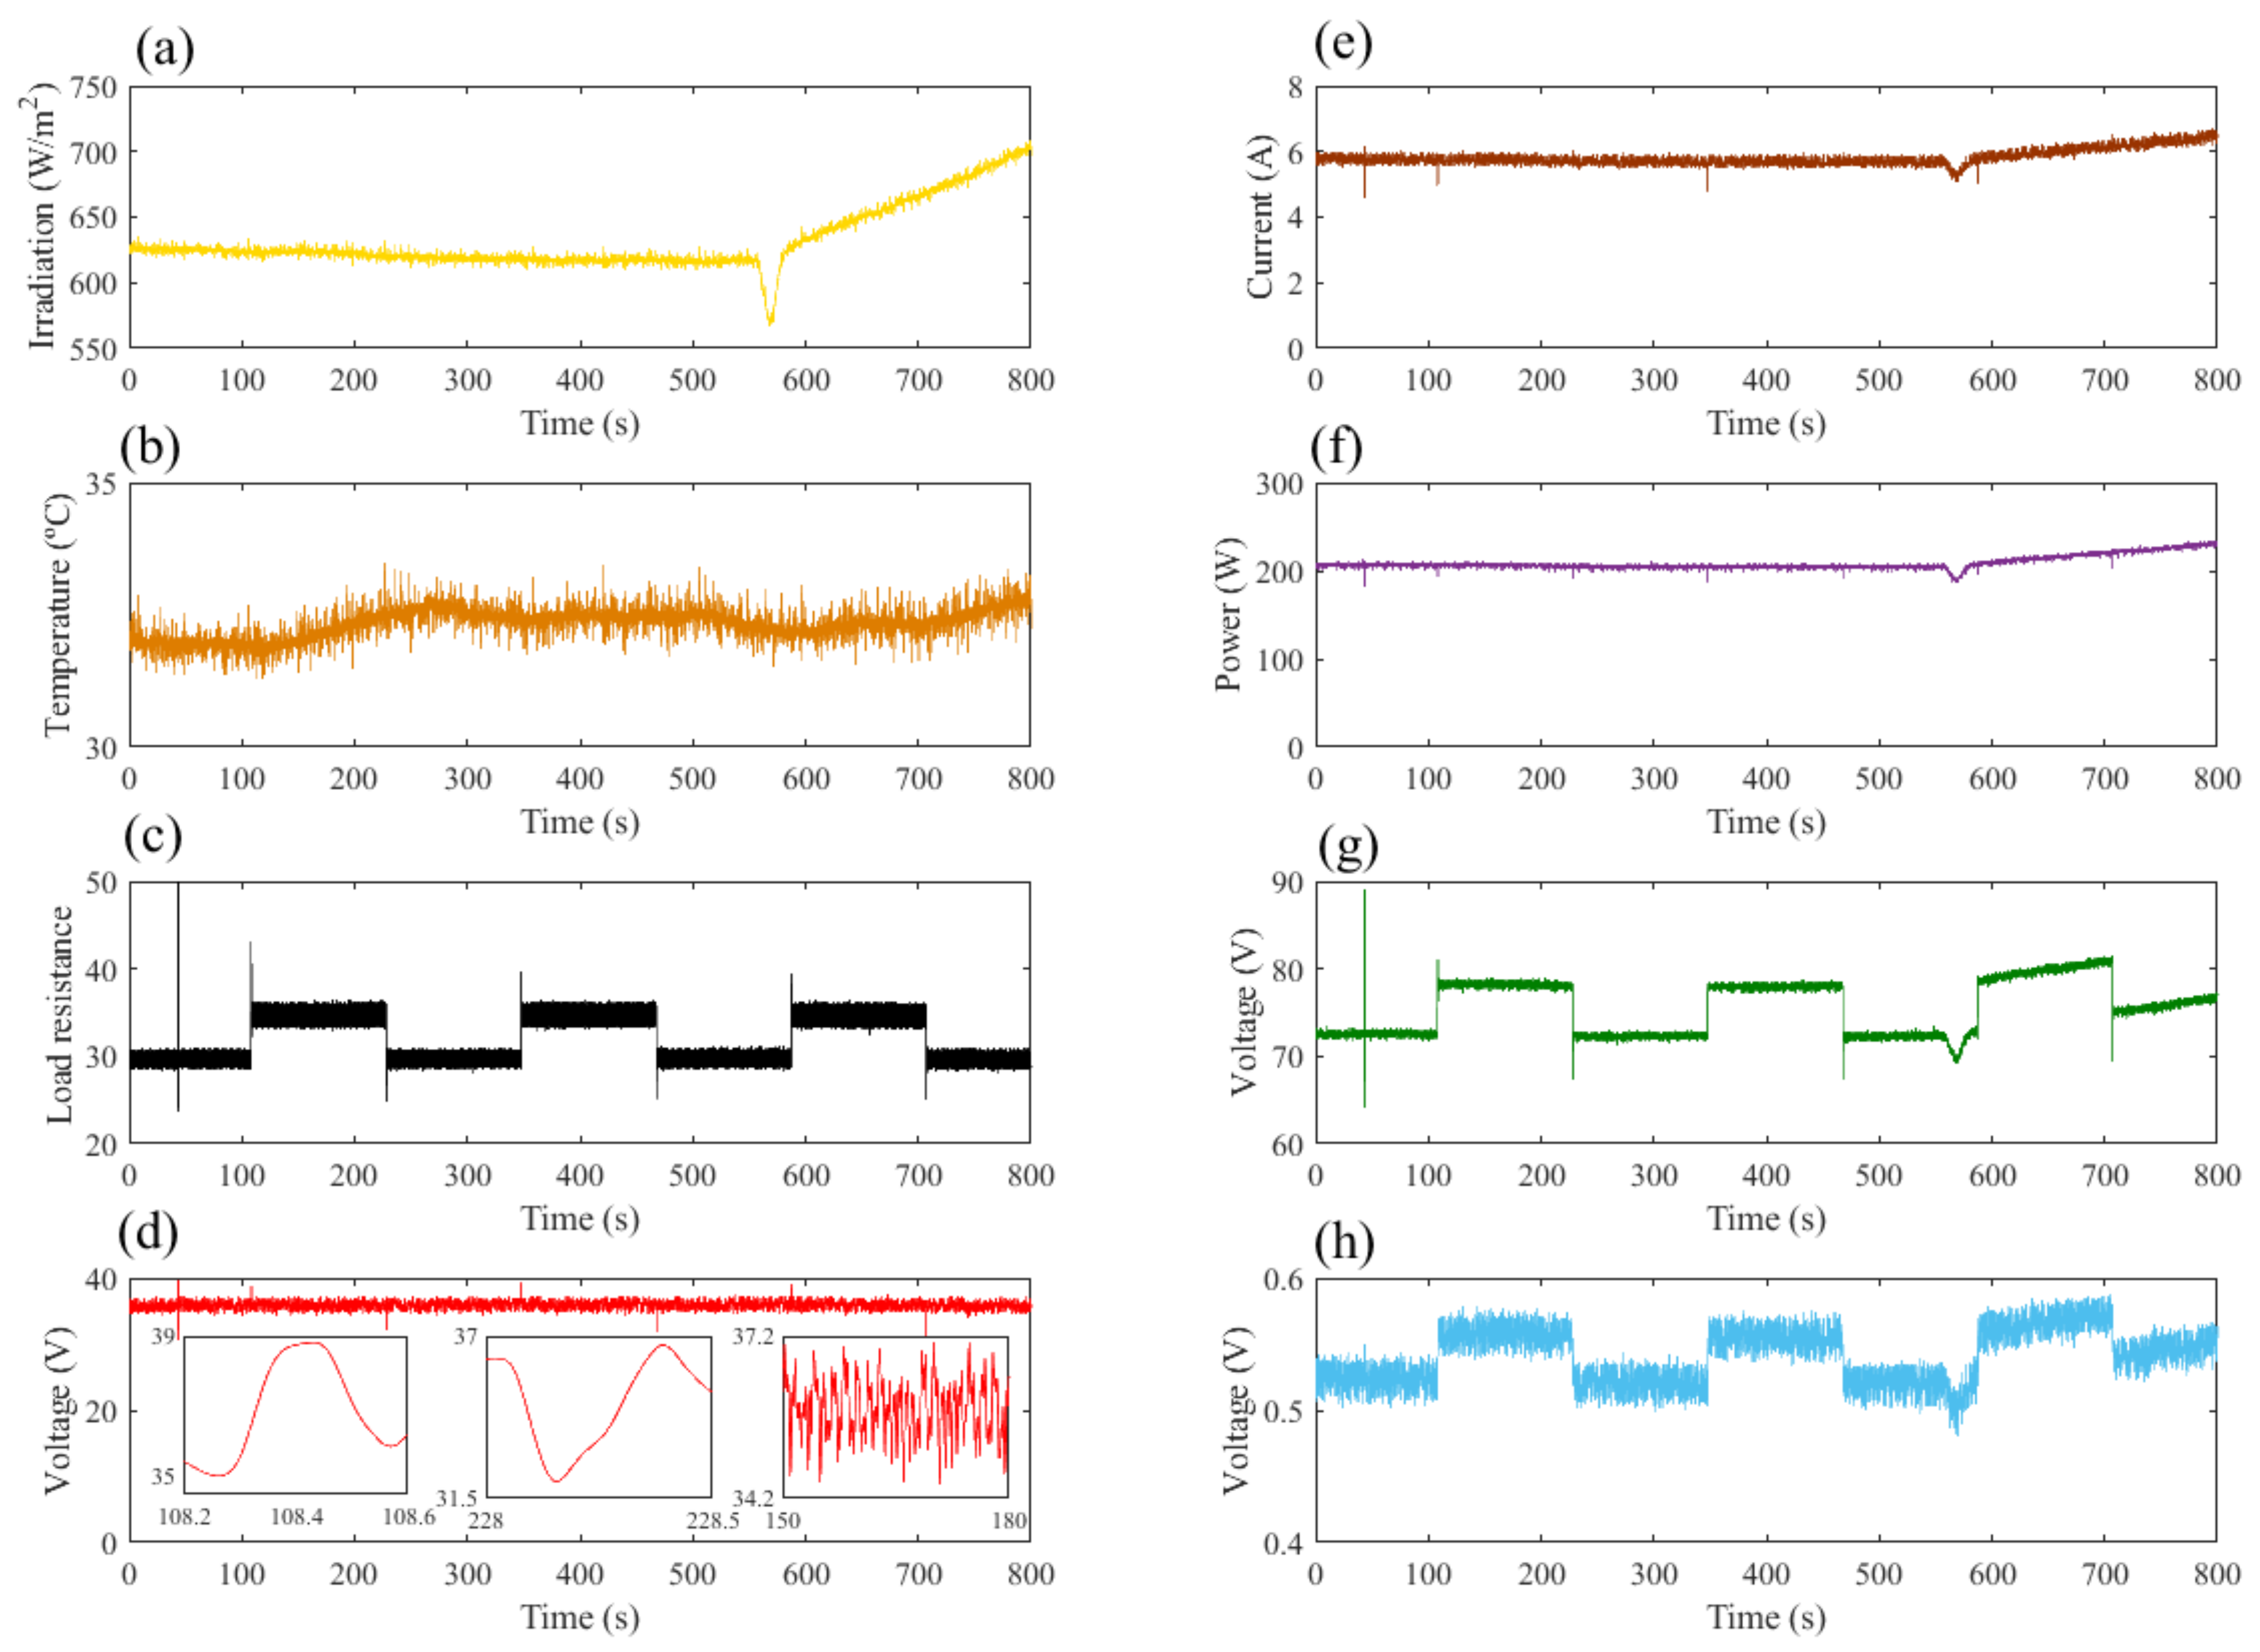
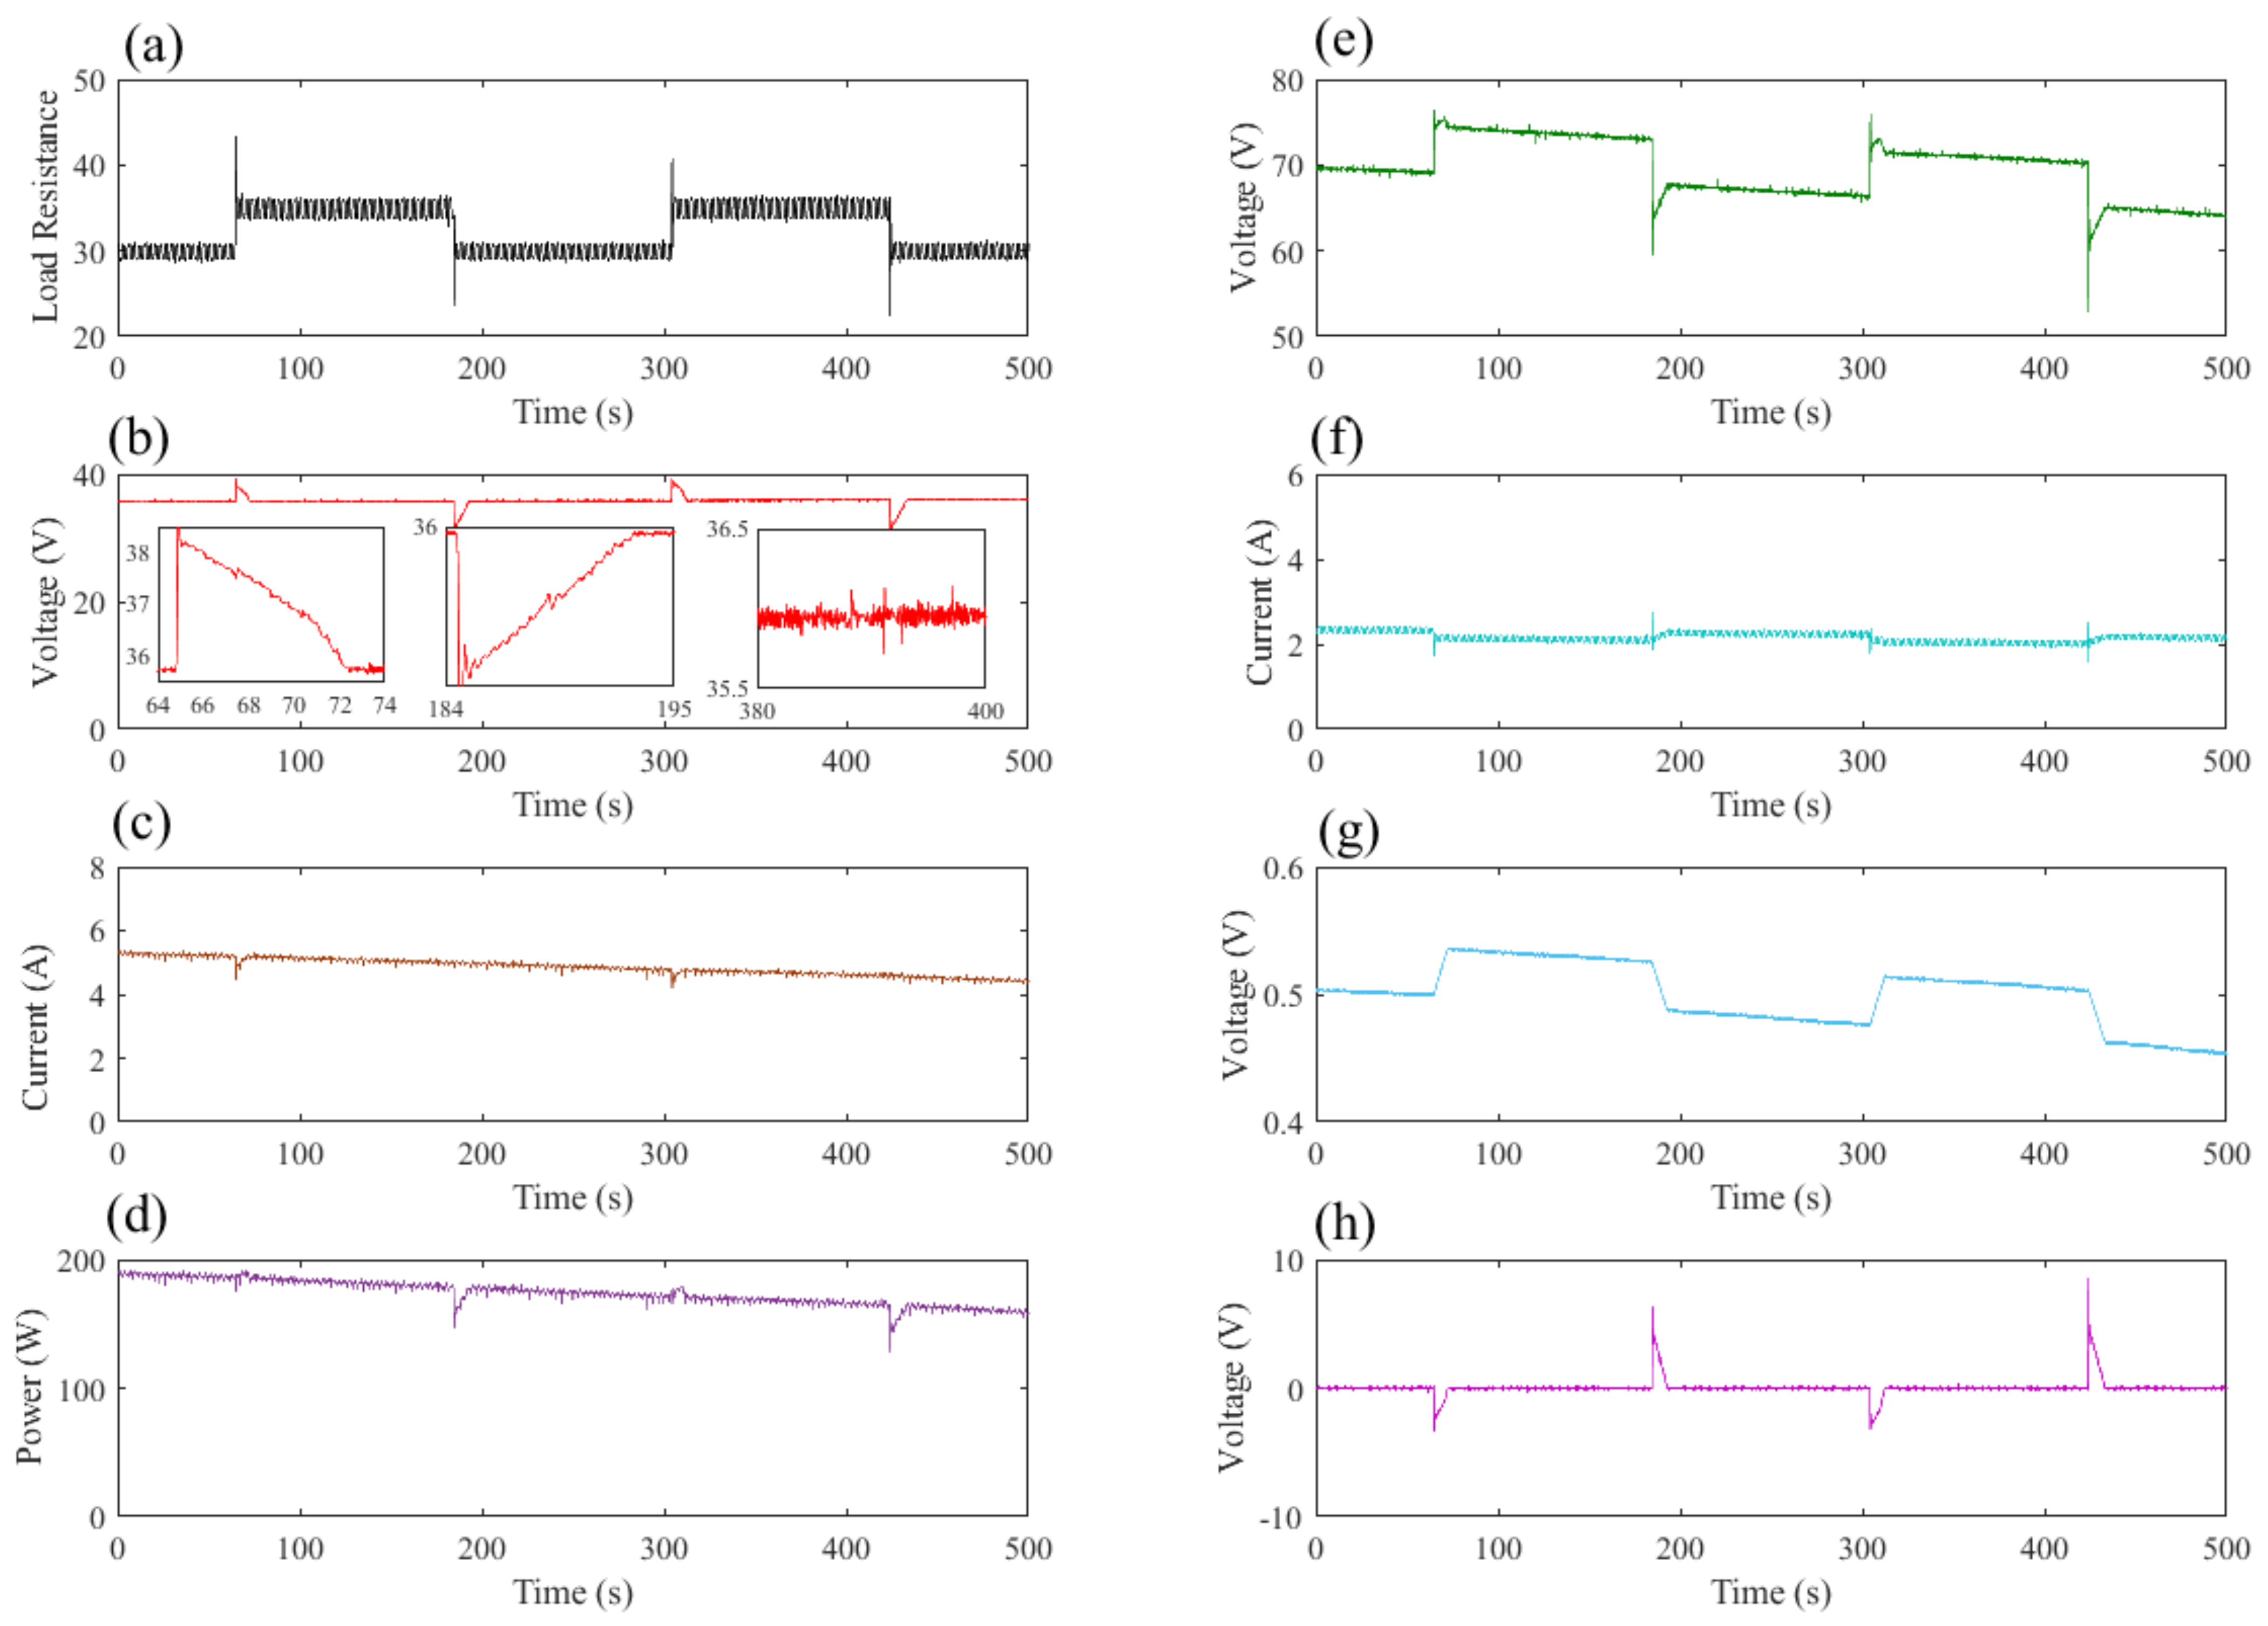
In the final step of the experiments, three controllers were designed and tested. The P&O algorithm, commonly used in MPPT, was chosen and implemented despite exhibiting several problems that were pinpointed, such as falling in a local MPP, which is linked to chattering, which in turn leads to an increase of the energy consumption of the system. As a consequence, if the amplitude is sufficiently large (like in the experiments), over–undershoots due to external resistance changes are faded. In a second step, an SMC was embedded with the proposed VRE, where the overshoots were fairly visible and the chattering amplitude was three times lower in comparison to that of P&O.
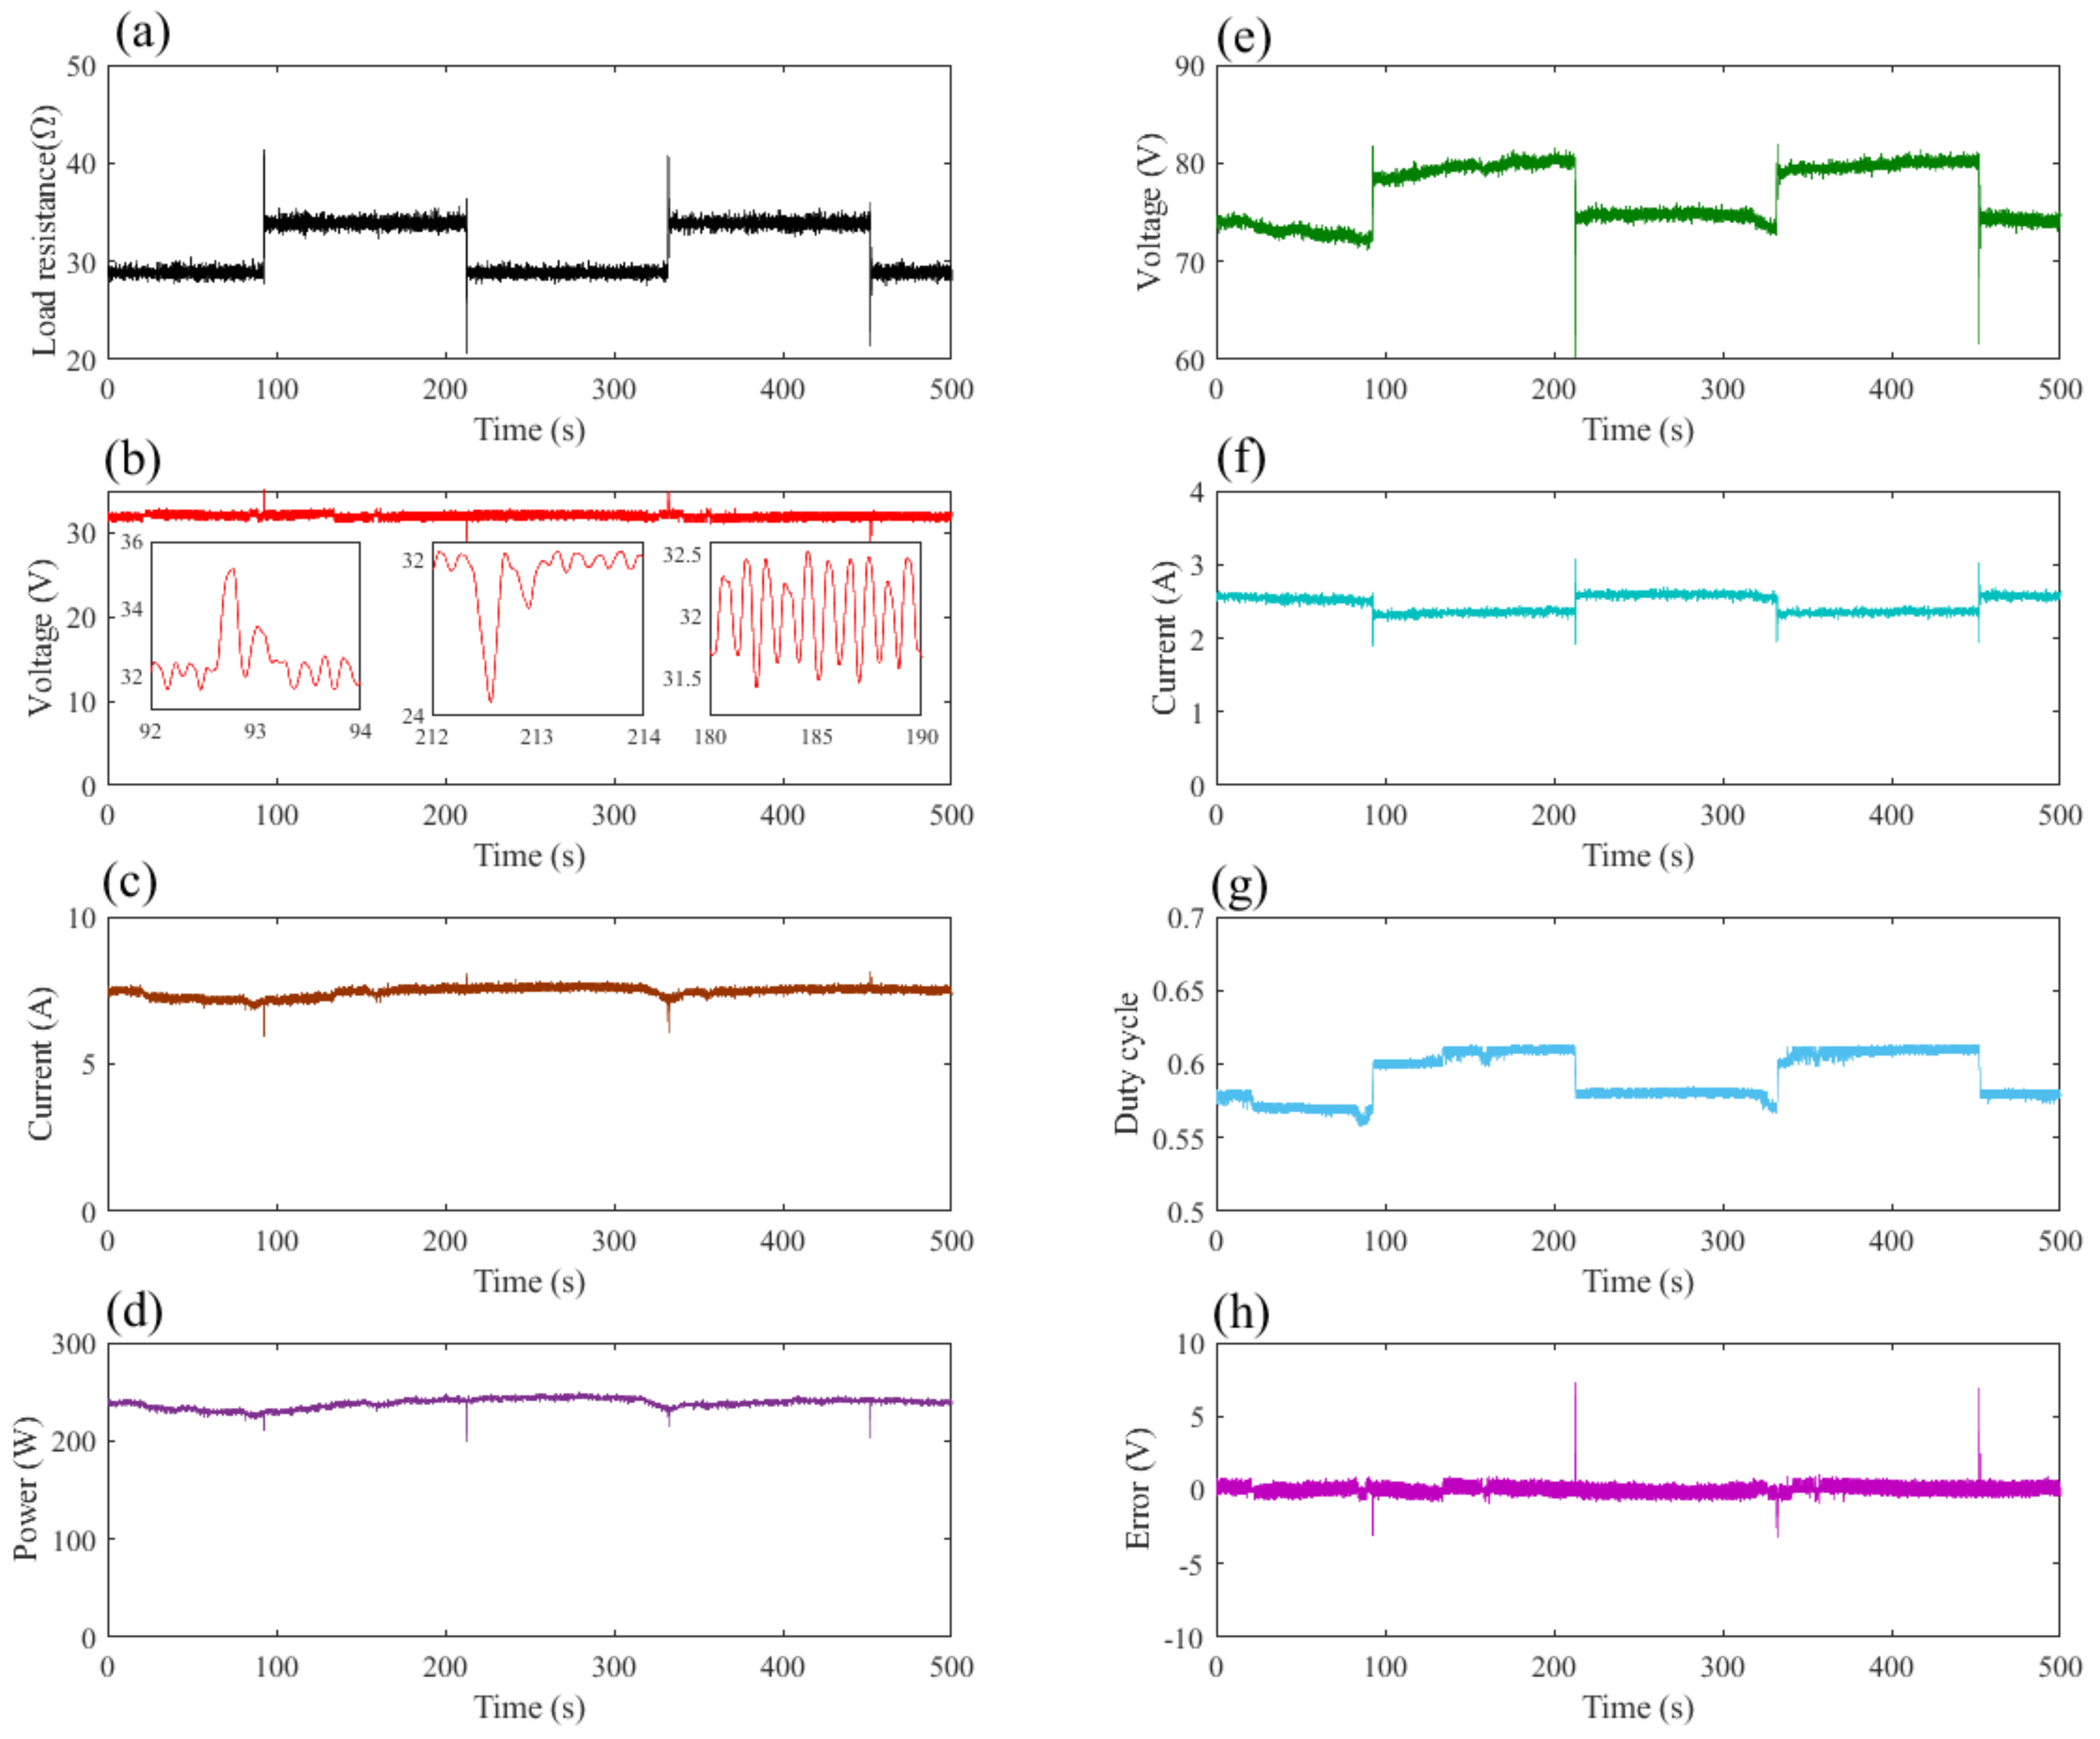
However, to improve the chattering reduction, an advanced FLC type-1 was developed and embedded, which produced a significant improvement in comparison to P&O and FLC. The chattering of the controlled voltage decreased by several orders of magnitude and, as a consequence, over–undershoots were unveiled. The contrast in terms of the error with SMC showed that the FLC has a slower correction, although the ripple amplitude is reduced significantly.
Through this research, future trends for MPPT in PV systems were analysed and will be the objective of forthcoming investigations. These include an analysis of FLC type-2 based on an uncertainty study, which can be contrasted with the present obtained results. Improved P&O algorithms can also be compared in order to search for better chattering management reduction.

Author Contributions

Conceptualization, O.B., M.D. and C.N.; methodology, M.D. and C.N.; software, C.N.; validation, M.D.; formal analysis, O.B., M.D. and C.N.; investigation, O.B. and C.N.; resources, O.B.; writing—original draft preparation, C.N.; writing—review and editing, O.B., C.N. and M.D.; supervision, O.B.; project administration, O.B. All authors have read and agreed to the published version of the manuscript.

Funding

This research was funded by the Basque Government, Diputación Foral de Álava and UPV/EHU, respectively, through the projects EKOHEGAZ (ELKARTEK KK-2021/00092), CONAVANTER and GIU20/063.

Institutional Review Board Statement

Not applicable.

Informed Consent Statement

Not applicable.

Acknowledgments

The authors would like to express their gratitude to the UPV/EHU, the Basque Government and the Diputación Foral de Álava.

Conflicts of Interest

The authors declare no conflict of interest.

Abbreviations

The following abbreviations are used in this manuscript:
PVPhotovoltaic
MPPTMaximum power point tracking
VREVoltage reference estimator
FLCFuzzy logic controller
P&OPerturbation and observation
PWMPulse-width-modulation
PIDProportional-integral-derivative
LQRLinear quadratic regulator
SMCSliding mode control
RTIReal-time-observation
SRCStandard rating conditions
MOSFETMetal-oxide-silicon field-effect transistor
NBNegative Big
NMNegative Medium
NSNegative Small
ZZero
PSPositive Small
PMPositive Medium
PBPositive Big
MPPMaximum power point
PEMFCProton exchange membrane fuel cell
GOFGoodness of fitting
SSESum of the squared errors
RMSERoot mean squared of the errors

References

  1. Garcia, Y.; Dufo-López, R.; Bernal-Agustín, J. Energy Management in Microgrids with Renewable Energy Sources: A Literature Review. Appl. Sci. 2019, 9, 3854. [Google Scholar] [CrossRef] [Green Version]
  2. Gielen, D.; Boshell, F.; Saygin, D.; Bazilian, M.D.; Wagner, N.; Gorini, R. The role of renewable energy in the global energy transformation. Energy Strategy Rev. 2019, 24, 38–50. [Google Scholar] [CrossRef]
  3. Alsadi, S.; Khatib, T. Photovoltaic Power Systems Optimization Research Status: A Review of Criteria, Constrains, Models, Techniques, and Software Tools. Appl. Sci. 2018, 8, 1761. [Google Scholar] [CrossRef] [Green Version]
  4. Yau, Y.T.; Hwu, K.I.; Tai, Y.K. Active Clamp Boost Converter with Blanking Time Tuning Considered. Appl. Sci. 2021, 11, 860. [Google Scholar] [CrossRef]
  5. Elbaksawi, O. Design of Photovoltaic System Using Buck-Boost Converter based on MPPT with PID Controller. Univers. J. Electr. Electron. Eng. 2019, 6, 314–322. [Google Scholar] [CrossRef]
  6. Aouani, N.; Olalla, C. Robust LQR Control for PWM Converters with Parameter-Dependent Lyapunov Functions. Appl. Sci. 2020, 10, 7534. [Google Scholar] [CrossRef]
  7. Arora, S.; Balsara, P.T.; Bhatia, D.K. PBC for direct voltage regulation for the boost DC–DC converter. IET Power Electron. 2019, 12, 1942–1951. [Google Scholar] [CrossRef]
  8. Liao, Z.X.; Luo, D.; Luo, X.S.; Li, H.S.; Xiang, Q.Q.; Huang, G.X.; Li, T.H.; Jiang, P.Q. Nonlinear Model and Dynamic Behavior of Photovoltaic Grid-Connected Inverter. Appl. Sci. 2020, 10, 2120. [Google Scholar] [CrossRef] [Green Version]
  9. Abusorrah, A.; Al-Hindawi, M.M.; Al-Turki, Y.; Mandal, K.; Giaouris, D.; Banerjee, S.; Voutetakis, S.; Papadopoulou, S. Stability of a boost converter fed from photovoltaic source. Sol. Energy 2013, 98, 458–471. [Google Scholar] [CrossRef]
  10. Rosa, A.H.R.; Silva, M.B.E.; Campos, M.F.C.; Santana, R.A.S.; Rodrigues, W.A.; Morais, L.M.F.; Seleme, S.I., Jr. SHIL and DHIL Simulations of Nonlinear Control Methods Applied for Power Converters Using Embedded Systems. Electronics 2018, 7, 241. [Google Scholar] [CrossRef] [Green Version]
  11. Remoaldo, D.; Jesus, I. Analysis of a Traditional and a Fuzzy Logic Enhanced Perturb and Observe Algorithm for the MPPT of a Photovoltaic System. Algorithms 2021, 14, 24. [Google Scholar] [CrossRef]
  12. Kamran, M.; Mudassar, M.; Fazal, M.R.; Asghar, M.U.; Bilal, M.; Asghar, R. Implementation of improved Perturb and Observe MPPT technique with confined search space for standalone photovoltaic system. J. King Saud Univ. Eng. Sci. 2020, 32, 432–441. [Google Scholar] [CrossRef]
  13. Pei, Z.; Jing, H.; Tang, Z. Modeling and Test Results of an Innovative Gyroscope Wave Energy Converter. Appl. Sci. 2021, 11, 4359. [Google Scholar] [CrossRef]
  14. Chowdhury, D.; Hasan, K.; Khan, M.Z. Islanded DC Microgrid Architecture with Dual Active Bridge Converter Based Power Management Units and Time Slot Based Control Interface. IEEJ Trans. Electr. Electron. Eng. 2019, 15, 863–871. [Google Scholar] [CrossRef]
  15. Li, B.; Tang, W.; Xiahou, K.; Wu, Q. Development of Novel Robust Regulator for Maximum Wind Energy Extraction Based upon Perturbation and Observation. Energies 2017, 10, 569. [Google Scholar] [CrossRef] [Green Version]
  16. Zhu, Y.; Kim, M.K.; Wen, H. Simulation and Analysis of Perturbation and Observation-Based Self-Adaptable Step Size Maximum Power Point Tracking Strategy with Low Power Loss for Photovoltaics. Energies 2019, 12, 92. [Google Scholar] [CrossRef] [Green Version]
  17. Gil-Velasco, A.; Aguilar-Castillo, C. A Modification of the Perturb and Observe Method to Improve the Energy Harvesting of PV Systems under Partial Shading Conditions. Energies 2021, 14, 2521. [Google Scholar] [CrossRef]
  18. Charfeddine, S.; Boudjemline, A.; Ben Aoun, S.; Jerbi, H.; Kchaou, M.; Alshammari, O.; Elleuch, Z.; Abbassi, R. Design of a Fuzzy Optimization Control Structure for Nonlinear Systems: A Disturbance-Rejection Method. Appl. Sci. 2021, 11, 2612. [Google Scholar] [CrossRef]
  19. Derbeli, M.; Farhat, M.; Barambones, O.; Sbita, L. Control of PEM fuel cell power system using sliding mode and super-twisting algorithms. Int. J. Hydrogen Energy 2017, 42, 8833–8844. [Google Scholar] [CrossRef]
  20. Derbeli, M.; Barambones, O.; Farhat, M.; Ramos-Hernanz, J.A.; Sbita, L. Robust high order sliding mode control for performance improvement of PEM fuel cell power systems. Int. J. Hydrogen Energy 2020, 45, 29222–29234. [Google Scholar] [CrossRef]
  21. Utkin, V.; Lee, H. Chattering Problem in Sliding Mode Control Systems. In Proceedings of the International Workshop on Variable Structure Systems, VSS’06, Alghero, Italy, 5–7 June 2006; pp. 346–350. [Google Scholar] [CrossRef]
  22. González-García, J.; Narcizo-Nuci, N.A.; García-Valdovinos, L.G.; Salgado-Jiménez, T.; Gómez-Espinosa, A.; Cuan-Urquizo, E.; Cabello, J.A.E. Model-Free High Order Sliding Mode Control with Finite-Time Tracking for Unmanned Underwater Vehicles. Appl. Sci. 2021, 11, 1836. [Google Scholar] [CrossRef]
  23. Derbeli, M.; Barambones, O.; Sbita, L. A Robust Maximum Power Point Tracking Control Method for a PEM Fuel Cell Power System. Appl. Sci. 2018, 8, 2449. [Google Scholar] [CrossRef] [Green Version]
  24. Mendes, J.; Maia, R.; Araújo, R.; Souza, F. Self-Evolving Fuzzy Controller Composed of Univariate Fuzzy Control Rules. Appl. Sci. 2020, 10, 5836. [Google Scholar] [CrossRef]
  25. Peraza, C.; Valdez, F.; Melin, P. Optimization of Intelligent Controllers Using a Type-1 and Interval Type-2 Fuzzy Harmony Search Algorithm. Algorithms 2017, 10, 82. [Google Scholar] [CrossRef] [Green Version]
  26. Abouchabana, N.; Haddadi, M.; Rabhi, A.; Grasso, A.D.; Tina, G.M. Power Efficiency Improvement of a Boost Converter Using a Coupled Inductor with a Fuzzy Logic Controller: Application to a Photovoltaic System. Appl. Sci. 2021, 11, 980. [Google Scholar] [CrossRef]
  27. Dawan, P.; Sriprapha, K.; Kittisontirak, S.; Boonraksa, T.; Junhuathon, N.; Titiroongruang, W.; Niemcharoen, S. Comparison of Power Output Forecasting on the Photovoltaic System Using Adaptive Neuro-Fuzzy Inference Systems and Particle Swarm Optimization-Artificial Neural Network Model. Energies 2020, 13, 351. [Google Scholar] [CrossRef] [Green Version]
  28. Ozdemir, S.; Altin, N.; Sefa, I. Fuzzy logic based MPPT controller for high conversion ratio quadratic boost converter. Int. J. Hydrogen Energy 2017, 42, 17748–17759. [Google Scholar] [CrossRef]
  29. Worighi, I.; Geury, T.; El Baghdadi, M.; Van Mierlo, J.; Hegazy, O.; Maach, A. Optimal Design of Hybrid PV-Battery System in Residential Buildings: End-User Economics, and PV Penetration. Appl. Sci. 2019, 9, 1022. [Google Scholar] [CrossRef] [Green Version]
  30. Mendel, J. Type-1 Fuzzy Systems: Design Methods and Applications. In Uncertain Rule-Based Fuzzy Logic Systems: Introduction and New Directions; Springer International Publishing: Berlin/Heidelberg, Germany, 2003; Chapter 4; pp. 229–234. [Google Scholar] [CrossRef]
  31. Napole, C.; Barambones, O.; Calvo, I.; Derbeli, M.; Silaa, M.; Velasco, J. Advances in Tracking Control for Piezoelectric Actuators Using Fuzzy Logic and Hammerstein-Wiener Compensation. Mathematics 2020, 8, 2071. [Google Scholar] [CrossRef]
  32. Phan, B.C.; Lai, Y.C. Control Strategy of a Hybrid Renewable Energy System Based on Reinforcement Learning Approach for an Isolated Microgrid. Appl. Sci. 2019, 9, 4001. [Google Scholar] [CrossRef] [Green Version]
  33. Mahmod Mohammad, A.N.; Mohd Radzi, M.A.; Azis, N.; Shafie, S.; Atiqi Mohd Zainuri, M.A. An Enhanced Adaptive Perturb and Observe Technique for Efficient Maximum Power Point Tracking Under Partial Shading Conditions. Appl. Sci. 2020, 10, 3912. [Google Scholar] [CrossRef]
  34. Charin, C.; Ishak, D.; Mohd Zainuri, M.A.A.; Ismail, B. Modified Levy Flight Optimization for a Maximum Power Point Tracking Algorithm under Partial Shading. Appl. Sci. 2021, 11, 992. [Google Scholar] [CrossRef]
  35. Al-Masri, H.M.K.; Magableh, S.K.; Abuelrub, A.; Saadeh, O.; Ehsani, M. Impact of Different Photovoltaic Models on the Design of a Combined Solar Array and Pumped Hydro Storage System. Appl. Sci. 2020, 10, 3650. [Google Scholar] [CrossRef]
  36. Nguyen-Duc, T.; Nguyen-Duc, H.; Le-Viet, T.; Takano, H. Single-Diode Models of PV Modules: A Comparison of Conventional Approaches and Proposal of a Novel Model. Energies 2020, 13, 1296. [Google Scholar] [CrossRef] [Green Version]
  37. Rusirawan, D.; Farkas, I. Identification of Model Parameters of the Photovoltaic Solar Cells. Energy Procedia 2014, 57, 39–46. [Google Scholar] [CrossRef] [Green Version]
  38. Anani, N.; Ibrahim, H. Adjusting the Single-Diode Model Parameters of a Photovoltaic Module with Irradiance and Temperature. Energies 2020, 13, 3226. [Google Scholar] [CrossRef]
  39. Xiong, G.; Zhang, J.; Yuan, X.; Shi, D.; He, Y. Application of Symbiotic Organisms Search Algorithm for Parameter Extraction of Solar Cell Models. Appl. Sci. 2018, 8, 2155. [Google Scholar] [CrossRef] [Green Version]
  40. Stornelli, V.; Muttillo, M.; de Rubeis, T.; Nardi, I. A New Simplified Five-Parameter Estimation Method for Single-Diode Model of Photovoltaic Panels. Energies 2019, 12, 4271. [Google Scholar] [CrossRef] [Green Version]
  41. Orioli, A.; Di Gangi, A. A Criterion for Rating the Usability and Accuracy of the One-Diode Models for Photovoltaic Modules. Energies 2016, 9, 427. [Google Scholar] [CrossRef] [Green Version]
  42. Torres-Salinas, H.; Rodríguez-Reséndiz, J.; Estévez-Bén, A.A.; Cruz Pérez, M.A.; Sevilla-Camacho, P.Y.; Perez-Soto, G.I. A Hands-On Laboratory for Intelligent Control Courses. Appl. Sci. 2020, 10, 9070. [Google Scholar] [CrossRef]
  43. Darcy Gnana Jegha, A.; Subathra, M.S.P.; Manoj Kumar, N.; Subramaniam, U.; Padmanaban, S. A High Gain DC–DC Converter with Grey Wolf Optimizer Based MPPT Algorithm for PV Fed BLDC Motor Drive. Appl. Sci. 2020, 10, 2797. [Google Scholar] [CrossRef]
  44. Slotine, J.J.; Li, W. Applied Nonlinear Control; Prentice Hall: Hoboken, NJ, USA, 1990. [Google Scholar]
  45. Yasin, A.R.; Ashraf, M.; Bhatti, A.I. A Novel Filter Extracted Equivalent Control Based Fixed Frequency Sliding Mode Approach for Power Electronic Converters. Energies 2019, 12, 853. [Google Scholar] [CrossRef] [Green Version]
  46. Barukcic, M.; Hederić, Z.; Špoljarić, Z. The estimation of I–V curves of PV panel using manufacturers’ I–V curves and evolutionary strategy. Energy Convers. Manag. 2014, 88, 447–458. [Google Scholar] [CrossRef]
  47. Khatib, T.; Elmenreich, W.; Mohamed, A. Simplified I-V Characteristic Tester for Photovoltaic Modules Using a DC–DC Boost Converter. Sustainability 2017, 9, 657. [Google Scholar] [CrossRef] [Green Version]
  48. Szabo, R.; Gontean, A. Photovoltaic Cell and Module I-V Characteristic Approximation Using Bézier Curves. Appl. Sci. 2018, 8, 655. [Google Scholar] [CrossRef] [Green Version]
  49. Derbeli, M.; Barambones, O.; Silaa, M.Y.; Napole, C. Real-Time Implementation of a New MPPT Control Method for a DC–DC Boost Converter Used in a PEM Fuel Cell Power System. Actuators 2020, 9, 105. [Google Scholar] [CrossRef]
  50. Chang, W.; Ji, X.; Liu, Y.; Xiao, Y.; Chen, B.; Liu, H.; Zhou, S. Analysis of University Students’ Behavior Based on a Fusion K-Means Clustering Algorithm. Appl. Sci. 2020, 10, 6566. [Google Scholar] [CrossRef]
  51. Mouapi, A.; Hakem, N.; Kandil, N. Piezoelectric Energy Harvesting Prediction and Efficient Management for Industrial Wireless Sensor. Appl. Sci. 2020, 10, 8486. [Google Scholar] [CrossRef]
  52. Hayder, G.; Solihin, M.I.; Mustafa, H.M. Modelling of River Flow Using Particle Swarm Optimized Cascade-Forward Neural Networks: A Case Study of Kelantan River in Malaysia. Appl. Sci. 2020, 10, 8670. [Google Scholar] [CrossRef]
Figure 1. Software–hardware workflow diagram.
Applsci 11 05927 g001
Figure 2. PV Model.
Figure 2. PV Model.
Applsci 11 05927 g002
Figure 3. Type-1 FLC Structure.
Applsci 11 05927 g003
Figure 4. Implementation architecture of FLC controller.
Applsci 11 05927 g004
Figure 5. Power–Voltage curve with the P&O mechanism to reach the MPP.
Applsci 11 05927 g005
Figure 6. Flowchart of P&O algorithm.
Applsci 11 05927 g006
Figure 7. PV panel characteristic curves, where: (a) voltage-current; (b) voltage–power.
Applsci 11 05927 g007
Figure 8. Reference voltage representation.
Applsci 11 05927 g008
Figure 9. VRE experiment used for the SMC, where (a) Irradiation; (b) Temperature; (c) MPP Voltage; (d) MPP Current; (e) Maximum power.
Applsci 11 05927 g009
Figure 10. VRE experiment used for FLC, where (a) Irradiation; (b) Temperature; (c) MPP Voltage; (d) MPP Current; (e) Maximum power.
Applsci 11 05927 g010
Figure 11. MPPT based on P&O: (a) Irradiation (W/m2); (b) Temperature ( C); (c) Resistance load ( V o u t / I o u t ); (d) PV voltage; (e) PV current; (f) PV power; (g) DC–DC output voltage; (h) Duty cycle.
Applsci 11 05927 g011
Figure 12. MPPT based on SMC: (a) Irradiation (W/m2); (b) Temperature ( C); (c) Resistance load ( V o u t / I o u t ); (d) PV voltage; (e) PV current; (f) PV power; (g) DC–DC output voltage; (h) Duty cycle.
Applsci 11 05927 g012
Figure 13. MPPT based FLC: (a) Resistance load ( V o u t / I o u t ); (b) PV voltage; (c) PV current; (d) PV power; (e) DC–DC output voltage; (f) DC–DC output current; (g) Duty cycle; (h) Error ( V r e f V p v ).
Applsci 11 05927 g013
Table 1. Peimar SG340P Specifications.
PropertiesValuesUnits
Dimensions156 × 156mm
Maximum power340W
Open circuit voltage45.2V
Max power voltage36.7V
Max power current9.28A
Number of cells in series6unit
Number of cells in parallel12units
I s c 9.9A
Table 2. Ingenieurbüro Si-V-10TC-T Specifications.
PropertiesValuesUnits
Voltage supply12 to 28VDC
Irradiance measurement rangeUp to 1500W/m2
Temperature measurement range−40 to 90 C
Table 3. TEP-192 Details.
PropertiesValuesUnits
Switching frequency20kHz
Maximum input voltage60V
Maximum input current30A
Maximum output voltage250V
Maximum output current30A
Table 4. BK 8500B Specifications.
PropertiesValuesUnits
Power300
Rated Voltage500V
Rated Current15A
Input Voltage0–150V
Input Current0–15 AA
Resistance range0.05–10Ω
Table 5. FLC linguistic rules.
E ∖ E ˙ NBNSZPSPB
NBNBNMNMNSZ
NSNMNMNSZZ
ZNMNSZPSPM
PSZZPSPMPM
PBZPSPMPMPB
Table 6. Goodness and coefficient parameters of the fitting function.
GOF
SSE: 107.7R-square: 0.97Adjusted R-square: 0.97RMSE: 0.36
Coefficients with 95% confidence bounds
P 00 = 38.18 P 10 = 0.067 P 20 = 0.00057 P 30 = 1 . 389 6
P 01 = 0.088 P 11 = 7 . 207 5 P 21 = 7 . 86 7
Publisher’s Note: MDPI stays neutral with regard to jurisdictional claims in published maps and institutional affiliations.

