Abstract
Developing a bridge management strategy at the network level with efficient use of capital is very important for optimal infrastructure remediation. This paper introduces a novel decision support system that considers many aspects of bridge management and successfully implements the investigated methodology in a web-based platform. The proposed decision support system uses advanced prediction models, decision trees, and incremental machine learning algorithms to generate an optimal decision strategy. The system aims to achieve adaptive and flexible decision making while entailing powerful utilization of nondestructive evaluation (NDE) methods. The NDE data integration and visualization allow automatic retrieval of inspection results and overlaying the defects on a 3D bridge model. Furthermore, a deep learning-based damage growth prediction model estimates the future condition of the bridge elements and utilizes this information in the decision-making process. The decision ranking takes into account a wide range of factors including structural safety, serviceability, rehabilitation cost, life cycle cost, and societal and political factors to generate optimal maintenance strategies with multiple decision alternatives. This study aims to bring a complementary solution to currently in-use systems with the utilization of advanced machine-learning models and NDE data integration while still equipped with main bridge management functions of bridge management systems and capable of transferring data to other systems.
1. Introduction
Deterioration of road infrastructure arises from aging and various other factors. The aging of bridges is one of the most critical factors for a large number of underperforming bridges in the US. According to Federal Highway Administration (FHWA) and Federal Transit Administration (FTA) [1], the total number of bridges listed in the National Bridge Inventory (NBI) was 588,844 in 2000; approximately 67% of them were more than 25 years old, and 26% of them were over 50 years old. By 2015, the number increased to 611,845 bridges, and 72% of them were older than 25 years, and 38% were over 50 years old [2]. Thus, structural systems have aged to an extent that critical decisions such as repair or replacement should be made effectively. To prevent the impending degradation of these bridges, utilizing novel technologies for periodic inspection, assessment, and better management for proper maintenance has become more critical. Therefore, innovative technologies and procedures are needed to allow infrastructure owners to monitor their bridges more effectively and create optimal maintenance strategies. However, the progressive improvement on the aforementioned needs is slow, even though the existing status of the US civil infrastructure is well documented (e.g., ASCE report card [3]). One of the challenges in better managing bridges is the use of novel technologies and the integration of these technologies into the current bridge inspection and management systems in order to utilize the data necessary for optimal decision making. Sometimes the use of additional data, if not managed properly, may become a burden to the state departments of transportation (DOTs), leading to additional management and labor costs. Structural health monitoring (SHM) can be considered at local and global level monitoring. Local SHM (LSHM) evaluates the serviceability of bridges by monitoring local level defects such as cracks, delamination, corrosion, and roughness. Global SHM (GSHM), on the other hand, assesses the soundness of bridges by measuring vibration, deflection, and loading with respect to expected behavior or in comparison to its past performance. Generally, periodic LSHM data are employed for repair and maintenance work to recover the serviceability of bridges, while GSHM is conducted to make decisions for rehabilitation and replacement. Traditionally, SHM is conducted by means of visual (i.e., inspecting the structure with the naked eye to look for potholes, cracks, spalling, etc.) [4], acoustic (i.e., identifying the changes in sound pitch using a chain drag or hammer) [5], and force-based methods (i.e., understanding the overall structural behaviors using forced-vibration and load-rating tests) [6]. Both local SHM and global methods require direct access to bridges, causing extra fieldwork and time as well as a potential danger to inspectors. With the growing potential of camera-based methods, a complete noncontact SHM using NDE along with effective utilization in decision making is possible. Figure 1 summarizes the complete methodology proposed by Catbas et al. (2017) [7].
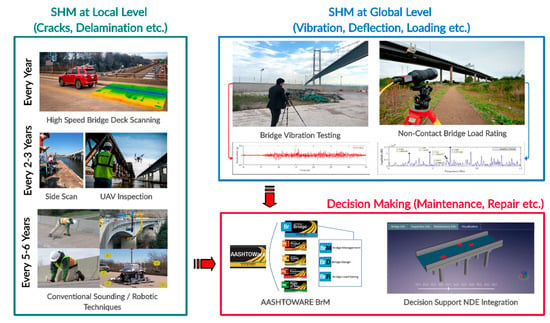
Figure 1.
SHM at local and global levels using noncontact methods and advanced decision making.
1.1. State of Practice in Bridge Management
The bridge management practice in the United States has improved significantly over the last 40 years both at the federal and state levels. At the federal level, the National Bridge Inspection Standards (NBIS) unifies the method of data collection and condition assessment on public highway bridges [8]. The collected inspection data by the state DOTs are submitted to FHWA annually in a nationwide reporting/coding format that is later entered into the NBI database [9]. Based on NBI, bridge owners are able to monitor the condition and performance of their bridges to make accurate management decisions. FHWA imposes an appraisal rating on all government-owned bridges through routine inspections that are recorded to NBI. The appraisals of bridges are carried out by scoring the bridges in three categories: structural adequacy and safety, serviceability and functional obsolescence, and essentiality for public use. After the scores in these categories are summed, special reductions are made. The resultant score will give the sufficiency rating that could be used for ranking bridges for infrastructure management. The sufficiency rating in NBI’s bridge appraisals basically receives input from local and global assessments as well as some additional parameters. At the state level, state DOTs may have different procedures regarding bridge asset management, funding, maintenance considerations, and resource allocation. A comprehensive National Cooperative Highway Research Program (NCHRP) synthesis report published by the Transportation Research Board (TRB) puts out the differences in state practices and explains the reasons of the variety in the bridge management practices mainly on the following issues: the differences in the policy, financial, technical and institutional operations as well as the different approaches to planning, programming and budgeting [10]. According to the interviews conducted within the synthesis study, mixed centralized and decentralized management strategies are followed in many agencies. In contrast to the bridge replacement and rehabilitation projects, which can be funded by the federal Highway Bridge Program (HDP) and thus are centralized, the maintenance and repair projects are decentralized by being funded internally. In order to maintain communication between centralized and decentralized decisions, many states employed a bridge management system (BMS), which incorporates detailed state procedures at the element level and NBIS requirements at the federal level [11]. Although BMS has limited use toward decision making, state agencies find it helpful in terms of compilation of data and display of short-term and long-term information [12]. According to the NCHRP study, the characteristic use of BMS for state DOT decision making is analyzed as follows:
- Technical aspects in the decision making such as condition assessment and performance assessment are mainly held in BMS rather than economic and social analyses that involve life cycle cost analysis, social impact analysis, etc.;
- The decision making based on BMS output is generally for short-term rather than long-term purposes, and the recommended actions are not proactive of future predicted conditions by lacking predictive models and scenario analysis;
- The decision-making models usually do not recommend multiple action strategies with a comparative analysis.
1.2. Long-Term Decision Making
The implementation of proper infrastructure management has become crucial due to the fact that the US infrastructure has deteriorated significantly in the last decade. Advanced remediation strategies for deteriorated infrastructures are being developed using certain decision-making models in order to maintain the optimal funding use and remediation time [13]. To prevent the impending degradation of bridges, utilizing novel technologies for periodic inspection, assessment, and better management for proper maintenance has become more critical. Although the inclination to use conventional inspection methods still persists, advanced sensing technologies have the ability to better understand the current condition with more resolution and accuracy [14]. For this reason, better utilization of NDE as routine inspection practice becomes necessary. Optimized decision making based on the NDE input can be carried out by integrating utilization solutions to bridge management frameworks. Karaaslan (2018) designed a decision support framework to retrieve information from novel NDE techniques including vision-based technologies (e.g., infrared thermography, other imagery data) and perform network-level decision analysis using both NBI’s inputs and automatically retrieved inspection data from NDE [15]. The framework implemented a condition prediction methodology introduced by Hiasa et al. (2018) [16]. The methodology used the infrared thermography (IRT) data from the deck surface collected over a period of 10 years to provide critical information on how local delamination can potentially impact the integrity of the overall structure, as described in Figure 2. It will be possible to conduct time history prediction on the data to determine the optimal timeline of the necessary maintenance/repair actions.
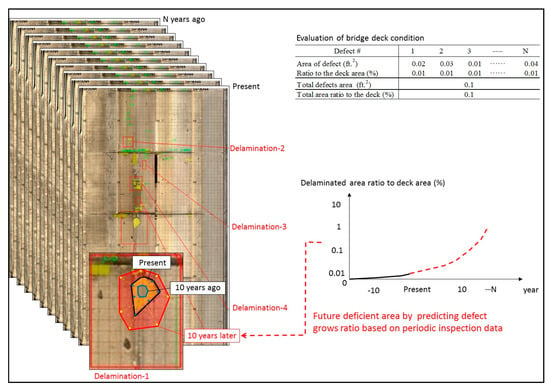
Figure 2.
Example utilization of NDE for bridge management [16].
Recent studies focused on innovative structural sensors and methodologies to analyze the collected sensor data. Ozer (2019) used vibration measurements from smartphones to identify the modal frequencies of existing bridges [17]. Ghiasi et al. (2021) developed a data analytics approach to handle the uncertainty of sensor data used in structural damage identification [18]. Noori et al. (2020) performed a system reliability assessment of cable-supported bridges using deep belief networks [19]. As new NDE methods and novel sensing technologies are becoming important tools in SHM research and practice, the decision support systems have also undergone dramatic improvements in the last decade with the employment of intelligent systems and sensor monitoring. Machine learning (ML) and artificial intelligence (AI) started to play an important role in decision making. Many researchers have recently proposed AI-based decision support systems for infrastructure management. For instance, Yin (2010) developed an intelligent decision support system that quantifies the inspection data and evaluates the deterioration of the existing bridges, in addition to providing an optimum bridge monitoring plan for advanced management according to the project budget and timeline [12]. Quintela (2007), as another example, presents a real-time decision support system for civil engineering structures that makes use of prediction models using artificial neural networks and data mining techniques. The system occupies real-time sensors to verify the accuracy of the employed prediction models [20]. In a different angle, Jiao (2013) proposed an unsupervised performance evaluation strategy for bridges using fuzzy clustering on health monitoring data [21]. With the proposed strategy, the bridge condition can be assessed by calculating the fuzzy nearness. Lee (2008) addresses the problems of slow adoption of bridge management systems and impractical future prediction of bridge conditions. The study proposes an artificial neural network-based prediction algorithm called the backward prediction model to treat the inconsistency in BMS inputs and bridge agencies’ existing data [22]. Bocchini (2013) develops a simple Markov chain model for life cycle analysis of bridge networks. The proposed model included the effect of deterioration, maintenance actions, bridge failures, and rehabilitation [23]. These studies aim to solve bridge management problems using pre-deep learning techniques (i.e., classical machine learning and clustering techniques).
2. Materials and Methods
The decision support framework proposed in this study has a multicomponent structure in which different bridge management operations will communicate with each other. As described in Figure 3, the proposed system uses the condition assessment data obtained with NDE and predicts the future condition of the bridge by utilizing historical information. The deep learning-based prediction model is deployed on a cloud server and predicts the future condition of the bridge components by processing the periodically collected NDE data. The decision support component utilizes an adaptive decision ranking methodology, which prioritizes the bridges based on a variety of factors that are grouped in three categories: safety, serviceability, importance. The ranking uses a similar methodology to FHWA’s bridge appraisals and expands the rating factors to include the future predicted condition and the life cycle cost. Furthermore, the ranking methodology implements a deep learning system that will adapt the ranking factors to the practice of the infrastructure owner by fine-tuning the decision weights. The system will maintain synchronization with the NBIS database and bridge management software to generate data for fine-tuning the deep learning models for improved performance. Lastly, the maintenance decision component generates multiple maintenance decision strategies for the prioritized bridges while optimizing the cost and performance. This proposed methodology for an enhanced decision support system is a first-step framework that aims to utilize the state-the-art applications of artificial intelligence, and the system will require an extended duration of development, testing, and verification before it can be effectively used in the bridge inspection practice.
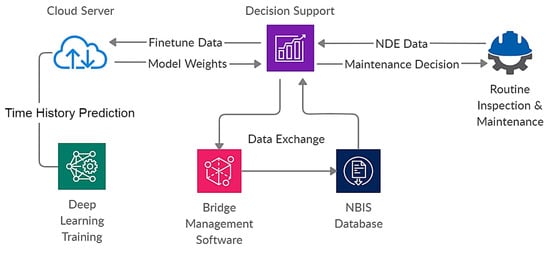
Figure 3.
System component diagram of the proposed decision support system (NDE data collected from a routine inspection are sent to decision support system, analyzed at the cloud-based deep learning instance, and synchronized with other platforms. After completion of decision analysis, maintenance strategies are generated).
The proposed infrastructure support methodology was implemented in web-based framework that uses a powerful backend platform named SageMaker, a cloud computing service operated by Amazon, to perform the deep learning-based predictions [24]. A fully functional graphical user interface was also developed to test the system components, as shown in Figure 4.
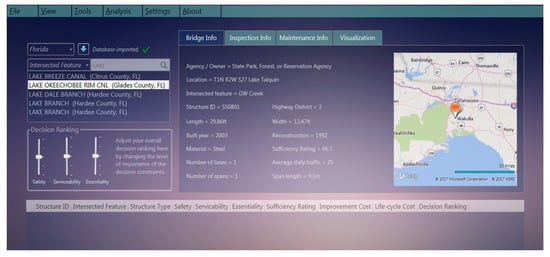
Figure 4.
Web-based software implementation of the decision support framework (bridge information retrieval).
The proposed system is aimed to serve as more than a decision-making tool: an integrated system that can make NDE much more beneficial and effective by retrieving data automatically and transferring it to the widely used bridge management software. Our proposed innovative decision support system aims to accomplish the following:
- ■
- Processing the bridge inventory data of both public and private agencies to retrieve necessary bridge information used in decision support components (e.g., bridge condition, historical data, geolocation);
- ■
- Retrieving local element inspection data directly from NDEs such as Infrared Thermography (IRT), Ground Penetration Radar (GPR), laser scanning, remote sensing, and drone inspections;
- ■
- Element condition assessment based on the quantified damage information and Health index (HI) calculation of the structure. Analysis of historical element condition states to predict the future condition using a time series forecasting model that estimates the damage growth;
- ■
- A novel, adaptive decision ranking implementation for bridge maintenance decisions using bridge appraisals and a deep learning-based ranking algorithm;
- ■
- Adapting the infrastructure owner’s maintenance practice through periodic model updates to fine-tune the decision ranking weights using automatically generated data from users’ decision actions;
- ■
- Decision tree implementation to produce maintenance/repair strategies with alternative actions and associated cost calculation;
- ■
- Damage visualization on realistic 3D bridge model with a timeline feature demonstration of both past and future conditions;
- ■
- Data exchange and synchronization with infrastructure owner’s bridge management software and the NBI database.
The novel decision support framework discussed in this paper uses bridge deck deterioration as an example; however, the methodology applies to any bridge component. After the system integrates the NDE data for all bridges in a defined transportation network, the condition history of each bridge component (i.e., deck, columns, railings, girders) is used to calculate the structural health index of the bridge. Then, the system predicts the future condition of each component using a deep learning-based approach (a cracking defect was shown in the paper as an example, but it can easily be applied to other deterioration modes). Before the system generates maintenance decisions, the bridges in the network are ranked using a deep learning-based ranking model. Lastly, the decision strategies are generated for these prioritized bridges. The proposed system will, however, possess limitations in updating the ranking if the bridge owner prioritizes a certain bridge for an unfactored decision (e.g., impact on the bridge or flooded bridges on water) in which the periodic inspection using NDE fails to provide enough data.
2.1. Integration of Nondestructive Evaluation Data
Effective utilization of NDE data is important for the decision support system to generate objective and reliable decision strategies. The quantified information from NDE can be utilized by machine learning models to make very accurate predictions. The goal in integrating NDE data into the bridge management framework is primarily to overlay the local defects on the bridge components and use the converted data in the LSTM model for defect growth prediction. To integrate the NDE data in the system, the data frames are encoded in XML format, which is also compatible with FHWA’s Robotics Assisted Bridge Inspection Tool (RABIT™) [25]. As shown in Figure 5, the data frame is composed of header information about the structure and the readings with x and y locations.
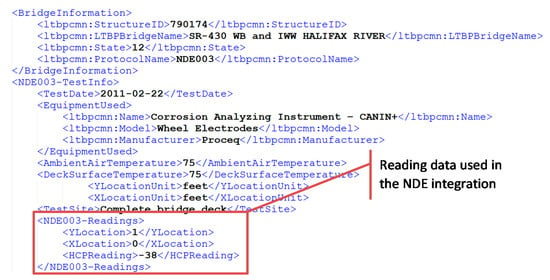
Figure 5.
Example NDE data collected from a bridge deck (electrical resistivity).
A standardized format for NDE data is important for successful communication between different technologies. However, with many types of NDE equipment, manufacturers, data formats, creating such a standardized format is difficult in the near term. Over time, manufacturers will start supporting a specific export format if a certain bridge management system becomes widely adopted. Visualizing NDE data is also important for inspectors to make better decisions. Therefore, a decision support system should also be capable of reading the point data to overlay damage information on a 3D bridge model. In the implemented web-based platform, NDE inspection data can be retrieved by either uploading exported NDE files from IRT, GPR, Ultrasound, LIDAR, UAV, etc., or via manual entry of visual inspection reports. The visualization module in the software implementation displays the imported NDE data in an inspection timeline, allowing the infrastructure owner to investigate the damage condition at different time steps (see Figure 6).
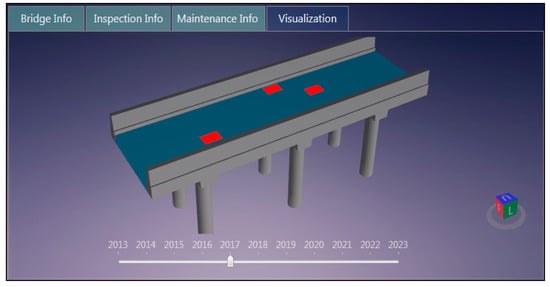
Figure 6.
Visualization of NDE data and overlay of damage information.
For a rational and quantifiable condition assessment, it is very important to use a bridge management plan that can generate remediation strategies for different bridge inspection practices [26]. The proposed decision support system can integrate NDE data and calculate element condition states according to major bridge inspection guides (e.g., AASHTO, FHWA, state DOT inspection guides). However, for most inspection guides, the condition state limits need to be quantified for effective utilization of NDE. After NDE data are successfully imported and condition states are determined, the proposed system calculates an important decision ranking parameter, bridge health index to determine overall structural health of the bridge. Health index (HI) is calculated for each year using Equation (1). This equation was first introduced in a TRNews article [27]. HI is defined as the ratio of the current element value (CEV) to the total element value (TEV) on the bridge.
The implemented web-based tool uses element condition state limits defined by AASHTO Guide Manual for Bridge Element Inspection [28] and calculates the Health index for each inspection year, as shown in Figure 7. In the implemented system, the element inspection data can easily be exported to formats compatible with federally used bridge management software such as AASHTOWare BrM [29] and LTBP InfoBridge [30].
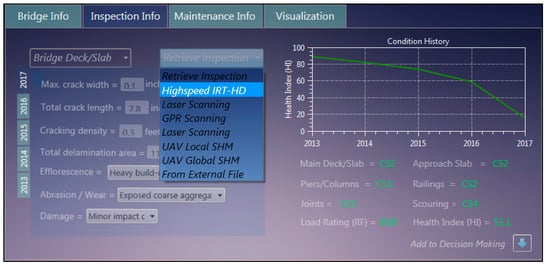
Figure 7.
Web-based implementation analyzing historical NDE data.
2.2. Deep Learning-Based Prediction of Deterioration Growth
Past bridge inspection data, along with maintenance/repair information, constitute the basis of predicting future conditions of bridge elements or components. The condition of bridge elements innately possesses a significant amount of uncertainty, partly due to inaccurately entered or missing inspection records [26]. In the proposed methodology, a deep learning model tackles the uncertainty related to future condition prediction problems by using time history prediction on the NDE data. In the proposed methodology, the hybrid architecture of convolutional neural networks (CNN) and long-term short memory (LSTM) models is periodically trained on the historical NDE data. The proposed network architecture is called CNN–LSTM, a deep learning model that fuses CNN and LSTM to predict image-based information in a future time step [31]. LSTMs are a very promising solution to sequence- and time series-related problems [32]. They can effectively handle time lags between data points, as opposed to recurrent neural networks (RNNs) [33]. Hence, the data do not have to be collected at a fixed time step. As shown in Figure 8, a common LSTM architecture is composed of a cell (the memory part of the LSTM unit) and three regulators, usually called gates, maintaining the flow of information through input, output gate, and a forget gate [34]. These gates can learn which data in a sequence are important to keep or throw away. By doing that, it can pass relevant information down the long chain of sequences to make predictions. LSTMs have been successfully used in many real-life applications such as speech recognition [35], forecasting stock prices [36], and estimating cancer growth [37].
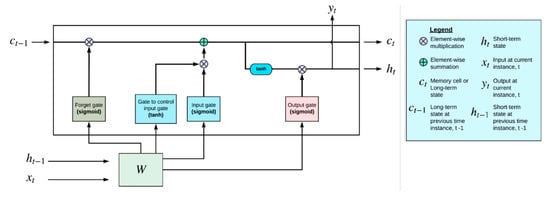
Figure 8.
Diagram of a typical LSTM cell [38] (when data are received, input gate controls what information is stored in the long-term state, forget gate determines how long the stored information is preserved across the time instances, and lastly, the output gate controls the requested information at a particular time step).
CNNs are special types of deep neural networks that work remarkably well on image data. These models have shown breakthrough performance in especially image classification tasks (e.g., 2012 ImageNet Competition) [39]. CNN-based image analysis of infrastructure damage has been vastly studied in the past [40,41]. As shown in Figure 9, the CNN models are typically composed of convolution, activation, and pooling layers. In the convolution layers, the input images are multiplied by small distinct feature matrices (i.e., kernel) that are attained from the input images. By convolving images, simply similarity scores are assigned between every region of the image to find the distinct features. After convolution, the negative values of similarity in the image matrix are removed in the activation layer. Finally, the resultant image matrix is reduced to a very small size and added together to form a single vector in the pooling layer.
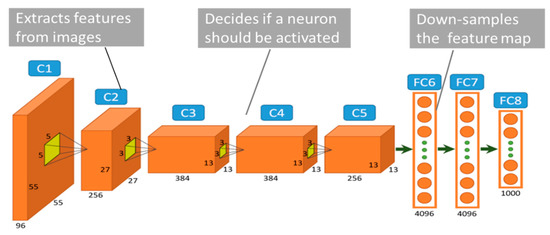
Figure 9.
A commonly used convolutional neural network—AlexNet [39].
The proposed hybrid architecture (CNN–LSTM) works as follows: CNN–LSTM inputs the NDE data as an image format and passes it through the convolutional layers of CNN, in which the underlying spatial features are extracted and stacked in a one-dimensional vector. Then, the LSTM cells receive these feature vectors and make a prediction at a point in time. While the CNN branch of the model extracts the spatial relationships, LSTM creates a temporal context. Thus, these hybrid architectures are often called spatial-temporal neural networks. An important advantage of CNN–LSTM is that a time series prediction of spatial data can be performed in a single, end-to-end system instead of using two separate suboptimal systems. In the example shown in Figure 10, crack images belonging to inspections at different years are processed first in the CNN layers. The spatial features of crack deterioration extracted from CNN are then stored in LSTM cells. The output gate of the cell gives the predicted condition of the crack at the requested point of time.
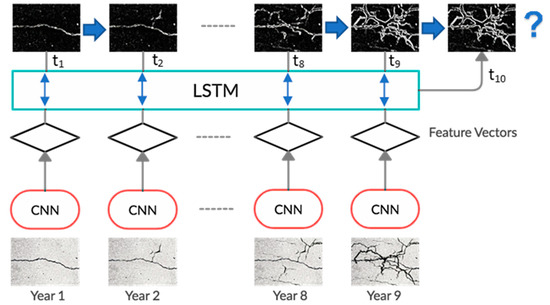
Figure 10.
CNN–LSTM model for time history prediction of future damage condition.
The proposed methodology for damage condition prediction was implemented using Keras, a high-level deep learning library written in Python [42]. However, the implementation lacked training data due to the unavailability of periodic NDE datasets over a certain period. Therefore, the implemented model used pretrained weights from known public datasets, followed by an updated schema with accurate weights as NDE data are entered into the system, and the model is fine-tuned (i.e., transfer learning). A real-world dataset of periodic NDE data is currently being collected from different sources including the Florida Department of Transportation (FDOT) and FHWA. When the real-world dataset becomes available, a comprehensive performance evaluation will be carried out to measure the model accuracy.
2.3. Adaptive Bridge Decision Ranking
For optimal bridge management, it is very important to make network-level decisions that take into account all bridges in a transportation network. There is always limited capital to be spent in maintenance and repair. Therefore, the bridges have to be prioritized based on their importance and the capital needs for improvement. In the proposed decision support methodology, all bridges in a defined transportation network are ranked according to a wide range of criteria such as past inspection history, average daily traffic, number of alternative routes, condition growth rate, and life cycle cost. The ranking methodology also accounts for the available maintenance budget and allowed timeline as these external factors will also have a significant impact on the decision making.
Due to the complexity of optimizing the decisions within a large number of ranking criteria, a deep learning-based model was used in this study to tackle the multivariate problem in the groupwise scoring. To develop and train the model, TF-Ranking, a scalable deep learning library recently published by the Google TensorFlow team was used [43,44]. The same ranking model was already deployed in Google’s major software platforms such as Google Drive and Gmail [45]. The proposed TF-Ranking model for bridge prioritization first inputs the multivariate data in Library for Support Vector Machines (LBSVM) format [46]), then extracts features from each decision ranking criteria (i.e., factors affecting the bridge prioritization such as structural condition, repair cost, importance of location, life cycle cost, etc.). From these extracted features, a scoring function is created in the hidden layer of the neural network. During training, the weights of the scoring function are optimized using Softmax Cross Entropy, a commonly used listwise loss metric. Finally, the model is served in the SageMaker to make predictions from the raw data entries. Figure 11 describes the TF-Ranking model used in the proposed decision support system.
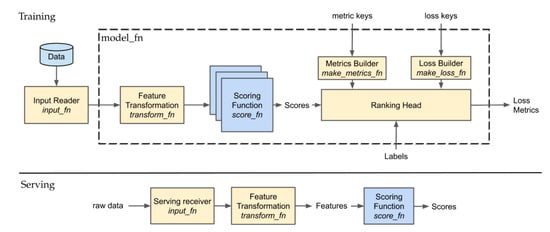
Figure 11.
TF-Ranking model to prioritize bridges based on multi-criteria decision factors [44] (the prepared training data are fed into the model, deep features of ranking create a scoring function, and the model is evaluated using the defined loss metrics. Lastly, the trained model is served, and ranking scores are predicted from the input raw data).
The major challenge in deep-learning-based ranking models for infrastructure decision making is the unavailability of supervised training data. These data would require example rankings prepared by a large number of inspectors from many different bridges. Therefore, a different strategy was followed in this study to generate the necessary training data. The TF-Ranking model was initialized by training with an artificial dataset. First, the bridges are scored based on the factors affecting the maintenance decision. The scoring method uses NBI’s sufficiency rating as the basis but extends the ranking to include also bridge life cycle cost, current health index calculated from NDE, future predicted health index, and available maintenance/repair budget. The scored bridges are used as initial training data for the TF-Ranking model. However, the model will not learn the covariate features in the bridge prioritization since the scoring was made independently for bridges. Therefore, the model needs to be fine-tuned via incremental learning. As inspectors use the decision support system, the inspector’s alterations in the prioritizations are used as finetuning data. The system will then gradually improve and adapt the infrastructure owner’s practice.
The sufficiency rating in NBI’s bridge appraisals receives input from local and global assessments as well as some additional parameters [47]. Similarly, the appraisals of bridges in this study are carried out by scoring the bridges in three categories: safety, serviceability, and essentiality. After the scores in these categories are summed, special reductions are made. The resultant score will give the sufficiency rating that could be used for ranking bridges for infrastructure management (priority ranking if the resultant score is subtracted from 100). First, the structural adequacy score is calculated by subtracting the score reductions from the overall condition rating and load capacity. The attained Rating Factor (RF) value from the load-rating test is input in Equation (2) to find the safety score [48].
Safety score cannot be less than zero and larger than 55. CR indicates the condition reduction for the lowest condition rating of the bridge components. The condition rating r in the scale of 0–9 is found, as discussed by Sobanjo (2008). The study proposes a translation from element condition ratings to NBI’s component ratings [49]. Thus, the value of CR is determined for varied conditions as follows:
- ■
- Critical condition and worse (r < 2) → CR = 55;
- ■
- Serious condition (r = 3) → CR = 40;
- ■
- Poor condition (r = 4) → CR = 25;
- ■
- Fair condition (r = 5) → CR = 10.
Serviceability score in Equation (3) is calculated based on the geometry of the structure, deck condition, structural evaluation, average daily traffic, and structure type.
Serviceability score cannot be less than zero and larger than 30. SR indicates structural rating in which the rating scores from deck condition, structural evaluation, deck geometry, underclearances, waterway adequacy, and approach road alignment are summed. The total reductions in the structural rating cannot be greater than 13%. RS is determined based on the roadway sufficiency, which is calculated using average daily traffic (ADT) and road width. The per lane averages of ADT and road width are used as reference values to determine the score reduction. Finally, vertical clearance (VC) is another rating parameter for serviceability. For insufficient vertical clearance, a score reduction of 2% is applied. The detailed calculation steps of these reductions are explained in the FHWA’s appraisal guide in Appendix D [48].
Bridge importance score is calculated based on the average daily traffic value (ADT), detour length (DL), and and , as in Equation (4).
Bridge importance score cannot be less than 0 and more than 15. In addition, there is also a special reduction score , which is calculated based on detour length, structure type, and traffic safety features of the bridge, as shown in Equation (5).
Special reduction score cannot be less than 0 and more than 13. The FHWA’s bridge appraisals guide defines the structure type reduction STR as 5% for the structure types 10, 12, 13, 14, 15, 16, or 17; and the traffic safety reduction TSR as 1–3% based on the number of available traffic safety features (i.e., transitions, approach guardrail, and guardrail end) [48].
Decision ranking (DR) score extends the NBI’s sufficiency rating in the way that it takes life cycle cost (LCC) into account and also offers flexibility to infrastructure owners’ decision practice. The resultant score is calculated by summing individual scores that are adjusted by the weight factors ,, and , and multiplying it by the bridge value index (VI). VI considers the life cycle cost of the bridge in the decision ranking, as explained further in Equation (7). The default values of the weight factors are equal to 1.0. is calibrated based on the current and predicted future Health index. However, the infrastructure owners can adjust them according to their own decision considerations (political pressure, higher serviceability concern, etc.) and the decision support system will create a ranking score function and will optimize these parameters accordingly. The decision ranking is calculated in Equation (6) as follows:
Using a life cycle cost analysis, it is possible to comprehensively evaluate the total generated environmental impact for a product and understand the trade-offs in impacts between different periods in the product’s life cycle [50]. Catbas et al. (2008) investigated structural health monitoring approaches for life cycle management of bridges [51]. The life cycle cost analysis of bridges is explained in detail in the National Cooperative Highway Research Program (NCHRP Report 483, 2002) report by Transportation Research Board [52]. Mohammadi et al. (1995) simplified the bridge life cycle cost (BLCC) and used a single parameter to quantify the bridge decision-making process in an optimal scheduling scheme [53]. Three major elements constitute the life cycle cost: (1) bridge condition rating, (2) costs associated with various bridge projects, and (3) bridge service life expectancy. Equation (7) shows the calculation of the life cycle cost of bridges.
In Equation (7), is the bridge value index of the component with the lowest condition rating r, t indicates bridge service life expectancy, and c stands for maintenance cost. The calculated life cycle cost is an important decision parameter because infrastructure owners often prefer building a new bridge instead of repairing the old one in case the bridge repair cost is very high. Therefore, the life cycle cost was also included in the decision ranking.
2.4. Decision Strategy Generation
Maintenance, repair, and rehabilitation of deteriorating bridge structures may require very costly remediation actions. Advanced decision support systems aim to reduce remediation costs by preventing the costs that are associated with the subjectivity of decision making [13]. In the proposed decision support methodology, a multicriteria maintenance strategy was used to generate the optimal maintenance actions that are specific to each infrastructure owner’s maintenance practice. Decision trees are created for each single deterioration mode with multicriteria optimization. The multicriteria selection strategy is the simplified implementation of the methodology introduced by S. A. Dabous and S. Alkas (2008). In the decision algorithm, multiple criteria are connected to four main action categories: replacement, major rehabilitation, minor rehabilitation, and routine maintenance [54]. The maintenance actions are determined after checking the associated criteria, as described in Figure 12. The authors also introduced a ranking methodology that provides score values for each criterion based on the rehabilitation strategy options.
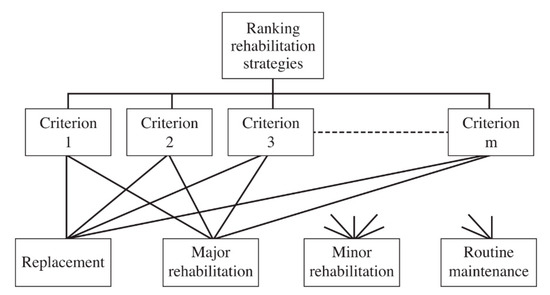
Figure 12.
Multicriteria selections of maintenance actions for bridge decks [54].
This study integrates the described multicriteria decision selection in a more simplified way by taking into account the decision rankings directly predicted from the deep learning-based model. For each rehabilitation strategy, the decision ranking score is updated, and top strategies are suggested to the infrastructure owner.
3. Results
The artificial data for initial training were created from the ranking methodology discussed throughout this section. An example set of data was created from Florida’s NBI bridges. The data were split into different congressional districts to represent the separate transportation networks. The training data have the following features in columns: structural adequacy, serviceability, bridge importance, bridge value index, and available fund. The values for district available funds were obtained from the FDOT 2019 Work Program Instructions report, under District Bridge Repair and Rehabilitation Funds [55]. A small sample from the generated data is shown in Table 1.

Table 1.
A small sample from the generated data showing bridges from different districts.
The TF-Ranking model was trained on the generated dataset only for 15,000 steps to initialize the model without causing overfitting. The model will gradually improve in the deployed decision support system and incrementally learn the valuable deep features of the ranking methodology as the infrastructure owner makes changes in the ranking orders. The training performance of the model is shown in Figure 13. Training loss indicates how successfully the model converged with the training batches of the data at each step. The evaluation metric that was used in the model is normalized discounted cumulative gain (NDCG), a commonly used metric to measure ranking quality [56].
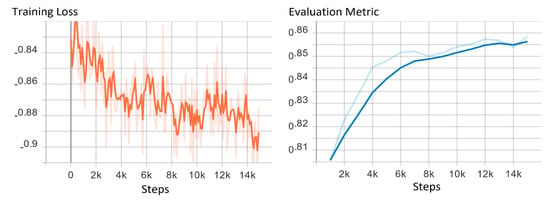
Figure 13.
Training results of the TF-Ranking model using the generated dataset.
Since the ranking data used in the training was generated from an analytically defined mythology, the TF-Ranking model easily fits the data during training, yet will not perform well on real-life ranking without a fine-tuning. As real data arrives, the model will improve incrementally.
The decision selection was implemented inside the decision trees, allowing each deterioration mode to be analyzed inside decision loops. Once the strategy is selected and the funding availability is approved, detailed maintenance actions are automatically generated. An example decision action tree for bridge deck concrete cracking according to maintenance practice of FDOT is given in Figure 14. The maintenance practice is based on the FDOT Bridge Maintenance and Repair Handbook [57]. In the decision tree, first, the condition of the cracking is determined, and then the availability of funding is checked through the decision ranking. Until the bridge reaches the target priority, the associated maintenance actions are awaited. Once the funding becomes available (i.e., the bridge falls inside the target ranking), conditional maintenance actions are suggested to the infrastructure owner. For instance, minor cracking damage on the deck surface can be repaired using a liquid sealer if there are many cracks. On the other hand, a moderate crack should be repaired with pressure injection if the sealing was not previously made.
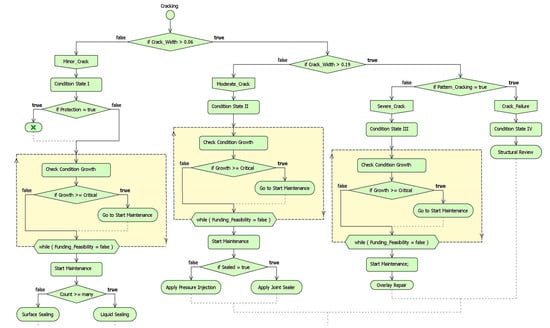
Figure 14.
Example maintenance action tree for concrete bridge deck cracking based on FDOT’s practice.
The maintenance strategy generation was also integrated into the web-based system implementation, as shown in Figure 15. The system automatically generates suggested maintenance/repair strategies based on the predefined repair pricing input and the decision tree algorithm used for each deterioration mode. However, it is possible to generate optional strategies based on different decision criteria selection. The system will modify the suggested maintenance actions. The user can also manually change a particular action in the maintenance suggestions and update the cost calculation according to the user-defined unit price list. The maintenance suggestions and the corresponding unit costs were obtained from NCHRP Final Report 668, “Framework for a National Database System for Maintenance Actions on Highway Bridges” [58]. In the shown example, the NDE data belonging to high-speed IRT deck scanning were imported to the system, and the suggested maintenance actions for cracks and spalling were automatically generated using the decision trees (it was assumed that this bridge was assumed high priority in the decision ranking). Then, a cost summary is shown to the user indicating the individual cost items for each maintenance action. In this particular NDE inspection, repair for spalling was shown as the major cost item.
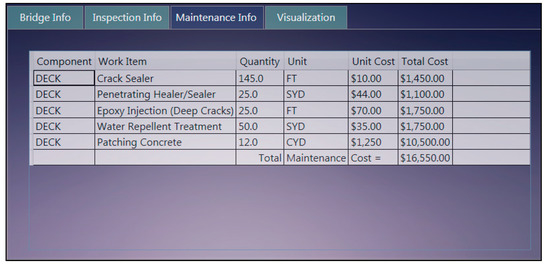
Figure 15.
Maintenance cost analysis module in the software implementation of the decision support system.
The enhanced decision support system introduced in this study benefits from novel approaches at multiple levels. When the NDE data are integrated into the system, a powerful deep neural network, CNN–LSTM model predicts the future state of each concrete defect based on the historical NDE input. Another novel approach used in the proposed decision support methodology is that a deep learning-based ranking model, TF-Ranking, prioritizes the bridges for maintenance/repair based on a large variety of factors including bridge assessment history, bridge importance for state traffic, structural condition, serviceability, repair cost, life cycle cost, repair time and funding availability. These factors are grouped under structural adequacy, serviceability, importance, and funding. The adaptive ranking model bases the NBI’s bridge sufficiency rating methodology but expands the evaluation metrics to account for the life cycle cost and the future element condition. The system also allows infrastructure owners to calibrate the weight factors for different ranking categories; thereby gives more control over the decision. The TF-Ranking model will quickly adapt the bridge maintenance practice of the infrastructure owner as new training data for fine-tuning are generated automatically from the decision makers’ priority adjustments.
4. Discussions
An advanced decision support methodology is essential for bridge management in state transportation networks since bridge structures may require major repairs over time if a proper management strategy is not followed due to limited maintenance budget and time. For that reason, many bridge management systems have been designed so far to help decision makers in creating optimal strategies. Yet, in most cases, these systems have become too complicated and lack functionality for the infrastructure owner. First time in this study, CNN–LSTM, a hybrid neural network, was used to predict the future condition of bridge elements/components. Unlike other machine learning algorithms, CNN–LSTM can use both the spatial and temporal properties of the bridge deterioration. The infrastructure support system presented in this paper, however, offers a practical and easy adoption of complex bridge management models by requiring only a few inputs from the user. The system creates a powerful integration with NDEs and thereby entails easy input of inspection data to bridge management systems. Hence, the system serves as a functional support tool that can connect to NDE technologies and enables extended support for currently in-use bridge management systems by reducing the time for data entry. Within an acceptable uncertainty range, the proposed system shows that the use of NDEs has the potential to become routine inspection practice when integrated with bridge management combined with benefits such as reduced cost and time of inspection. Although the methodology was investigated for bridges, it can be applied to all civil infrastructures. This study applied the methodology to only a small number of bridges listed in the NBI database. The system introduced in this study has to be used by the infrastructure owner over a period of time until the ranking provides the desired accuracy; therefore, the initial rankings will not demonstrate adaptive behavior.
Although many advanced studies in bridge management provide good insight about optimal management of bridges, they have unfortunately no real-life implementation. This paper uses effectively some of these insights yet updates the overall methodology with recent advancements in computer science. Furthermore, the proposed system was successfully implemented in a web-based platform that uses Amazon SageMaker to perform deep learning predictions in the backend. The implementation has a robust, functional user interface and a powerful visualization module that helps bridge inspectors gain more insight into the condition of the bridge. The visualization overlays NDE data on a 3D bridge model and even demonstrates the predicted future condition of the damage visually for a selected year.
In the ongoing work, real-world defect images from visual inspections are being gathered for different years to fine-tune the condition prediction model. The model accuracy will be validated on the validation set of the collected data. In future work, the performance of the decision ranking methodology will be evaluated as real-life data are collected through a web-based, pilot implementation of the system. With the availability of periodic NDE data and real-world maintenance decisions, the proposed deep learning models will be retrained, and the performance evaluations of these models will be discussed in a detailed case study. Such a study will produce important results about the functional use of the enhanced decision support methodology introduced here and its performance on large-scale observations.
Author Contributions
Conceptualization, N.C.; methodology, E.K. and N.C.; data preparation, E.K.; writing—original draft preparation, E.K.; writing—review and editing, U.B.; supervision, N.C. All authors have read and agreed to the published version of the manuscript.
Funding
This work was partly supported by the West Nippon Expressway Company Limited (NEXCO-West). The second author acknowledges the partial support from NSF CMMI 1463493.
Institutional Review Board Statement
Not applicable.
Informed Consent Statement
Not Applicable.
Acknowledgments
The authors would like to express their sincere gratitude to NEXCO-West USA and Florida Department of Transportation, District 2 for their cooperation. The contributions from the members of UCF Civil Infrastructure Technologies for Resilience and Safety (CITRS) are appreciated.
Conflicts of Interest
The authors declare no conflict of interest.
References
- U.S Department of Transportation Federal Highway Administration (FHWA) and Federal Transit Administration (FTA). Status of the Nation’s Highways, Bridges, and Transit: Conditions and Performance. Report to Congress, 23rd ed.; 2019; FHWA-PL-20-001. Available online: https://rosap.ntl.bts.gov/view/dot/43598 (accessed on 21 May 2019).
- U.S Department of Transportation Federal Highway Administation. Deficient Bridges by Highway System; 2017. Available online: https://www.fhwa.dot.gov/bridge/nbi/no10/defbr17.cfm (accessed on 21 May 2019).
- American Society of Civil Engineers. ASCE 2017 Report Card for America’s Infrastructure; ASCE. 53 (2016). Available online: https://www.infrastructurereportcard.org/ (accessed on 21 May 2019).
- Graybeal, B.A.; Phares, B.M.; Rolander, D.D.; Moore, M.; Washer, G. Visual Inspection of Highway Bridges. J. Nondestruct. Eval. 2002, 21, 67–83. [Google Scholar] [CrossRef]
- Holford, K.M.; Lark, R.J. Acoustic emission testing of bridges. In Inspection and Monitoring Techniques for Bridges and Civil Structures; Elsevier Ltd.: Amsterdam, The Netherlands, 2005; pp. 183–215. ISBN 9781855739390. [Google Scholar]
- Chun, S.C.; Mohsen, S. Understanding Capacity Rating of Bridges from Load Tests. Pract. Period. Struct. Des. Constr. 2003, 8, 209–216. [Google Scholar]
- Catbas, F.N.; Hiasa, S.; Dong, C.; Pan, Y.; Celik, O.; Karaaslan, E. Comprehensive Structural Health Monitoring at Local and Global Level with Vision-based Technologies. 26th ASNT Res. Symp. 2017, 26, 10–21. [Google Scholar]
- FHWA. National Bridge Inspection Standards Regulations (NBIS). Fed. Regist. 2004, 69, 15–35. [Google Scholar]
- FHWA. Specification for the National Bridge Inventory; FHWA, 2014. Available online: https://www.fhwa.dot.gov/bridge/nbi/131216_a1.pdf (accessed on 21 May 2019).
- Rashidi, M.; Samali, B.; Sharafi, P. A new model for bridge management: Part A: Condition assessment and priority ranking of bridges. Aust. J. Civ. Eng. 2016, 14, 35–45. [Google Scholar] [CrossRef] [Green Version]
- Small, E.P.; Philbin, T.; Fraher, M.; Romack, G.P. Current Status of Bridge Management System Implementation in the United States. In Proceedings of the Eighth Transportation Research Board Conference on Bridge Management, Denver, CO, USA, 26–28 April 1999; TRB Transportation Research Circular 498. p. A-1/1-16. [Google Scholar]
- Yin, Z.; Li, Y. Intelligent decision support system for bridge monitoring. In Proceedings of the International Conference on Machine Vision and Human-Machine Interface, Kaifeng, China, 24–25 April 2010; pp. 491–494. [Google Scholar]
- Rashidi, M.; Samali, B.; Sharafi, P. A new model for bridge management: Part B: Decision support system for remediation planning. Aust. J. Civ. Eng. 2016, 14, 46–53. [Google Scholar] [CrossRef] [Green Version]
- Hiasa, S.; Catbas, F.N.; Matsumoto, M.; Mitani, K. Considerations and Issues in the Utilization of Infrared Thermography for Concrete Bridge Inspection at Normal Driving Speeds. J. Bridge Eng. 2017, 22, 4017101. [Google Scholar] [CrossRef]
- Karaaslan, E.; Hiasa, S.; Catbas, F.N. FIST: Framework for Infrastructure Support Technologies, a Decision Support Implementation for Bridge Networks. In Proceedings of the Transportation Research Board 97th Annual Meeting, Washington, DC, USA, 7–11 January 2018. [Google Scholar]
- Hiasa, S.; Karaaslan, E.; Shattenkirk, W.; Mildner, C.; Catbas, F.N. Bridge Inspection and Condition Assessment Using Image-Based Technologies with UAVs. In Proceedings of the Structures Congress 2018: Bridges, Transportation Structures, and Nonbuilding Structures—Selected Papers from the Structures Congress, Fort Worth, TX, USA, 19–21 April 2018. [Google Scholar]
- Ozer, E.; Feng, M.Q. Structural Reliability Estimation with Participatory Sensing and Mobile Cyber-Physical Structural Health Monitoring Systems. Appl. Sci. 2019, 9, 2840. [Google Scholar] [CrossRef] [Green Version]
- Ghiasi, R.; Noori, M.; Altabey, W.A.; Silik, A.; Wang, T.; Wu, Z. Uncertainty Handling in Structural Damage Detection via Non-Probabilistic Meta-Models and Interval Mathematics, a Data-Analytics Approach. Appl. Sci. 2021, 11, 770. [Google Scholar] [CrossRef]
- Lu, N.; Liu, Y.; Noori, M.; Xiao, X. System Reliability Assessment of Cable-Supported Bridges under Stochastic Traffic Loads Based on Deep Belief Networks. Appl. Sci. 2020, 10, 8049. [Google Scholar] [CrossRef]
- Quintela, H.; Santos, M.F.; Cortez, P. Real-Time Intelligent Decision Support System for Bridges Structures Behavior Prediction. In Proceedings of the Progress in Artificial Intelligence: 13th Portuguese Conference on Aritficial Intelligence, EPIA 2007, Workshops: GAIW, AIASTS, ALEA, AMITA, BAOSW, BI, CMBSB, IROBOT, MASTA, STCS, and TEMA, Guimar{ã}es, Portugal, 3–7 December 2007; Neves, J., Santos, M.F., Machado, J.M., Eds.; Springer: Berlin/Heidelberg, Germany, 2007; pp. 124–132, ISBN 978-3-540-77002-2. [Google Scholar]
- Jiao, Y.; Liu, H.; Zhang, P.; Wang, X.; Wei, H. Unsupervised performance evaluation strategy for bridge superstructure based on fuzzy clustering and field data. Sci. World J. 2013, 2013, 427072. [Google Scholar] [CrossRef]
- Lee, J.; Sanmugarasa, K.; Blumenstein, M.; Loo, Y.C. Improving the reliability of a Bridge Management System (BMS) using an ANN-based Backward Prediction Model (BPM). Autom. Constr. 2008, 17, 758–772. [Google Scholar] [CrossRef] [Green Version]
- Bocchini, P.; Saydam, D.; Frangopol, D.M. Efficient, accurate, and simple Markov chain model for the life-cycle analysis of bridge groups. Struct. Saf. 2013, 40, 51–64. [Google Scholar] [CrossRef]
- Mishra, A. Using Google TensorFlow with Amazon SageMaker. In Machine Learning in the AWS Cloud; Sybex: Hoboken, NJ, USA, 2019. [Google Scholar]
- Gucunski, N.; Basily, B.; Kim, J.; Yi, J.; Duong, T.; Dinh, K.; Kee, S.-H.; Maher, A. RABIT: Implementation, performance validation and integration with other robotic platforms for improved management of bridge decks. Int. J. Intell. Robot. Appl. 2017, 1, 271–286. [Google Scholar] [CrossRef]
- Bolukbasi, M.; Mohammadi, J.; Arditi, D. Estimating the Future Condition of Highway Bridge Components Using National Bridge Inventory Data. Pract. Period. Struct. Des. Constr. 2004, 9, 16–25. [Google Scholar] [CrossRef]
- Shepard, R.W.; Johnson, M.B.; Board, T.R. Evaluating Bridge Health: California’s diognastic tool. TR News 2001, 215, 6–11. [Google Scholar]
- American Association of State Highway and Transportation Officials (AASHTO). Manual for Bridge Element Inspection (MBEI), AASHTO, 2nd ed.; 2019, p. 172, ISBN 9781560517238. Available online: file:///C:/Users/MDPI/AppData/Local/Temp/MBEI-2_TableOfContents.pdf. (accessed on 21 May 2019).
- American Association of State Highway and Transportation Officials (AASHTO). AASHTOWare Bridge Management 1990. Available online: https://www.aashtowarebridge.com. (accessed on 21 May 2019).
- Federal Highway Administration. LTBP InfoBridge: An Intuitive and User-Friendly Interface to Access, Visualize, and Analyze Bridge Performance Data. Long Term Bridg. Perform. Progr. 2. 2019. Available online: https://highways.dot.gov/research/long-term-infrastructure-performance/ltbp/long-term-bridge-performance. (accessed on 21 May 2019).
- Sainath, T.N.; Vinyals, O.; Senior, A.; Sak, H. Convolutional, Long Short-Term Memory, fully connected Deep Neural Networks. In Proceedings of the ICASSP, IEEE International Conference on Acoustics, Speech and Signal Processing—Proceedings, Brisbane, QCL, Australia, 19–24 April 2015. [Google Scholar]
- Hochreiter, S.; Schmidhuber, J. Long Short-Term Memory. Neural Comput. 1997, 9, 1735–1780. [Google Scholar] [CrossRef]
- Gers, F. Long short-term memory in recurrent neural networks. Neural Comput. 2001. [Google Scholar] [CrossRef]
- Gers, F.A.; Schmidhuber, J.; Cummins, F. Learning to forget: Continual prediction with LSTM. Neural Comput. 2000, 12, 2451–2471. [Google Scholar] [CrossRef]
- Graves, A.; Mohamed, A.; Hinton, G. Speech Recognition with Deep Recurrent Neural Networks. 2013. Available online: https://arxiv.org/abs/1303.5778. (accessed on 21 May 2019).
- Roondiwala, M.; Patel, H.; Varma, S. Predicting Prices Using LSTM. Int. J. Sci. Res. 2015, 6, 1754–1756. [Google Scholar]
- Guo, J.; Liang, Z.; Ditzler, G.; Bouaynaya, N.C.; Scribner, E.; Fathallah-Shaykh, H.M. Nonlinear Brain Tumor Model Estimation with Long Short-Term Memory Neural Networks. In Proceedings of the International Joint Conference on Neural Networks, Dhaka, Bangladesh, 14–15 December 2018. [Google Scholar]
- Bisong, O.E.; Oommen, B.J. Optimizing Self-organizing Lists-on-Lists Using Enhanced Object Partitioning. In Proceedings of the IFIP Advances in Information and Communication Technology; Springer: Berlin, Germany, 2019. [Google Scholar]
- Krizhevsky, A.; Sutskever, I.; Hinton, G.E. ImageNet classification with deep convolutional neural networks. Commun. ACM 2017, 60, 84–89. [Google Scholar] [CrossRef]
- Karaaslan, E.; Bagci, U.; Catbas, F.N. Artificial Intelligence Assisted Infrastructure Assessment using Mixed Reality Systems. Transp. Res. Record 2019, 2673, 413–424. [Google Scholar] [CrossRef] [Green Version]
- Karaaslan, E.; Bagci, U.; Necati, C.F. Attention-Guided Analysis of Infrastructure Damage with Semi-Supervised Deep Learning. Autom. Constr. 2021, 125, 103634. [Google Scholar] [CrossRef]
- Chollet, F. Keras: The Python Deep Learning library. Keras.Io 2015. Available online: https://keras.io. (accessed on 21 May 2019).
- Ai, Q.; Wang, X.; Bruch, S.; Golbandi, N.; Bendersky, M.; Najork, M. Learning Groupwise Multivariate Scoring Functions Using Deep Neural Networks. 2019. Available online: https://arxiv.org/abs/1811.04415. (accessed on 21 May 2019).
- Pasumarthi, R.K.; Bruch, S.; Wang, X.; Li, C.; Bendersky, M.; Najork, M.; Pfeifer, J.; Golbandi, N.; Anil, R.; Wolf, S. TF-Ranking: Scalable TensorFlow Library for Learning-to-Rank. Available online: https://arxiv.org/abs/1812.00073. (accessed on 21 May 2019).
- Pasumarthi, R.K.; Bruch, S.; Bendersky, M.; Wang, X. Neural Learning to Rank Using TensorFlow Ranking: A Hands-on Tutorial. In Proceedings of the 2019 ACM SIGIR International Conference on Theory of Information Retrieval; ACM: New York, NY, USA, 2019; pp. 253–254. [Google Scholar]
- Chang, C.C.; Lin, C.J. LIBSVM: A Library for support vector machines. ACM Trans. Intell. Syst. Technol. 2011, 2, 1–27. [Google Scholar] [CrossRef]
- Bektas, B.A.; Carriquiry, A.; Smadi, O. Using Classification Trees for Predicting National Bridge Inventory Condition Ratings. J. Infrastruct. Syst. 2014, 19, 425–433. [Google Scholar] [CrossRef]
- FHWA. Recording and Coding Guide for the Structure Inventory and Appraisal of the Nation’s Bridges; 1995. Available online: https://www.fhwa.dot.gov/bridge/mtguide.pdf. (accessed on 21 May 2019).
- Sobanjo, J.O.; Thompson, P.D.; Kerr, R.; Board, T.R. Element-to-Component Translation of Bridge Condition Ratings; 2008; 25p. Available online: https://www.fhwa.dot.gov/bridge/mtguide.pdf. (accessed on 21 May 2019).
- Karaaslan, E.; Zhao, Y.; Tatari, O. Comparative life cycle assessment of sport utility vehicles with different fuel options. Int. J. Life Cycle Assess. 2016, 23, 1–15. [Google Scholar] [CrossRef]
- Necati, C.F.; Gul, M.; Zaurin, R.; Gokce, H.B.; Maier, D.; Terrell, T. Structural health monitoring for life cycle management of bridges. In Life-Cycle Civil Engineering; CRC Press: Boca Raton, FL, USA, 2008; p. 6. ISBN 9780429207259. [Google Scholar]
- Hawk, H. Bridge Life-Cycle Cost Analysis; NCHRP Report 483; Springer: Berlin, Germany, 2002. [Google Scholar]
- Mohammadi, J.; Guralnick, S.A.; Yan, L. Incorporating Life-Cycle Costs in Highway-Bridge Planning and Design. J. Transp. Eng. 1995, 121, 417–424. [Google Scholar] [CrossRef]
- Abu Dabous, S.; Alkass, S. Decision support method for multi-criteria selection of bridge rehabilitation strategy. Constr. Manag. Econ. 2008, 26, 883–893. [Google Scholar] [CrossRef]
- Transportation FD of FDOT Work Program Instructions; 2019; Volume 8. Available online: https://www.fdot.gov/workprogram/development/wp-instructions.shtm. (accessed on 21 May 2019).
- Kalervo, J.; Jaana, K. IR evaluation methods for retrieving highly relevant documents. In Proceedings of the 23rd annual international ACM SIGIR conference on Research and development in information retrieval (SIGIR ‘00); Association for Computing Machinery: New York City, NY, USA, 2000; pp. 41–48. [Google Scholar] [CrossRef]
- Florida Department of Transportation (FDOT) Office of Maintenance. Bridge Maintenance and Repair Handbook; 2019; FDOT. Available online: https://www.fdot.gov/maintenance/publications.shtm. (accessed on 21 May 2019).
- Hearn, G.; Thompson, P.D.; Mystkowski, W.; Hyman, W. Framework for a National Database System for Maintenance Actions on Highway Bridges; 2011; ISBN 9780309155243. Available online: http://www.trb.org/Publications/Blurbs/164203.aspx (accessed on 21 May 2019).
Publisher’s Note: MDPI stays neutral with regard to jurisdictional claims in published maps and institutional affiliations. |
© 2021 by the authors. Licensee MDPI, Basel, Switzerland. This article is an open access article distributed under the terms and conditions of the Creative Commons Attribution (CC BY) license (https://creativecommons.org/licenses/by/4.0/).