Article

Carbon Microstructures Synthesis in Low Temperature Plasma Generated by Microdischarges

by
Arkadiusz T. Sobczyk
* and
Anatol Jaworek
*
Institute of Fluid Flow Machinery, Polish Academy of Sciences, 80-231 Gdansk, Poland
*
Authors to whom correspondence should be addressed.
Appl. Sci. 2021, 11(13), 5845; https://doi.org/10.3390/app11135845
Submission received: 30 April 2021 / Revised: 10 June 2021 / Accepted: 16 June 2021 / Published: 23 June 2021
(This article belongs to the Special Issue Plasma: From Materials to Emerging Technologies)

Abstract

:
The aim of this paper is to investigate the process of growth of different carbon deposits in low-current electrical microdischarges in argon with an admixture of cyclohexane as the carbon feedstock. The method of synthesis of carbon structures is based on the decomposition of hydrocarbons in low-temperature plasma generated by an electrical discharge in gas at atmospheric pressure. The following various types of microdischarges generated at this pressure were tested for both polarities of supply voltage with regard to their applications to different carbon deposit synthesis: Townsend discharge, pre-breakdown streamers, breakdown streamers and glow discharge. In these investigations the discharge was generated between a stainless-steel needle and a plate made of a nickel alloy, by electrode distances varying between 1 and 15 mm. The effect of distance between the electrodes, discharge current and hydrocarbon concentration on the obtained carbon structures was investigated. Carbon nanowalls and carbon microfibers were obtained in these discharges.

1. Introduction

Methods of production and functionalization of different carbon structures has been the subject of intense investigations in recent years. It has passed less than 30 years since Iijima published his results of experimental investigations on the production of carbon nanotubes in a high-current arc discharge. Since that time, many papers have been published in the field of the synthesis of carbon nanotubes, carbon onions, diamond-like carbon using various types of electrical discharges, chemical vapor deposition or laser ablation.
Plasma generated by electrical discharges is used in various industrial processes, for example, for thin film deposition, surface properties modification, sterilization, noxious compound decomposition, particulate matter precipitation, micro- and nanostructures synthesis, etching or electric-discharge-machining. These processes, operating at pressures ranging from the atmospheric to the elevated to below one pascal, are generated by a high voltage of various frequencies, such as direct-current (DC), alternating-current (AC), radio-frequency (RF), microwaves (µW) or by pulsed discharges (PD). These discharges can be generated between the following electrodes of different geometries: needle-plate, two parallel plates, rod-plate, etc., with or without dielectric barrier between them. Nowadays, a high-current arc discharge is one of the most effective methods used to obtain single- and multi-walled carbon nanotubes [1]. The synthesis of carbon structures or thin film deposition in low-power electrical discharges is rarely met in the literature. High voltage, low current discharges, such as corona discharge, generate non-equilibrium plasma, but can produce electrons of high kinetic energy, advantageous for such processes as ionization, excitation, molecules decomposition or polymerization.
Usually, microplasma is generated in a gas at or near atmospheric pressure (0.1 MPa) between electrodes spaced at small distances, ranging from a fraction of a millimeter to 10 mm. The word “microplasma” was probably used for the first time by Tachibana in 2003 [2], but “microdischarge” was found in a paper by Martynov and Ivanov [3] (see [4]). The main advantage of using microplasma-based processes is that the physical processes and chemical reactions can occur in high-pressure gas flowing continuously through a plasma reactor, contrary to low pressure plasma sources, which require vacuum installation. In materials processing science, microplasma is used to synthesize nanoscale structures such as, for example, SiO2 thin films [5], Si nanocones [6], carbon dendrites [7], or carbon amorphous deposits [8]. Generally, the most popular discharge types for microplasma generation are plasma-jet discharge and dielectric barrier discharge.
The investigations of carbon fiber synthesis between a needle and plate electrodes were presented by Brock and Lim [9], but in n-heptane vapors, and nitrogen as a carrier gas. The source of plasma was a corona glow discharge of negative polarity (a needle was used as the cathode). Carbon fibers of grained and irregular morphology were obtained as a result of discharge in that gas mixture. Similar structures, named carbon dendrites, were obtained by Kozak et al. using a glow discharge generated in ethanol as the carbon feedstock [7]. Raman spectra indicated that the synthesized dendrites have glassy carbon- and pyrocarbon-like structures. A negative corona discharge was also used to deposit carbon dendrites from the products obtained by the de-polymerization of polystyrene [10].
In recent years, low-current electrical discharges have also been tested as a method of carbon nanostructures synthesis. For example, Li et al. [11] synthesized carbon nanotubes in a corona discharge at atmospheric pressure. During electrical discharge in a methane/hydrogen mixture using an anodic aluminum oxide template on a stainless-steel plate and cobalt as a catalyst, multi-walled carbon nanotubes with a diameter of about 40 nm were obtained. The discharge was generated from a tungsten needle supplied by an AC voltage source of 8 kV/25 kHz. Sano and Nobuzawa [12] also obtained carbon nanotubes (CNTs) using a tungsten needle as the DC discharge electrode, but without a catalyst. A flat-ended graphite rod was used as a ground electrode and a tungsten wire as the cathode. The feedstock of carbon was ethylene mixed with hydrogen. (C2H4:H2 (1:100)). The discharge voltage and current were 1.6 kV and 0.3 mA, respectively. The other structures obtained, using a negative corona discharge, were carbon nanowalls. During glow discharge with a rod used as the cathode and a plate as the anode, Mesko et al. [13] synthesized carbon nanowalls from the vapors of ethanol or hexane. Sobczyk, using cyclohexane as the carbon feedstock in a positive corona discharge, obtained carbon fibers synthesized at the needle electrode tip [14,15].
The carbon micro- and nanostructures could potentially be applied to the synthesis of electrodes for ion batteries [16], anode to electrochemical oxidation [17], light-emitting devices, organic transistors [18], catalyst carriers [19] or for other self-assembled nanostructures.
Polymer thin-films synthesized in low-temperature plasma have been found to be a material with a low dielectric constant applied to microelectronics [20], and as thin films with applications in gas sensors for the detection of ethanol and ammonia vapors of concentrations ranging from 100 to 1000 ppm [21] or as a thin hydrophobic layer [22]. These experiments were carried out in a glow discharge in a low-pressure atmosphere.
One of the most popular liquid hydrocarbons used as a carbon feedstock is cyclohexane. The products of decomposition of cyclohexane, such as ethylene and methane, have been widely used for the synthesis of CNT or diamond-like structures.
Huang et al. [23] showed that the deposition rate of a plasma-polymerized thin layer increases with a decrease in the H/C ratio. Cyclohexane is a hydrocarbon with a relatively low H/C ratio, equal to two, and, for this reason, was used in the experiments presented in this paper as a carbon feedstock for the synthesis of carbon microstructures in micro-discharges. Additionally, the high vapor pressure (13 kPa at 298 K) of cyclohexane, and its high auto-pyrolysis temperature (>1000 K), predestinate this hydrocarbon as a source of carbon, which can be obtained at relatively low temperatures and at atmospheric pressures.
The aim of this paper is to investigate the process of synthesizing various carbon structures from cyclohexane vapors in high-voltage, low-current electrical microdischarges at atmospheric pressure between needle and plate electrodes. This configuration is typical for corona discharges, but the distance between the electrodes was shorter in order to obtain at least one linear dimension of the active plasma area in the range of the order of a few millimeters. This configuration allowed the initiation of microplasma in a limited region between the electrodes.

2. Materials and Methods

A schematic of the experimental set-up is shown in Figure 1. The experiments were carried out in an atmosphere of argon and cyclohexane as the carbon feedstock, at normal pressure, in a reactor chamber of 0.1 dm3, made of PMMA. The hydrocarbon vapors were fed to the reactor from a bubbling flask, with argon as the carrier gas. The concentration of hydrocarbon in argon was controlled via mixing the cyclohexane vapors with additional argon. The flow rates of argon flowing directly to the reactor and throughout the flask were measured using flow meters. The temperature of liquid cyclohexane in the flask was stabilized at 21 ± 1 °C and was slightly lower than the room temperature to avoid vapor condensation on the pipe’s walls. The concentration of cyclohexane vapors was calculated from the flow rates of the vapor of cyclohexane and argon. The total flow rate of the mixture was kept constant at a level of 0.051 dm3/min. The concentration of cyclohexane was changed in the range of 1 to 5%. Cyclohexane of purity of 99.5% was supplied by Chempur (Poland) and argon of purity 99.999% by Linde gas. Before starting the experiment and plasma ignition, the reactor was rinsed with the gas mixture for 10 min to remove the air from the volume. Then, the voltage was switched on to the assumed magnitude set before. The voltage was switched off after a required time period.
The electrical discharge was generated between a stainless-steel needle (composition in wt.%: Fe, 70; Cr, 18; Ni, 10; Si, 1) and a plate made of a nickel alloy (composition in wt.%: Ni, 75; Fe, 17; Mo, 5; Mn, 1.5). The diameter of the needle was 1 mm, the tip radius of the needle was about 30 µm. The dimensions of the plate were 35 × 20 mm. The distance between the electrodes was changed in the range of 1 mm to 15 mm.
The electrodes were supplied from high voltage power supply SPELLMAN HV SL 600 W/40 kV/PN (Spellman, Pulborough, UK) of a positive polarity. The discharge current was stabilized by a series resistance with a value of 5 MΩ. The discharge current was changed from 0.4 mA up to 3 mA. The voltage between the electrodes was measured with high voltage probe TEKTRONIX P6015A (Tektronix, Beaverton, OR, USA). The current pulses were measured by means of Rogowski type current monitor PEARSON 6600 (Pearson Electronics, Palo Alto, CA, USA) and Differential Preamplifier Tektronix ADA400A as amplifier of current signals. Both of the signals gained by these probes were recorded using digital storage oscilloscope TEKTRONIX TDS 3032.
The as-made carbon deposit grown on the needle tip or plate was carefully removed from the reactor, placed at the microscopic stage covered with carbon tape, and examined under a scanning electron microscope (Zeiss EVO 40, Carl Zeiss, Germany) equipped with an energy dispersive spectroscope (EDS, Quantax 200, Bruker, UK). Renishaw inVia Raman Microscope (Renishaw, UK) with a 100× objective lens and a laser with a power of 1.5 mW at a wavelength of 514 nm was used in order to analyze the Raman spectra of obtained carbon structures. The concentration of nanoparticles generated in microdischarge and leaving the reactor was measured using GRIMM Condensation Particle Counter 5416 (GRIMM Aerosol Technik Ainring GmbH & Co. KG, Ainring, Germany). The size distribution of aerosol particles was determined using Aerosol Particle Size Spectrometer LAP 322 (Topas GmbH, Dresden, Germany).

3. Results

3.1. Discharge Modes

Five main modes of discharge in a gas at atmospheric pressure can be identified from the following current–voltage characteristics of electric discharges: onset streamer, glow corona, pulsed spark discharge and atmospheric pressure glow discharge [24,25].
The relationship between the voltage between the electrodes and the discharge current flowing through the gas depends on the kind of gas, the gas pressure, the distance between the electrodes, the geometry of the electrodes, and the electrode material. The current–voltage characteristics of electrical discharge in a needle–plate electrode system for a mixture of argon with cyclohexane at atmospheric pressure for different inter-electrode distances for a positive polarity and a cyclohexane concentration of 5% are shown in Figure 2.
For a given magnitude of supply voltage, the time averaged discharge current was measured, and the mean value of the voltage drop between the electrodes was calculated using the following formula (see Figure 2):
Ud = Us − Id·R,
where Ud is the voltage drop between the electrodes, Id is the discharge current, and R is the resistance of the external ballast resistor in the circuit.
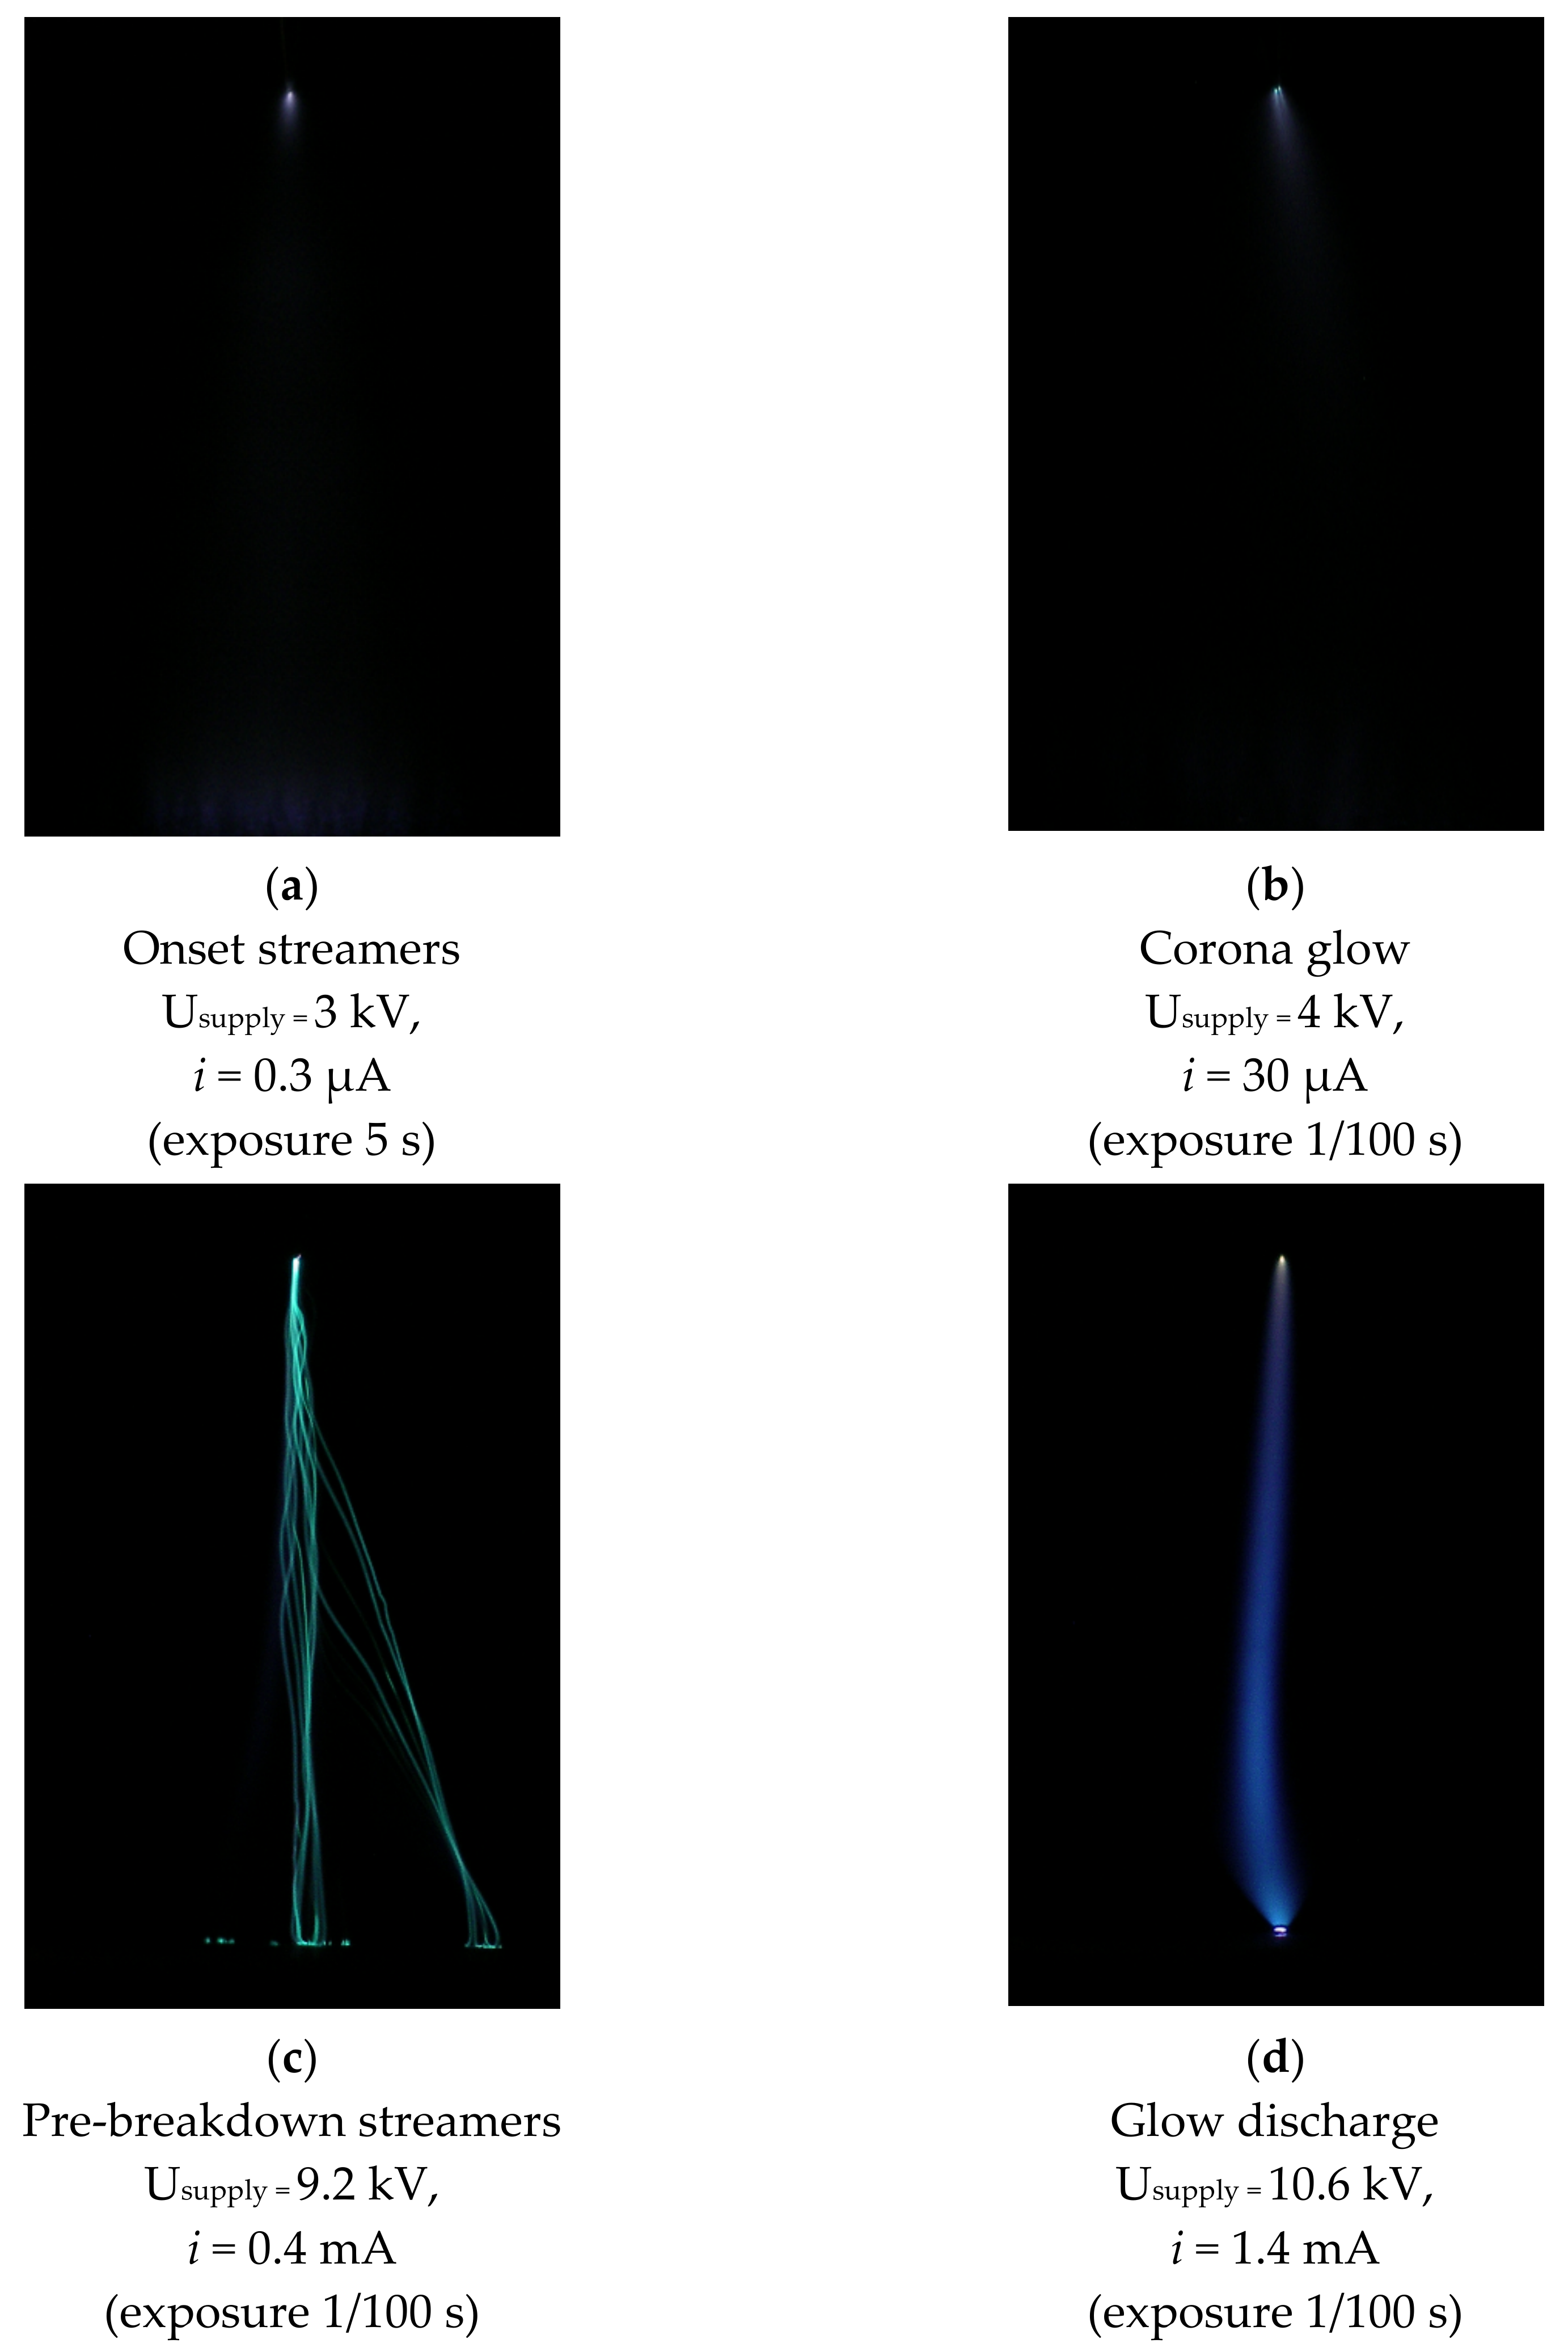
Figure 3 shows photographs of various forms of electrical discharges in a mixture of argon and cyclohexane (95:5 by volume) for a positive polarity. All of the photographs were taken at the same optical magnification but with various exposures. The photographs show different stages of the development of the discharge with increasing voltage.
For voltages lower than the corona onset voltage, only dark discharge is generated. The discharge current is very low (<0.1 µA) because the electrons and ions flowing toward the electrodes, due to an applied electric field, are generated only by natural ionization. The ionization and excitation processes are so weak that the discharge is not visible to the “naked eye”. This discharge was also not visible in the photos taken at a long exposure time of 15 s.
With the voltage increasing, the Townsend discharge appears in the needle region, and the current–voltage characteristics fulfil the quadratic Townsend law, for voltages Ud > Ud0, until the pre-breakdown streamers begin, as follows:
Id = aUd(Ud − Ud0),
where a is a constant depending on the configuration of electrodes, temperature, pressure and the kind of gas; Id is the discharge current; Ud is the voltage between the electrodes, and Ud0 is the corona onset voltage.
A corona discharge of positive polarity was visible as a faint glow at the anode tip, the area and intensity of which increased with an increasing supply voltage. Outside the luminous layer, the ionization processes are negligible—the number of electrons is insignificant, their kinetic energy is too low and only an ionic current flows toward the counter electrode (see [26,27]). This area is called the drift region. The kinetic energy of electrons is too low to sustain the excitation or ionization process in the drift region.
With the supply voltage increasing to about 7–8 kV, the pre-breakdown streamers appeared. The streamers are a spatially inhomogeneous phenomenon that occur over a period of several hundreds of nanoseconds. The value of the discharge current temporarily increased up to tens of microamperes from the lowest value for a given supply voltage.
A further increase in the supply voltage caused an increase in the discharge current to about 0.8 mA. Due to the voltage drop across the ballast resistance, the inter-electrode voltage decreased to about 5 kV. At this voltage, the electric field is still sufficiently high to produce a sufficient number of ions and photons bombarding the cathode to initiate the emission of secondary electrons from the negative electrode. At a potential leading to breakdown, the current may increase significantly, and a glow discharge or spark discharge could occur. The magnitude of the discharge current is limited by the ballast resistance in this case.
This form of discharge at atmospheric pressure was characterized by a filamentary plasma column that bridged two electrodes.
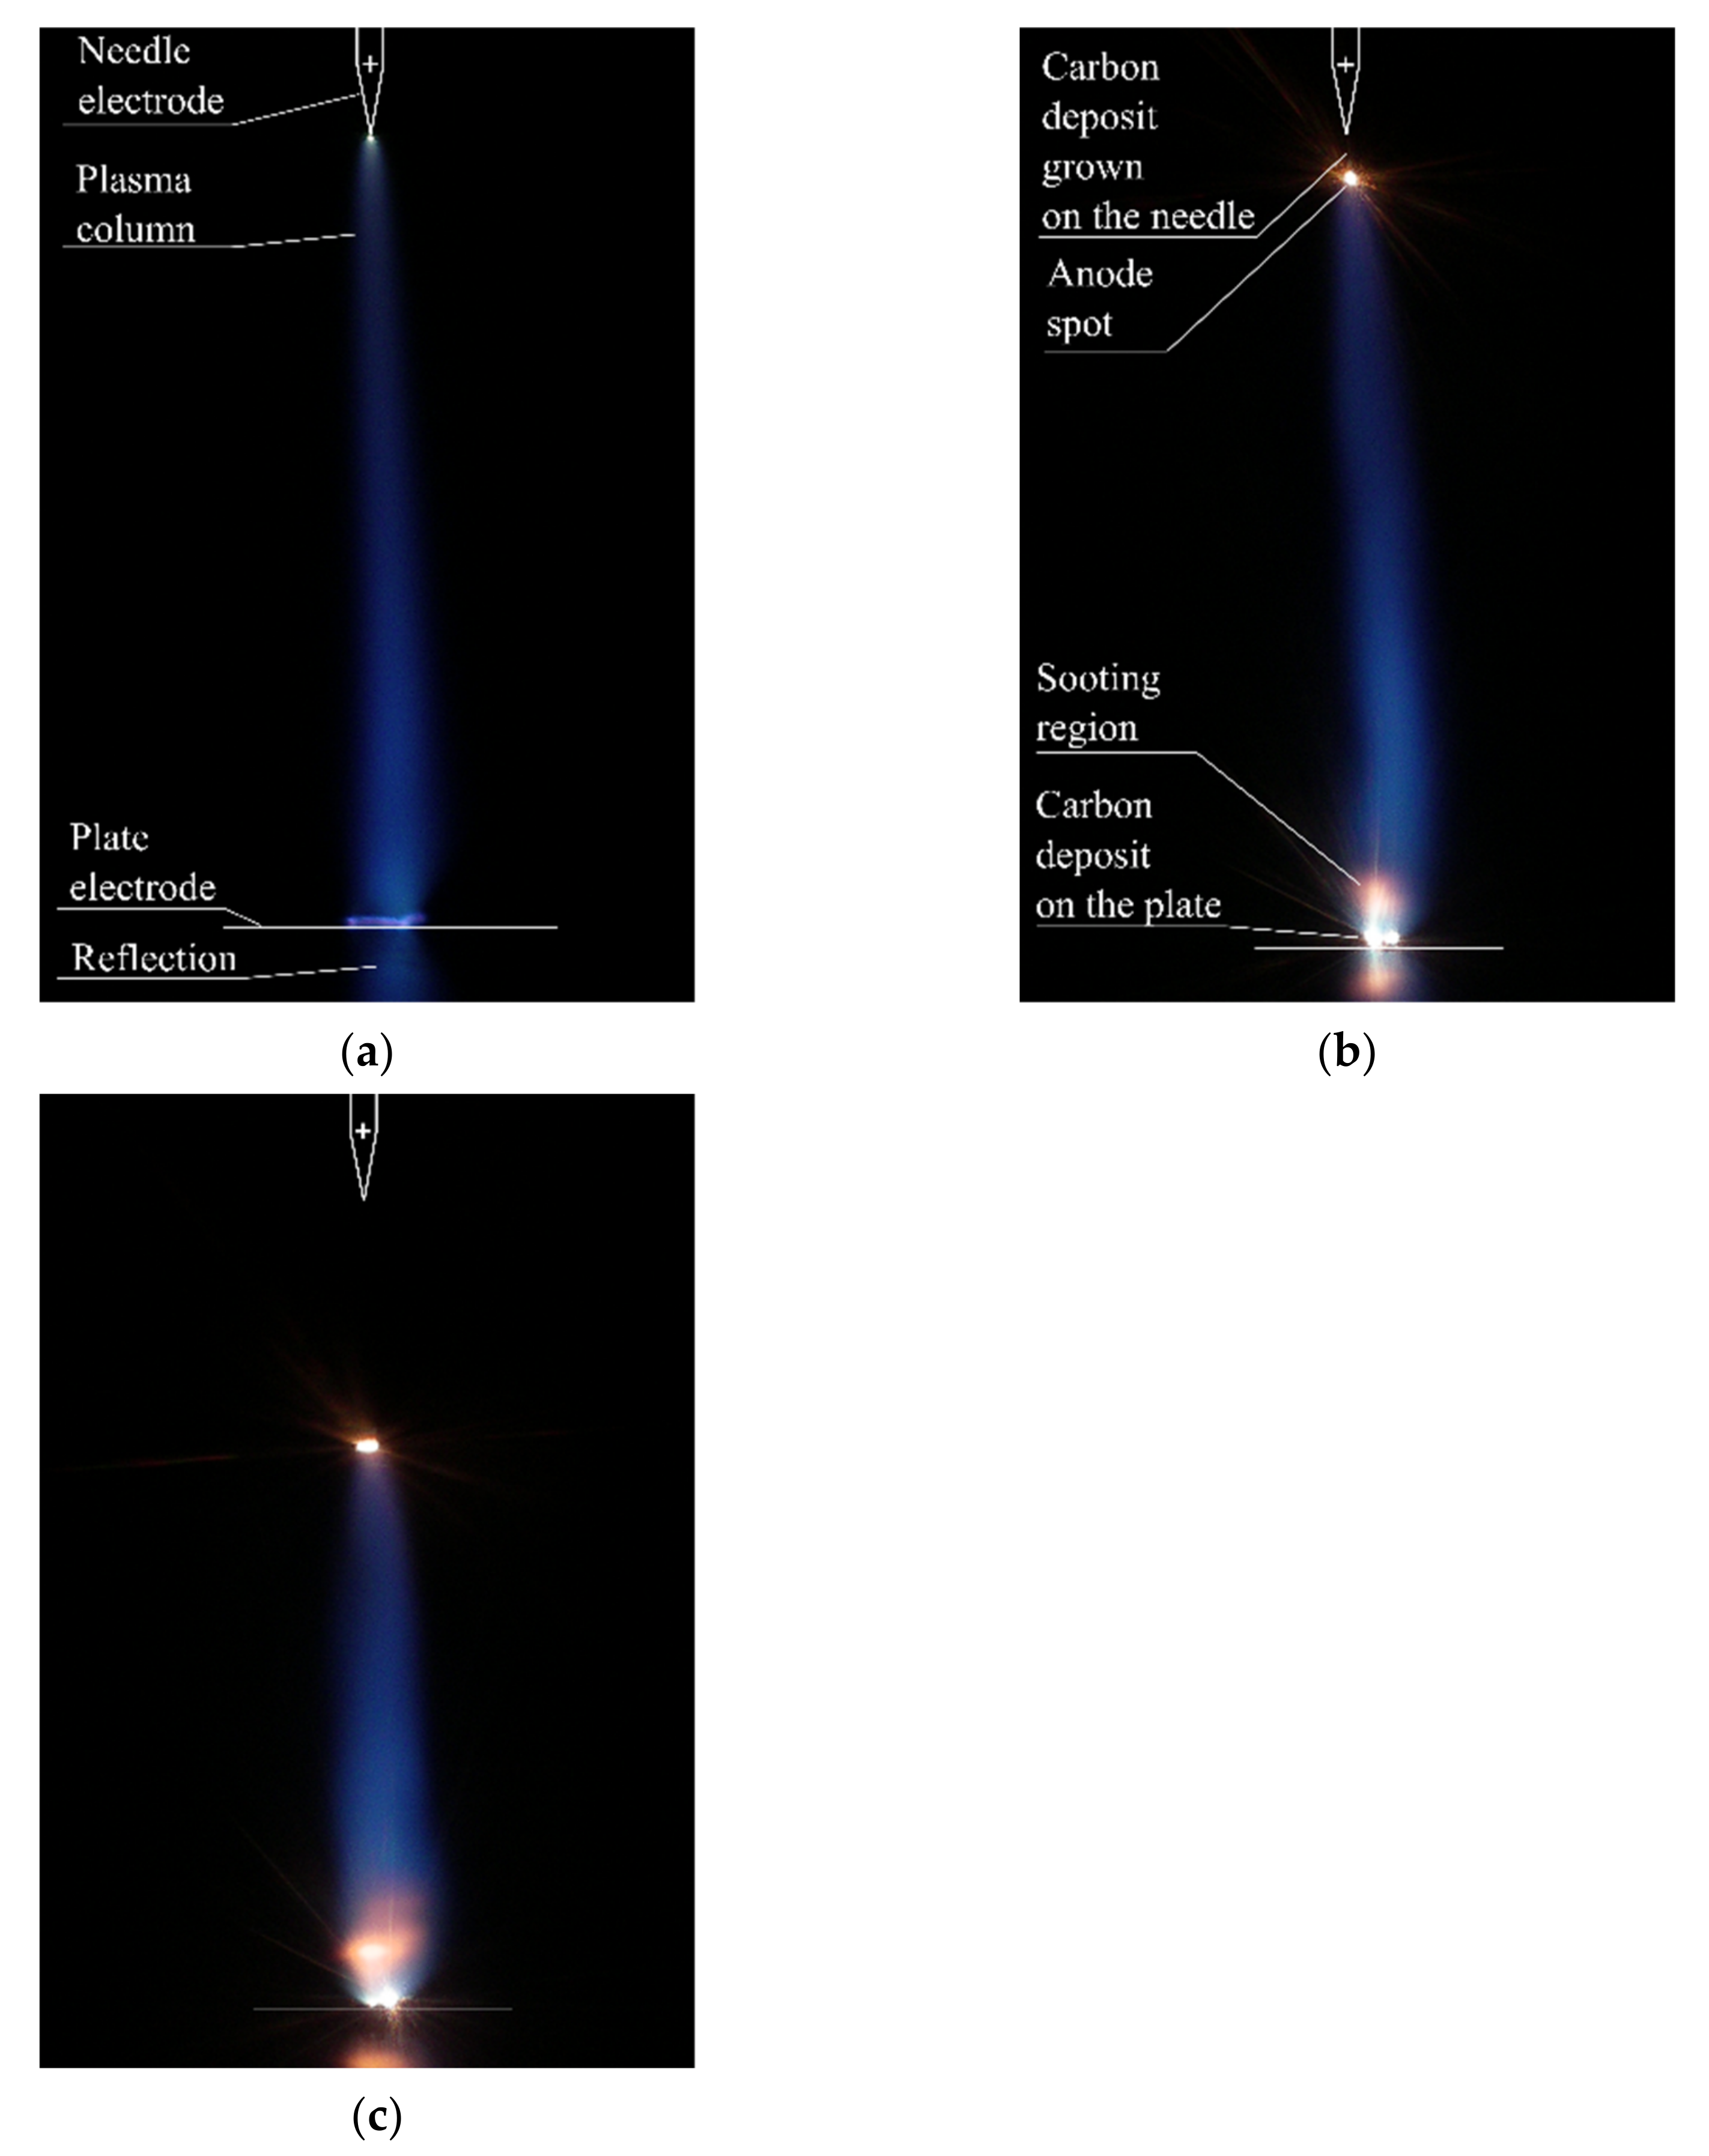
For pulsed discharge and atmospheric pressure glow discharges, carbon deposits started to grow on both electrodes and the growth rate depended on the discharge current. For a discharge current higher than 1.4 mA, a carbon deposit grew on the needle (anodic carbon deposit) toward the plate electrode. In Figure 4 is shown the growing process of the carbon deposit at the anode tip and the evolution of the plasma column in an atmospheric pressure glow discharge (the bright zones in the photographs). The contours of the discharge needle and the plate electrode surface are drawn with white lines. In these photographs, the tip of the carbon fiber stretching out from the needle tip (not visible in the photograph in Figure 5a) and the soot layer, or other carbonaceous materials at the plate electrode, are indicated.
The properties of deposited carbon structures synthesized in plasma depend not only on the gas properties, the carbon feedstock and discharge power, but also on the electric field distribution in the plasma column and the voltage drop near the electrodes. The magnitude of the electric field in the plasma column was determined by the measurement of voltage drop between the electrodes, which depends on the distance between the electrodes. This method is commonly used to determine the average voltage drop near the electrodes and the electric field magnitude [28,29,30,31].
The distribution of the magnitude of the electric field in the plasma column was determined assuming that the voltage drop between the electrodes is the sum of the voltage drops across the anode and cathode and along the plasma column. By decreasing the distance between the electrodes, the voltage drop is also reduced due to the shorter length of the plasma column. The voltage drop near the electrodes is independent of the plasma column length, and the value of the voltage drop near the anode and cathode is constant regardless of the distance between them. Figure 5a shows the relationship between the voltage drop between the electrodes and inter-electrode distances, for a discharge current i = 1.6 mA. The sum of the voltage drops near electrodes can be determined by drawing a straight line, y = ax + b in this plot, the slope of which is the voltage drop across the plasma column, and the cutoff point, the sum of the anode and cathode drops. Figure 5b shows the magnitude of the electric field after a breakdown in the plasma column in a mixture of argon and cyclohexane versus the discharge current. The difference between the maximum electric field obtained for a discharge current of i = 1.8 mA and the lowest value for i = 1.4 mA, was not high (about 20 V), and the reduced electric field (E/N) was about 10 Td.
The average diameter of plasma column was estimated from the full width at half of the maximum brightness of the plasma column at photos taken for an exposure time of 1/2000 s. In a discharge between electrodes separated by an air gap of 3.7 and 15 mm, with a discharge current of 2.0 mA, the mean power density was estimated from the plasma column volume and the product of the discharge current and the inter-electrode voltage. The results are shown in Figure 6. The discharge power density slightly increases with the discharge current for large inter-electrode distances, but it decreases for small inter-electrode gaps. The highest power density was obtained for inter-electrode distances of 2.55 and 3.55 mm for all discharge currents (Figure 6).
Increasing the power density in a plasma column increases the excitation energy of Ar, which could result in a more intense decomposition of cyclohexane. For temperatures above 600 °C the cyclohexane should start to be thermally decomposed, and ethane and butadiene are formed in the following reaction [32]:
c-C6H12 → C2H4 + C4H6 + H2.
In the case of electrical discharges of energy above the metastable energy, the mainly C6H12+ ions are generated after collision with electrons. If the energy will be higher at a level of Ar ionization energy, the main ionic product may be C4H8+. The concentration of C5H9+ ions is more than three times lower. In the latter case, CH3 is a direct product of dissociation [33].
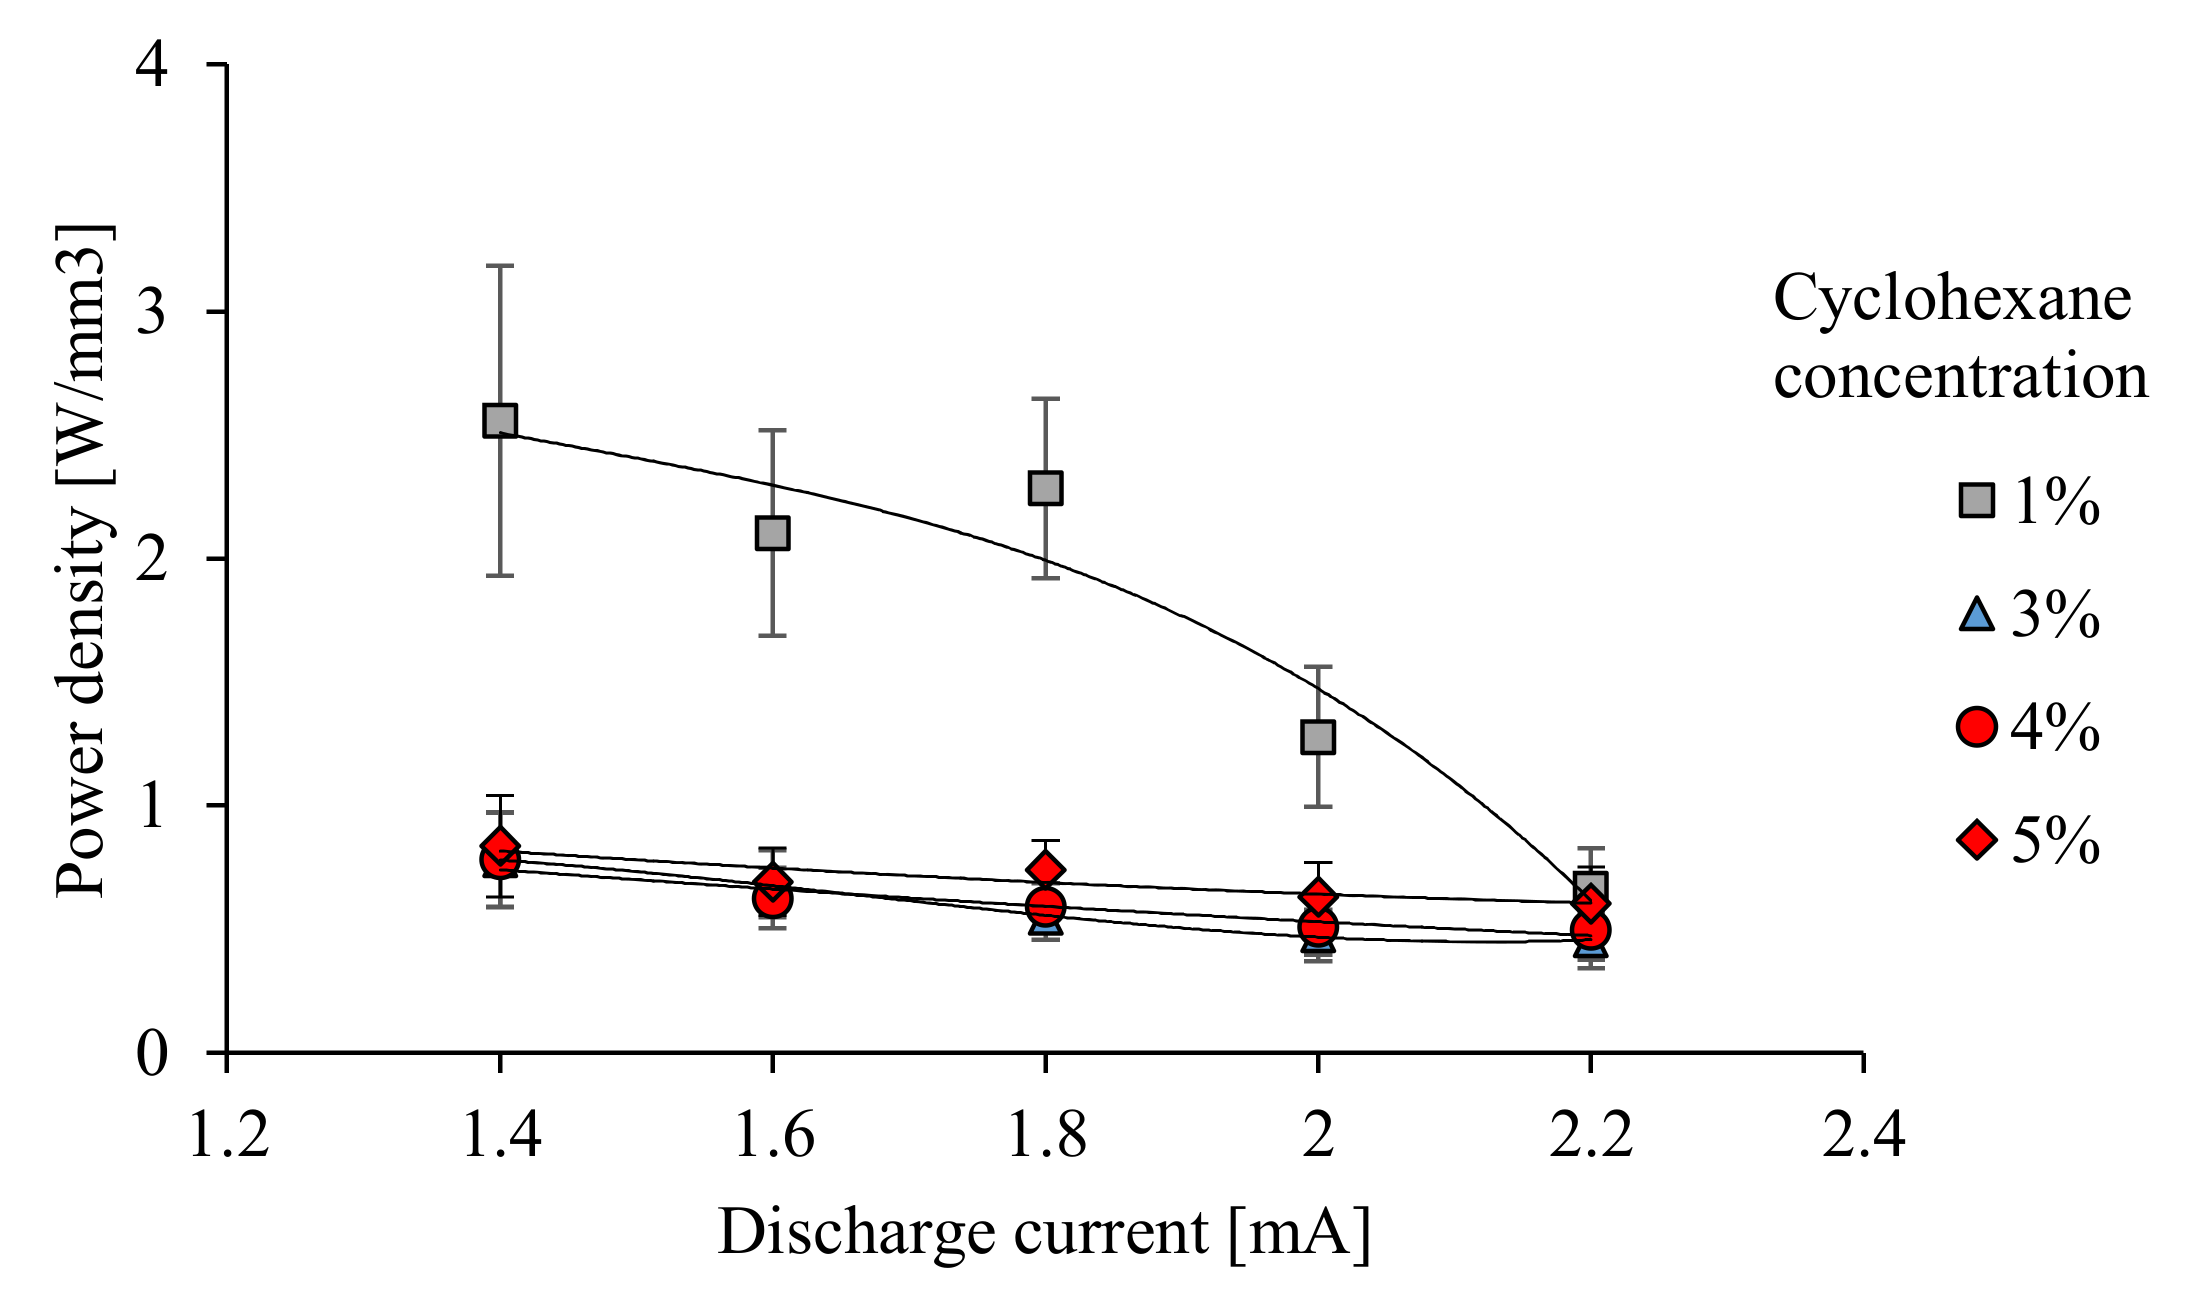
The power density vs. the discharge current in the case of a 15-millimeter inter-electrode distance for different cyclohexane concentration is shown in Figure 7. For a cyclohexane concentration in the range of 3 to 5%, the power density is nearly the same. For a 1% cyclohexane concentration, the power density was about two times higher for a discharge current in the range of 1.4–1.8 mA than for higher discharge currents.

3.2. Discharge Diagnostics by OES

In this section, the results of optical emission spectroscopy (OES) investigations of glow discharge in a mixture of argon and cyclohexane are presented. The dependence of the concentration of activated species in the plasma and the composition of the working gasses are analyzed using OES in the wavelength range of 300–1000 nm. A typical OES result after breakdown is shown in Figure 8. The spectral lines and molecular bands were identified and assigned using online data available from the National Institute of Standards and Technology [34] and the book of Pearse and Gaydon [35], respectively. As can be seen, the infrared spectrum (696.5–978.5 nm) is dominated by the atomic spectrum of Ar optical emission lines, due to 1s-2p transitions (Table 1), whereas the visible spectrum (300–600 nm) is much more complex, but less intense, than the infrared part. A very weak emission at 516 nm was the C2 Swan system. It should be noted that there is also a low-intensity emission band from N2 (Second Positive System). The species identified using optical emission spectroscopy, which originated from cyclohexane decomposition, are listed in Table 2. The intensity of individual components varied depending on the discharge power. During the discharge, a continuous emission in the range of 350 to 450 nm was recorded. The continuous emission could be the effect of free-bound or free-free emission [36]. Free-bound continuous emission results from the capture of an electron by an ion, leading to recombination (Ar++e→Ar*+hν). The second continuous emission is the effect of photon emission due to a decrease in the energy of an electron in the electric field of an ion or atomic nucleus (Ar++e→Ar++e+hν, Ar+e→Ar+e+hν, respectively). For a discharge current of 0.8 mA and higher, the continuous emission spectrum was observed in the range of 500–1000 nm, emitted by the deposit on the needle electrode.
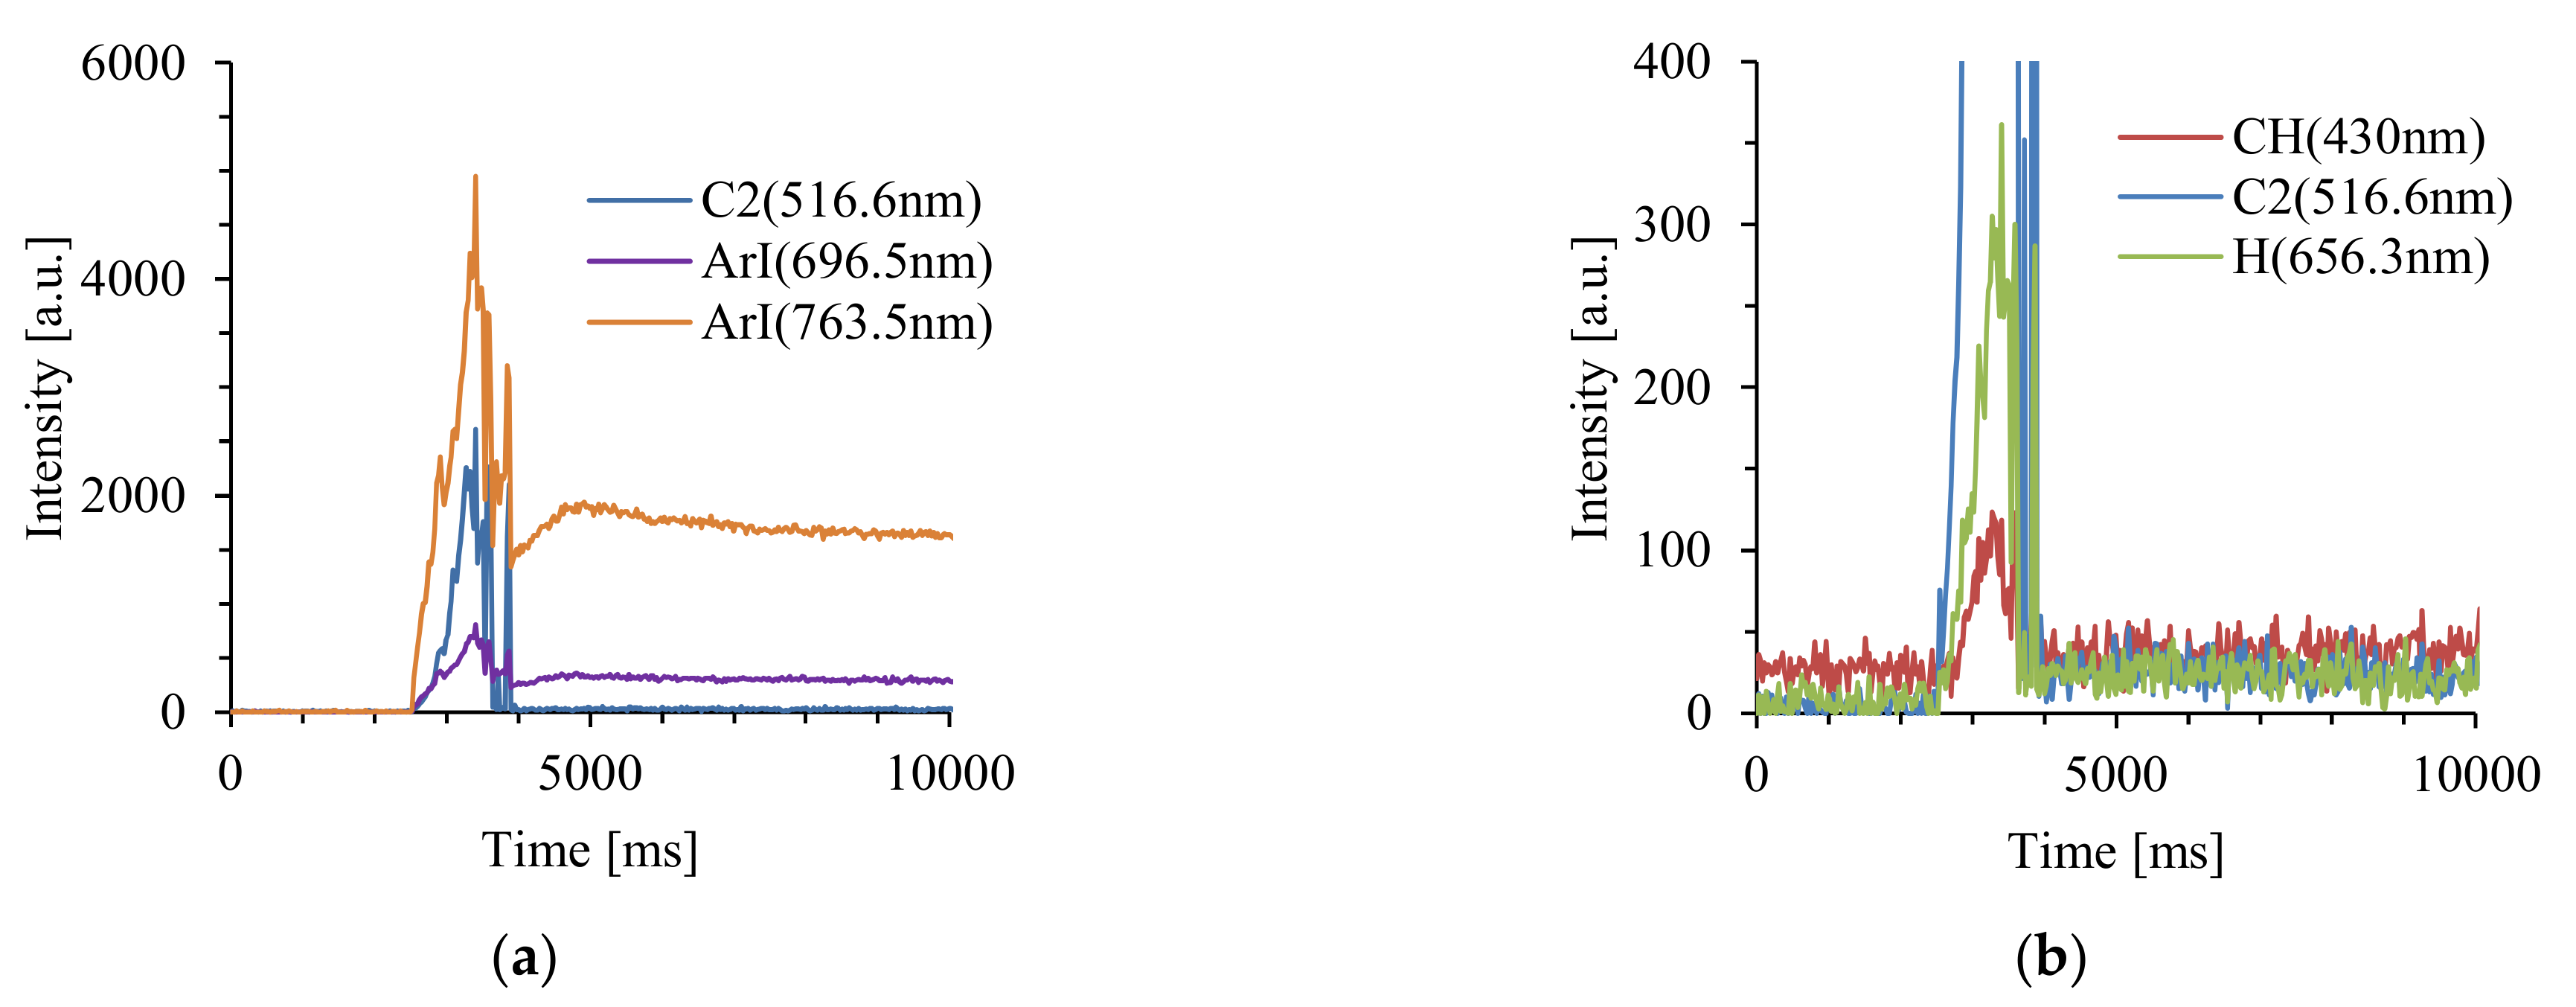
After the transition from pulsed to glow discharge, the intensity of all the optical emission lines decreases. An example of the evolution of the intensity of argon lines and C2, CH and H bands with time, before and after the discharge onset, recorded with a time resolution of about 25 ms, is shown in Figure 9. After breakdown, a decrease in the intensity of the optical emission lines at 996.5 and 763.5 nm to about half of their maximum value (Figure 9a) was observed. The intensity of the C2 Swan System for ν(0–0) after the onset of the discharge was much higher than the lines at 996.5 nm, resulting from excited argon, but after about 2 s, the intensity decreased to a very low level (Figure 9b). The emission intensities of the CH band and line from Hα were much lower than that of C2.
The excitation energy of C2 and CH is not very high (about 2.9 and 2.5 eV, respectively), but in order to obtain radicals from cyclohexane decomposition, much higher energy is required, and the chemical processes are much more complex. The most probable products, which could be obtained from cyclohexane decomposition, are ethane, methane and acetylene. For example, the emission of C2 could be obtained by collision with electrons [37], as follows:
C2H2 + e → C2H + H + e,
C2H + C2H → C2 + C2H2,
or argon via an energy transfer from the metastable argon particles Ar*, as follows:
C2H2 + Ar* → C2H + H + Ar,
C2H + Ar* → C2 + H + Ar.
For CH emission, the possible reactions could be as follows:
e + CH2 → CH + H + e,
e + CH3 → CH + 2H + e,
where CH2 and CH3 could be obtained by the decomposition of CH4 [38] or C2H2 in electrical discharge [39].
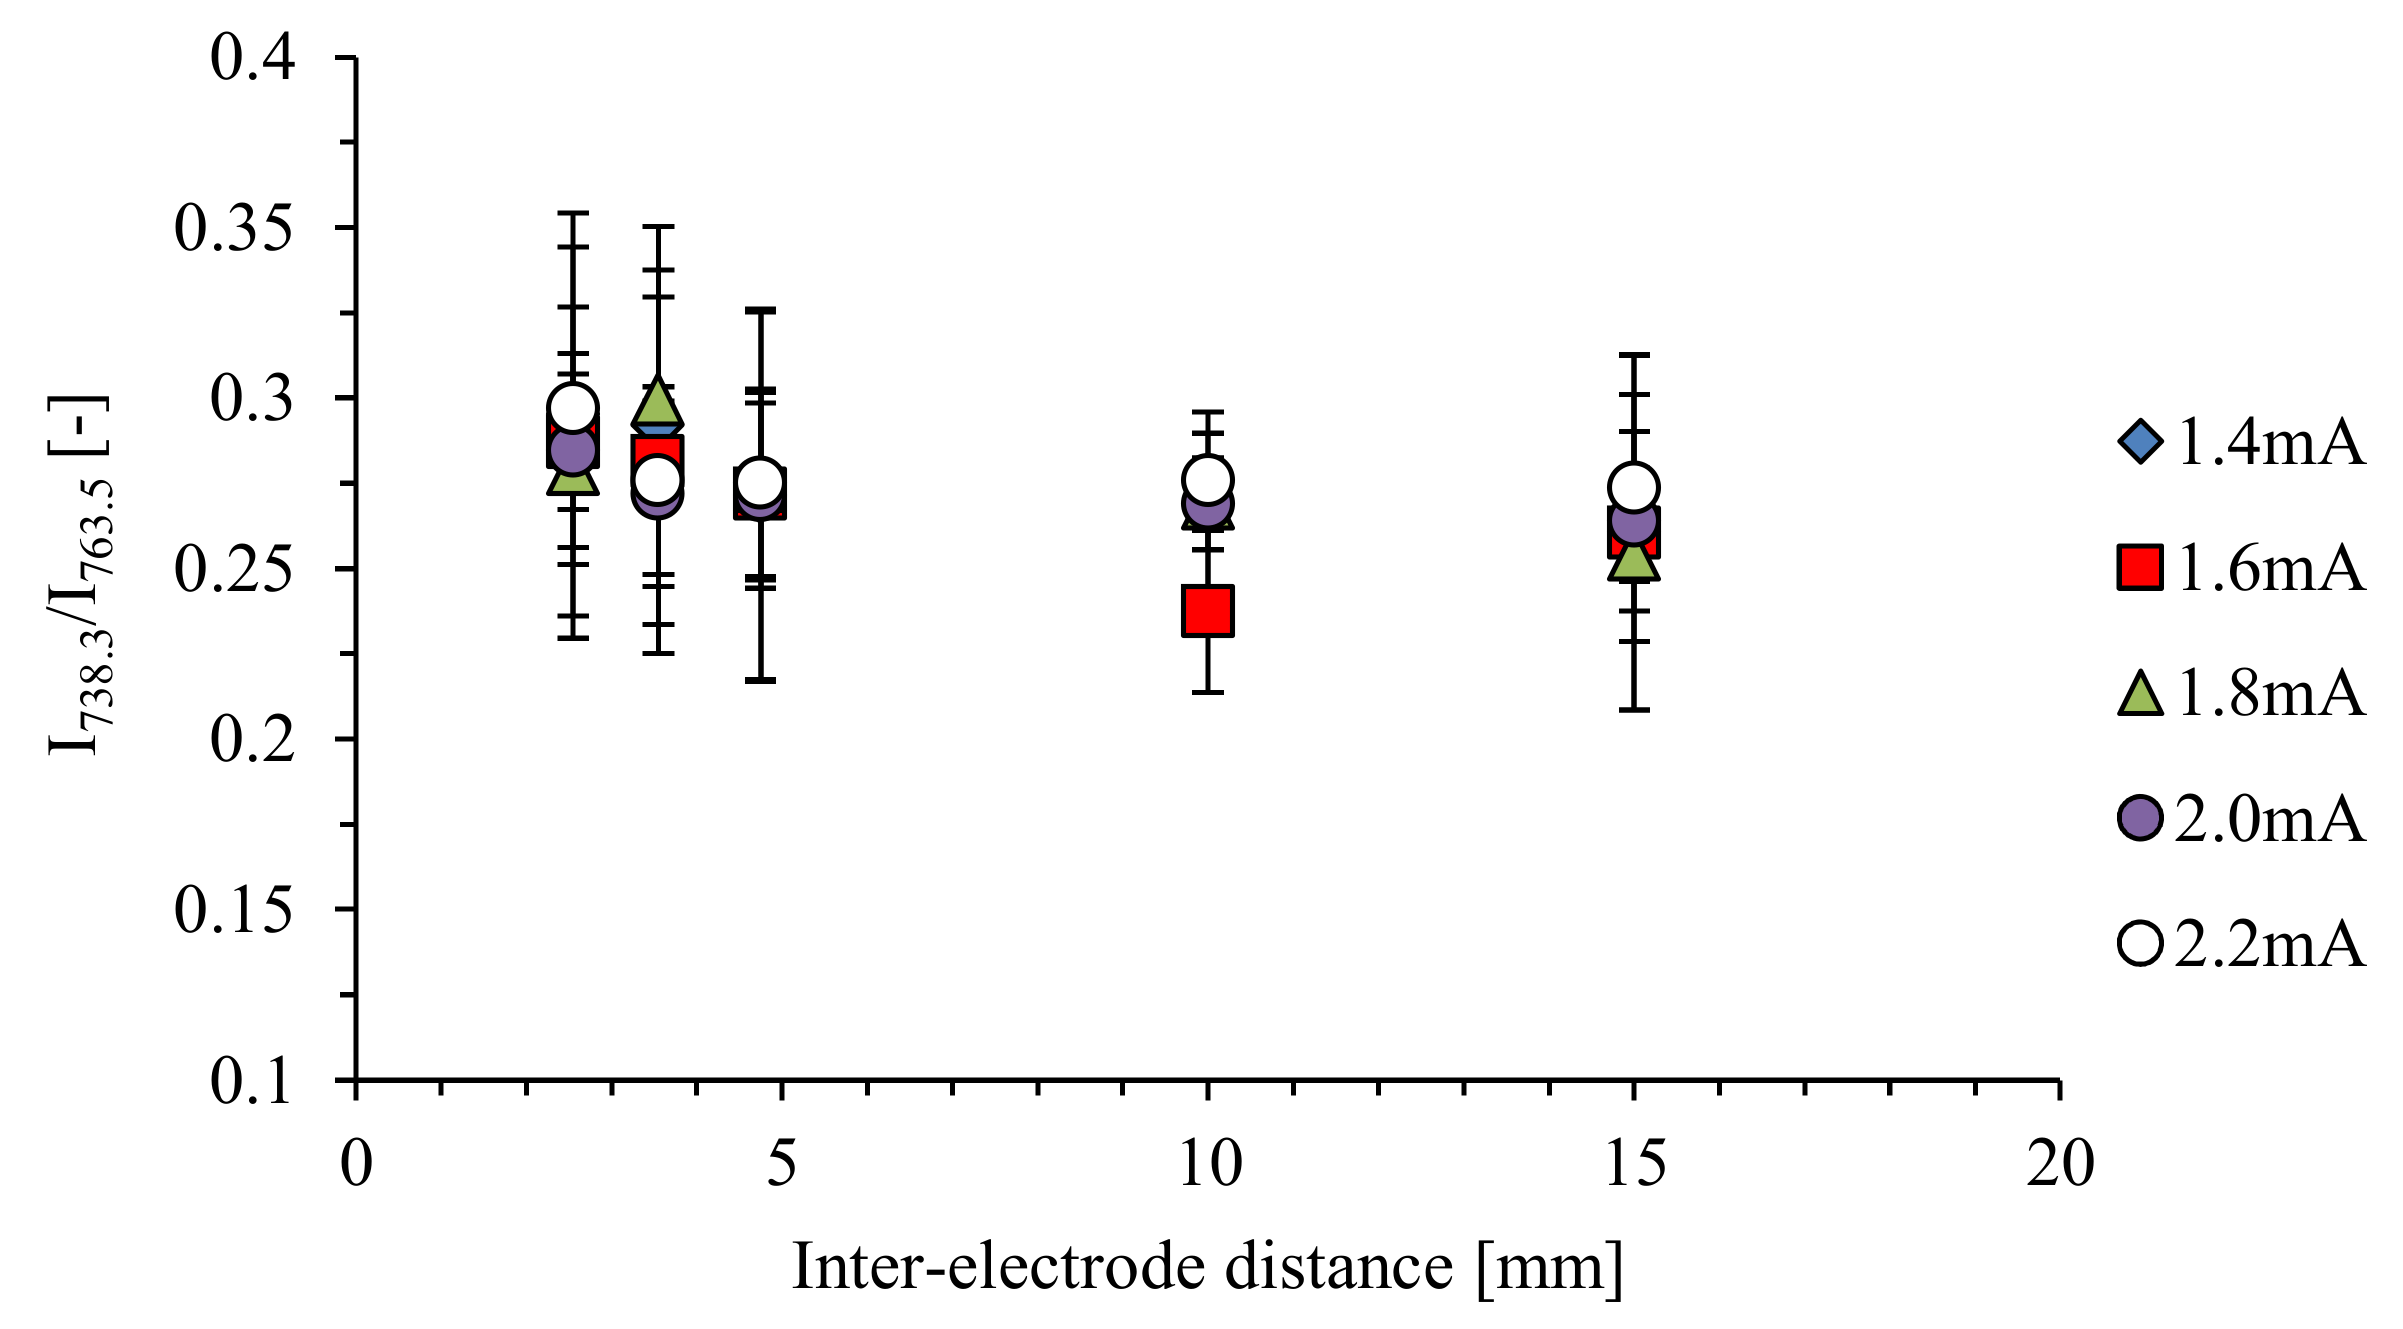
Zhu et al. [40] measured the electron density in atmospheric pressure plasmas by comparing the ratio of the intensity of lines of argon 2p-1s transitions and interpreting them using a collisional–radiative model. The ratio of the intensity of lines of Ar (2p3 → 1s4) at 738.4 nm and Ar (2p6 → 1s5) at 763.5 nm is very sensitive to the variations of electron density in plasma in the range of 1014–1016 cm−3. By comparing these line ratios for different discharge currents and different inter-electrode distances, it can be concluded that the electron density in electrical discharge does not depend on the inter-electrode distance in the range of 2.55–15 mm. Additionally, there was not a significant difference between the discharge currents (Figure 10). The ratio of the intensity of the line was in the range of 0.25–0.3.
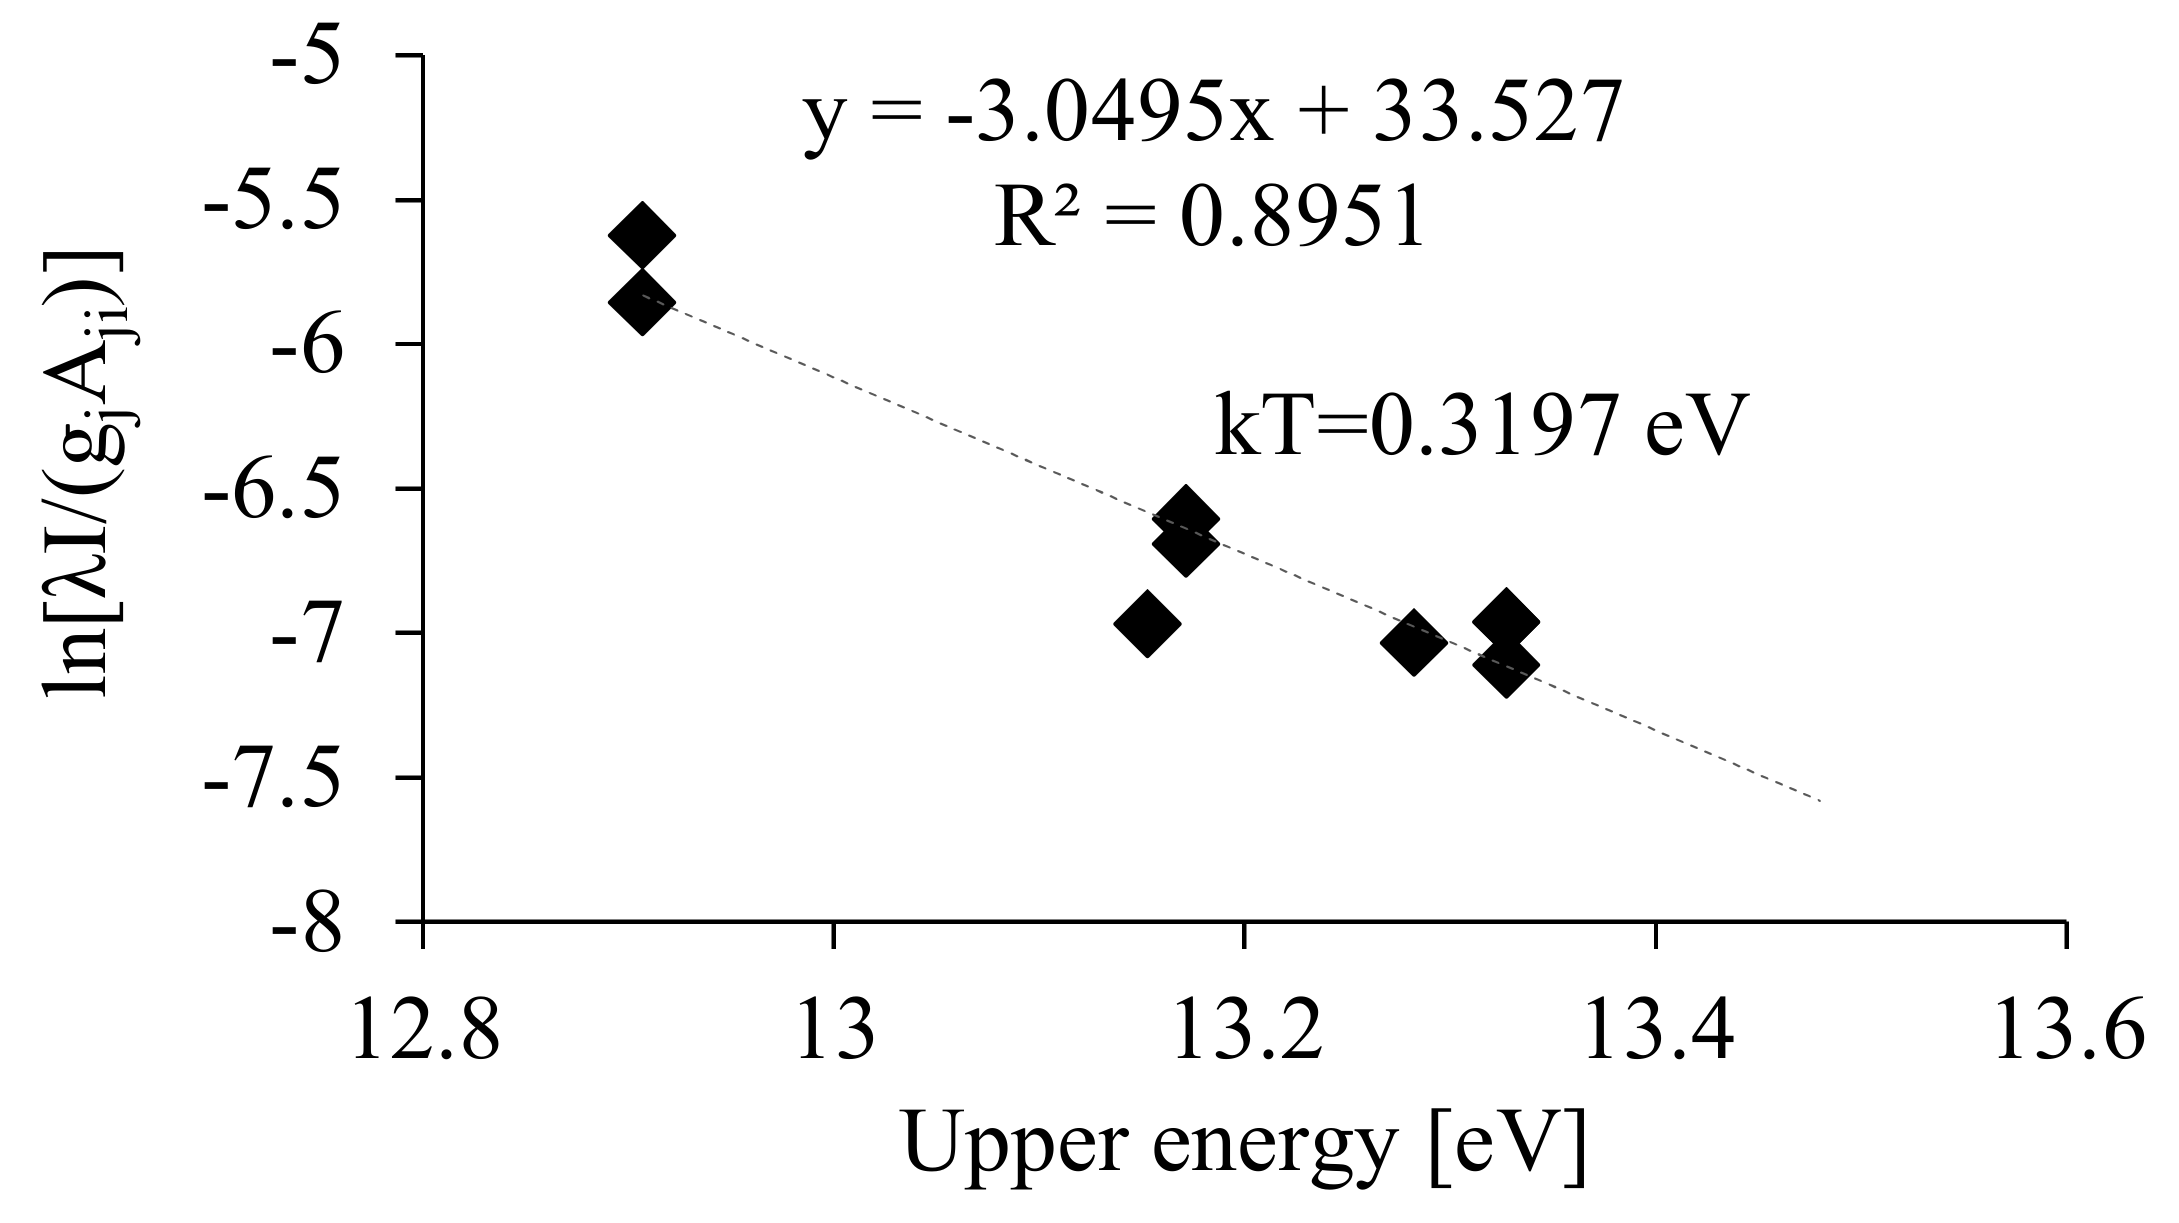
Atmospheric-pressure microplasmas are generally in near-partial-local thermodynamic equilibrium. The excitation temperature may be determined from Ar emission lines intensities obtained using the Boltzmann plot method from the following expression [41]:
l n I i j λ i j g i A i j = E i k T e x c + C ,
where Iij is the relative intensity of the emission line between the energy levels i and j, λij is its wavelength, gi is the degeneracy or statistical weight of the emitting upper level i of the studied transition and Aij is the probability of transition for a spontaneous radiative emission from the level, i, to the lower level, j. Finally, Ei is the excitation energy of the level i, k is the Boltzmann constant and C is a constant. An example of the linear Boltzmann plot for Ar I transition lines is shown in Figure 11.
Figure 12 shows the calculated excitation temperature as a function of discharge current for different inter-electrode distances. There is a difference between the excitation temperature for shorter inter-electrode distances and for longer inter-electrode distances. For a short inter-electrode distance (2.55 or 3.55 mm) the excitation temperature was about two times higher than for 15 mm.
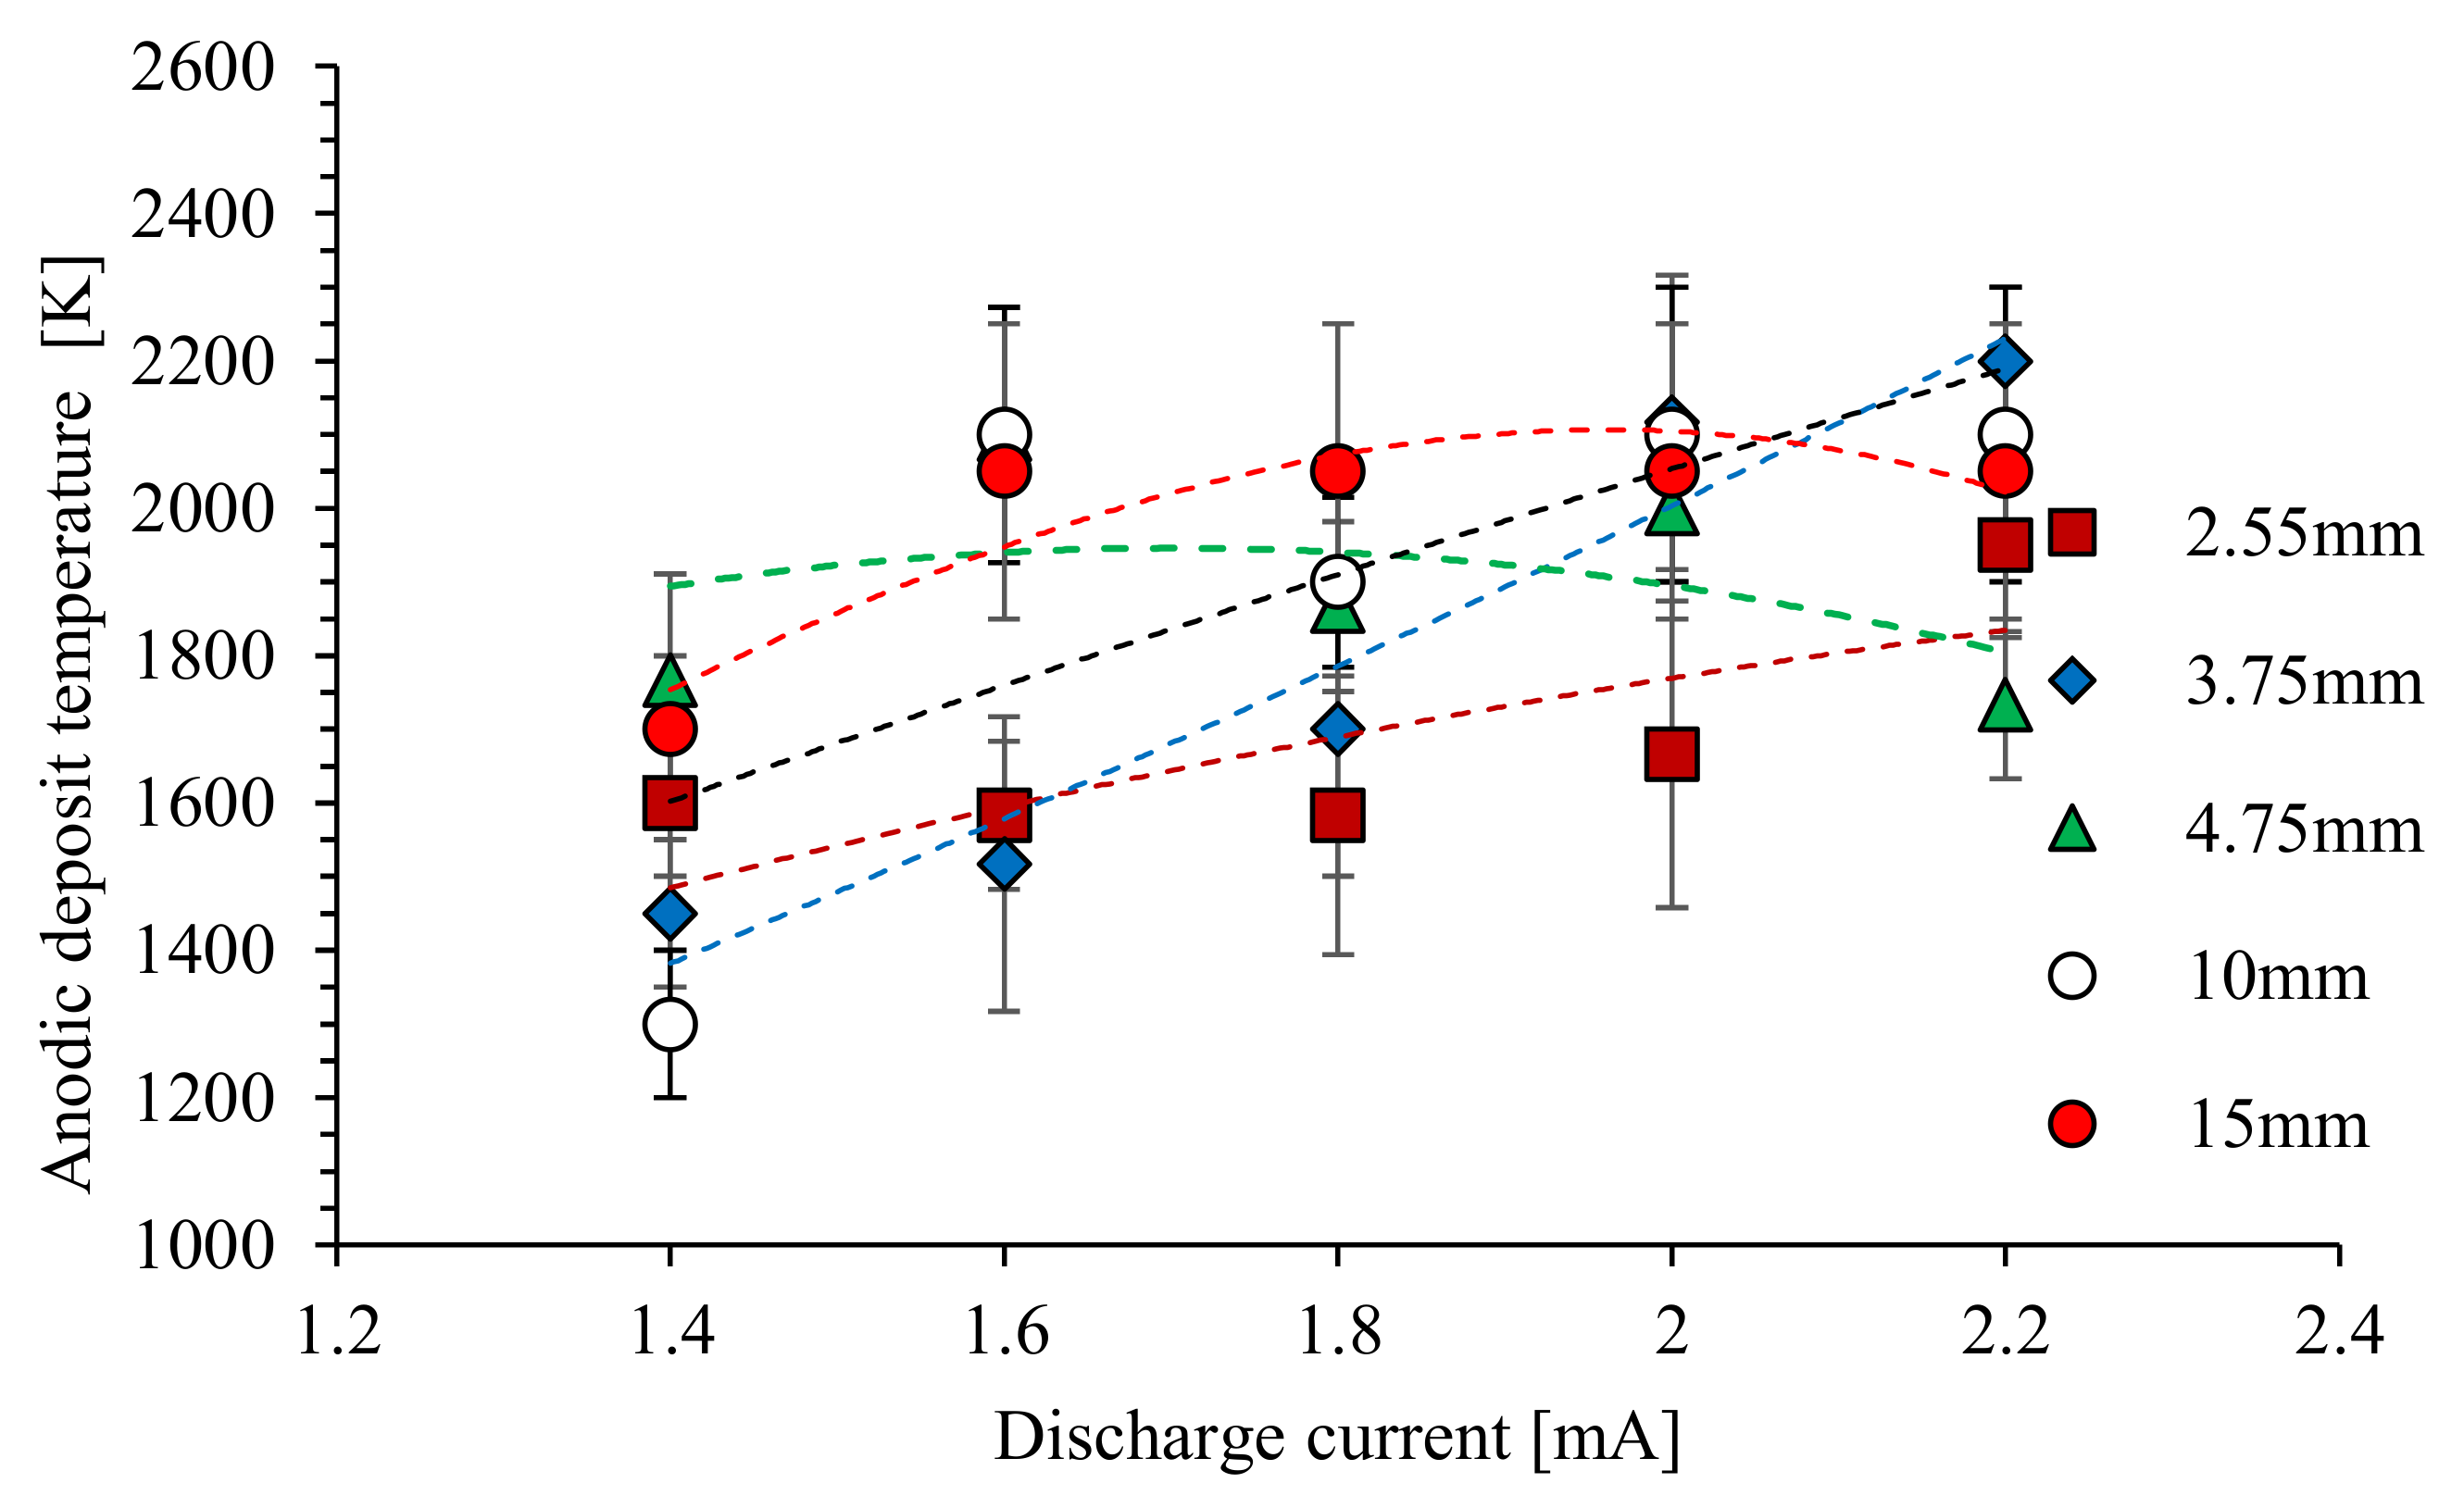
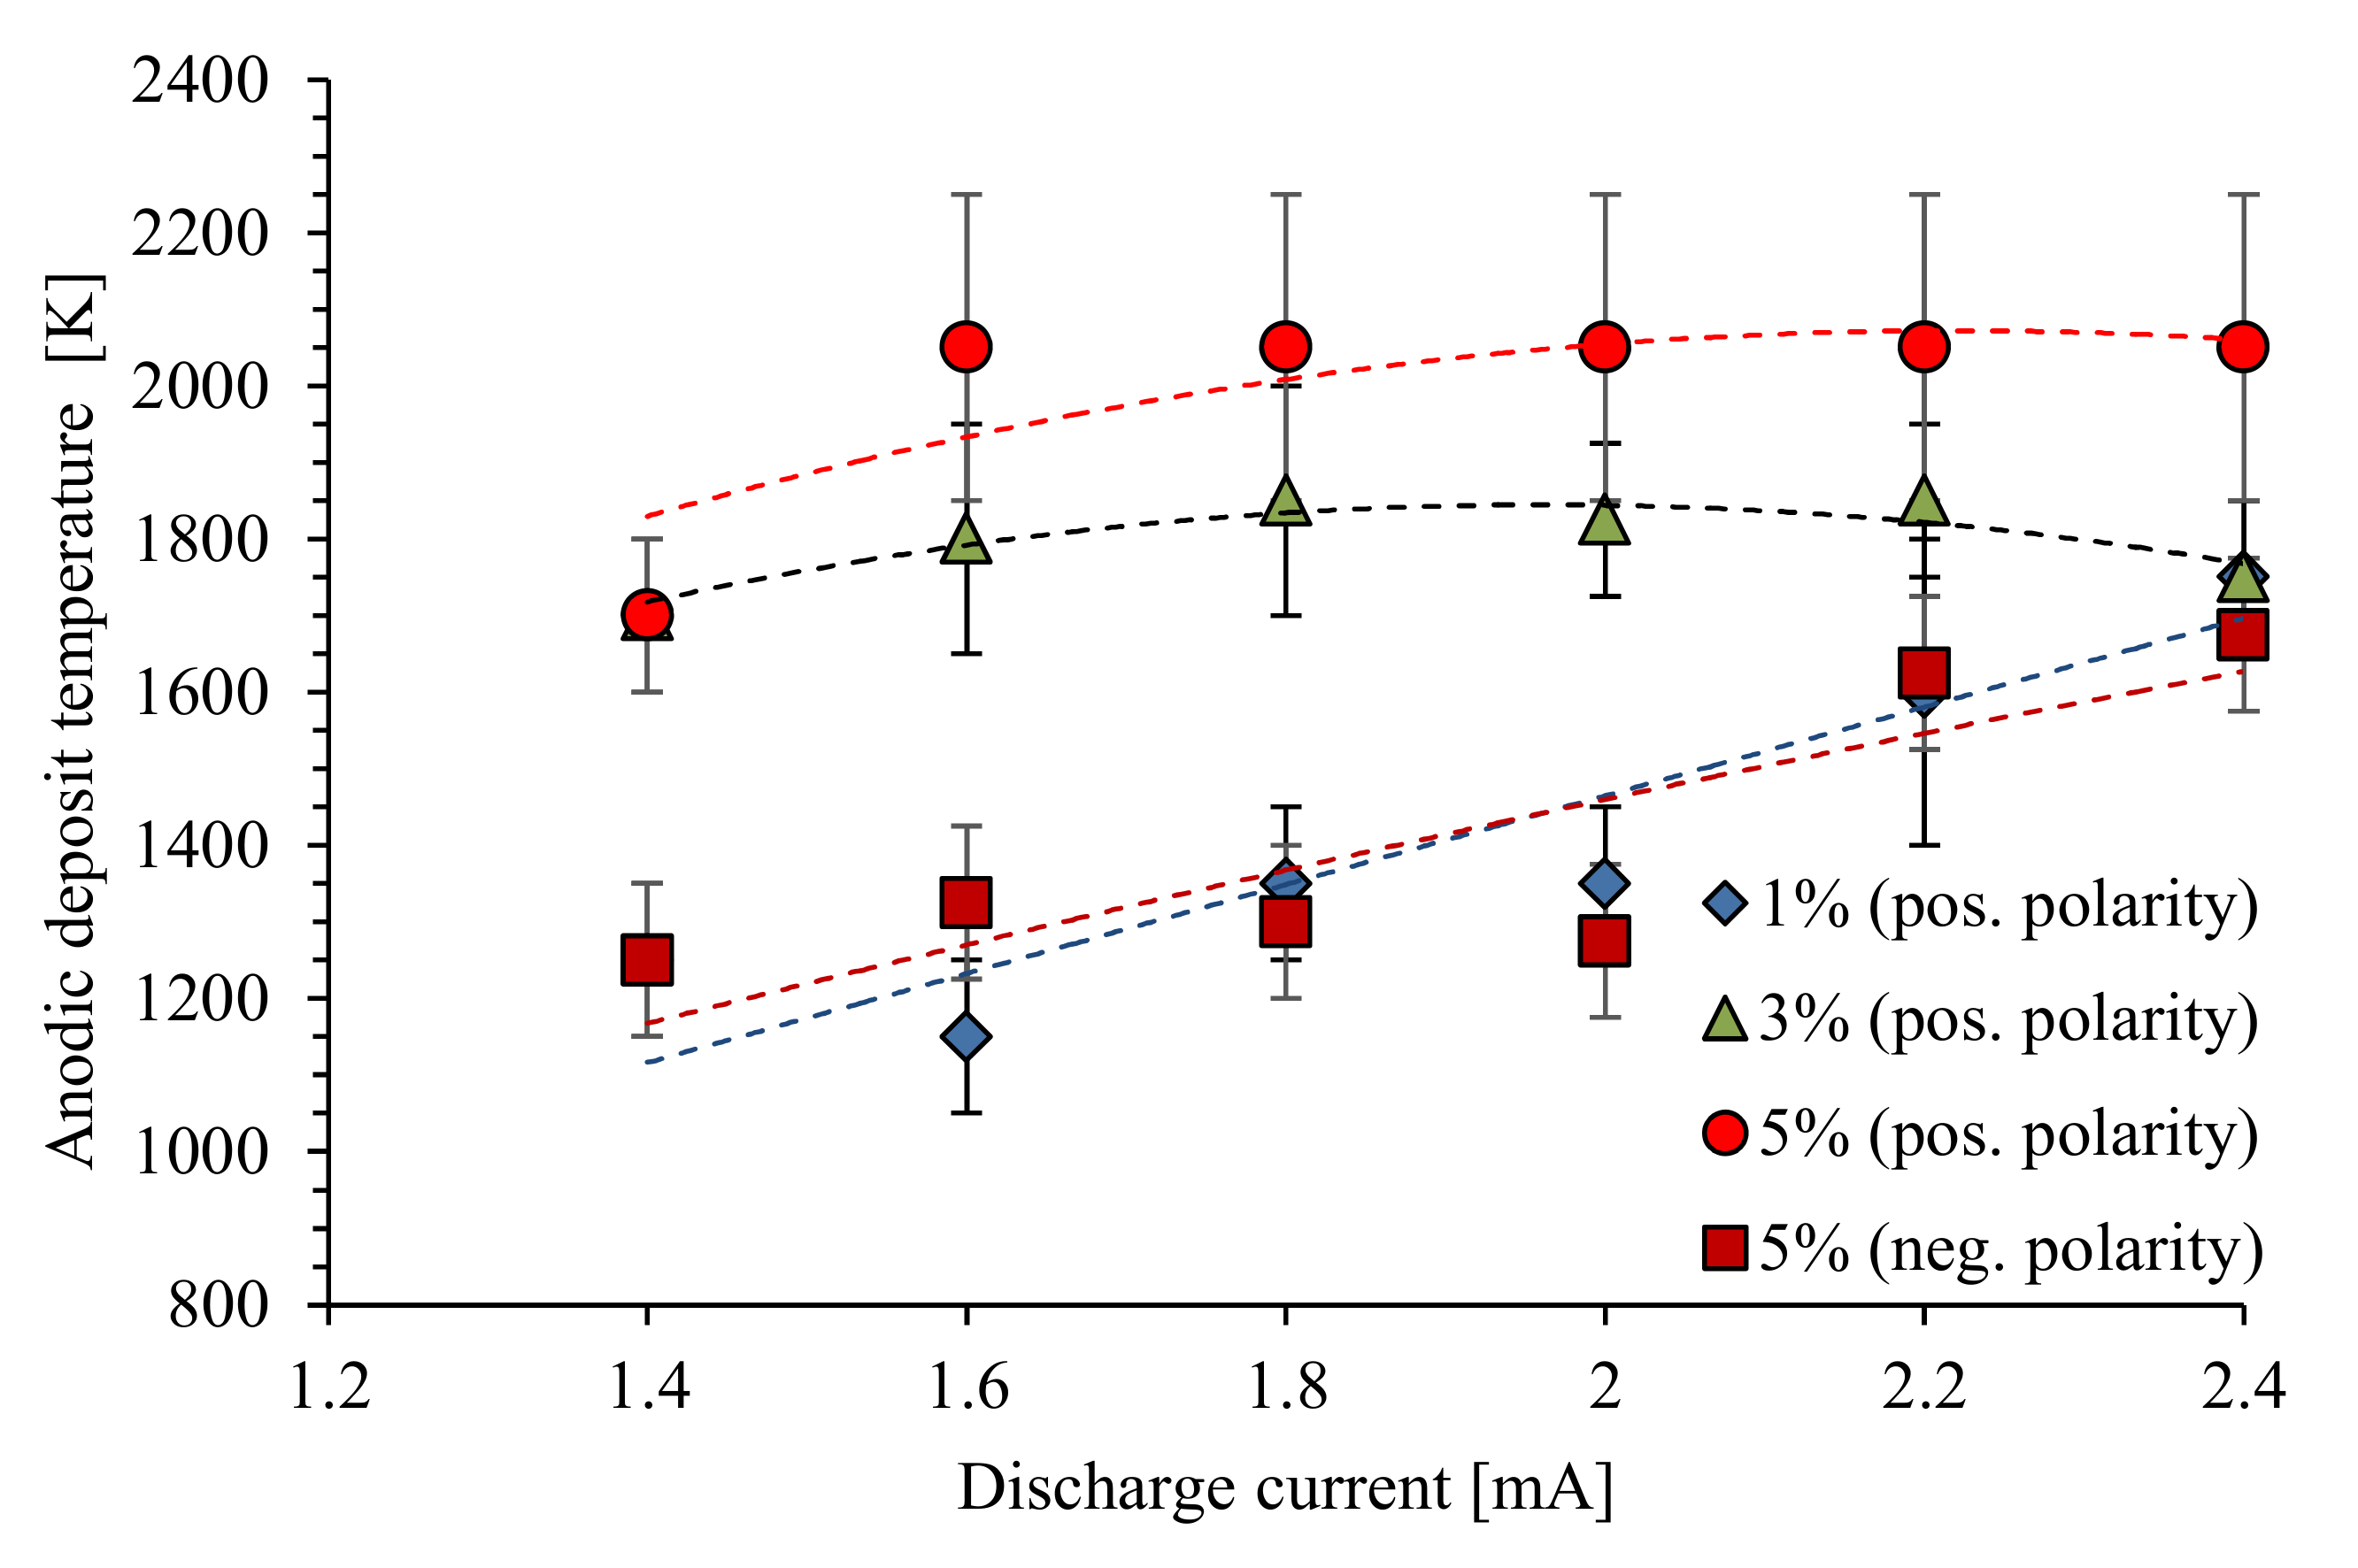
Assigning the continuous emission to the blackbody radiation of a hot anodic carbon deposit, the temperature of the deposit can be estimated through the fitting the continuous emission spectrum to the Planck blackbody radiation function. The anodic deposit temperature vs. discharge current for various inter-electrode distances is shown in Figure 13. The temperature of the deposit was estimated to be in the range of 1400 to 2200 K and is strongly dependent on the discharge current and inter-electrode distance. The temperature of the deposit also decreases with the concentration of cyclohexane (Figure 14). For the lowest concentration of cyclohexane (1%), the temperature of the anodic deposition was in the range of 1200–1600 K, which was much lower than for the deposit obtained for 3 and 5% cyclohexane. Additionally, the temperature of the deposit obtained for a negative polarity was lower, but it could be the effect of the deposit size (500 μm deposit diameter).

3.3. Carbon Deposit

Various forms of carbon deposit were obtained on the needle and plate electrodes as an effect of hydrocarbon decomposition in electric-discharge plasma. The morphology and growth rate of these deposits depended on the discharge current, the distance between the electrodes and the concentration of cyclohexane in the gas mixture.
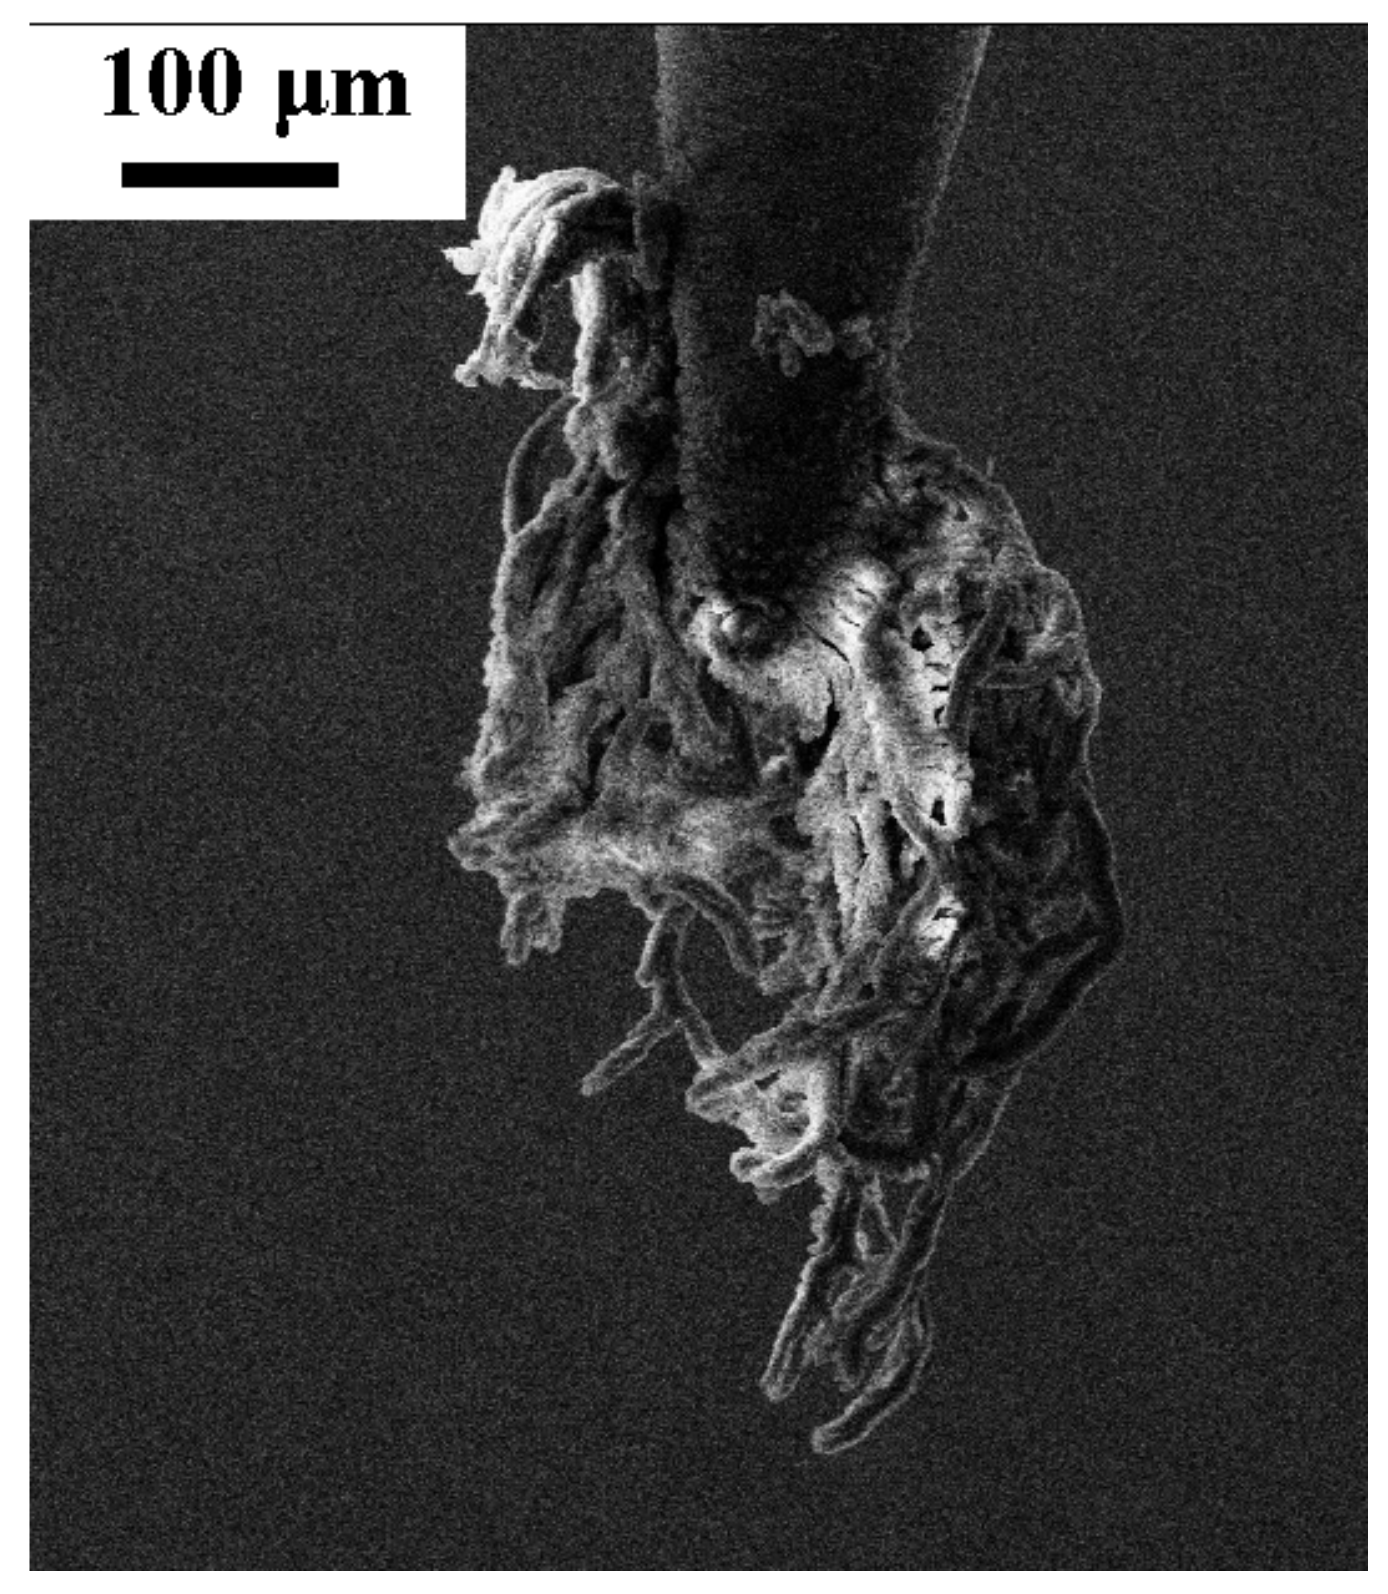
In the case of onset streamers and glow corona discharges, the deposit obtained on the needle was in the form of irregular structures (Figure 15). The plate was coated by oiled substances during these irregular discharges, and some small carbon deposits in the form of a mound can also be obtained (photograph not shown). These kinds of structures were observed for an inter-electrode distance in the range of 2.55 to 25 mm.
Corona discharge is characteristic for a discharge where one of the electrodes is of high curvature. The magnitude of the electric field close to the electrode tip is large enough to lead to collisional ionization processes. Primary electrons released as a result of collisional ionization and secondary electrons released from the electrode by the bombardment of its surface by gaseous ions cause avalanche ionization in the presence of a strong electric field. These processes only occur in a thin layer near the electrode because there is a sufficiently strong electric field in this region (so-called ionization zone). The electric field in this area is of the order of magnitude of 106 V/m. With such a high electric field, the electrons present in this region are accelerated to a high kinetic energy sufficient for collisional ionization.
The main building blocks of carbon deposits obtained in the electric discharge microplasma in a mixture of argon and cyclohexane are radicals and neutral products of the decomposition of cyclohexane. These products are obtained due to the collision of electrons of sufficiently high energy with cyclohexane molecules; one example is the following:
c − C6H12 + e → Rm + Rn + e,
where Rm and Rn are radicals.
A similar situation occurs when an argon atom is in the first excited state (metastable state) after collision with an energetic electron and transfers its internal energy to a cyclohexane molecule after an impact, as follows:
c − C6H12 + Arm → Ar(1S0) + Rm + Rn.
As the energies of argon metastable states are relatively high, 11.55 eV and 11.72 eV, the cyclohexane and all products of cyclohexane decomposition can be ionized or dissociated to other products after collision. Radicals could interact with each other forming neutral molecules and/or other new radicals.
The formation of an “oil” form of deposit remaining on the plate electrode can proceed due to the interaction of radicals in the following reaction:
Rx + Ry → Px+y,
where Px+y is a neutral product (hydrocarbon) of higher molecular weight than cyclohexane. The gas temperature in this zone is low, and the interaction with charged or high energetic particles is weak.
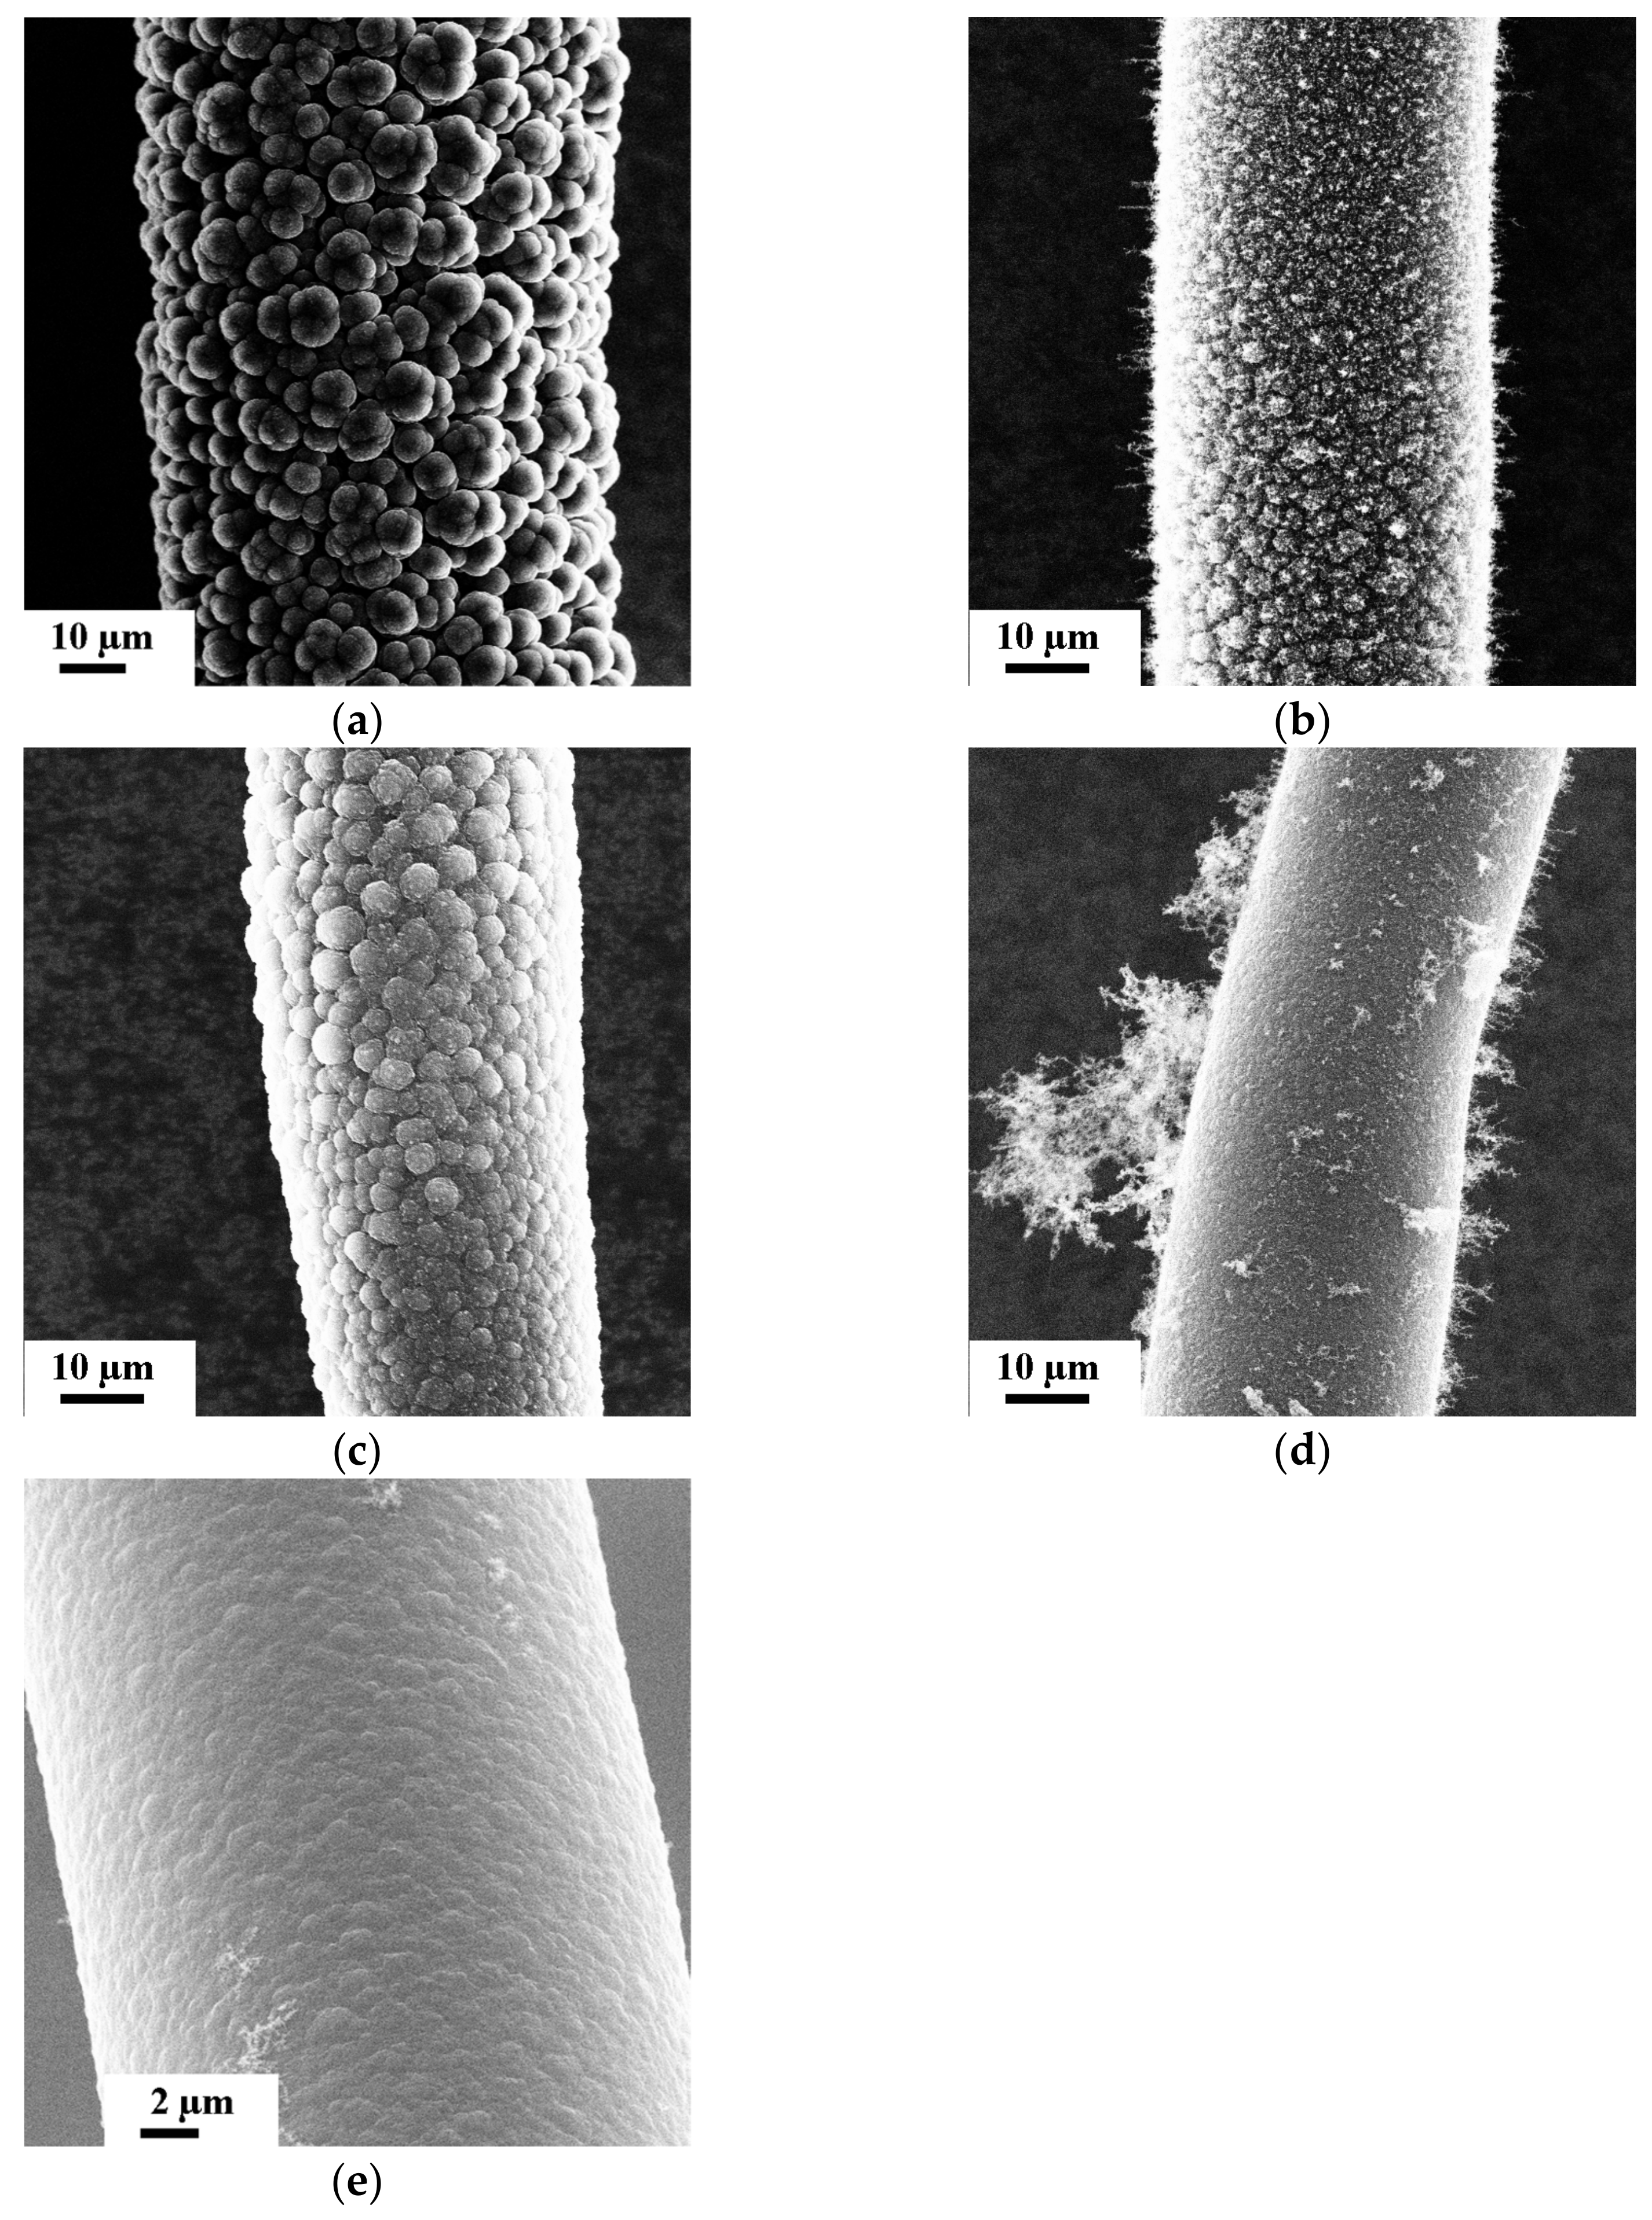
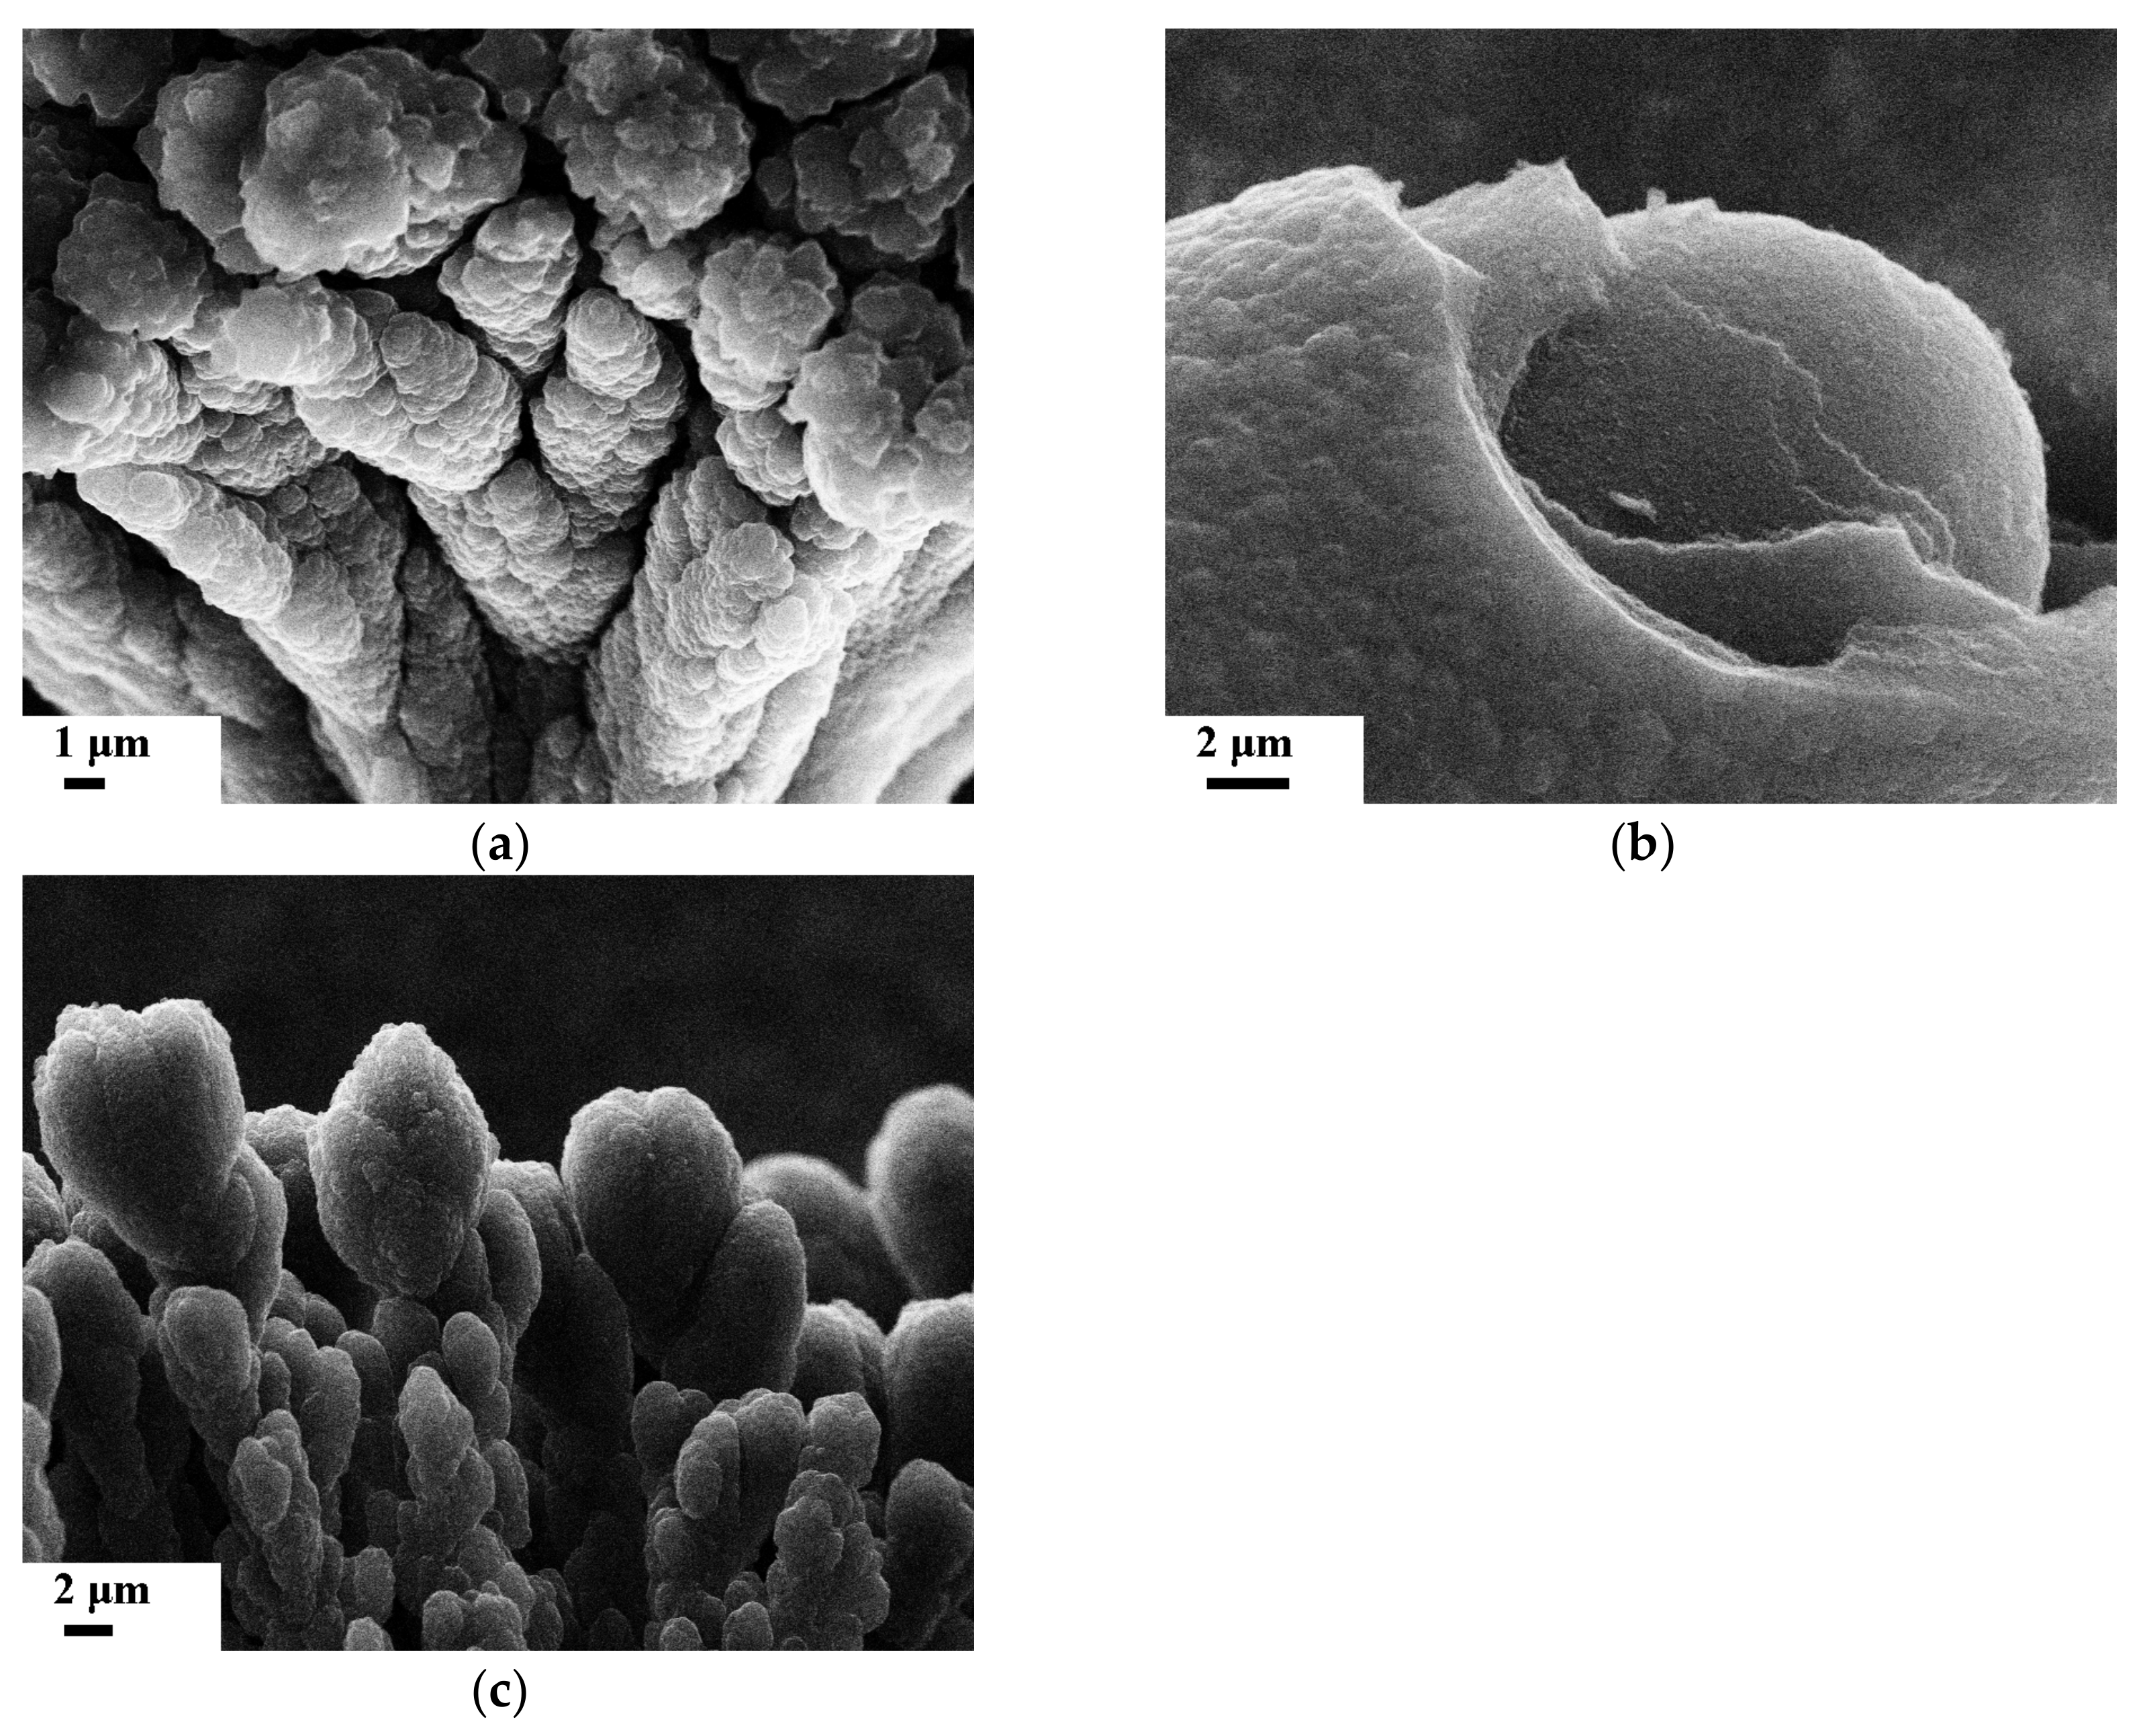
In the case of glow discharge, the interaction of atoms and molecules with electrons and charged particles occurs for all inter-electrode distances. Figure 16 shows typical SEM images of carbon deposits grown under different cyclohexane concentrations by a discharge current of 1.8 mA. The change of the cyclohexane concentration influenced the morphology of carbon fibers. For 1% cyclohexane, the surface of the deposited carbon fibers was grainy, with large spaces between the grains (Figure 16a). With an increasing concentration of cyclohexane, the edge of the grains appeared smoother and the space between the grains became much smaller than those deposited under a lower concentration of cyclohexane (Figure 16b). For a 3% cyclohexane concentration (Figure 16c), the structure of the carbon deposit has a tendency to become hybrid: one part of the deposit was grainy, and another part was smooth. For a 4 and 5% cyclohexane concentration, the surface of the carbon fiber was smooth (Figure 16d,e). For these concentrations of cyclohexane, soot particles were often stacked to the surface of the carbon deposit. The anodic carbon deposits have a diameter in the range of 30 to 100 µm, depending on the diameter of the plasma column.
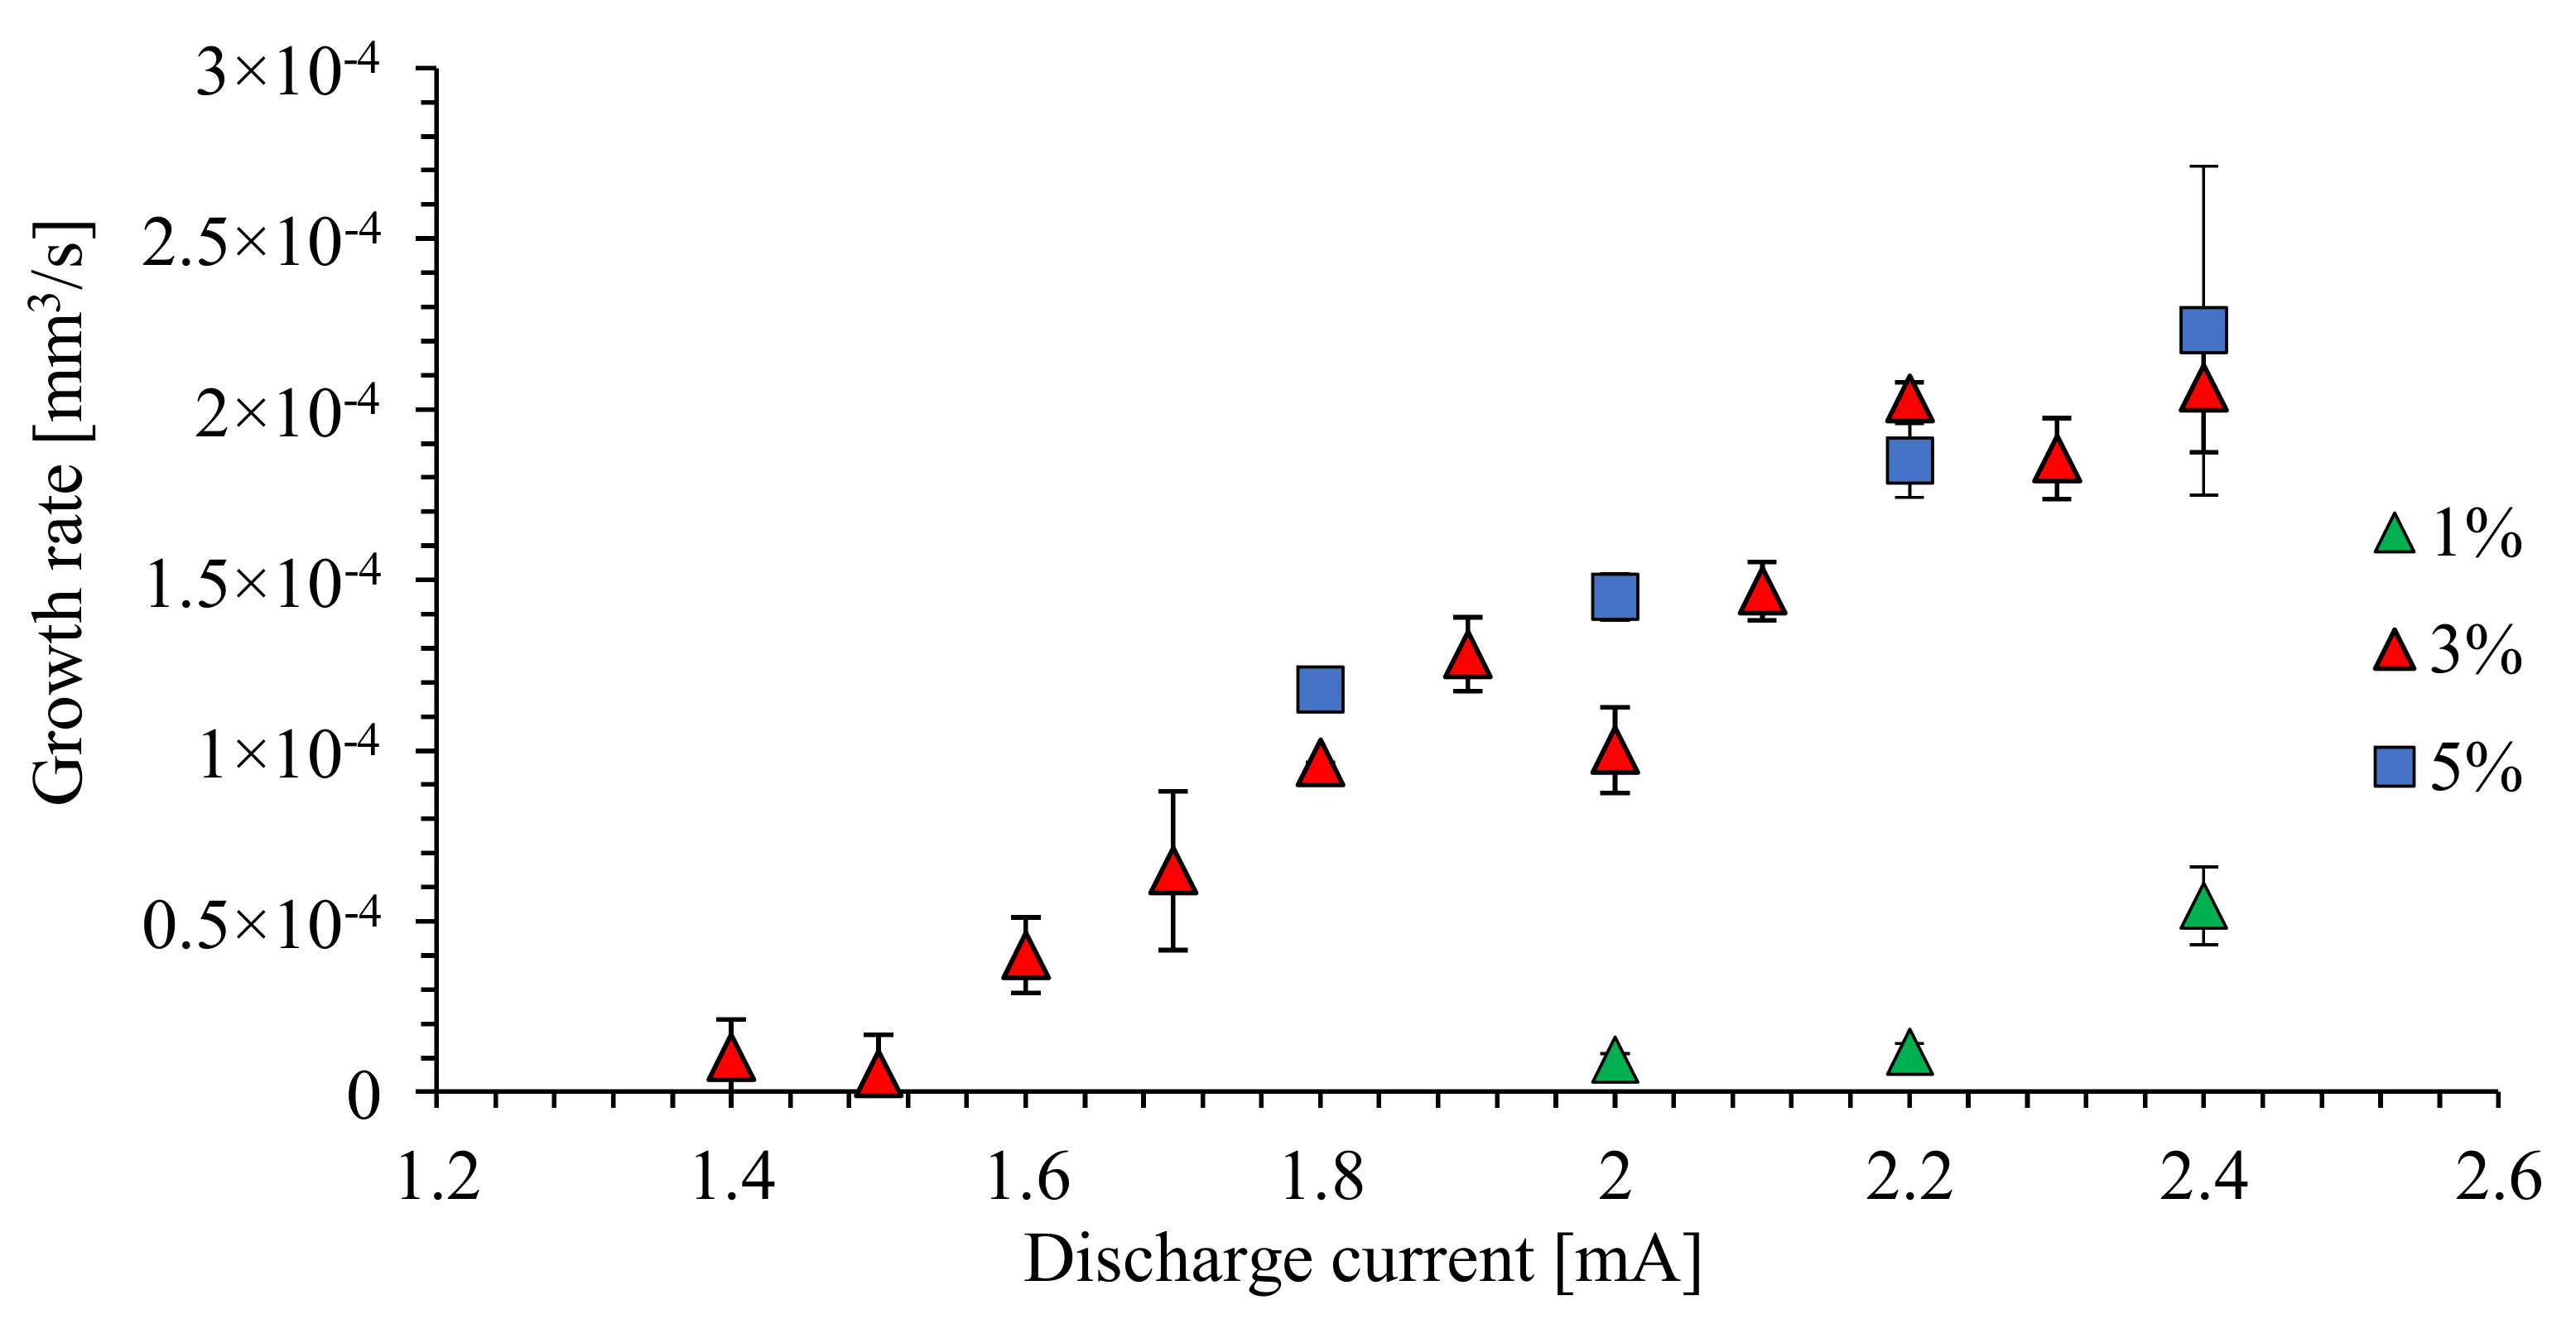
The growth rate of the carbon deposit was dependent on the discharge current (i.e., the power density delivered to the plasma column for cyclohexane decomposition) and the cyclohexane concentration. The volume growth rate of the carbon fibers deposited on the needle tip is shown in Figure 17. The growth rate for 1% cyclohexane was 3–4 times smaller than for 3 and 5% cyclohexane. For higher cyclohexane concentrations, the growth rate was similar, and was nearly a linear function of the discharge current.
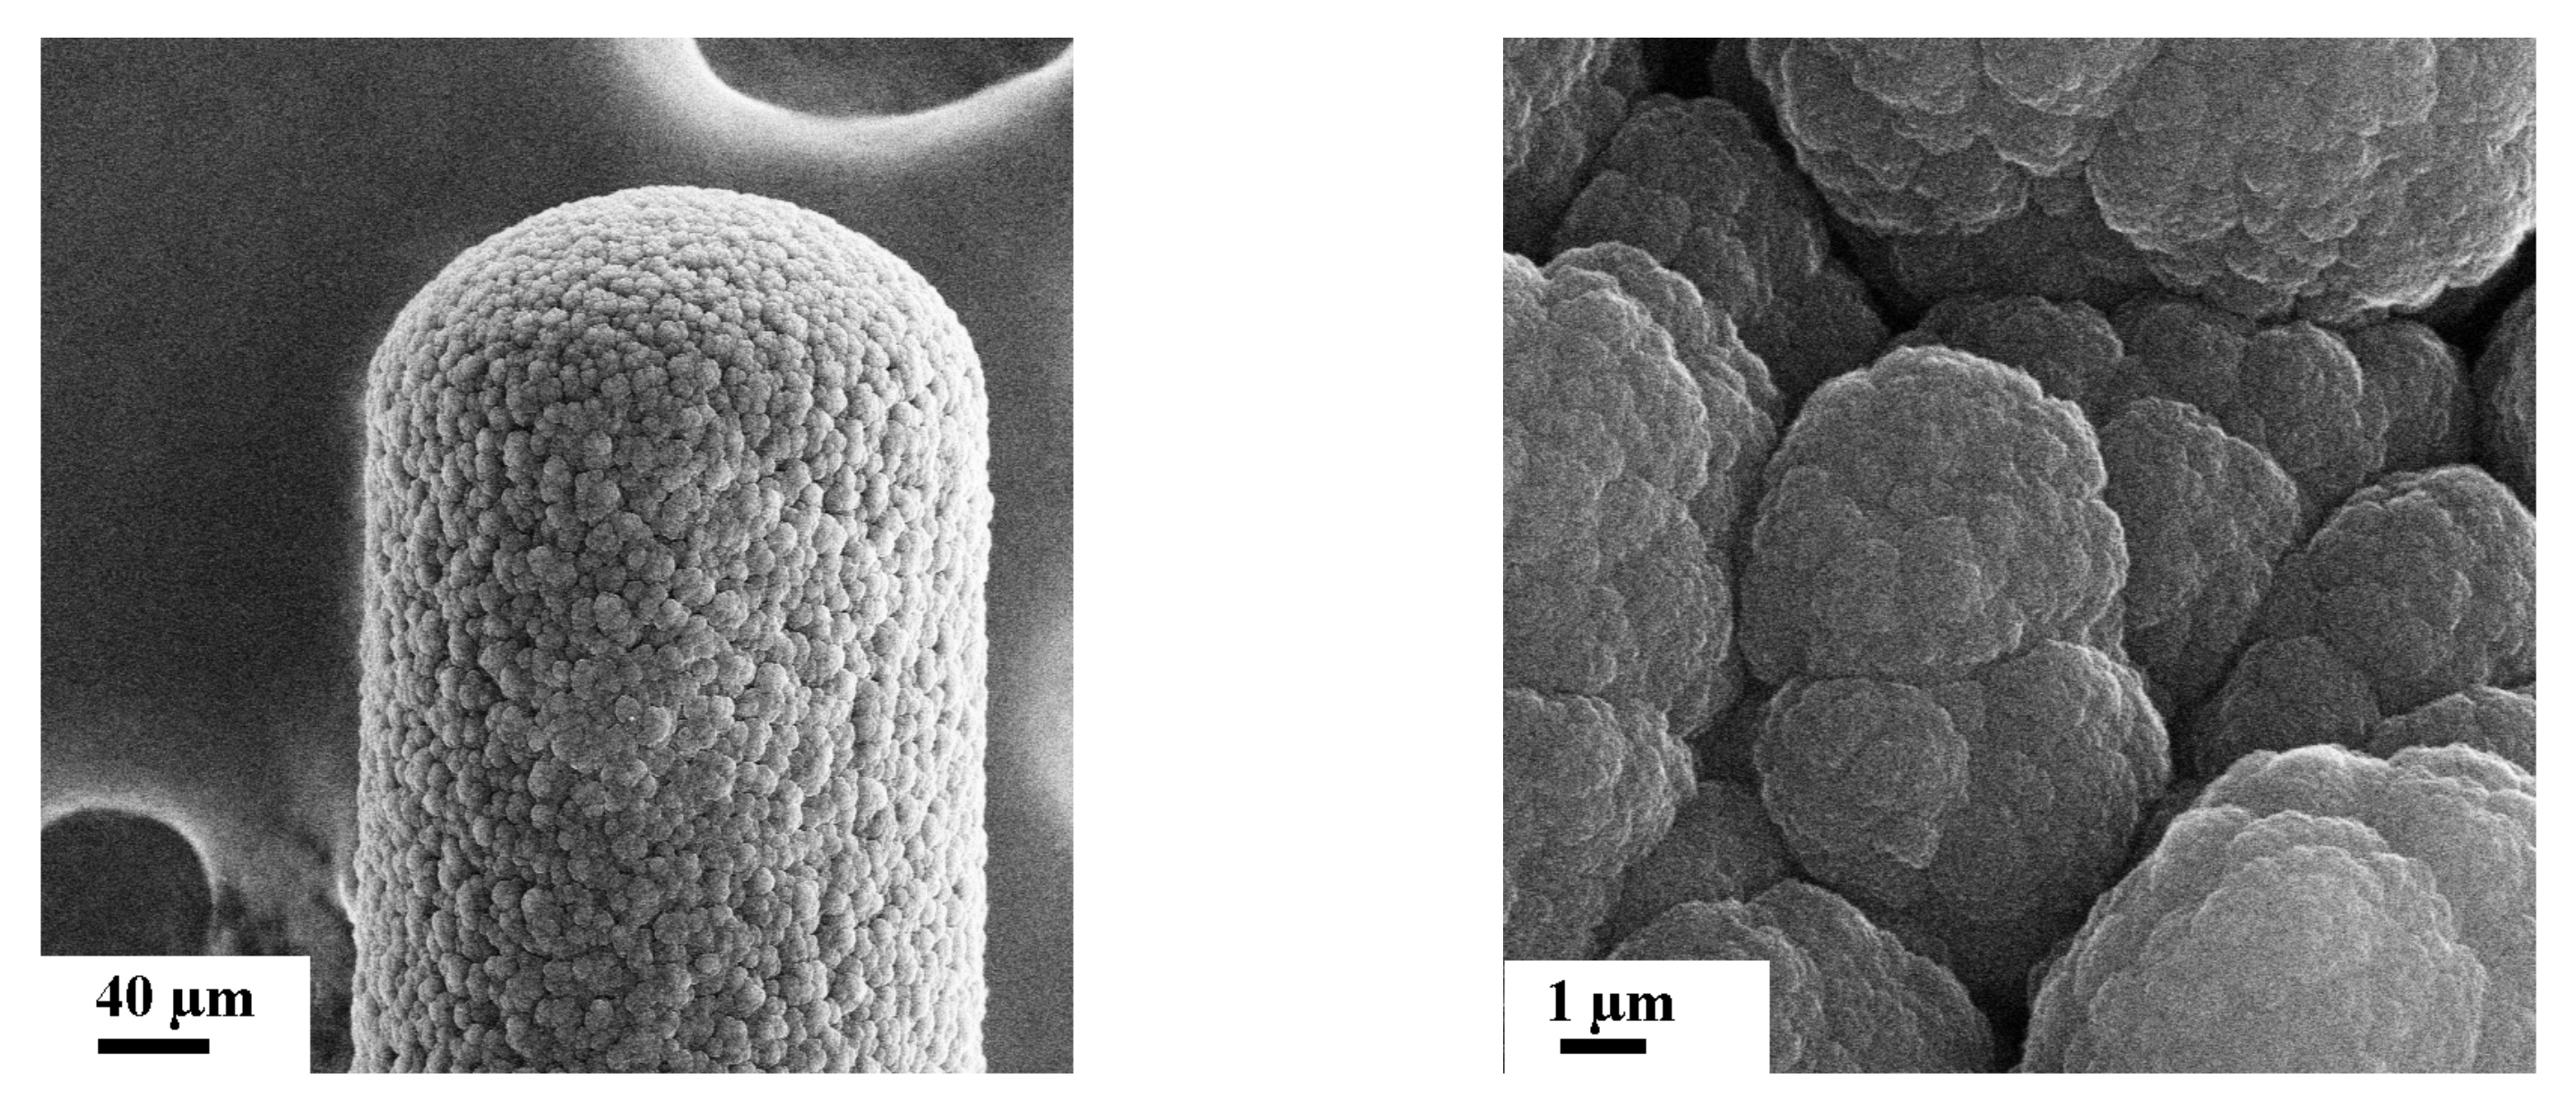
SEM images of the carbon deposit obtained on the cathode (needle electrode) during a negative polarity discharge in a mixture of argon Ar+C6H12 (95:5), by a discharge current of 1.8 mA are shown in Figure 18. For a negative polarity, the surface of the carbon deposit consisted of nodular dendrites, which have a diameter in the range of 5 to 10 µm, with large gaps between them. At a higher magnification, it is visible that each dendrite has cauliflower structures and consists of smaller nodules.
Fragments of broken carbon deposits taken from the needle at a positive and negative polarity are shown in Figure 19. The deposits synthesized for low hydrocarbon concentrations and for a positive polarity of the discharge electrode are similar to those obtained for a negative polarity for 5% cyclohexane. In both cases, the carbon deposits have a columnar morphology with nodular dendrites, and the growth process is determined by the carbon particles’ diffusion toward the electrodes (Peclet number >>1). Massuer et al. [42] suggested that the columnar morphology with voids between the column results from the process of columnar growth that occurs when the temperature of the deposit’s surface is low and the energy of the ions bombarding the anodic deposit is low. The temperature determined from the thermal spectrum was about 1300 K, for the positive and negative polarities of the discharge electrode. The morphology obtained for a negative polarity, by 5% cyclohexane, could result from the diffusion-limited aggregation by low temperatures, due to the reduced surface mobility of adatoms and the high sticking probability of radicals and ions [43,44]. When a needle is used as a cathode, the main builders of the deposit could be positive ions, the main products of cyclohexane dissociation [45]. Additionally, the cathode sheath could influence morphology (the voltage drop of a cathode should be higher than for an anode).
The carbon deposit obtained for 5% cyclohexane is synthesized layer-by-layer with smooth morphology. This structure could be named a carbon fiber according to IUPAC nomenclature [46].
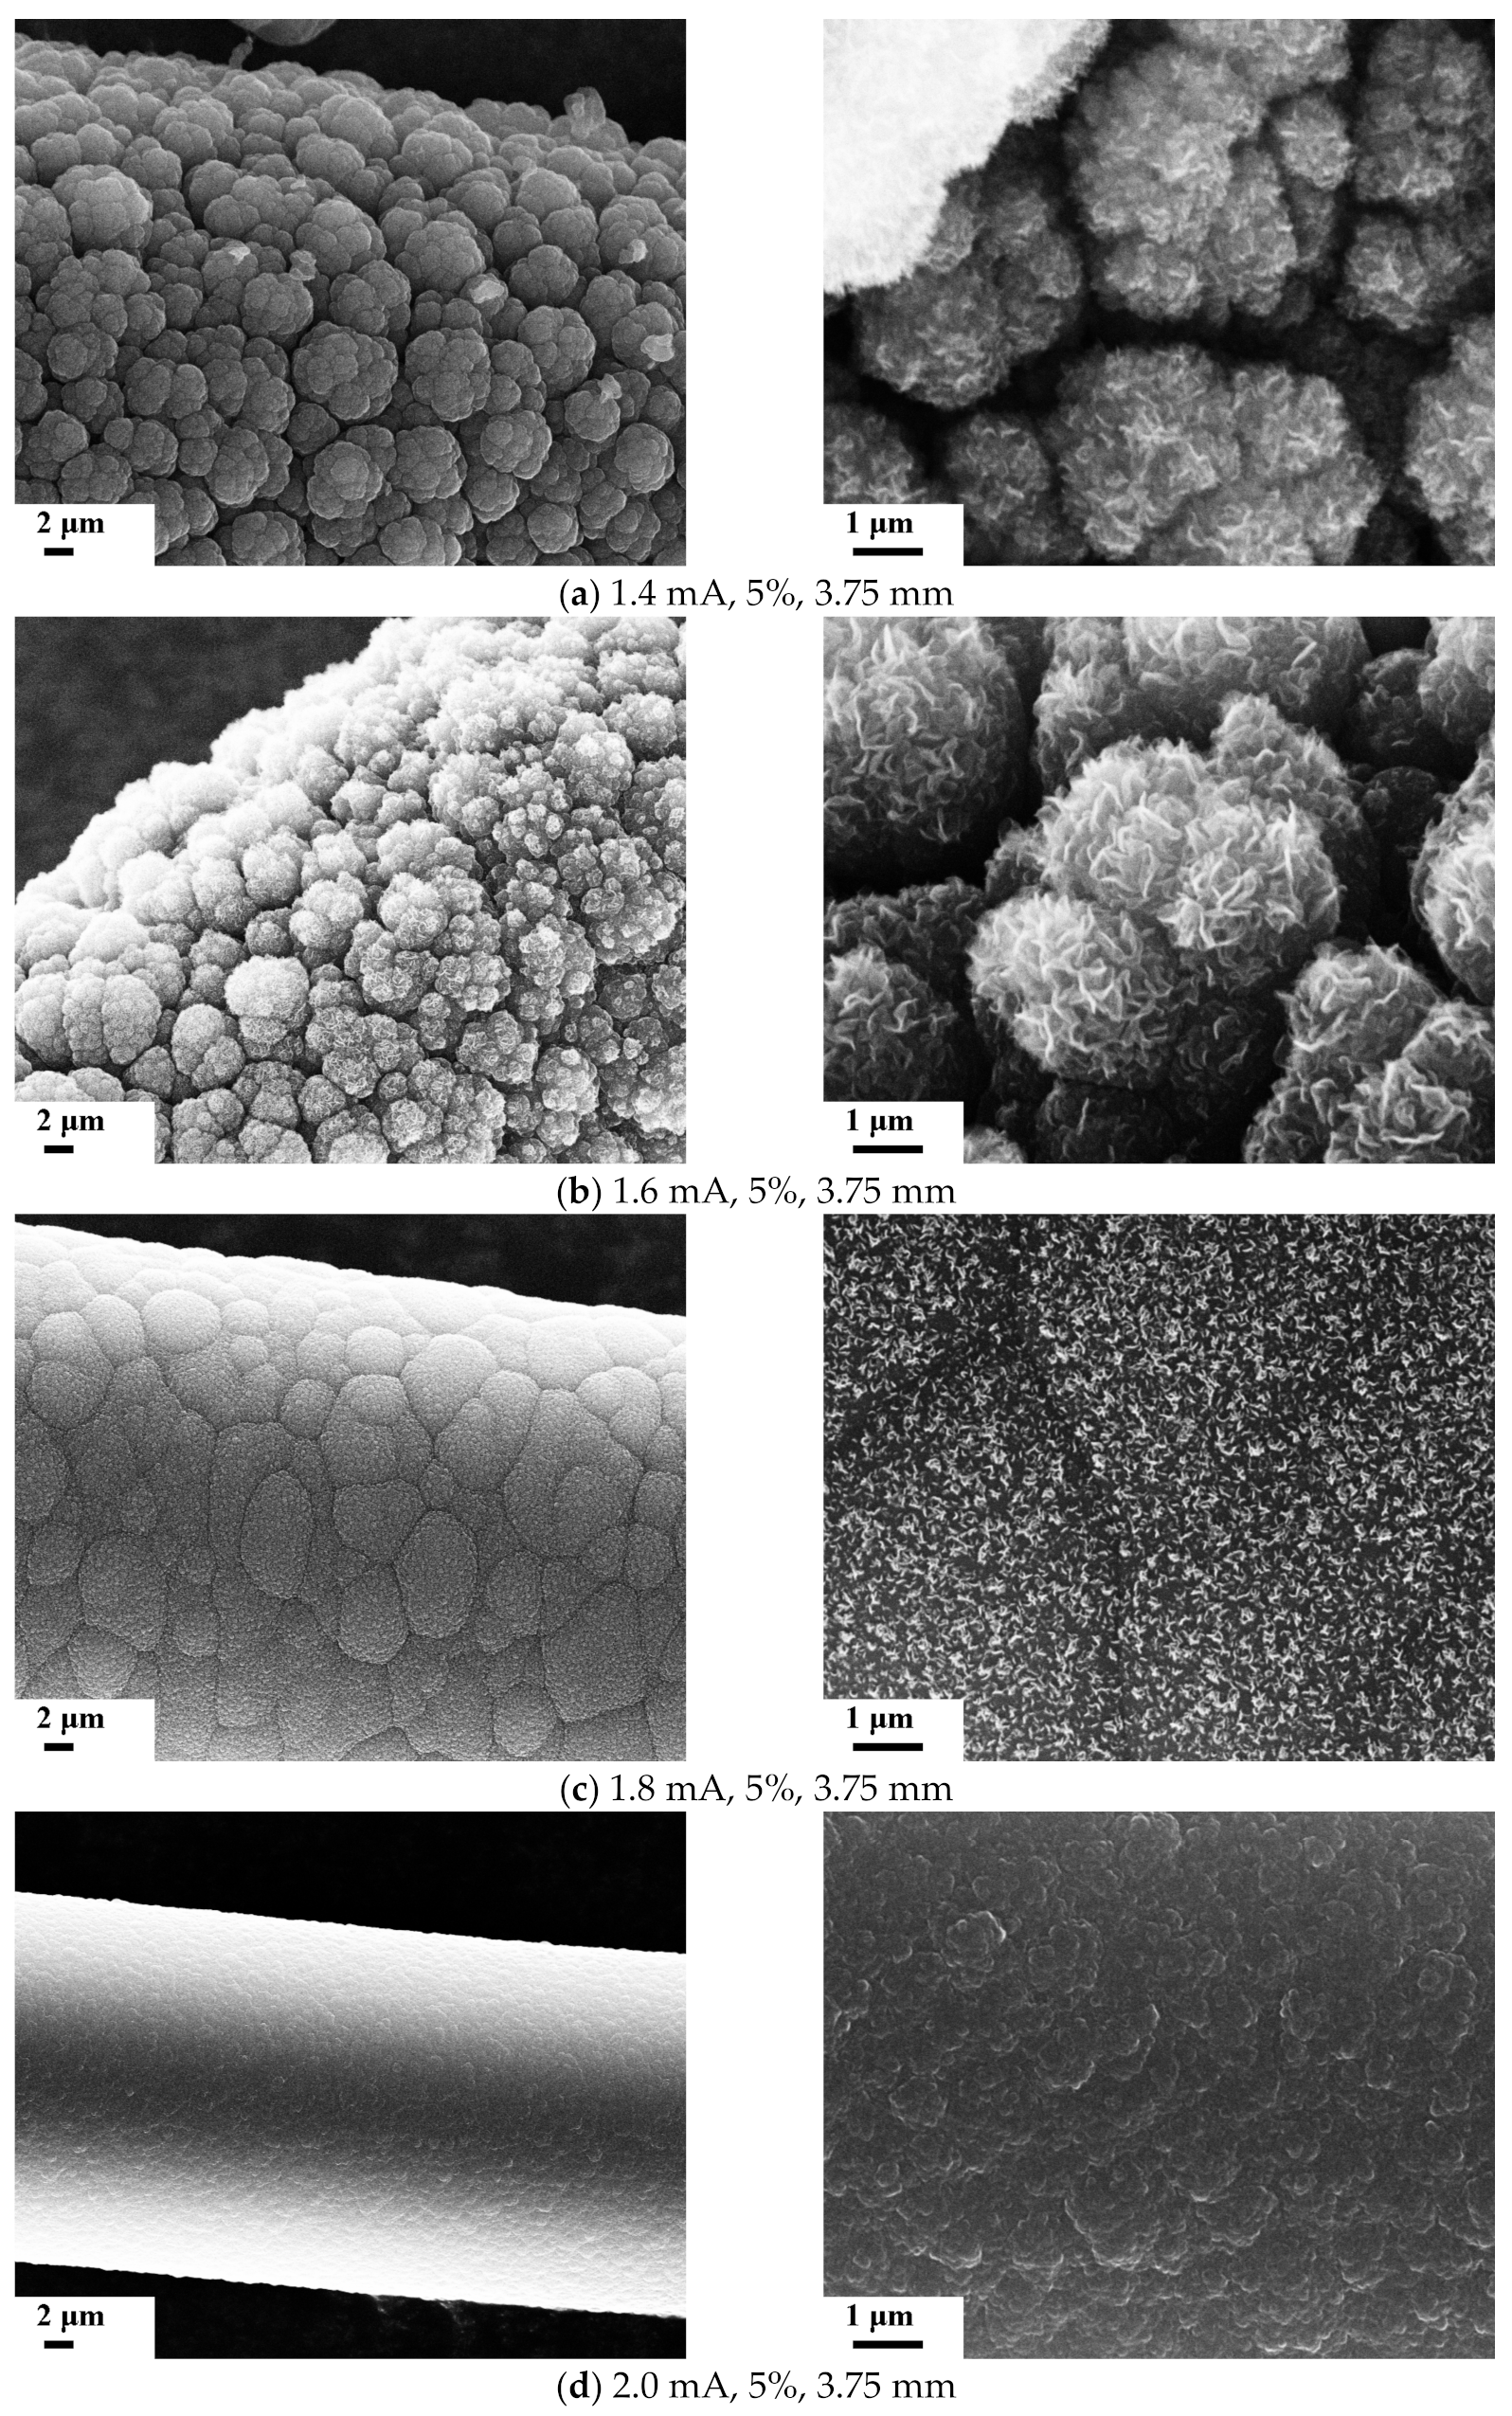
The SEM micrographs of the carbon deposits obtained for different discharge currents with an inter-electrode distance of 3.75 mm and a 5% cyclohexane concentration are shown in Figure 20. For a discharge current of 1.4 mA (Figure 20a), the carbon nanowalls were indistinct and barely visible. When the discharge current was increased to 1.6 mA (Figure 20b), the carbon nanowalls were large and densely packed. For a current of 1.8 mA (Figure 20c), carbon nanowalls are not produced and only the nanowalls’ nuclei can be noticed on the surface of the deposit. For a discharge current of 2 mA (Figure 20d), carbon nanowalls did not grow.
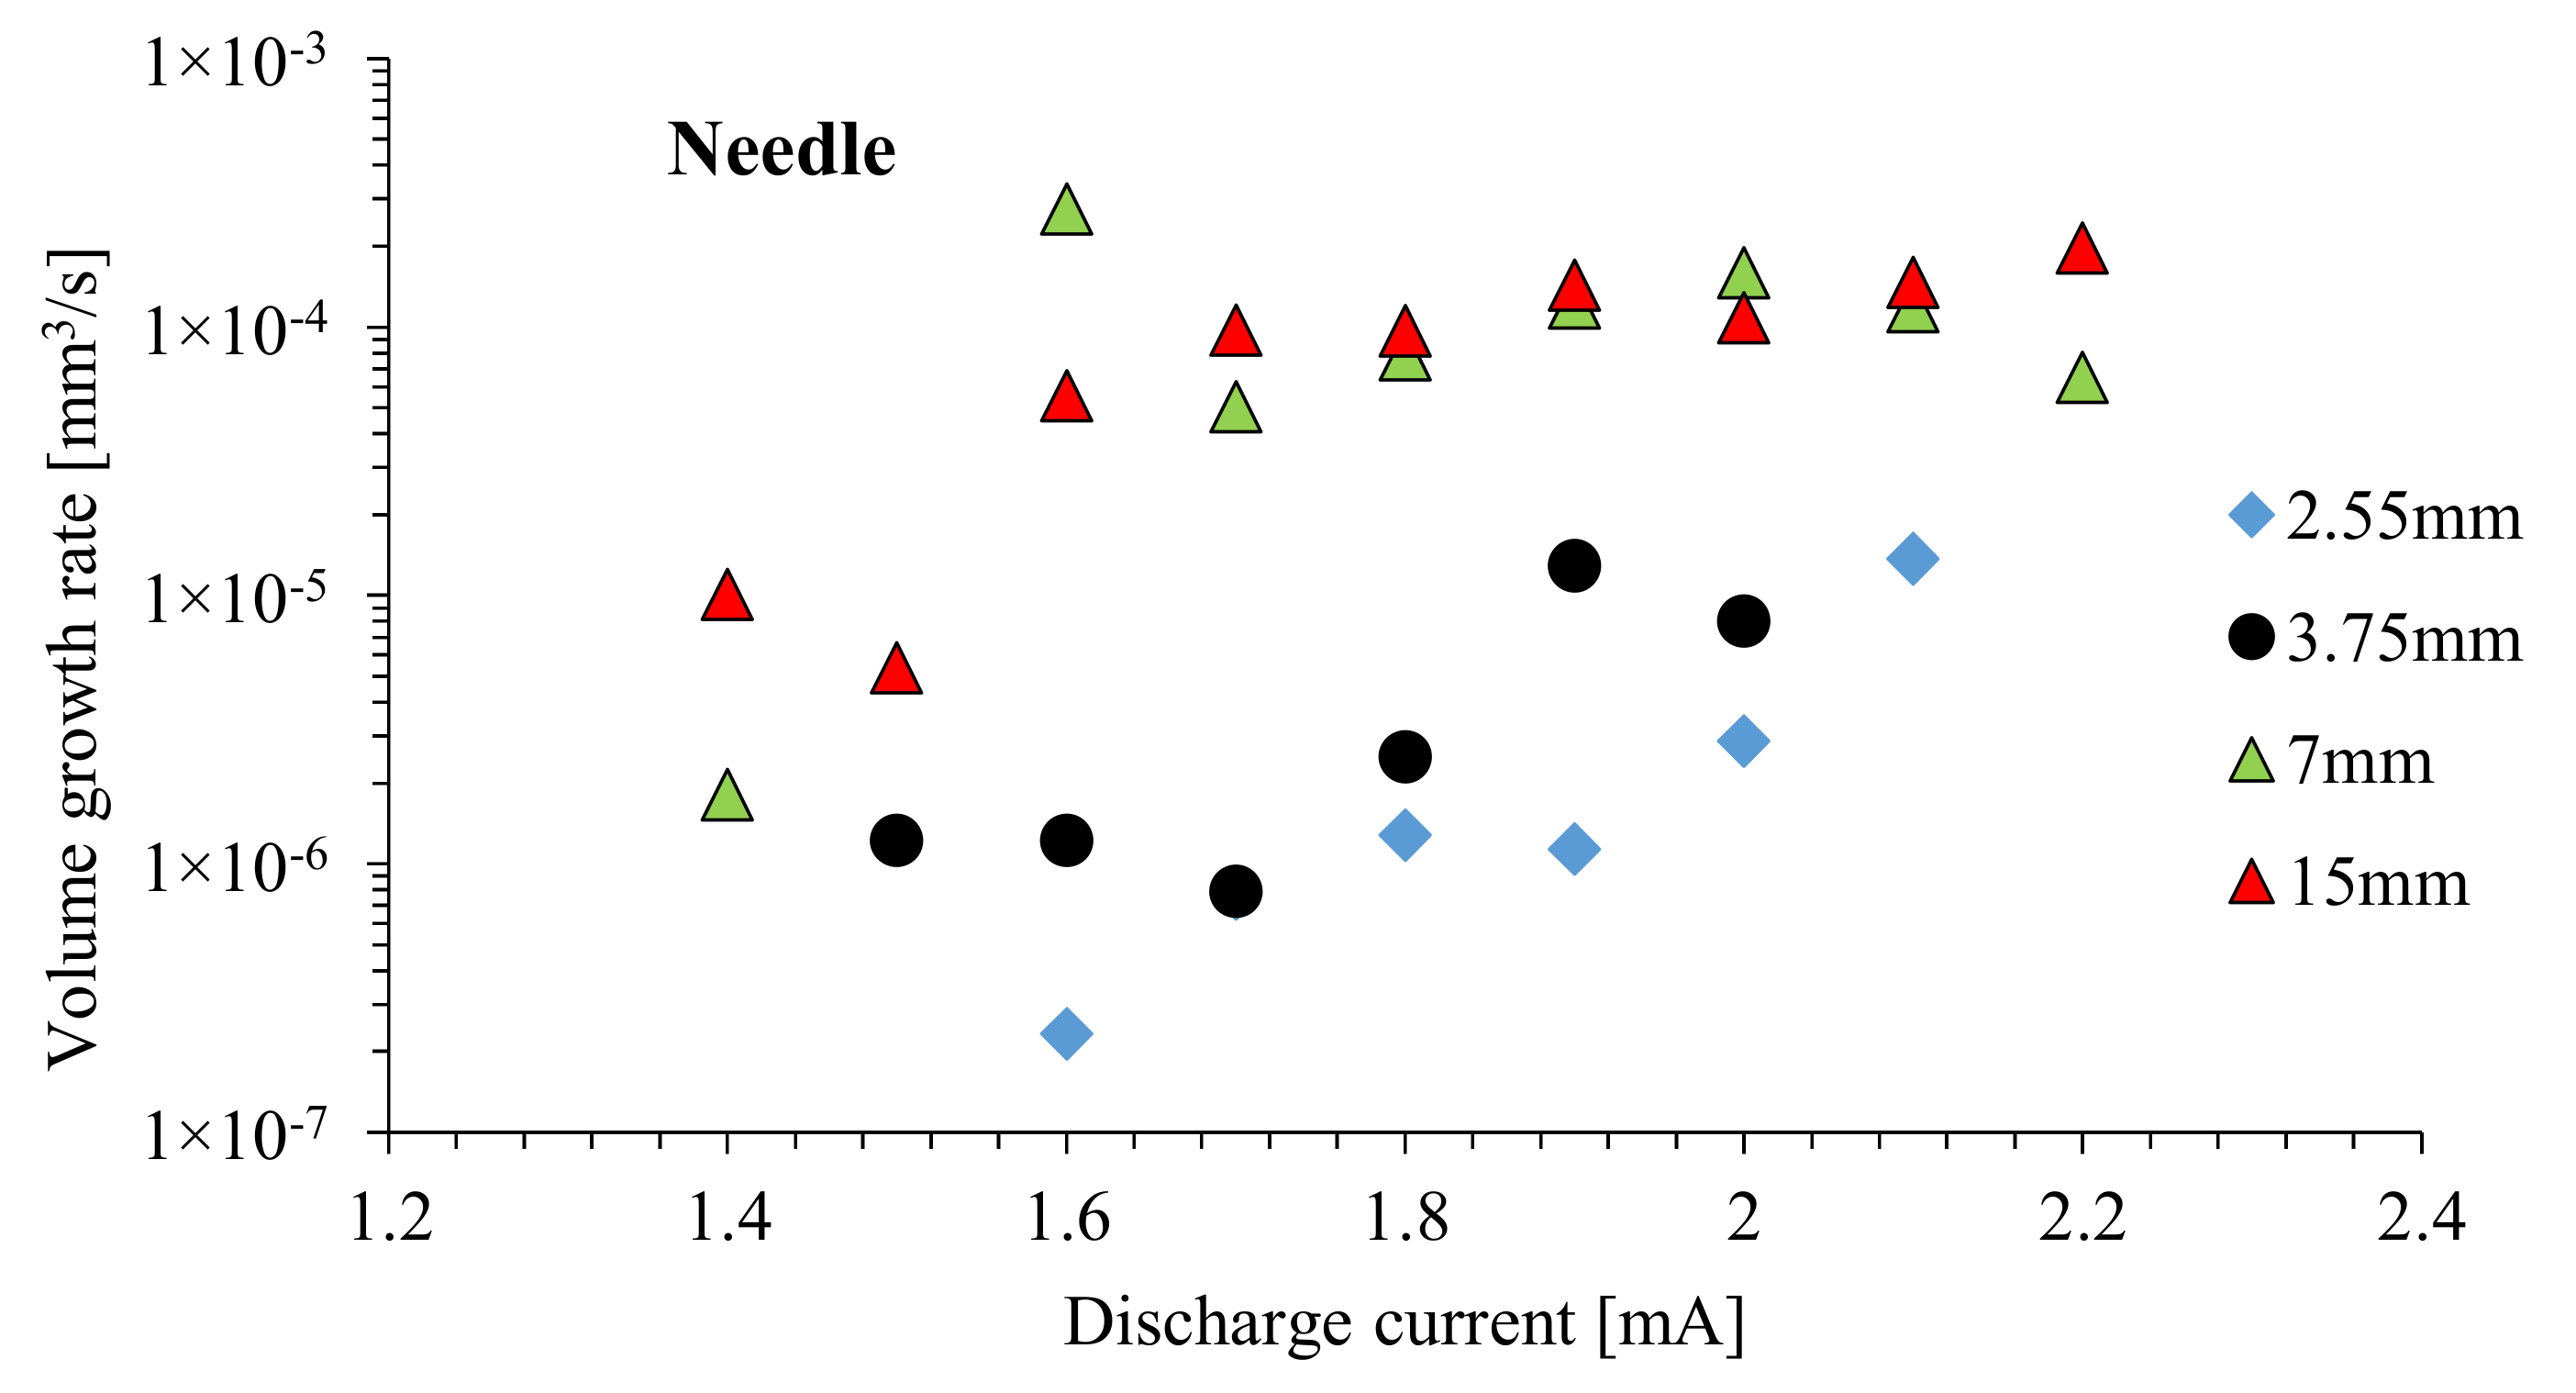
A comparison of the growth rate of the carbon deposit synthesized on the needle for different inter-electrode distances and various discharge currents is shown in Figure 21. The slowest growth rate was observed for the lowest inter-electrode distance. Generally, for an inter-electrode distance lower than 7 mm, the growth rate decreased, which could be an effect of the different radicals obtained during the decomposition of cyclohexane. The sticking probability of radicals such as CHx, C2Hx, CH and C differ in value [47], which could be dependent on the temperature of the surface/substrate [48].
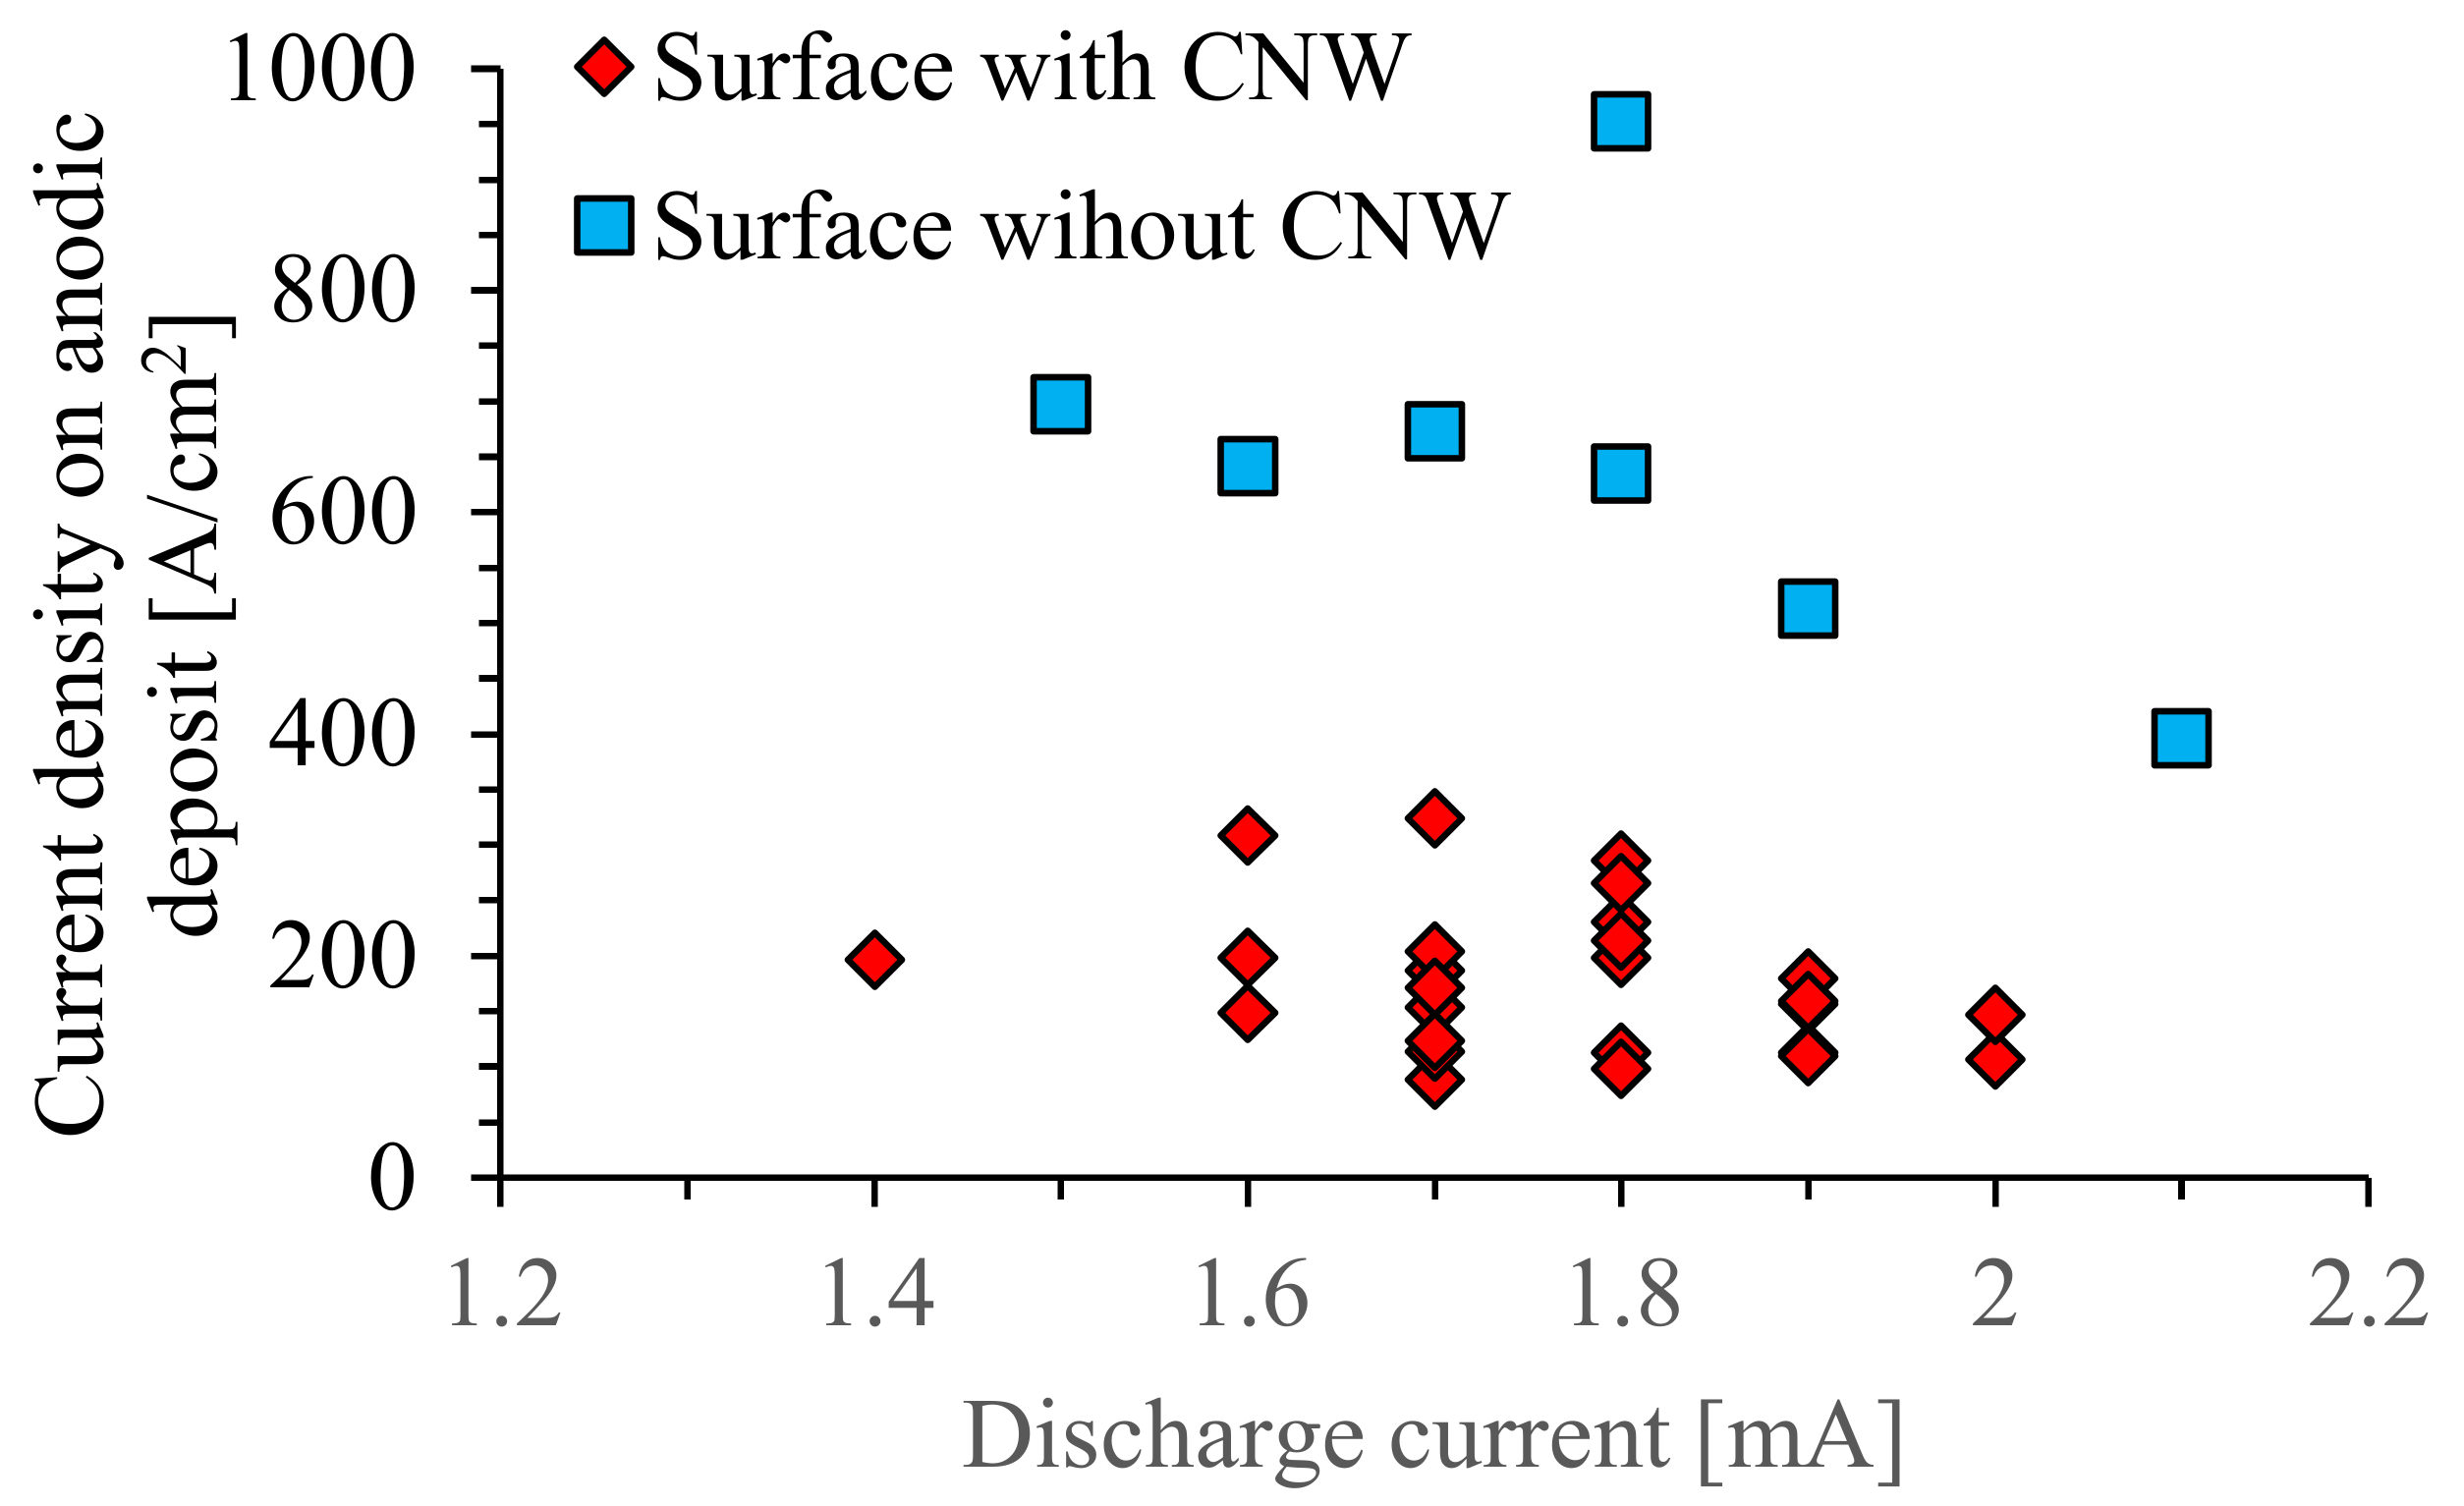
Figure 22 shows the current density flowing through the anode deposit determined from the discharge current divided by the average cross surface area of the carbon deposit at its tip. Increasing the current density results in the increasing temperature of the deposit surface due to Joule heating. The carbon deposits without carbon nanowalls had diameters in the range of 15–30 µm, whereas the diameters of the deposits covered with carbon nanowalls were in the range of 32–50 µm. The carbon deposits without carbon nanowalls and with carbon nanowalls were obtained for a current density higher than 395 A/cm2 and lower than 320 A/cm2, respectively.
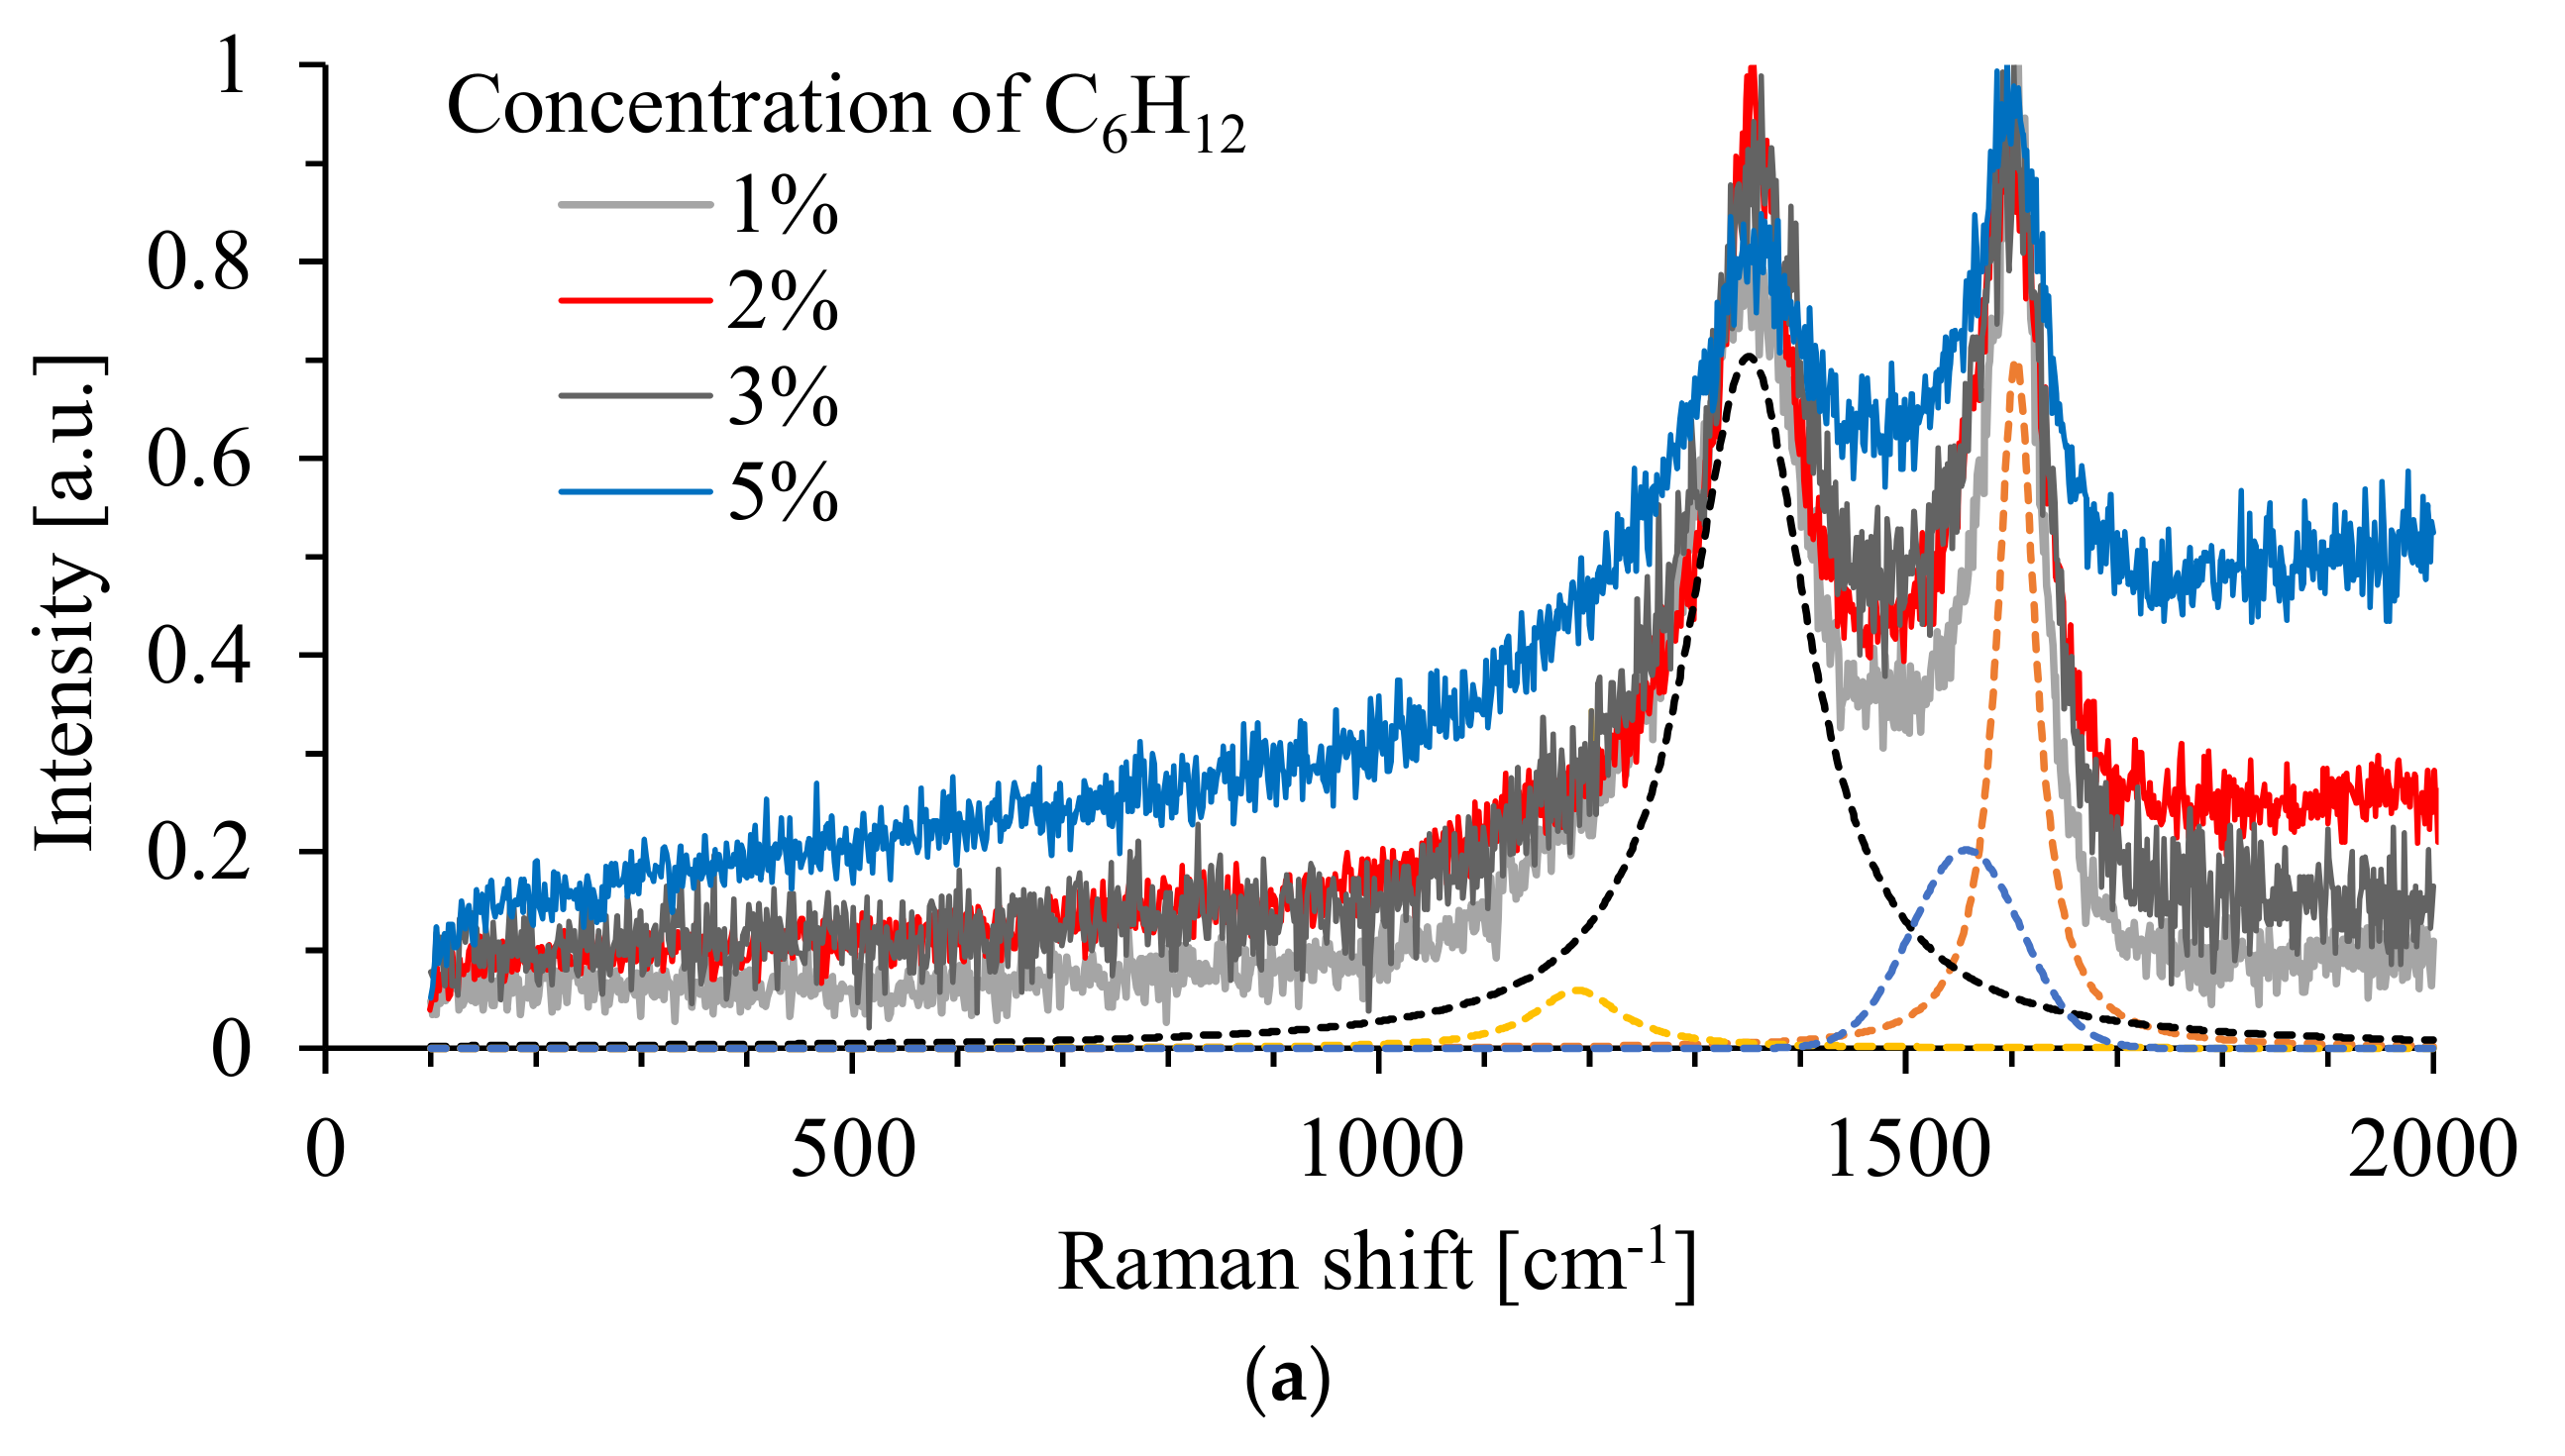
After deconvolution, the first-order Raman spectra of amorphous carbon material consist of two main peaks between 1200 and 1700 cm−1. Similar results were obtained for the synthesized carbon structures and are shown in Figure 23a. The peak located near 1600 cm−1 is called graphitic (G band) and is associated with an in-plane stretching of sp2-bonded carbon atoms. The peak around 1350 cm−1 is called a disorder-induced or D band. For single-crystal perfect graphite D band is not observed [49].
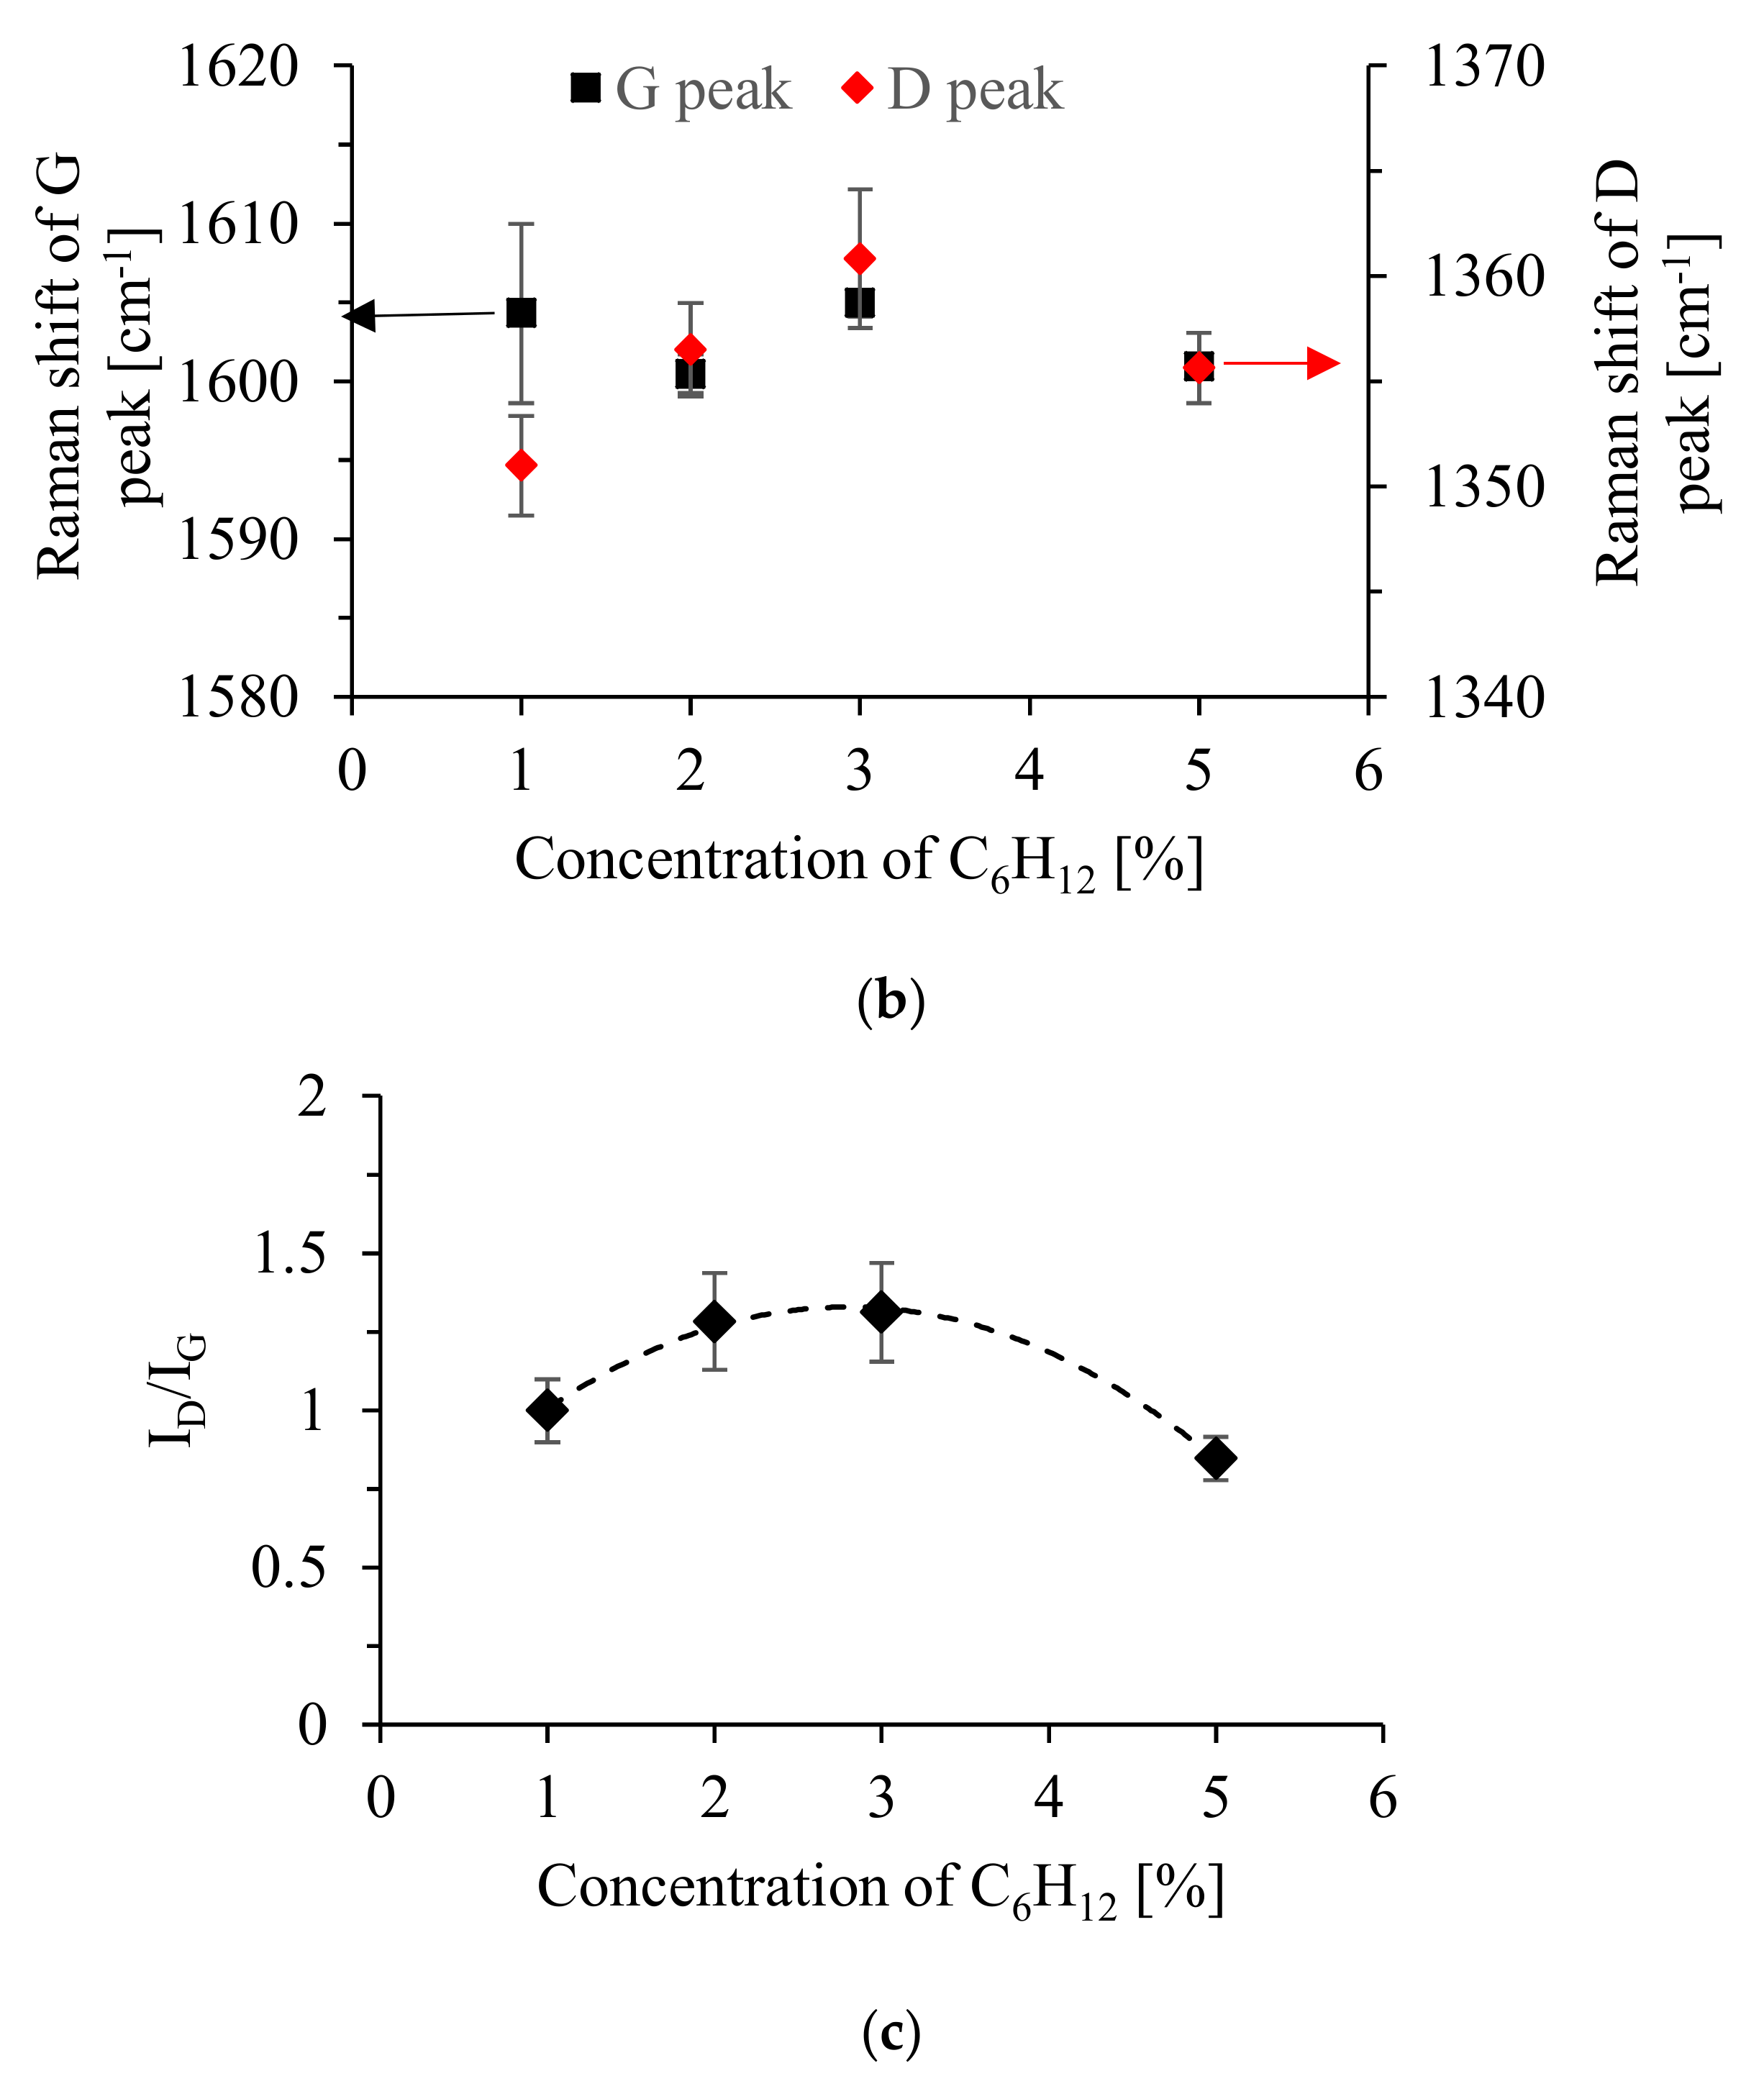
Additionally, the obtained carbon fibers had both peaks, G and D band. For 1% cyclohexane, the G band was at about 1605 cm−1 and did not change significantly with an increasing cyclohexane concentration from 1 to 5 wt.% (Figure 23b). The position of the D band changed in the range of 1350 to 1360 cm−1, with the maximum shift at 1360 cm−1 for 3% cyclohexane. In addition to the D and G bands, small peaks at 1200, 1510 and 1550 cm−1 were also obtained. The peak at 1200 cm−1 is attributed to the sp2-sp3 bonds or C-C and C=C stretching of vibrations of polyene-like structure [50] or vibrations of disordered graphite lattices (A1g symmetry) [51]. Both of the peaks, at 1200 and 1550 cm−1, were observed in the deposits obtained for both polarities, positive and negative, and can be attributed to amorphous sp3-bonded carbon and sp2 carbon-based structures, respectively [52]. The peak at 1510 cm−1 is associated with the amorphous carbon content of soot [52] or C=C double-bond stretching vibrations [53]. It was also observed that the width of the G peak increased with an increasing cyclohexane concentration in the mixture, which could suggest an increase in the density of this deposit [54].
The degree of disorder of the carbon structures could be obtained from the relative intensities of the D- and G-peaks. Wopenka et al. [55] related carbon structures to the ratio of ID to IG, as follows: well-ordered graphite: ID/IG < 0.5, disordered graphite: 0.5 <ID/IG<1.1, glassy carbon ID/IG > 1.1. This suggest that carbon deposits obtained for 2 and 3% cyclohexane have a glassy carbon structure (Figure 23c). For a 1 and 5% cyclohexane concentration, the structures grown on the needle are disordered graphite. For a negative polarity, for a cyclohexane concentration of 5% and a discharge current i = 1.8 mA, the ID/IG ratio was about 1.7 (not shown).
An observed increase in ID/IG could result from the enhancement of the clustering of an aromatic ring in the deposited structures [56]. Additionally, an increasing luminescence background with an increasing cyclohexane concentration could result from a high content of hydrogen [57,58,59]. The average hydrogen content, analyzed using a total combustion method, of the carbon fibers obtained for i = 1.8 mA and 5% cyclohexane for a positive polarity was about 1.46 wt.%; therefore, it could be supposed that for a carbon anodic deposit obtained for a lower cyclohexane concentration, the hydrogen content should be lower than for 5% cyclohexane.

3.4. Carbon Aerosol Produced in the Discharge

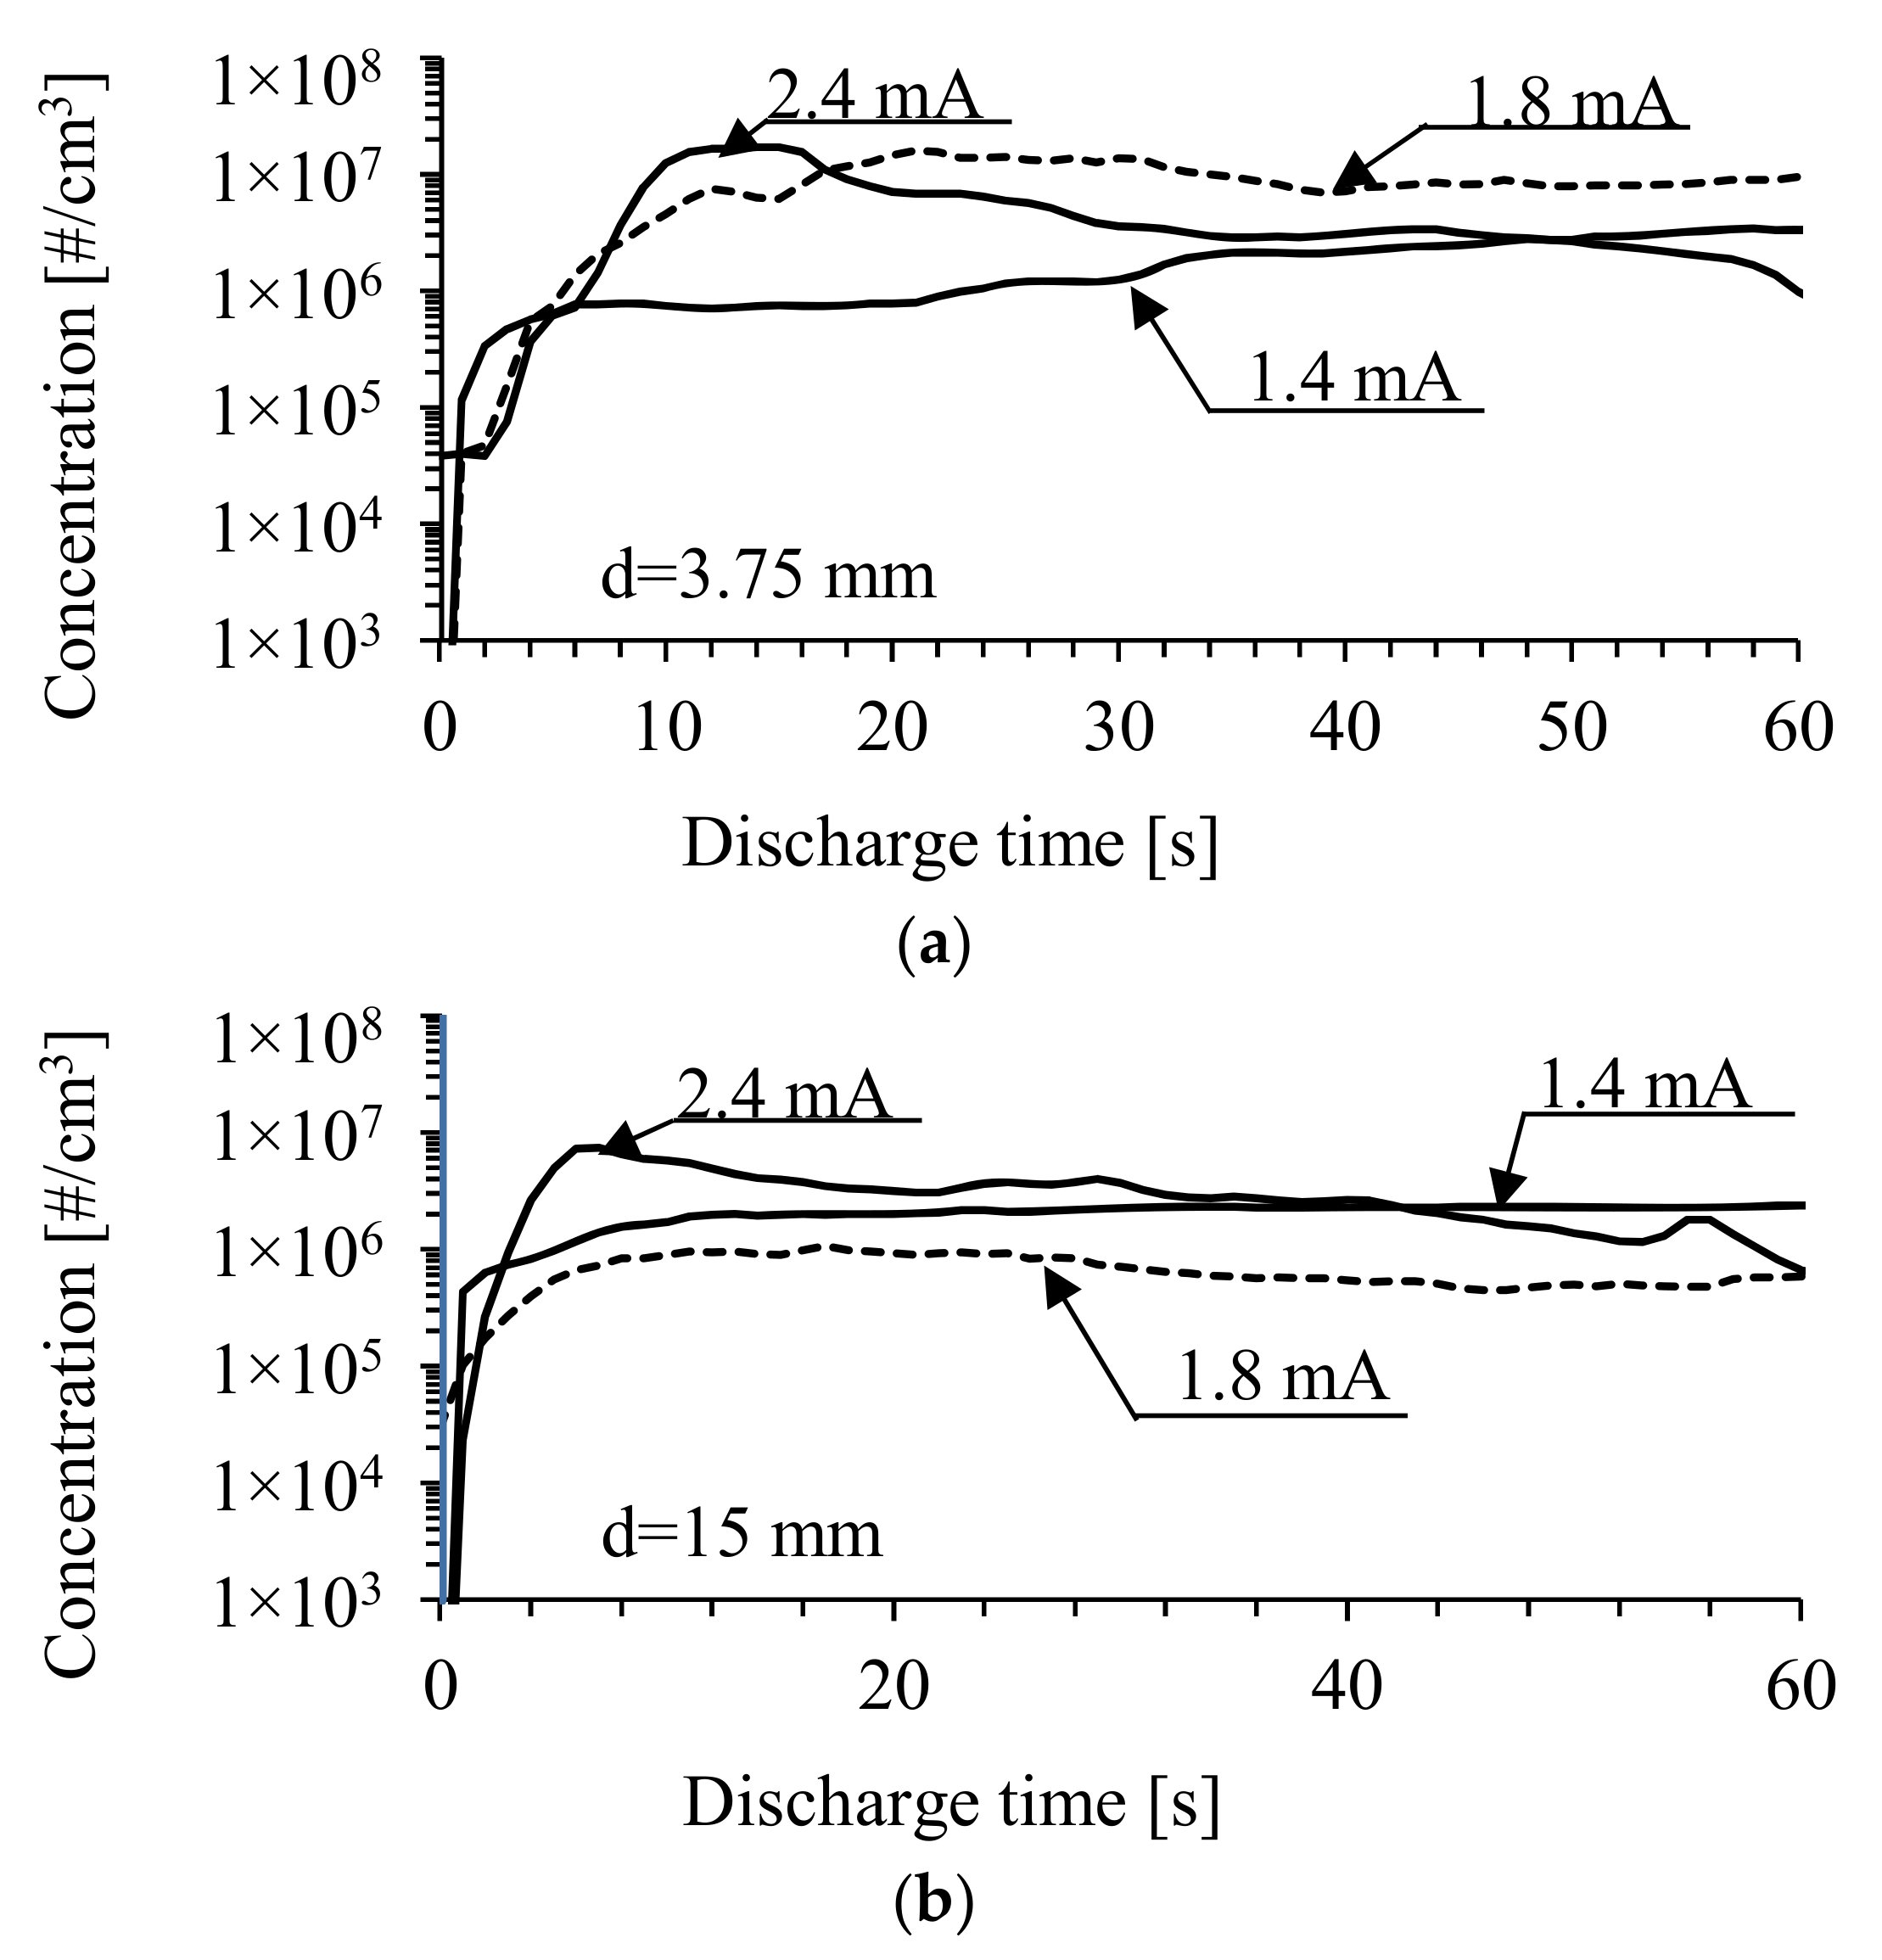
Besides the carbon deposit produced at the surface of electrodes during electrical discharge in a mixture of cyclohexane and argon, aerosol particles, which leave the reactor with the flowing gas, were also generated. The variations in the concentration of particles produced during the discharge for two inter-electrode distances are shown in Figure 24. The particle concentration for discharge currents of i = 1.4 and i = 2.4 mA was similar and was higher than that for the discharge current of i = 1.8 mA. The total particle number concentration for the inter-electrode distance of 3.75 mm was about one order of magnitude higher than for 15 mm.
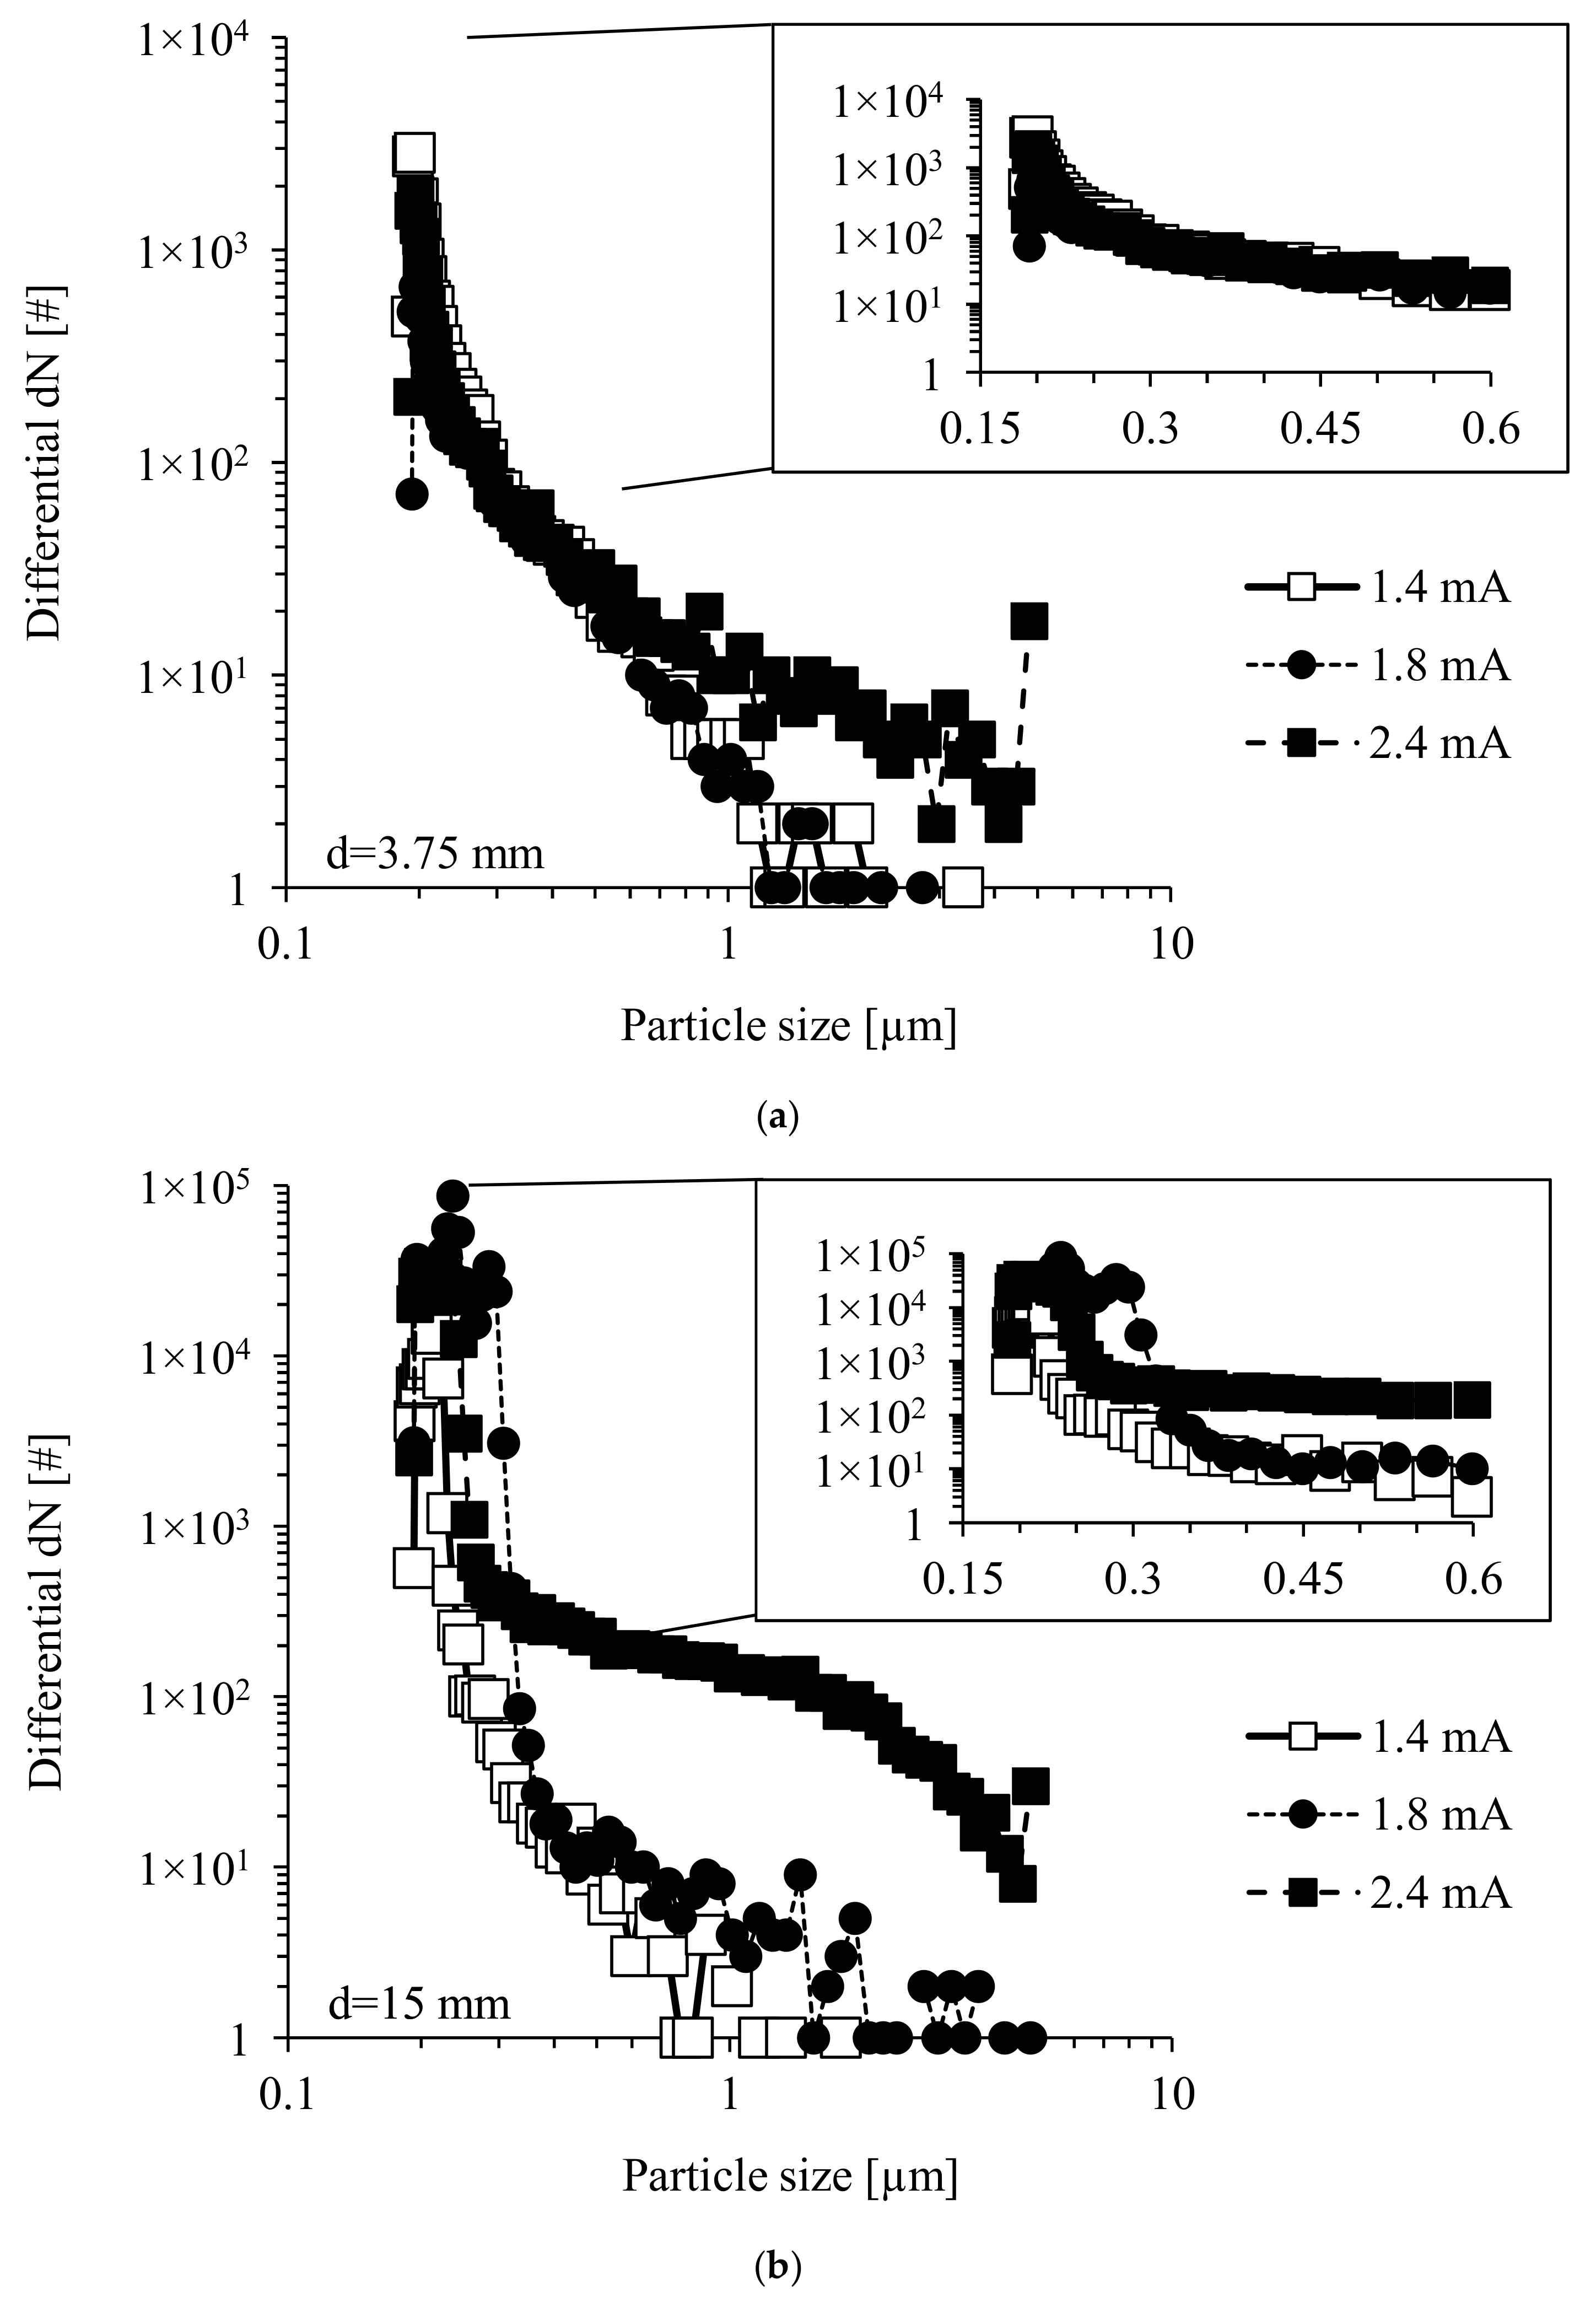
The particle size distribution measured during discharge in a mixture of argon and cyclohexane is shown in Figure 25. The particles generated for an inter-electrode distance of 3.75 mm are smaller than those generated for 15 mm. For a discharge current of i = 2.4 mA and an inter-electrode distance of 15 mm, the concentration of particles larger than 300 nm was 10 times higher than for same discharge current for lower inter-electrode distances, which could be the effect of a higher concentration of soot precursor radicals. Shigeta and Murphy [60] showed that nanoparticle growth takes place on the outer edge of the plasma column.
Soot can nucleate and grow through both ion-related and neutral radical mechanisms. Soot formation mostly occurs at the discharge boundary due to the relatively lower temperature than that in the plasma column. For example, for methane plasma, a sudden increase in the soot concentration occurs at temperatures above 1700 K [61]. In cyclohexane plasma, it could be the effect of increasing temperature and the acetylene produced in the discharge, which is known as a precursor of soot. The process of soot particle formation from acetylene, known as the “Winchester mechanism” [62], could be due to the following reactions with negative ions [63]:
C2H2 + e → C2H+ H,
C2nH2 + C2H →C2n + 2H + H2n, n = 1,2,3…,
or
C2H2 + e → H2CC,
H2CC + C2H2 → C2n+2 + H2 + H2n, n = 2,3,4….
The same reactions could occur for positive ions.
For both inter-electrode distances, the mechanism should be the same, but the plasma column had a higher diameter when the interelectrode distance was 15 mm than when it was 3.75 mm.

4. Conclusions

The experimental results of the synthesis of carbon microstructures in low temperature plasma generated by microdischarges were presented. The experiments were carried out in a plasma reactor, between needle and plate electrodes, a configuration typical for corona discharge. As an effect of the decomposition of cyclohexane in plasma, thin, 50–100 μm in diameter, carbon microfibers were built at the tip of the needle electrode. Carbon nanowalls, carbon powder, soot particles and other structures were deposited onto these fibers. These various carbon structures, produced from cyclohexane vapors in high voltage, low-current electrical discharges at atmospheric pressure, were synthesized for different discharge currents, different electrode polarities, inter-electrode distances and cyclohexane concentrations. For 1% cyclohexane, the growth rate of the carbon deposit was very low compared to a higher concentration of this hydrocarbon, for the same discharge polarity and inter-electrode distance. The growth rate obtained for 3 and 5% cyclohexane, for 1.8 mA was similar, about 0.5 mm/s, but SEM investigations showed that the morphology of these deposits was different; they were semi grained and smooth surfaced, respectively. For an inter-electrode distance equal to and smaller than 4.55 mm, and a discharge current in the range of 1.4 to 1.8 mA, the growth rate was lower than for 15 mm, and the surface of the carbon deposits was covered by carbon nanowalls.
The process of deposition can, however, be controlled by the discharge current, the residence time in the reactor (flow rate), the gas composition and the geometry of electrode. The optimal conditions can only be determined experimentally.
Due to its porous structures, the produced carbon micro- and nanostructures have potential applications, for example, in the synthesis of electrodes for ion batteries, supercapacitors, fuel cells, gas sensor or catalyst carriers.

Author Contributions

Conceptualization, A.T.S. and A.J.; methodology, A.T.S.; validation, A.T.S. and A.J.; investigation, A.T.S.; writing—original draft preparation, A.T.S.; writing—review and editing, A.J.; supervision, A.J. Both authors have read and agreed to the published version of the manuscript.

Funding

This research was funded internally by the Institute of Fluid Flow Machinery, Polish Academy of Sciences within the project No. O2/T3/Z4.

Institutional Review Board Statement

Not applicable.

Informed Consent Statement

Not applicable.

Data Availability Statement

No supporting data.

Acknowledgments

The authors wish to thank Anna Białous for her technical help and for carrying out the Raman measurements.

Conflicts of Interest

The authors declare no conflict of interest.

References

  1. Huczko, A. Synthesis of aligned carbon nanotubes. Appl. Phys. A 2002, 74, 617–638. [Google Scholar] [CrossRef]
  2. Tachibana, K. Current status of microplasma research. IEEJ Trans. Electr. Electron. Eng. 2006, 1, 145–155. [Google Scholar] [CrossRef]
  3. Martynov, Y.P.; Ivanov, V.A. Microdischarge of conducting particles and breakdown of a vacuum gap. Radio Eng. Electron. Phys. 1969, 14, 1732–1737. [Google Scholar]
  4. Hara, M.; Akazaki, M. Analysis of microdischarge threshold conditions between a conducting sphere and plate. J. Electrostat. 1982, 13, 105–118. [Google Scholar] [CrossRef]
  5. Gherardi, N.; Martin, S.; Massines, F. A new approach to SiO2 deposit using a N2 –SiH4 –N2O glow dielectric barri-er-controlled discharge at atmospheric pressure. J. Phys. D Appl. Phys. 2000, 33, L104–L108. [Google Scholar] [CrossRef]
  6. Shirai, H.; Kobayashi, T.; Hasegawa, Y. Synthesis of silicon nanocones using rf microplasma at atmospheric pressure. Appl. Phys. Lett. 2005, 87, 143112. [Google Scholar] [CrossRef]
  7. Kozak, D.; Shibata, E.; Iizuka, A.; Nakamura, T. Growth of carbon dendrites on cathode above liquid ethanol using surface plasma. Carbon 2014, 70, 87–94. [Google Scholar] [CrossRef]
  8. Kikuchi, T.; Hasegawa, Y.; Shirai, H. Rf microplasma jet at atmospheric pressure: Characterization and application to thin film processing. J. Phys. D Appl. Phys. 2004, 37, 1537–1543. [Google Scholar] [CrossRef]
  9. Brock, J.R.; Lim, P. Formation of carbon fibers in corona discharges. Appl. Phys. Lett. 1991, 58, 1259–1261. [Google Scholar] [CrossRef]
  10. Danilaev, M.P.; Bogoslov, E.A.; Morozov, O.G.; Nasybullin, A.; Pashin, D.M.; Pol′skii, Y.E. Obtaining Carbon Dendrites from the Products of Conversion of Polymer Materials. J. Eng. Phys. Thermophys. 2015, 88, 774–780. [Google Scholar] [CrossRef]
  11. Li, M.-W.; Hu, Z.; Wang, X.-Z.; Wu, Q.; Chen, Y.; Tian, Y.-L. Low-temperature synthesis of carbon nanotubes using corona discharge plasma at atmospheric pressure. Diam. Relat. Mater. 2004, 13, 111–115. [Google Scholar] [CrossRef]
  12. Sano, N.; Nobuzawa, M. Icicle-like carbon nanotubes forest at tungsten wire tip formed by high-voltage corona discharge. Carbon 2005, 43, 2224–2226. [Google Scholar] [CrossRef]
  13. Mesko, M.; Vretenar, V.; Kotrusz, P.; Hulman, M.; Soltys, J.; Skaklaowa, V. Carbon nanowalls synthesis by means of at-mospheric dcPECVD method. Phys. Status Solidi B 2012, 249, 2625–2628. [Google Scholar] [CrossRef]
  14. Sobczyk, A.; Rajch, E.; Sozańska, M.; Jaworek, A. Formation of Carbon Fibres in High-Voltage Low-Current Electrical Discharges. Solid State Phenom. 2008, 140, 103–108. [Google Scholar] [CrossRef]
  15. Sobczyk, A.T.; Jaworek, A. Carbon structures formation in low current high voltage electrical discharge in hydrocarbon vapours. J. Phys. Conf. Ser. 2011, 301, 012023. [Google Scholar] [CrossRef]
  16. Yang, Q.; Wu, J.; Li, S.; Zhang, L.; Fu, J.; Huang, F.; Cheng, Q. Vertically-oriented graphene nanowalls: Growth and application in Li-ion batteries. Diam. Relat. Mat. 2019, 91, 54–63. [Google Scholar] [CrossRef]
  17. Pierpaoli, M.; Jakobczyk, P.; Sawczak, M.; Łuczkiewicz, A.; Fudala-Książek, S.; Bogdanowicz, R. Carbon nanoarchitectures as high-performance electrodes for the electrochemical oxidation of landfill leachate. J. Hazard. Mater 2021, 401, 123407. [Google Scholar] [CrossRef]
  18. Lee, J.-S.; Joh, H.-I.; Kim, T.-W.; Lee, S. Carbon nanosheets derived from soluble pitch molecules and their applications in organic transistors. Org. Electron. 2014, 15, 132–138. [Google Scholar] [CrossRef]
  19. Lehmann, K.; Yurchenko, O.; Melke, J.; Fischer, A.; Urban, G. High electrocatalytic activity of metal-free and non-doped hierarchical carbon nanowalls towards oxygen reduction reaction. Electrochim. Acta 2018, 269, 657–667. [Google Scholar] [CrossRef]
  20. Bae, I.-S.; Cho, S.-H.; Park, Z.T.; Kim, J.-G.; Boo, J.H. Organic polymer thin films deposited on silicon and copper by plasma-enhanced chemical vapor deposition method and characterization of their electrochemical and optical properties. J. Vac. Sci. Technol. A 2005, 23, 875. [Google Scholar] [CrossRef]
  21. Antony, A.; Seo, H.J.; Boo, J. Plasma-polymerized cyclohexane coatings for ethanol and ammonia vapors sensing. Asia-Pacif. J. Chem. Eng. 2020, 15, 2452. [Google Scholar] [CrossRef]
  22. Son, H.H.; Park, J.N.; Lee, W.G. Hydrophobic properties of films grown by torch-type atmospheric pressure plasma in Ar ambient containing C6 hydrocarbon precursor. Korean J. Chem. Eng. 2013, 30, 1480–1484. [Google Scholar] [CrossRef]
  23. Huang, C.; Yu, Q.; Wu, S.-Y. Influence of the luminous gas phase on direct current plasma polymerized hydrocarbon film growth. Vaccum 2010, 84, 1402–1406. [Google Scholar] [CrossRef]
  24. Sigmond, R.S. Simple approximate treatment of unipolar space-charge-dominated coronas: The Warburg law and the saturation current. J. Appl. Phys. 1982, 53, 891–898. [Google Scholar] [CrossRef]
  25. Tachibana, K.; Koshiishi, T.; Furuki, T.; Ichiki, R.; Kanazawa, S.; Sato, T.; Mizeraczyk, J. A new measurement method of DC corona-discharge characteristics using repetitive ramp and triangular voltages. J. Electrost. 2020, 108, 103525. [Google Scholar] [CrossRef]
  26. Goldman, M.; Sigmond, R.S. The corona discharge, its properties and specific uses. Pure Appl. Chem. 1985, 57, 1353–1362. [Google Scholar] [CrossRef] [Green Version]
  27. Yanallah, K.; Pontiga, F. A semi-analytical stationary model of a point-to-plane corona discharge. Plasma Sources Sci. Technol. 2012, 21, 045007. [Google Scholar] [CrossRef]
  28. Takaki, K.; Kitamura, D.; Fujiwara, T. Characteristics of a high-current transient glow discharge in dry air. J. Phys. D Appl. Phys. 2000, 33, 1369–1375. [Google Scholar] [CrossRef]
  29. Titov, V.A.; Rybkin, V.V.; Maximov, A.I.; Choi, H.-S. Characteristics of Atmospheric Pressure Air Glow Discharge with Aqueous Electrolyte Cathode. Plasma Chem. Plasma Process. 2005, 25, 503–518. [Google Scholar] [CrossRef]
  30. Pai, D.Z.; Lacoste, D.A.; Laux, C. Transitions between corona, glow, and spark regimes of nanosecond repetitively pulsed discharges in air at atmospheric pressure. J. Appl. Phys. 2010, 107, 093303. [Google Scholar] [CrossRef]
  31. Hao, Y.; Zheng, B.; Liu, Y. Cathode fall measurement in a dielectric barrier discharge in helium. Phys. Plasmas 2013, 20, 113510. [Google Scholar] [CrossRef]
  32. Fuge, R.; Liebscher, M.; Schröfl, C.; Damm, C.; Eckert, V.; Eibl, M.; Leonhardt, A.; Büchner, B.; Mechtcherine, V. Influence of different hydrocarbons on the height of MWCNT carpets: Role of catalyst and hybridization state of the carbon precursor. Diam. Relat. Mat. 2018, 90, 18–25. [Google Scholar] [CrossRef]
  33. Jiao, C.Q.; Adams, S.F. Electron ionization of selected cyclohexanes. J. Phys. B At. Mol. Opt. Phys. 2011, 44, 175209. [Google Scholar] [CrossRef]
  34. Kramida, A.; Ralchenko, Y.; Reader, J. NIST ASD Team. NIST Atomic Spectra Database (Version 5.8); National Institute of Standards and Technology: Gaithersburg, MD, USA, 2019. Available online: https://physics.nist.gov/asd (accessed on 30 April 2021).
  35. Pearse, R.W.B.; Gaydon, A.G. The Identification of Molecular Spectra, 3rd ed.; Chapman and Hall: London, UK, 1976. [Google Scholar]
  36. Treshchalov, A.B.; Lissovski, A.A. VUV–VIS spectroscopic diagnostics of a pulsed high-pressure discharge in argon. J. Phys. D Appl. Phys. 2009, 42, 245203. [Google Scholar] [CrossRef]
  37. Fantz, U.; Meir, S.; ASDEX Upgrade Team. Correlation of the intensity ratio of C2/CH molecular bands with the flux ratio of C2Hy/CH4 particles. J. Nucl. Mater. 2005, 337–339, 1087–1091. [Google Scholar] [CrossRef]
  38. Catherine, Y.; Pastol, A.; Athouel, L.; Fourrier, C. Diagnostics of CH, plasmas carbon deposition used for diamond-like carbon deposition. IEEE Trans. Plasma Sci. 1990, 18, 923–929. [Google Scholar] [CrossRef]
  39. Gordillo-Vázquez, F.J.; Albella, J.M. Influence of the pressure and power on the non-equilibrium plasma chemistry of C2, C2H, C2H2, CH3 and CH4 affecting the synthesis of nanodiamond thin films from C2H2 (1%)/H2/Ar-rich plasmas. Plasma Sources Sci. Technol. 2004, 13, 50–57. [Google Scholar] [CrossRef] [Green Version]
  40. Zhu, X.M.; Pu, Y.K.; Balcon, N.; Boswell, R. Measurement of the electron density in atmospheric-pressure low-temperature argon discharges by line-ratio method of optical emission spectroscopy. J. Phys. D Appl. Phys. 2009, 42, 142003. [Google Scholar] [CrossRef] [Green Version]
  41. Bashir, M.; Rees, J.M.; Bashir, S.; Zimmerman, W.B. Characterization of atmospheric pressure microplasma produced from argon and a mixture of argon–ethylenediamine. Phys. Lett. A 2014, 378, 2395–2405. [Google Scholar] [CrossRef]
  42. Messier, R.; Giri, A.P.; Roy, R.A. Revised structure zone model for thin film physical structure. J. Vac. Sci. Technol. A 1984, 2, 500–503. [Google Scholar] [CrossRef]
  43. Ren, Y.; Xu, S.; Rider, A.E.; Ostrikov, K. (Ken) Made-to-order nanocarbons through deterministic plasma nanotechnology. Nanoscale 2010, 3, 731–740. [Google Scholar] [CrossRef] [PubMed] [Green Version]
  44. Michelmore, A.; Whittle, J.D.; Bradley, J.; Short, R.D. Where physics meets chemistry: Thin film deposition from reactive plasmas. Front. Chem. Sci. Eng. 2016, 10, 441–458. [Google Scholar] [CrossRef] [Green Version]
  45. Lia, S.G.; Levin, R.D.; Kafafi, S.A. Gas Phase Ion Energetics Data. NIST Chemistry WebBook, NIST Standard Reference Database Number 69; National Institute of Standards and Technology: Gaithersburg, MD, USA, 2018. Available online: https://webbook.nist.gov (accessed on 30 April 2021).
  46. McNaught, A.D.; Wilkinson, A.; IUPAC. Compendium of Chemical Terminology, 2nd ed.; Blackwell Scientific Publications: Oxford, UK, 1997. [Google Scholar]
  47. Castro, M.; Cuerno, R.; Nicoli, M.; Vázquez, L.; Buijnsters, J. Universality of cauliflower-like fronts: From nanoscale thin films to macroscopic plants. New J. Phys. 2012, 14, 103039. [Google Scholar] [CrossRef] [Green Version]
  48. Meier, M.; Von Keudell, A.; Jacob, W. Consequences of the temperature and flux dependent sticking coefficient of methyl radicals for nuclear fusion experiments. Nucl. Fusion 2002, 43, 25–29. [Google Scholar] [CrossRef]
  49. Reich, S.; Thomsen, C. Raman spectroscopy of graphite. Philos. Trans. R. Soc. 2004, 362, 2271–2288. [Google Scholar] [CrossRef]
  50. Ramya, K.; Jerin, J.; Manoy, B. Raman Spectroscopy Investigation of Camphor Soot: Spectral Analysis and Structural Information. Int. J. Electrochem. Sci. 2013, 8, 9421–9428. [Google Scholar]
  51. Ivleva, N.P.; McKeon, U.; Niessner, R.; Pöschl, U. Raman Microspectroscopic Analysis of Size-Resolved Atmospheric Aerosol Particle Samples Collected with an ELPI: Soot, Humic-Like Substances, and Inorganic Compounds. Aerosol Sci. Technol. 2007, 41, 655–671. [Google Scholar] [CrossRef] [Green Version]
  52. Wei, Q.; Ashfold, M.N.; Mankelevich, Y.; Yu, Z.; Liu, P.; Ma, L. Diamond growth on WC-Co substrates by hot filament chemical vapor deposition: Effect of filament–substrate separation. Diam. Relat. Mater. 2011, 20, 641–650. [Google Scholar] [CrossRef]
  53. Iwaki, M.; Watanabe, H.; Matsunaga, M.; Terashima, K. Synthesis of diamond-like carbon structure by Naion implantation in graphite and polyacetylene. Surf. Coat. Technol. 1998, 103–104, 370–374. [Google Scholar] [CrossRef]
  54. Chu, P.K.; Li, L. Characterization of amorphous and nanocrystalline carbon films. Mater. Chem. Phys. 2006, 96, 253–277. [Google Scholar] [CrossRef]
  55. Wopenka, B.; Xu, Y.; Zinner, E.; Amari, S. Murchison presolar carbon grains of different density fractions: A Raman spectroscopic perspective. Geochim. Cosmochim. Acta 2013, 106, 463–489. [Google Scholar] [CrossRef]
  56. Nakao, S.; Choi, J.; Kim, J.; Miyagawa, S.; Miyagawa, Y.; Ikeyama, M. Effects of positively and negatively pulsed voltages on the microstructure of DLC films prepared by bipolar-type plasma based ion implantation. Diam. Relat. Mater. 2006, 15, 884–887. [Google Scholar] [CrossRef]
  57. Yoshikawa, M.; Katagiri, G.; Ishida, H.; Ishitani, A.; Akamatsu, T. Raman spectra of diamondlike amorphous carbon films. J. Appl. Phys. 1988, 64, 6464–6468. [Google Scholar] [CrossRef]
  58. McConnell, M.L.; Dowling, D.P.; Pope, C.; Donnelly, K.; Ryder, A.G.; O’Connor, G.M. High pressure diamond and dia-mond-like carbon deposition using a microwave CAP reactor. Diam. Relat. Mat. 2002, 11, 1036–1040. [Google Scholar] [CrossRef]
  59. Ferrari, A.C.; Robertson, J.; Ferrari, A.C.; Robertson, J. Interpretation of Raman spectra of disordered and amorphous carbon. Phys. Rev. B 2000, 61, 14095–14107. [Google Scholar] [CrossRef] [Green Version]
  60. Shigeta, M.; Murphy, A. Thermal plasmas for nanofabrication. J. Phys. D Appl. Phys. 2011, 44, 174025. [Google Scholar] [CrossRef]
  61. Kouprine, A.; Gitzhofer, F.; Boulos, M.; Fridman, A. Polymer-Like C:H Thin Film Coating of Nanopowders in Capacitively Coupled RF Discharge. Plasma Chem. Plasma Process. 2004, 24, 189–215. [Google Scholar] [CrossRef]
  62. De Bleecker, K.; Bogaerts, A.; Goedheer, W. Detailed modeling of hydrocarbon nanoparticle nucleation in acetylene discharges. Phys. Rev. E. 2006, 73, 026405. [Google Scholar] [CrossRef] [Green Version]
  63. Van De Wetering, F.M.J.H.; Beckers, J.; Kroesen, G.M.W. Anion dynamics in the first 10 milliseconds of an argon–acetylene radio-frequency plasma. J. Phys. D Appl. Phys. 2012, 45, 485205. [Google Scholar] [CrossRef] [Green Version]
Figure 1. Experimental setup.
Applsci 11 05845 g001
Figure 2. Current–voltage characteristics of electric discharge in Ar+C6H12 (95:5) mixture at atmospheric pressure for positive polarity of needle electrode, for three inter-electrode distances (2.5, 3.7 and 15 mm).
Applsci 11 05845 g002
Figure 3. Photographs of various forms of corona discharge (a), onset streamers (b) corona glow (Hermstein glow), (c) pre-breakdown streamers and (d) atmospheric pressure glow discharge in a mixture of Ar+C6H12 (95:5) for different supply voltages, for positive needle polarity (see [24]).
Applsci 11 05845 g003
Figure 4. Photographs of plasma column of atmospheric pressure glow discharge during growth of carbon deposit in Ar+C6H12 (95:5) for a discharge current i = 1.78 mA: (a) inception of glow discharge, (b) after 8 s and (c) after 26 s.
Applsci 11 05845 g004
Figure 5. (a) Voltage drop between the electrodes for various inter-electrode distances, for discharge current i = 1.6 mA and (b) magnitude of electrical field for various discharge currents.
Applsci 11 05845 g005
Figure 6. Power density of electrical discharge in a mixture of argon and cyclohexane (95:5 by vol.) obtained for various inter-electrode distances.
Applsci 11 05845 g006
Figure 7. Power density of electrical discharge in a mixture of argon and cyclohexane vs. discharge current for different cyclohexane concentrations.
Applsci 11 05845 g007
Figure 8. Optical emission spectra taken from the tip of needle electrode and from plasma column at 2 mm from the needle tip, for various discharge currents and inter-electrode distances.
Applsci 11 05845 g008
Figure 9. Time variation of the emission intensity of (a) C2, ArI (at 696.5 nm) and Ar I (at 763.5 nm), and (b) CH, C2 and Balmer series of hydrogen for a discharge current of i = 1.8 mA for a 15-millimeter inter-electrode distance.
Applsci 11 05845 g009
Figure 10. Intensity ratio of two lines of ArI for various discharge currents.
Applsci 11 05845 g010
Figure 11. Linear Boltzmann plot for Ar I transition lines used to calculate excitation temperature (0.3197 eV).
Applsci 11 05845 g011
Figure 12. Excitation temperature of Ar I for various inter-electrode distances.
Applsci 11 05845 g012
Figure 13. Anodic deposit temperature for various inter-electrode distances.
Applsci 11 05845 g013
Figure 14. Temperature of needle deposit for positive polarity for 1 and 5% cyclohexane, and for negative polarity for 5% cyclohexane.
Applsci 11 05845 g014
Figure 15. Deposit formed during glow discharge for discharge current of 0.1 mA, in a mixture of Ar+C6H12 (95:5 vol.).
Applsci 11 05845 g015
Figure 16. SEM pictures of carbon fibers obtained during corona discharge for a constant discharge current (1.8 mA) but for different C6H12 concentrations: (a) 1%, (b) 2%, (c) 3%, (d) 4%, (e) 5% by positive polarity of the needle electrode. Electrode distance: 15 mm.
Applsci 11 05845 g016
Figure 17. Growth rate of carbon deposit synthesized on the needle tip during electrical discharges versus discharge current, for three different cyclohexane concentrations: 1, 3 and 5%.
Applsci 11 05845 g017
Figure 18. SEM pictures of cathodic carbon deposit obtained during discharge in a mixture of argon Ar+C6H12 (95:5) for negative polarity of the discharge electrode, with a discharge current of 1.8 mA.
Applsci 11 05845 g018
Figure 19. Fragments of carbon deposit obtained at the anode for cyclohexane concentrations of (a) 1%, (b) 5% for positive polarity and (c) 5% for negative polarity, with a discharge current of 1.8 mA.
Applsci 11 05845 g019
Figure 20. SEM pictures of carbon deposits obtained for different discharge currents: (a) 1.4 mA, (b) 1.6 mA, (c) 1.8 mA and (d) 2.0 mA with an inter-electrode distance of 3.75 mm and a 5% cyclohexane concentration. Left column: general view of carbon fiber, right column: close-up view of fiber’s surface.
Applsci 11 05845 g020
Figure 21. Growth rate of carbon deposit synthesized on the tip of needle electrode during electrical discharges of positive polarity versus discharge current, for a 5% cyclohexane concentration.
Applsci 11 05845 g021
Figure 22. Current density on the anodic deposit for deposit with and without carbon nanowalls obtained for various discharge currents.
Applsci 11 05845 g022
Figure 23. Raman spectra analysis of obtained carbon deposits: (a) Raman spectrum, (b) Raman shift of G and D bands, (c) the ratio intensity of D band and G band vs. cyclohexane concentration, with a discharge current of 1.8 mA.
Applsci 11 05845 g023aApplsci 11 05845 g023b
Figure 24. Concentration of particles produced during discharge in a mixture of argon and cyclohexane for two inter-electrode distances of (a) 3.75 mm and (b) 15 mm for different discharge currents.
Applsci 11 05845 g024
Figure 25. Particle size distribution produced during the discharge in a mixture of argon and cyclohexane, for inter-electrode distances of (a) 3.75 mm and (b) 15 mm for different discharge currents.
Applsci 11 05845 g025
Table 1. Optical emission lines of argon used for the determination of excitation temperatures during the discharge in Ar/C6H12 mixture [34].
Transition (Upper Level Energy—Lower Level Energy [eV])Position [nm]
3s23p5(21/2)4p →3s23p5(23/2)4s (13.328–11.548)696.5
3s23p5(21/2)4p →3s23p5(23/2)4s (13.328–11.624)727.3
3s23p5(21/2)4p →3s23p5(23/2)4s (13.302–11.624)738.4
3s23p5(23/2)4p →3s23p5(23/2)4s (13.171–11.548)763.5
3s23p5(21/2)4p →3s23p5(21/2)4s (13.283–11.723)794.8
3s23p5(21/2)4p →3s23p5(21/2)4s (13.328–11.828)826.5
3s23p5(21/2)4p →3s23p5(23/2)4s (13.153–11.723)866.8
3s23p5(23/2)4p →3s23p5(23/2)4s (12.907–11.548)912.3
3s23p5(23/2)4p →3s23p5(21/2)4s (13.172–11.828)922.5
3s23p5(23/2)4p →3s23p5(23/2)4s (12.907–11.624)965.8
Table 2. Main features of the emission spectra observed during cyclohexane decomposition in Ar/C6H12 mixtures [35].
SpeciesSystemTransitionWavelength [nm]
C2Swan systemA3Π→X3Π, ground state438–619
CH4300 ÅA2Δ→X2Π, ground state430
HBalmer series3→2656.3
Publisher’s Note: MDPI stays neutral with regard to jurisdictional claims in published maps and institutional affiliations.