Article

Multi-Objective Reliability-Based Optimization of Control Arm Using MCS and NSGA-II Coupled with Entropy Weighted GRA

1
College of Mechanical and Electrical Engineering, Qingdao University, Qingdao 266071, China
2
College of Computer Science & Technology, Qingdao University, Qingdao 266071, China
3
State Key Laboratory of Automotive Simulation and Control, Jilin University, Changchun 130022, China
*
Author to whom correspondence should be addressed.
Appl. Sci. 2021, 11(13), 5825; https://doi.org/10.3390/app11135825
Submission received: 3 June 2021 / Revised: 21 June 2021 / Accepted: 22 June 2021 / Published: 23 June 2021
(This article belongs to the Section Mechanical Engineering)

Abstract

:
Lightweight design is one of the important ways to reduce automobile fuel consumption and exhaust emissions. At the same time, the fatigue life of automobile parts also greatly affects vehicle safety. This paper proposes a multi-objective reliability optimization method by integrating Monte Carlo simulation (MCS) with the NSGA-II algorithm coupled with entropy weighted grey relational analysis (GRA) for lightweight design of the lower control arm of automobile Macpherson suspension. The dynamic load histories of the control arm were extracted through dynamic simulations of a rigid-flexible coupling vehicle model on virtual proving ground. Then, the nominal stress method was used to predict its fatigue life. Six design variables were defined to describe the geometric dimension of the control arm, while mass and fatigue life were taken as optimization objectives. The multi-objective optimization design of the control arm was carried out based on the Kriging surrogate model and NSGA-II algorithm. Aiming at the uncertainty of design variables, the reliability constraint was added to the multi-objective optimization to improve the reliability of the fatigue life of the control arm. The optimal design of the control arm was determined from Pareto solutions by entropy weighted grey relational analysis (GRA). The optimization results show that the mass of the control arm was reduced by 4.1% and the fatigue life was increased by 215.8% while its reliability increased by 7.8%. The proposed multi-objective reliability optimization method proved to be feasible and effective for lightweight design of a suspension control arm.

1. Introduction

With the continuous growth of car ownership, automobile exhausts emit a large number of pollutants. Additionally, the fuel consumption problem is becoming increasingly serious. In order to reduce the environmental and energy problems caused by the development of the automobile industry, making an automobile lightweight has become one of the effective measures [1,2,3]. A suspension control arm has to bear and transfer various loads caused by road roughness and engine vibrations. Thus, its thickness is always set to be thicker to ensure vehicle safety, which leads to the weight of the suspension system also being greatly increased. Therefore, it is of great significance to carry out a lightweight design of the control arm on the premise of ensuring its stiffness, strength, and fatigue life [4,5,6].
Scholars have paid much attention to automobile lightweight solutions, including optimization design, the application of lightweight material, and advanced manufacturing processes. Mohd et al. [7] optimized the topology of an aluminum control arm and proposed the optimal material layout method based on load and boundary conditions, which achieved a mass reduction of 41% under the condition of satisfying the strength. Yoo et al. [8] replaced the aluminum used for the control arm with carbon fiber-reinforced polymer and carried out topology optimization. At the same time, under the conditions of multiple constraints including stiffness and durability, the weight was reduced by 30%. Zhang [9] changed the material of automobile B-pillar from metal to carbon fiber-reinforced polymer, which not only reduced the mass by 50.76%, but also greatly improved the crashworthiness. Guler et al. [10] developed automobile hinge components with PA66 GF60 glass fiber-reinforced polyamide composite instead of ordinary steel. Topology optimization was carried out under a specific load to obtain the optimal size and minimum mass. Chen et al. [11] designed a new single stamping control arm and achieved a mass reduction of 33.3% compared to the original one through topology optimization and size optimization.
For engineering optimization problems, there are usually two or more objectives that need to be achieved. Generally, these objectives are in conflict with each other. Traditional single objective optimization often focuses on one key optimization performance while ignoring the correlation with the other performance. Multi-objective optimization methods are proposed to select the Pareto solutions in many engineering fields. Wang et al. [12] designed a new bumper system composed of negative Poisson’s ratio (NPR) beam and NPR absorber, and used a multi-objective optimization algorithm to search for the optimal structural parameters. The results show that the performance of pedestrian protection and vehicle crashworthiness was improved. Fossati et al. [13] used the multi-objective optimization method to optimize the passive suspension system of a whole vehicle model running on a random road, which achieved a reduction of 21.14% for the weighted mean square root of vertical angular velocity of the driver seat. Based on the Kriging surrogate model, Tang et al. [14] used a multi-objective genetic algorithm to optimize the thickness of acoustic package material. Under the condition of ensuring that the acoustic performance of automobile acoustic package remained unchanged, the mass was reduced by 20.76%. Nikkhah et al. [15] optimized the thin-walled tube with the aim of maximizing specific energy absorption (SEA) and minimizing peak crushing force (PCF). Response surface methodology (RSM) was established to find the optimal configuration of the tube for improving the energy absorption characteristics of the thin-walled tube.
Reliability is the probability that a product will not fail. The failure probability of the product is closely related with the uncertainty of design parameters [16,17]. The traditional optimization design is usually performed without considering the uncertainty of input variables, which may lead to failure of the optimization results in practical application. Therefore, reliability optimization has attracted much attention recently. Lim et al. [18] proposed a reliability-based multi-objective optimization design method to optimize the engine mount. They obtained a more reliable optimization solution than the deterministic optimization based on the NSGA algorithm. Zhang et al. [19] presented a new method for hybrid reliability-based design optimization under random and interval uncertainties, and used a ten-bar truss example and a design of piezoelectric energy harvester to verify the accuracy and effectiveness of the method. Combined with the response surface method and a multi-island genetic algorithm, Li et al. [20] applied an efficient reliability-based design optimization process to optimize the reliability of lattice boom. The results showed that it not only met the reliability requirements, but also ensured safety and economy.
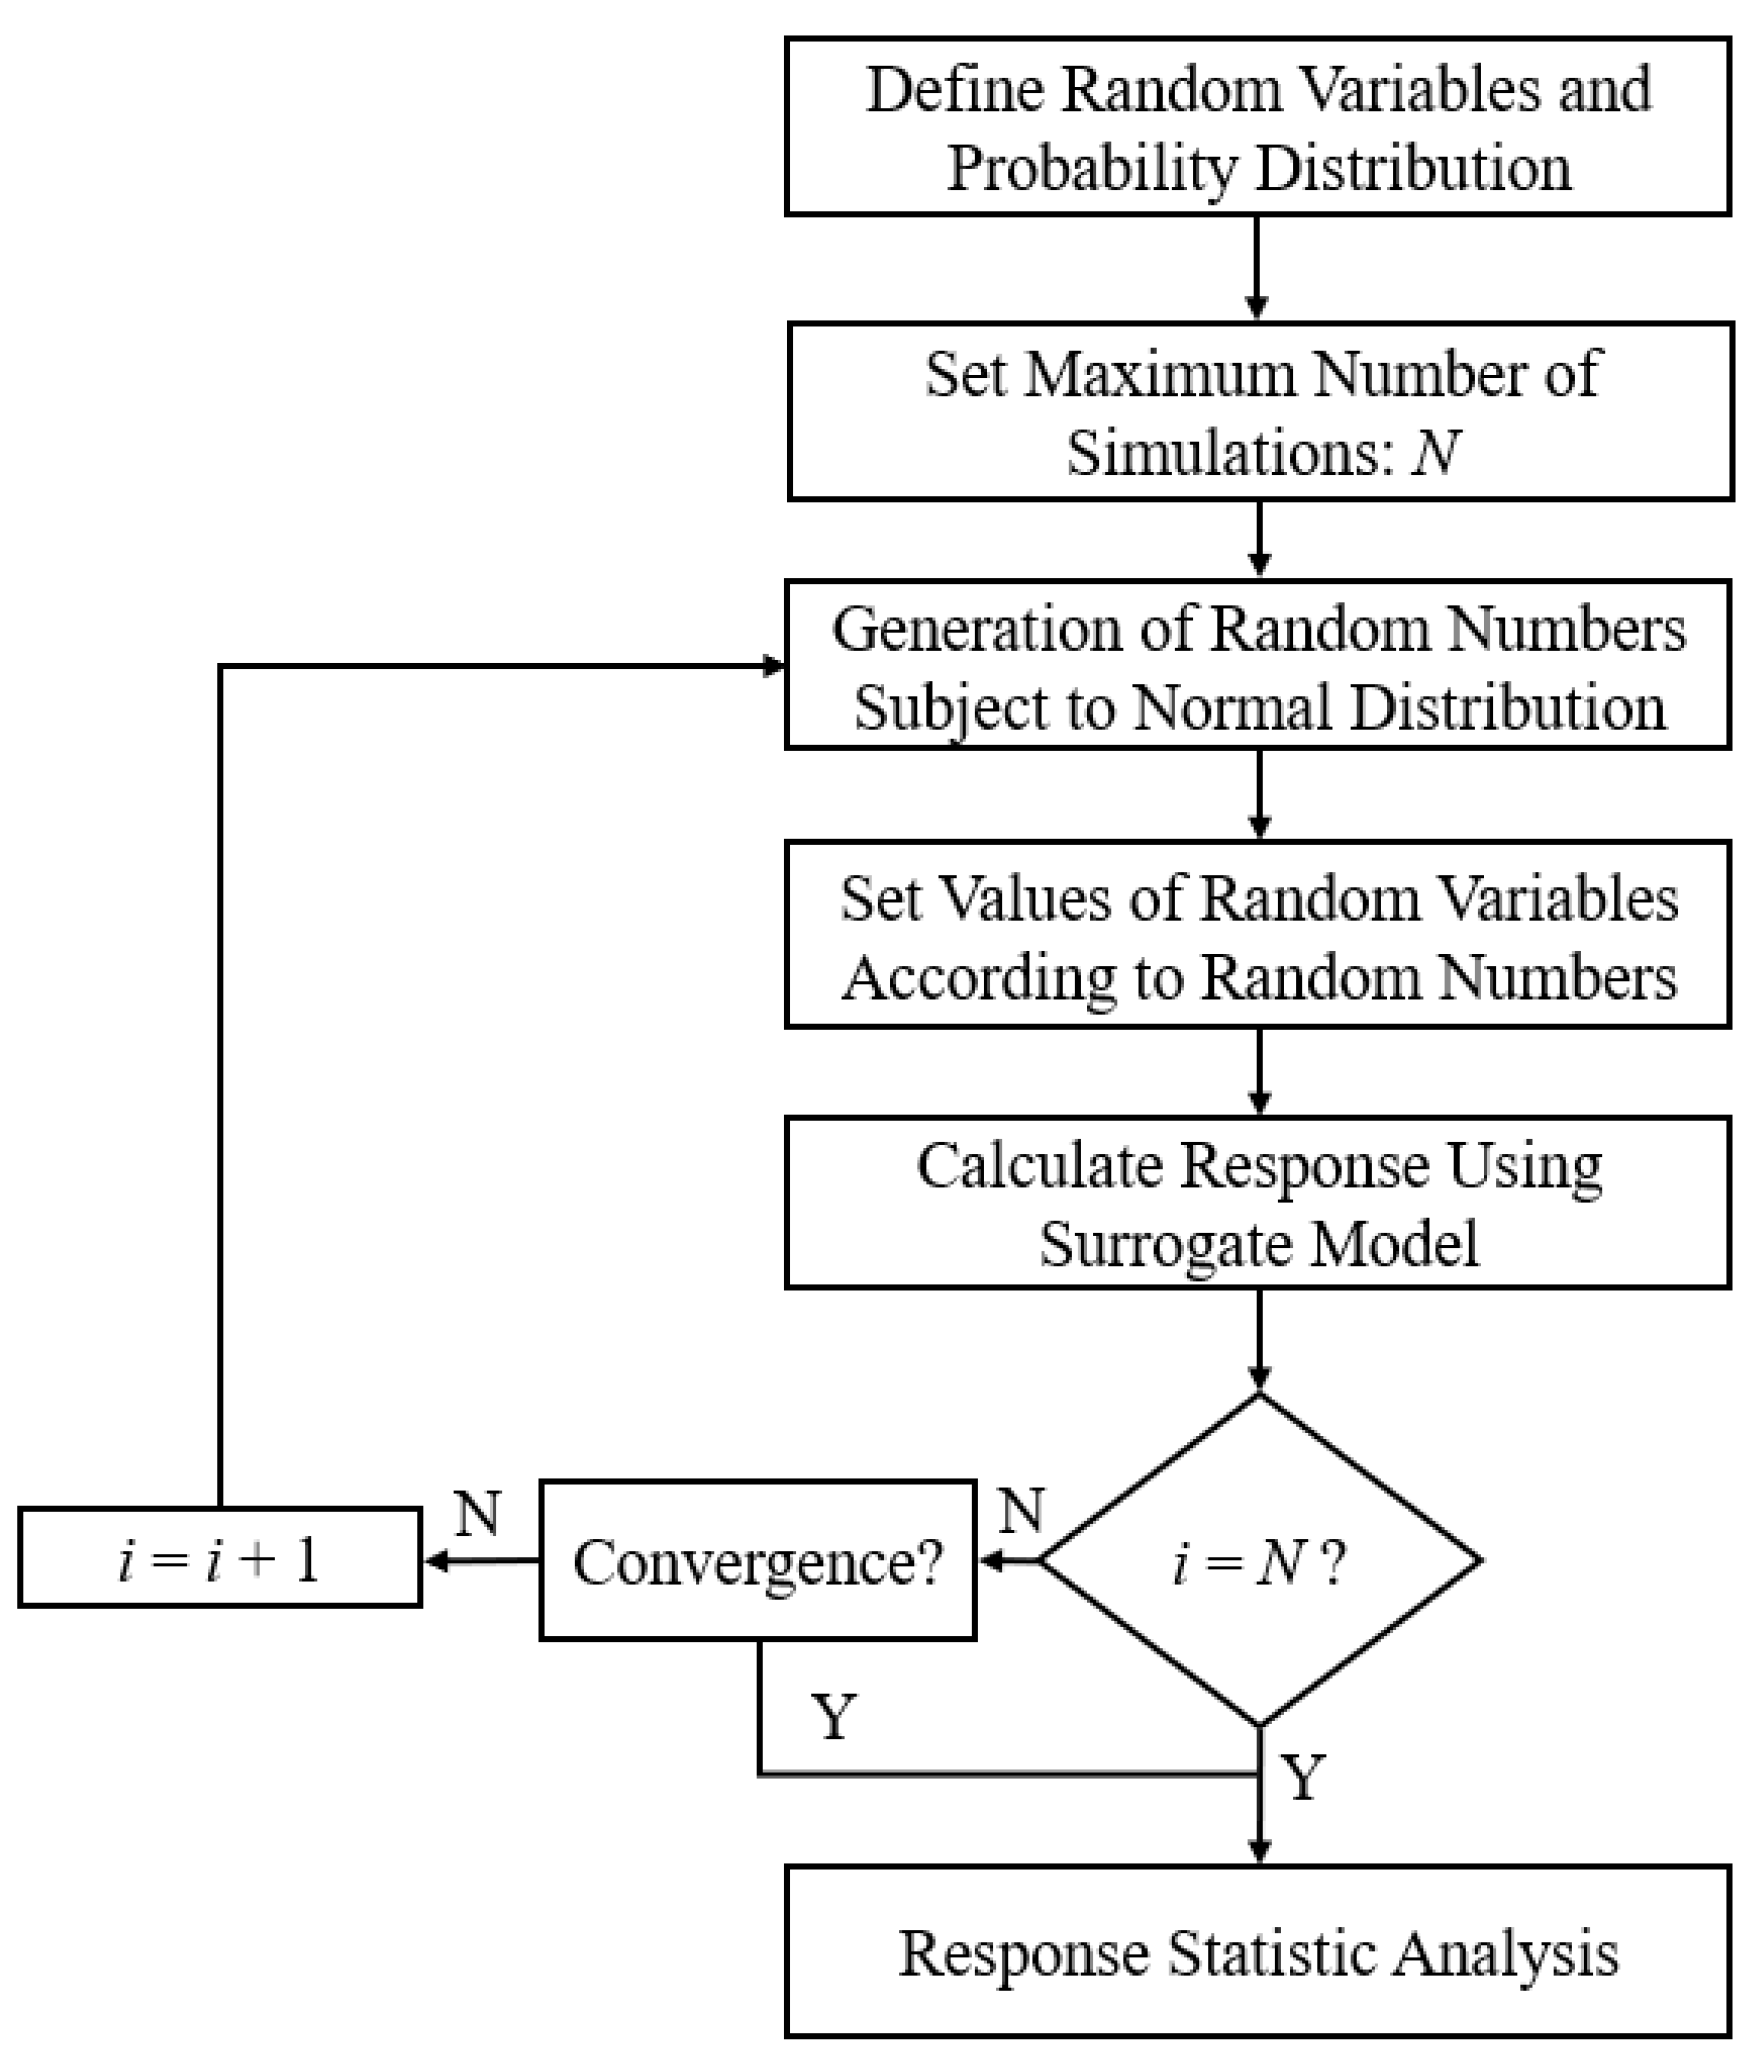
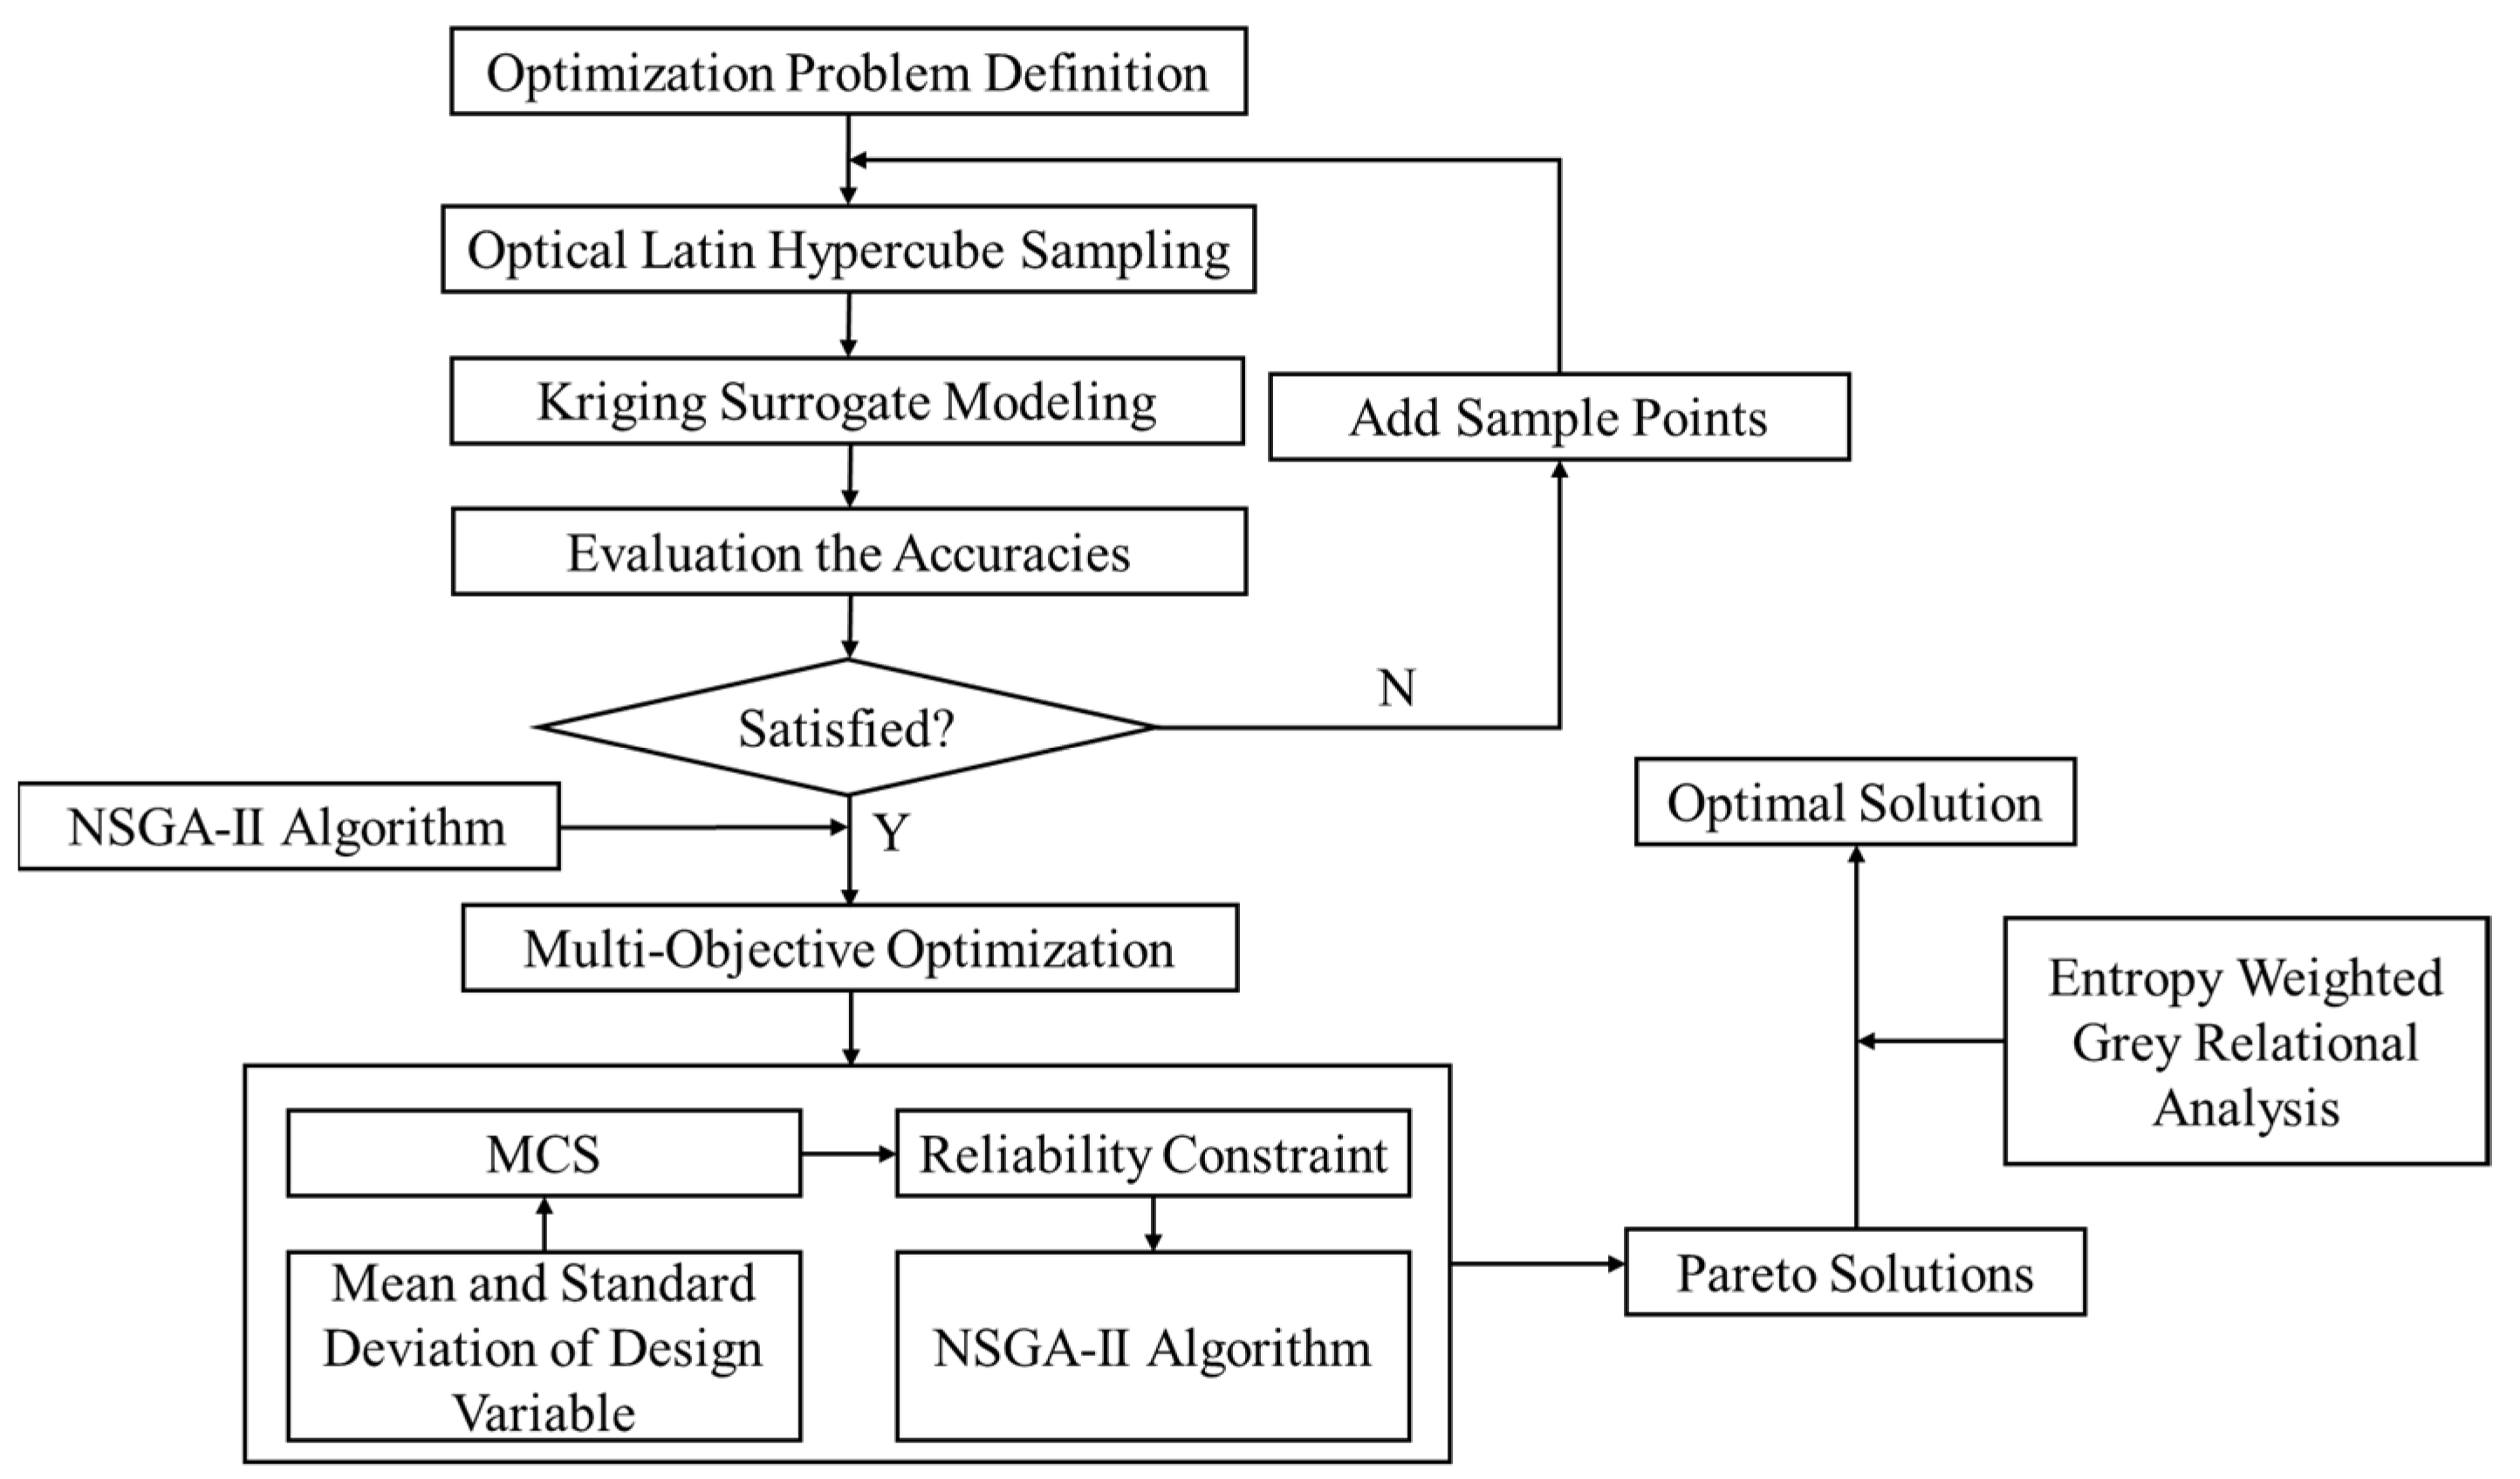
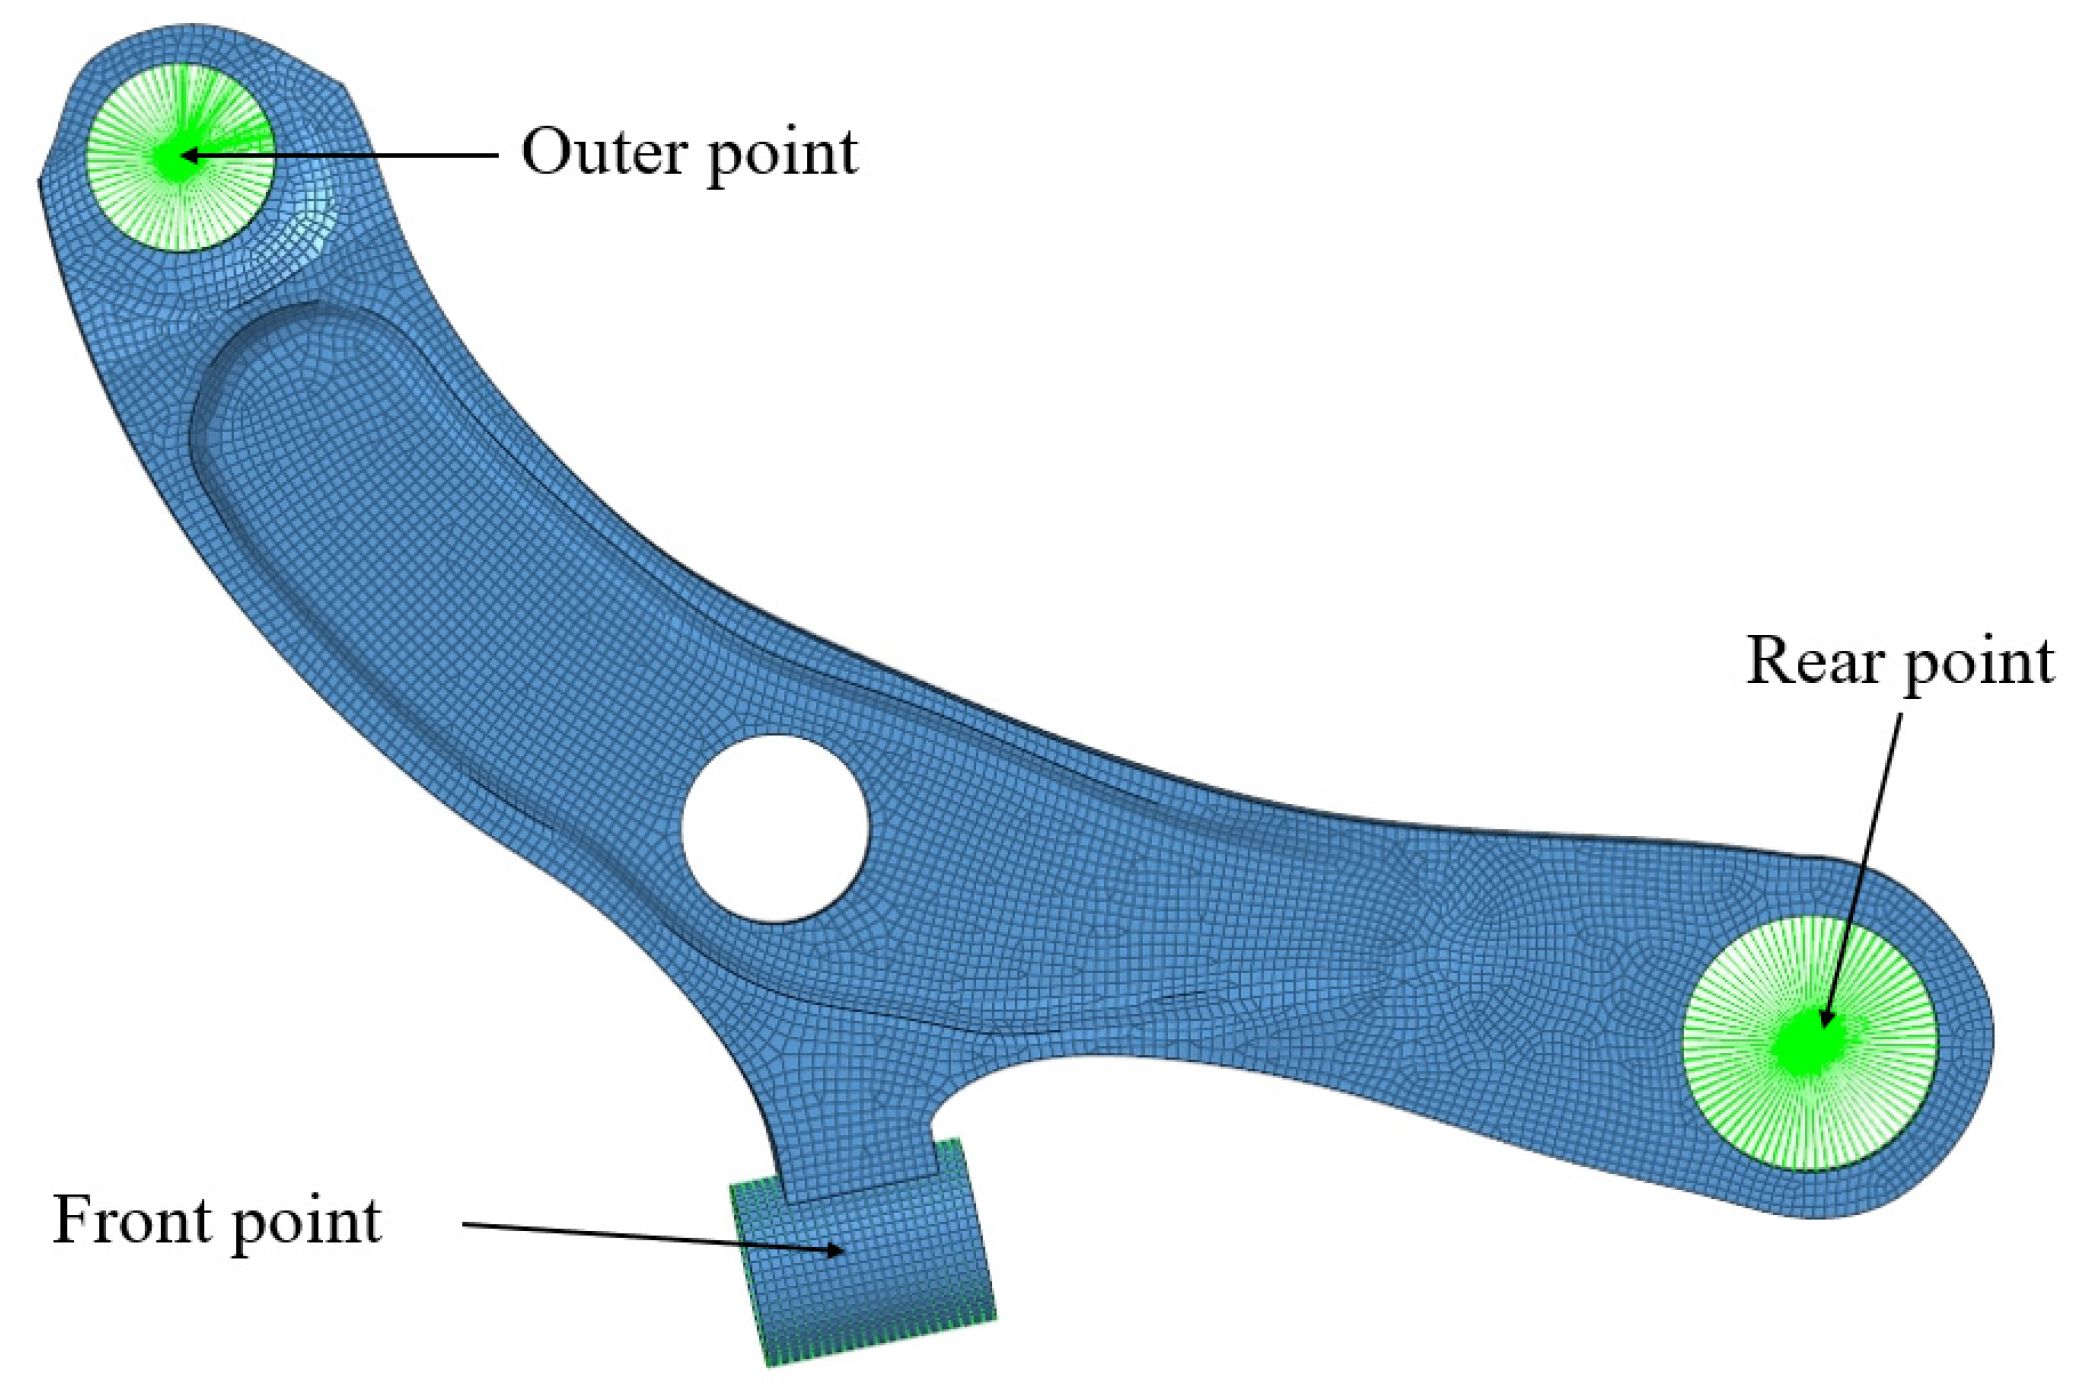
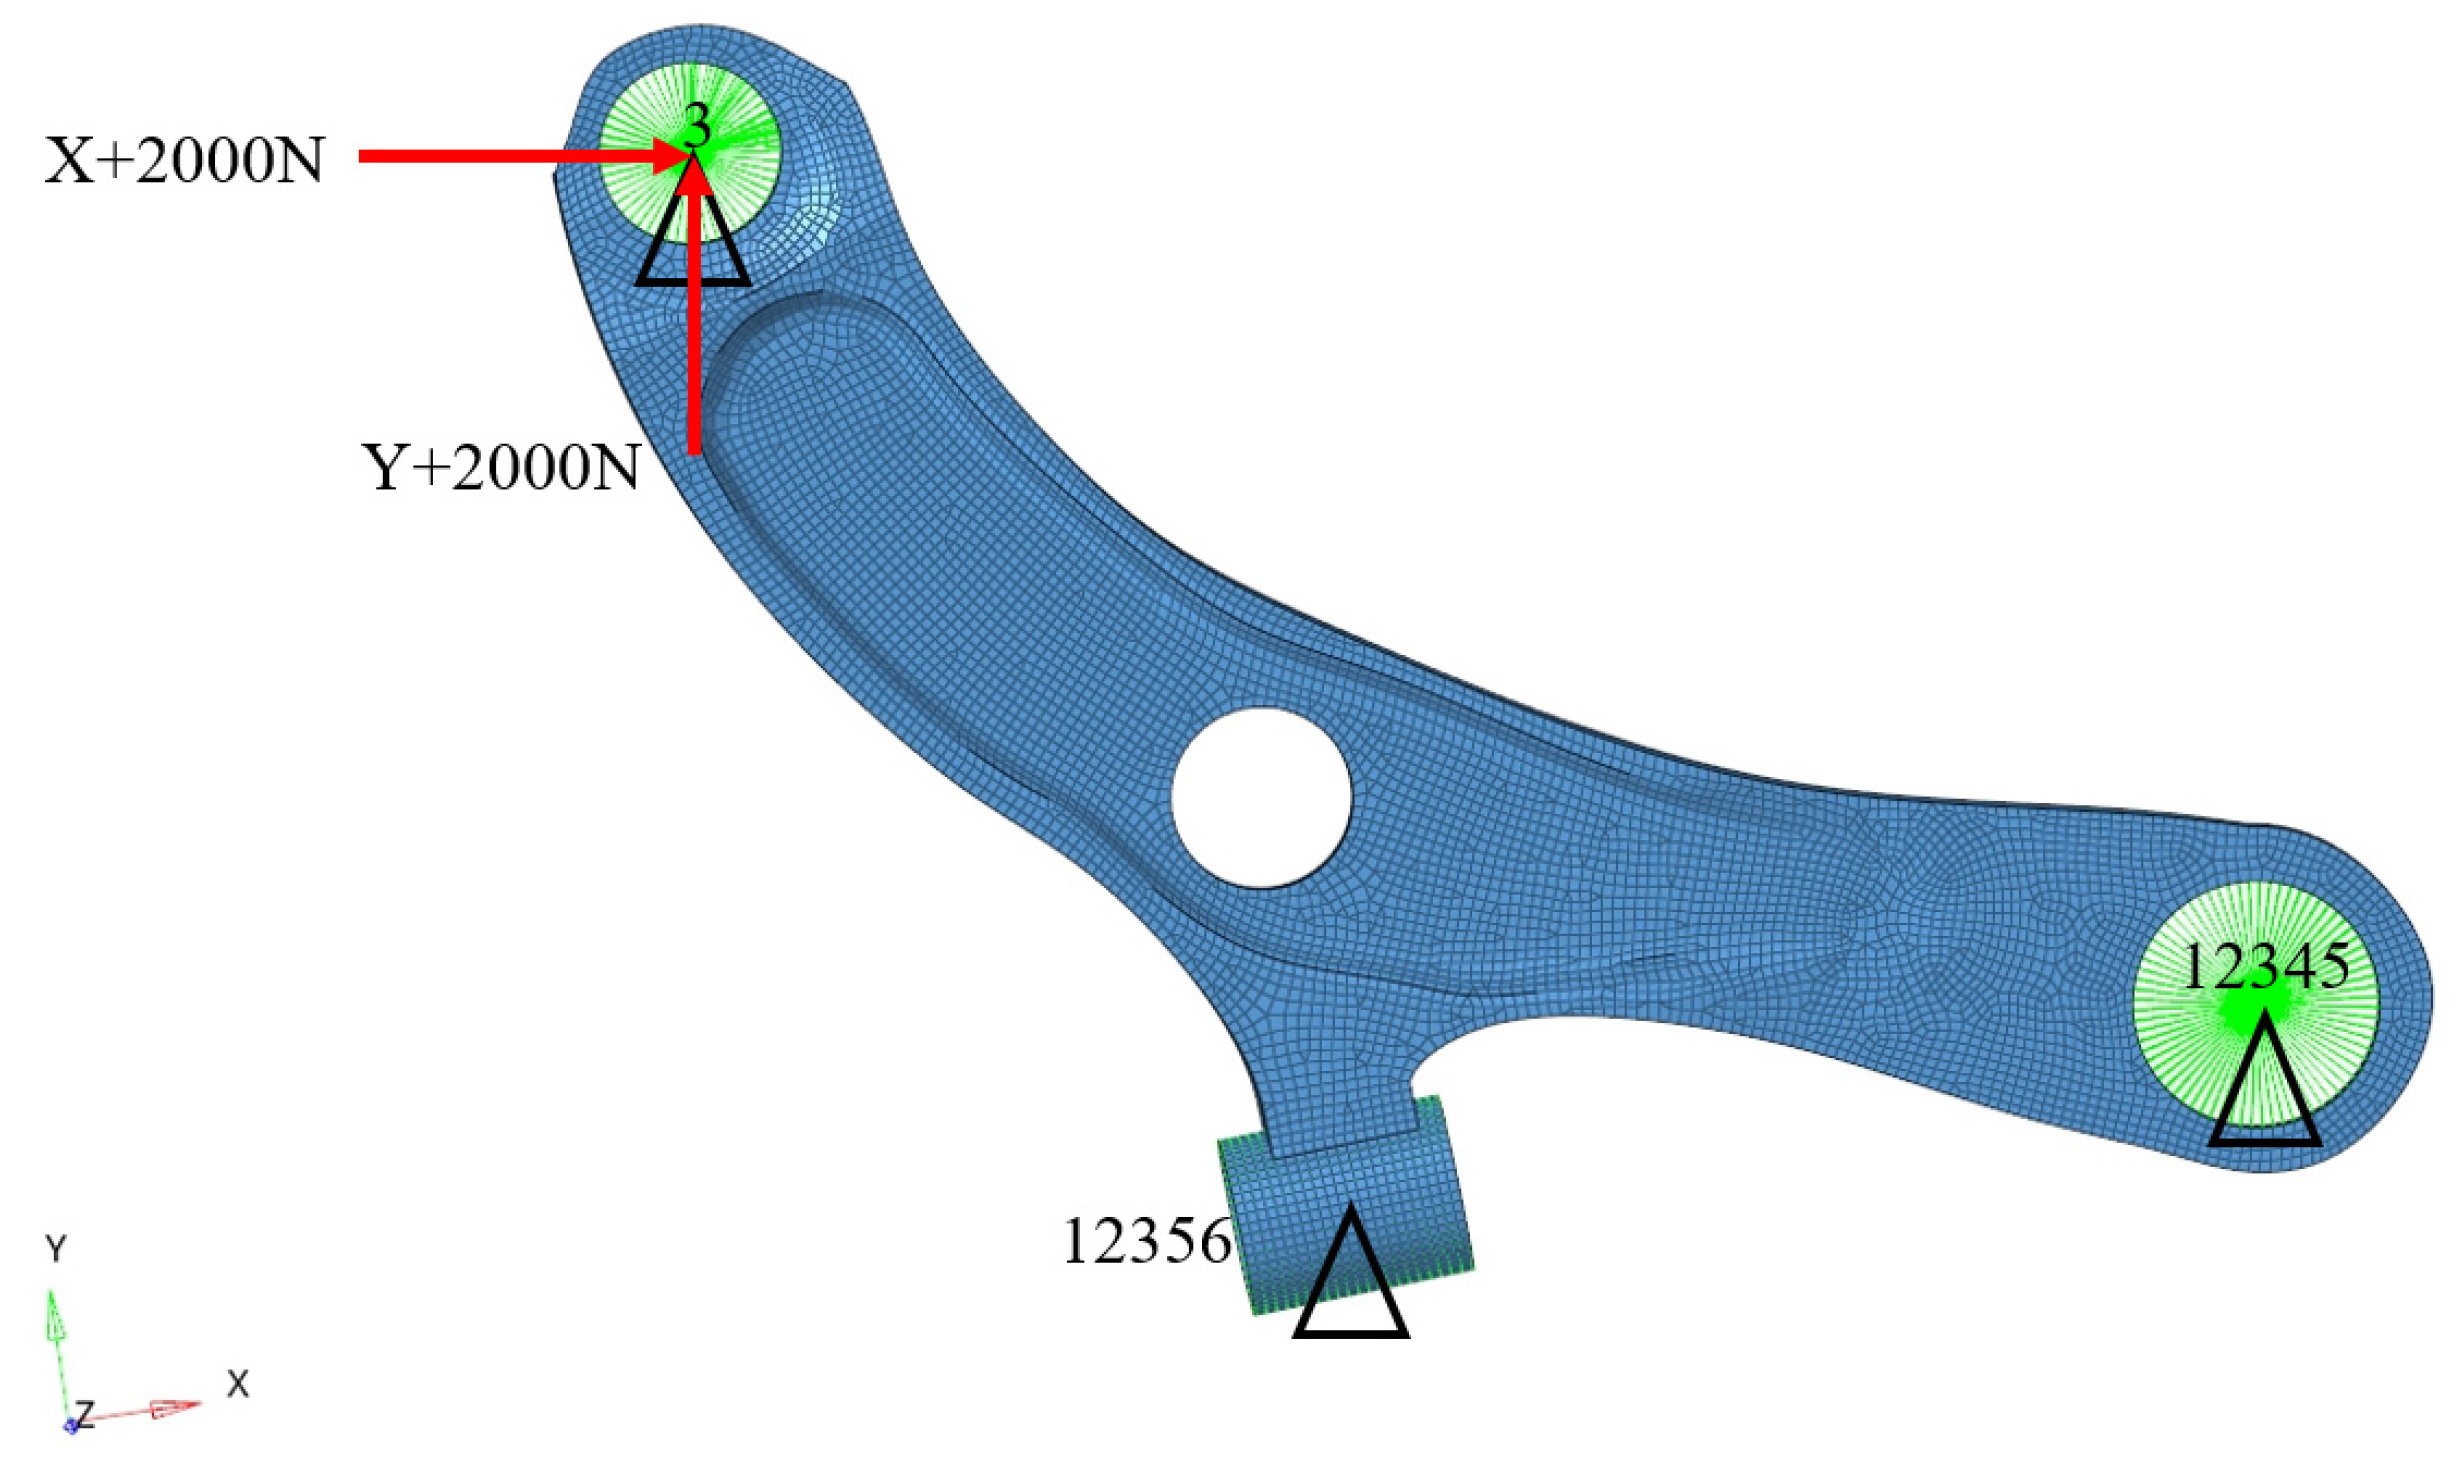
In this paper, a multi-objective reliability optimization method by integrating MCS with NSGA-II algorithm coupled with entropy weighted GRA is proposed, and the effectiveness of this method is verified by the lightweight optimization of the lower control arm of Macpherson suspension. Firstly, the finite element model of the control arm is established and the modal and stiffness analysis are carried out. Then, the inertial release method is used to calculate the stress distribution of the control arm under unit load. The load time histories of the control arm are extracted by dynamic simulations of the rigid-flexible coupling vehicle model. Accordingly, the nominal stress method is used to calculate the fatigue life of the control arm. On this basis, six design variables are defined for describing geometric dimension of control arm based on mesh morphing technology. The optimal Latin hypercube method is applied to generate the sample points for constructing Kriging surrogate models, which are used to describe the relationships between design variables of control arm and its structure performance including mass, fatigue life, stiffness, and mode. The multi-objective reliability optimization of the control arm is further performed by combining the NSGA-II algorithm and the Monte Carlo simulations. Finally, the entropy weighted grey relational analysis is adopted to determine the optimal solution from Pareto set for realizing lightweight design of the control arm.

2. Multi-Objective Reliability Optimization Method

2.1. Kriging Surrogate Model

Kriging is one of the most used estimation methods for spatial data interpolation, and it has been widely used to build surrogate models in automotive engineering in recent years [21,22,23]. The Kriging surrogate model covers the global trend and local nonlinearity of the response, and especially has high accuracy for predicting nonlinear response. It can analyze the trend and dynamic characteristics of known information [24,25,26].
The Kriging surrogate model usually includes a polynomial function and a random distribution. Its approximate function expression is:
y ^ ( x ) = f T ( x ) β + z ( x )
where β = [ β 1 , , β p ] T represents the regression coefficient vector; f T ( x ) represents a polynomial with design vector x; z ( x ) represents a random distribution, which can be expressed as a random function with zero mean and standard deviation of σ .
The covariance of random distribution z ( x ) is:
C o v [ z ( x i ) , z ( x j ) ] = σ 2 R
where R = [ R ( x i , x j ) ] is the spatial correlation equation of any two nondiagonal sample points x i and x j in the matrix, which plays an absolute role in the simulation accuracy.
Using Gaussian correlation equation to express R ( x i , x j ) is:
R ( x i , x j ) = E X P ( k = 1 m λ k | x i k x j k | 2 )
where m is the number of design variables; λ k represents the correlation coefficient of the fitted surrogate model; and xik and xjk represent the kth value of xi and xj, respectively.
After determining the correlation function, the estimated value y ^ ( x ) of the approximate response can be obtained. The estimated value β ^ of regression coefficient β and the estimated value σ ^ 2 can be expressed as:
{ y ^ ( x ) = f T ( x ) β ^ + r T ( X ) R 1 ( y F β ^ ) β ^ = ( F T R 1 F ) 1 F T R 1 y σ ^ 2 = ( y F β ^ ) T R 1 ( y F β ^ ) n
where r T ( X ) = [ R ( X , x 1 ) , R ( X , x 2 ) , , R ( X , x n ) ] is the correlation coefficient vector between prediction point X and sample point x; F is the ( n × p ) design matrix.
The maximum likelihood estimation for parameter λ k is:
max ( λ k ) λ k > 0 = [ n ln ( σ ^ 2 ) + ln | R | ] 2

2.2. Monte Carlo Simulation

Monte Carlo simulation (MCS) is a very important numerical analysis method guided by probability and statistics theory. The MCS method can be used to propagate the uncertainty in design variables to predicted responses. In MCS, random design variables are first generated according to statistical distribution. Their responses are usually predicted using surrogate models because the number of simulations is very large. Then, the probability distribution of responses can be obtained through statistical analysis. The process of MCS calculation using simple random sampling method is shown in Figure 1.
Based on MCS, the reliability of the design can be defined as:
R = 1 P f = 1 N F N
where P f is the failure probability; NF is the number of samples that does not satisfy the constraints; and N is the total samples.

2.3. Entropy Weighted Grey Relational Analysis

Grey relational analysis (GRA) is an important branch of grey system theory and has been widely applied to decision-making problems. Its basic idea is to map the discrete data to the geometric shape of the space by using the linear interpolation between adjacent points of the sequence. It provides the grey relational grade to judge the close relationship between sequences based on the distance between reference sequence and comparison sequence [27,28].
In order to eliminate the non-commensurable caused by different dimensions, it is necessary to normalize the response values before grey relational analysis. The normalization methods corresponding to different response characteristics are different. If the response value has a smaller-the-better characteristic, that is, the smaller the response value is, the better the performance is, the normalization calculation method is as follows:
x i ( k ) = max k x i ( k ) x i ( k ) max k x i ( k ) m in k x i ( k )
If the response value has a larger-the-better characteristic, that is, the larger the response value is, the better the performance is, the normalized calculation method can be expressed as follows:
x i ( k ) = x i ( k ) m in k x i ( k ) max k x i ( k ) min k x i ( k )
where x i ( k ) and x i ( k ) represent the original and normalized value of the ith response for the kth attribute, respectively; max k x i ( k ) and min k x i ( k ) are the maximum and minimum values of the kth attribute, respectively.
The response results after normalization are converted to values between [0, 1]. The larger the value is, the better the performance is, and 1 represents the optimal value. Define x 0 ( k ) = 1 as the reference sequence, and the normalized results as the comparison sequence. The deviation sequence of these two sequences is:
Δ 0 i ( k ) = | x 0 ( k ) x i ( k ) |
The calculation formula of grey relational coefficient between comparison sequence and reference sequence is as follows:
{ γ ( x 0 ( k ) , x i ( k ) ) = Δ min + ζ Δ max Δ 0 i ( k ) + ζ Δ max Δ min = min i min k Δ 0 i ( k ) Δ max = max i max k Δ 0 i ( k )
where Δ min and Δ max are the minimum and maximum of the deviation sequence, respectively; ζ [ 0 , 1 ] is the distinguishing coefficient, generally it equals to 0.5.
The grey relational grade is calculated by weighted summation of the grey relational coefficient of each attribute. The calculation formula is:
Γ i = k = 1 n w k γ ( x 0 ( k ) , x i ( k ) )
where n is the number of attributes; w k is the weight coefficient of the kth attribute, k = 1 n w k = 1 .
Generally, the relative importance of each attribute may be different, and their weights can be calculated by information entropy which denotes the degree of uncertainty of a random variable [29,30]. The projection value of the ith response for the jth attribute is formulated as:
p i j = x i j i n x i j
where i = 1, ‧‧‧, n, n is the number of responses; j = 1, ‧‧‧, m, m is the number of attributes; and x i j represents the normalized value of the ith response for the jth attribute.
The entropy value of the jth attribute is:
e j = 1 ln n i = 1 n p i j ln p i j
Then, the weight coefficient of attribute can be calculated as:
w j = d j j = 1 m d j
where d j = 1 e j represents the deviation degree of the jth attribute. Generally, a larger value of deviation degree indicates that it provides more information. Therefore, this attribute has a higher weight.

2.4. Multi-Objective Reliability Optimization

The traditional deterministic multi-objective optimization can be expressed by:
{ min f m ( x ) , m = 1 , , M s . t .   g k ( x ) 0 , k = 1 , , K x l b x x u b
where x is the vector of design variables; x l b and x u b are the lower and upper limits of the design variable, respectively; f m ( x ) and g k ( x ) are the optimization objectives and inequality constraints, respectively.
Deterministic optimization has been widely used in engineering design. However, it cannot consider the inevitably uncertain factors such as material properties and loading conditions, which may lead the optimal solutions near the constraint boundary to failure [31,32]. To overcome this drawback, the reliability optimization was proposed, as shown in Figure 2. The deterministic optimization point is the point optimized without reliability constraint and the reliability optimization point is the point optimized with reliability constraint.
Considering the uncertainty of design variables, reliability optimization was added to deterministic multi-objective optimization. It can be described as:
{ min f m ( x ) , m = 1 , , M s . t .   R [ G k ( x , y ) 0 ] R j , k = 1 , , K h j ( x ) 0 , j = 1 , , J
where f m ( x ) is the mth objective function; x is a vector of deterministic design variables; y is a vector of random variables; R is the reliability; Rj represents expected reliability; G k ( x , y ) is the probability constraint; and h j ( x ) is the deterministic constraint.
Accordingly, this paper proposes a multi-objective reliability optimization method based on Monte Carlo simulation and NSGA-II (elitist non-dominated sorting genetic algorithm) coupled with entropy weighted grey relational analysis. The Kriging surrogate models are employed to predict the response for improving optimization efficiency, for which the optimal Latin hypercube design is adopted to sampling. The proposed multi-objective reliability optimization procedure is shown in Figure 3.

3. Finite Element Analysis of Suspension Control Arm

3.1. Finite Element Modeling of Control Arm

For building the finite element model, the shell element was used to mesh the model of the control arm, which was discretized into 11,193 elements and 11,412 nodes. The front point and rear point of control arm were connected to the body using bushings, and the outer point was connected to the steering knuckle by a ball joint. These installation points were simulated by RBE2 elements. The finite element model of the lower control arm of the Macpherson strut was established, as shown in Figure 4.

3.2. Modal Analysis of Control Arm

The vibration performance of the suspension control arm has a great influence on the comfort, and is also related to the fatigue failure of the structure. Modal analysis was mainly used to calculate the vibration frequency and vibration mode of the structure. The modal analysis of the finite element model of the control arm was carried out under unconstrained free state, and the first six natural frequencies were extracted, as shown in Table 1.

3.3. Stiffness Analysis of Control Arm

The longitudinal stiffness and transverse stiffness of the control arm is related to its deformation under load, which affects the ride comfort and handling stability of the vehicle. In the stiffness analysis model of control arm, the translation in X, Y, Z direction and rotation around Y, Z axis of front point were constrained (marked as 1, 2, 3, 5, 6), and three translational degrees of freedom and rotation around X, Y axis of rear point were restrained (denoted as 1, 2, 3, 4, 5). The translation in Z direction of outer point was fixed (denoted as 3), while a load of 2000 N was applied in positive X and Y direction, respectively, so as to calculate the longitudinal stiffness and transverse stiffness of control arm. The boundary condition of stiffness analysis of control arm is shown in Figure 5, and the calculation results of stiffness are given in Table 2.

4. Fatigue Life Analysis of Suspension Control Arm

4.1. Cumulative Fatigue Damage Theory

It is well known that materials subjected to alternating load may lead to fatigue failure even at a quite low stress level. The fatigue can be divided into high cycle fatigue and low cycle fatigue. The number of high cycle fatigue cycles is usually greater than 105–107 times, and the alternating load is generally less than the yield limit of the material. Low cycle fatigue refers to the number of cycles is usually less than 104–105 times, and the alternating load is close to or higher than the yield limit of the material [33].
The fatigue cumulative damage theory includes linear, nonlinear, and bilinear fatigue cumulative damage theory. Miner cumulative damage theory is a representative linear damage theory. It assumes that the damage of component under every stress is independent. Without considering the loading sequence, the fatigue damage can be linearly superimposed, which can be expressed as:
D = i = 1 m n i N i
where D is the total fatigue damage, which equals 1, meaning fatigue failure; m is the number of stress levels; ni is the number of cycles accumulated at the ith stress level; and Ni is the fatigue life at the ith stress level.

4.2. Stress Analysis of Control Arm

The stress analysis of the lower control arm was carried out using the inertia release method. The control arm mainly transfers the loads between the wheel and body through three installation points. Hence, nine load cases, three cases for each connection point, were employed to predict the fatigue life of the control arm. A force of 1 N was applied for each load case. The stress distribution of the control arm for the nine load cases were obtained through finite element analysis. The stress contour of the control arm under the unit load in X direction of the outer point is shown in Figure 6.

4.3. Load Spectrum of Control Arm

The durability road of automotive proving ground is usually used to provide a load spectrum for estimating the fatigue performance of vehicle components because of the greatly reduced test cycle. The fatigue life of the control arm was predicted according to a virtual durability road, including a pebble road of 40 m, a washboard road of 40 m, and a Belgian road of 80 m [34]. Then, the dynamic simulation of a rigid-flexible coupling dynamic vehicle model, running on the virtual durability road, was performed to extract load time histories of the control arm. The dynamic load time histories of the outer point, the front point, and the rear point of the control arm were acquired, as shown in Figure 7.

4.4. Fatigue Life Prediction of Control Arm

The number of fatigue cycles of the suspension control arm is usually greater than 105, which belongs to the high cycle fatigue failure. Thus, the nominal stress method was adopted to predict its fatigue life. It was firstly necessary to determine the S-N curve, in which one axis denotes stress and the other axis is the number of cycles. The relationship between fatigue life and stress can be expressed by S-N curve, and its mathematical expression is:
σ a = σ f ( 2 N f ) b
where σ a represents the stress amplitude; σ f represents the fatigue strength coefficient; N f represents the number of load cycles; and b is fatigue strength index. The material of the control arm was QSTE420TM, its yield strength was 420 MPa, and its ultimate strength was 520 MPa. Then, the S-N curve was estimated using the material mapping, as shown in Figure 8.
The S-N curve is generally measured under the stress ratio of −1, which means the compressive stress equals the tensile stress. However, the stress ratio of control under load spectrum usually may not be −1. In a certain range, the compressive stress increases the fatigue limit while the tensile stress decreases the fatigue limit. Therefore, it is necessary to correct the effect of stress ratio on fatigue damage when the mean stress is not zero. Goodman theory can be used to correct the mean stress, that is:
S a S e ( R = 1 ) + S m UTS = 1
where Sa and Sm are the stress amplitude and mean stress of the material under load spectrum, respectively; UTS is the ultimate tensile strength of the material; and Se is the stress amplitude when the stress ratio is −1.
The load spectrum of the above nine cases were integrated with stress analysis results of the control arm under unit load to calculate the dynamic stress time histories. The Goodman method and the survival rate of 95% were adopted to conduct the S-N curve correction. The nominal stress method was then used to predict the fatigue life of the control arm, as shown in Figure 9.
It can be seen from Figure 9 that the minimum number of fatigue cycles of the control arm was 1.393 × 10⁶, which appeared near the front point connection. According to the length of established road model, the fatigue life durability mileage of the control arm was 1.393 × 106 × 0.16 = 222,880 km. By considering the enhancement coefficients of the pebble road, washboard road, and Belgian road, which took the value of 5.8, 4.9, and 12.6, respectively [35], the enhancement coefficient of the durability road model was calculated as 5.8 × 0.25 + 4.9 × 0.25 + 12.6 × 0.5 = 8.975. Thus, the minimum life mileage of the control arm was 222,880 × 8.975 = 2,000,348 km. The life mileage had a large margin, and there is potential for lighter weight.

5. Multi-Objective Reliability Optimization of Suspension Control Arm

5.1. Design Variables

The parameterized finite element model of the control arm was developed based on mesh morphing technology. Five shape variables and a thickness variable (denoted as x1, x2, ···, x6) were defined, as shown in Figure 10. The mesh morphing of the parameterized model of the control arm was realized by translating and scaling the control node. The value ranges of design variables are given in Table 3.

5.2. Kriging Surrogate Models of Control Arm

Surrogate model technology is a method used to approximate the relationship between a set of input variables and output variables by mathematical model. The sampling method has a great influence on the accuracy of the surrogate model. The optimal Latin hypercube design can sample uniform points throughout the design space, so that the fitting of factors and responses is more accurate [36].
Therefore, the optimal Latin hypercube sampling method was adopted to generate 41 sample points for the six design variables, which were employed to build the Kriging surrogate models of the control arm. The performance indexes were obtained through finite element analysis of the control arm. The accuracy was verified by the determination coefficient R2, expressed as:
R 2 = i = 1 n ( y ^ i y ¯ ) i = 1 n ( y i y ¯ )
where n is the number of sample points used to verify the accuracy of Kriging model; y ^ i is the predicted value of the ith response; yi is the simulation value of the ith response; and y ¯ is the average value.
The closer to 1 the determination coefficient R2 is, the higher the prediction accuracy of the surrogate model is. Ten sample points were selected to verify the accuracy of the Kriging models. The R2 of the fatigue life, mass, first-order natural frequency, longitudinal stiffness, and transverse stiffness of the control arm were 0.9808, 0.9830, 0.9821, 0.9672 and 0.9936, respectively. The Kriging surrogate model accuracy verification results of fatigue life and mass are shown in Figure 11.

5.3. Deterministic Multi-Objective Optimization of Control Arm

The control arm is expected to have sufficient life without fatigue failure, while having a small mass. Further considering the performance constraints of longitudinal stiffness, transverse stiffness, and first-order natural frequency, the deterministic multi-objective optimization of the control arm can be formulated as:
{ min ( m ( x ) , N ( x ) ) f i n d   x = ( x 1 , , x 2 ) T s . t . | k x ( x ) k x 0 | 0.1 k x 0     | k y ( x ) k y 0 | 0.1 k y 0     | f t ( x ) f t 0 | 0 . 1 f t 0     x ( x L , x U )
where x is the design variable vector of the control arm; m ( x ) is the control arm mass; N ( x ) is the minimum fatigue life; k x ( x ) , and k x 0 are the longitudinal stiffness and its initial value, respectively, k x 0 = 12,821 N·mm−1; k y ( x ) and k y 0 are the transverse stiffness and its initial value, respectively, k y 0 = 25,974 N·mm−1; f t ( x ) and f t 0 are the first order natural frequency and its initial value, f t 0 = 324.1 Hz; and xL and xU are the lower and upper limits of design variable, respectively.
The NSGA-II algorithm with a population size of 40 and generation of 100 was applied to solve the optimization of control arm. The Kriging surrogate models were used to calculate the performance indexes in the optimization process. Then, the Pareto front was obtained, as shown in the Figure 12. The optimal design parameters were selected from the Pareto solutions by considering that the mass was minimized as far as possible while meeting the fatigue life requirements. According to engineering practice, the optimization results of design variables were corrected, as shown in Table 4. The corrected design parameters were used to modify the finite element model of the control arm, and its performance indexes were obtained, also listed in Table 4. The mass of the optimized control arm decreased from 3.16 kg to 2.88 kg while its fatigue life was 1.08 × 10⁶, meeting the design requirement, as well as the other performance indexes.

5.4. Multi-Objective Reliability-Based Optimization

The fatigue life of the control arm is sensitive to the uncertainties of the six design variables. Therefore, a multi-objective reliability-based optimization of the control arm was developed based on deterministic optimization by considering the reliability constraint of fatigue life, in which the Monte Carlo simulation was applied to calculate the reliability. The deterministic optimization results of design variables were determined as the mean values of the design parameters of the control arm, which were taken as probability random variables subjected to normal distribution, as shown in Table 5. Considering the reliability of fatigue life more than 106 cycles, the multi-objective reliability optimization can be formulated as:
{ min ( m ( x ) , N ( x ) ) find   x = ( x 1 , , x 2 ) T s . t . R [ N ( x ) 10 6 ] R j       | k x ( x ) k x 0 | 0.1 k x 0     | k y ( x ) k y 0 | 0.1 k y 0     | f t ( x ) f t 0 | 0 . 1 f t 0 x ( x L , x U )
where R is the reliability; and Rj represents the expected reliability, set to 95%.
There were 111 Pareto solutions obtained by solving the reliability-based optimization based on NSGA-II algorithm and Monte Carlo simulations. Then, the entropy weighted grey relational analysis was employed to determine the optimal design of the control arm. The Pareto solutions were defined as the decision-making matrix, which were used to calculate the grey relational coefficients, and some of them are listed in Table 6. Then, the weights of performance indexes were obtained using the entropy method, as listed in Table 6. Finally, the grey relational grade was calculated, as shown in Figure 13.
It can be seen from Figure 13 that the grey relational grade of the third Pareto solution was the maximum, that is, this grey relational grade was the closest to the expected value. Therefore, the third Pareto solution was selected as the optimal design of the control arm after multi-objective reliability optimization. The design variables obtained by the reliability-based optimization were corrected according to practical engineering, as shown in Table 7. The finite element model of the control arm was modified using these design parameters, and the fatigue life contour is given in Figure 14.
The comparison of the performance indexes before and after multi-objective reliability optimization of the control arm is shown in Table 8. Compared with the initial steel control arm, after the deterministic optimization, the mass of optimized control arm was reduced by 8.89% from 3.16 to 2.88 kg and the life was reduced by 22.47% from 1.39 × 10⁶ to 1.08 × 10⁶, with a reliability of 90%. After the multi-objective reliability optimization of the control arm, longitudinal stiffness changed little, the first mode frequency and transverse stiffness increased, and the mass changed from 3.16 kg to 3.03 kg. The mass decreased by 4.1% while the life increased by 215.8%, with a high reliability of 97%.

6. Conclusions

This paper proposed a multi-objective reliability optimization method based on Monte Carlo simulation, NSGA-II algorithm and entropy weighted grey relational analysis, applied to perform the lightweight design of a lower control arm of McPherson suspension. The finite element model of the control arm was developed to conduct the modal and stiffness analysis. The fatigue life of the control arm was predicted by a normal stress method, using the load spectrum acquired by dynamic simulations of the rigid-flexible coupling vehicle model running on the virtual durability road. Then, the deterministic multi-objective optimization of the control arm was carried out to minimize the mass and maximize the fatigue life with the constraints of first order natural frequency and longitudinal and transverse stiffness, based on the Kriging model and NSGA-II algorithm. The deterministic optimization results showed that the mass of the control arm was reduced from 3.16 kg to 2.88 kg with a reduction of 8.89%, and the life was reduced by 22.47% from 1.39 × 10⁶ to 1.08 × 10⁶, with a reliability of 90%.
On this basis, the multi-objective reliability optimization of the control arm was conducted using the NSGA-II algorithm and the Monte Carlo simulations. The entropy weighted grey relational analysis was adopted to determine the optimal design of the control arm from the Pareto solutions. The reliability optimization results indicated that the mass of the optimized control arm was reduced by 4.1% and the life was increased by 215.8% with a high reliability of 97%. This proves that the proposed multi-objective reliability optimization procedure is effective for automotive lightweight design.

Author Contributions

Conceptualization, R.J., T.S. and D.W.; methodology, R.J. and T.S.; software, R.J. and T.S.; validation, R.J. and T.S.; writing—original draft preparation, R.J., T.S., D.L. and Z.P.; writing—review and editing, R.J., T.S., D.L. and Z.P. All authors have read and agreed to the published version of the manuscript.

Funding

This research was funded by National Natural Science Foundation of China (grant no. 51805286) and Shandong Province Natural Science Foundation (grant no. 2017PEE004).

Conflicts of Interest

The authors declare no conflict of interest.

References

  1. Agarwal, J.; Sahoo, S.; Mohanty, S.; Nayak, S.K. Progress of novel techniques for lightweight automobile applications through innovative eco-friendly composite materials: A review. J. Thermoplast. Compos. 2020, 33, 978–1013. [Google Scholar] [CrossRef]
  2. Deng, Y.L.; Guo, Y.S.; Wu, P.; Ingarao, G. Optimal design of flax fiber reinforced polymer composite as a lightweight component for automobiles from a life cycle assessment perspective. J. Ind. Ecol. 2019, 23, 986–997. [Google Scholar] [CrossRef]
  3. Pu, Y.F.; Ma, F.W.; Zhang, J.Y.; Yang, M. Optimal lightweight material selection for automobile applications considering multi-perspective Indices. IEEE Access 2018, 6, 8591–8598. [Google Scholar] [CrossRef]
  4. Kahoul, H.; Belhour, S.; Bellaouar, A.; Dron, J.P. Fatigue life prediction of upper arm suspension using strain life approach. J. Eng. Des. Technol. 2019, 17, 25–40. [Google Scholar] [CrossRef] [Green Version]
  5. Yarmohammadisatri, S.; Shojaeefard, M.H.; Khalkhali, A. A family base optimization of a developed nonlinear vehicle suspension model using gray family design algorithm. Nonlinear Dyn. 2017, 90, 649–669. [Google Scholar] [CrossRef]
  6. Albak, E.I.; Solmaz, E.; Ozturk, F. Simplified optimization model and analysis of twist beam rear suspension system. Proc. Inst. Mech. Eng. Part D 2021, 235, 1434–1445. [Google Scholar] [CrossRef]
  7. Viqaruddin, M.; Reddy, D.R. Structural optimization of control arm for weight reduction and improved performance. Mater. Today Proc. 2017, 4, 9230–9236. [Google Scholar] [CrossRef]
  8. Yoo, S.H.; Doh, J.; Lim, J.; Kang, O.; Lee, J.; Kang, K. Topologically optimized shape of CFRP front lower control ARM. Int. J. Automot. Technol. 2017, 18, 625–630. [Google Scholar] [CrossRef]
  9. Zhang, H.T. Lightweight and performance of anti-collision strength of automobiles based on carbon fiber composites. Korean J. Mater. Res. 2019, 29, 525–531. [Google Scholar] [CrossRef]
  10. Guler, T.; Demirci, E.; Yildiz, A.R.; Yavuz, U. Lightweight design of an automobile hinge component using glass fiber polyamide composites. Mater. Test. 2018, 60, 306–310. [Google Scholar] [CrossRef]
  11. Chen, J.; Peng, B.; Wang, D.F.; Huang, H. Lightweight design of optimization of a single piece of stamping control arm of vehicle. J. Tongji Univ. 2018, 46, 389–393. [Google Scholar]
  12. Wang, C.Y.; Wang, W.W.; Zhao, W.Z.; Wang, Y.L.; Zhou, G. Structure design and multi-objective optimization of a novel NPR bumper system. Compos. Part B Eng. 2018, 153, 78–96. [Google Scholar] [CrossRef]
  13. Fossati, G.G.; Fadel Miguel, L.F.; Paucar Casas, W.J. Multi-objective optimization of the suspension system parameters of a full vehicle model. Optim. Eng. 2018, 20, 151–177. [Google Scholar] [CrossRef]
  14. Tang, Z.H.; He, Y.S.; Ma, T.; Zhang, Z.F.; Pu, H.J.; Li, Y.; Chen, Z. Lightweight design of automotive sound package. Automot. Eng. 2021, 43, 113–120. [Google Scholar]
  15. Nikkhah, H.; Baroutaji, A.; Olabi, A.G. Crashworthiness design and optimisation of windowed tubes under axial impact loading. Thin-Walled Struct. 2019, 142, 132–148. [Google Scholar] [CrossRef]
  16. Panagant, N.; Bureerat, S.; Tai, K. A novel self-adaptive hybrid multi-objective meta-heuristic for reliability design of trusses with simultaneous topology, shape and sizing optimisation design variables. Struct. Multidiscip. Optim. 2019, 60, 1937–1955. [Google Scholar] [CrossRef]
  17. Lobato, F.S.; Da Silva, M.A.; Cavalini, A.A.J.; Steffen, V.J. Reliability-based robust multi-objective optimization applied to engineering system design. Eng. Optim. 2020, 52, 1–21. [Google Scholar] [CrossRef]
  18. Lim, J.; Jang, Y.S.; Chang, H.S.; Park, J.C.; Lee, J. Multi-objective genetic algorithm in reliability-based design optimization with sequential statistical modeling: An application to design of engine mounting. Struct. Multidiscip. Optim. 2020, 61, 1253–1271. [Google Scholar] [CrossRef]
  19. Zhang, J.H.; Gao, L.; Xiao, M. A new hybrid reliability-based design optimization method under random and interval uncertainties. Int. J. Numer. Methods Eng. 2020, 121, 4435–4457. [Google Scholar] [CrossRef]
  20. Li, J.P.; Bai, L.; Gao, W.; Shi, N.; Wang, N.; Ye, M.; Gu, H.; Xu, X.X.; Liu, J. Reliability-based design optimization for the lattice boom of crawler crane. Structures 2021, 29, 1111–1118. [Google Scholar] [CrossRef]
  21. Shi, Y.; Lu, Z.Z. Dynamic reliability analysis model for structure with both random and interval uncertainties. Int. J. Mech. Mater. Des. 2019, 15, 521–537. [Google Scholar] [CrossRef]
  22. Gao, F.L.; Bai, Y.C.; Lin, C.; Kim, I.Y. A time-space Kriging-based sequential metamodeling approach for multi-objective crashworthiness optimization. Appl. Math. Model. 2019, 69, 378–404. [Google Scholar] [CrossRef]
  23. Chowdappa, V.; Botella, C.; Javier Samper-Zapater, J.; Martinez, R.J. Distributed radio map reconstruction for 5G automotive. IEEE Intell. Transp. Syst. Mag. 2018, 10, 36–49. [Google Scholar] [CrossRef]
  24. Xu, F.X.; Sun, G.Y.; Li, G.Y.; Li, Q. Crashworthiness design of multi-component tailor-welded blank (TWB) structures. Struct. Multidiscip. Optim. 2013, 48, 653–667. [Google Scholar] [CrossRef]
  25. Kim, S.; Lee, S.; Kim, J.; Lee, T.H.; Lim, M. Uncertainty identification method using kriging surrogate model and Akaike information criterion for industrial electromagnetic device. IET Sci. Meas. Technol. 2020, 14, 250–258. [Google Scholar] [CrossRef]
  26. Jiang, R.; Jin, Z.; Liu, D.; Wang, D. Multi-objective lightweight optimization of parameterized suspension components based on NSGA-II algorithm coupling with surrogate model. Machines 2021, 9, 107. [Google Scholar] [CrossRef]
  27. Zhang, Y.H.; Liu, C.; Xu, T.T.; Huang, Y.; Tao, L.Y. Impact analysis and classification of aircraft functional failures using improved FHA based on grey evaluation. Grey Syst. Theory Appl. 2020, 10, 159–171. [Google Scholar] [CrossRef]
  28. Zhang, Z.F.; Li, H.L.; Yue, L.; Du, Y.K. End of life vehicle disassembly plant layout evaluation integrating gray correlation and decision making trial and evaluation laboratory. IEEE Access 2020, 8, 141446–141455. [Google Scholar] [CrossRef]
  29. Ding, Q.Y.; Wang, Y.M. Intuitionistic fuzzy TOPSIS multi-attribute decision making method based on revised scoring function and entropy weight method. J. Intell. Fuzzy Syst. 2019, 36, 625–635. [Google Scholar] [CrossRef]
  30. Jiang, R.; Zhang, T.; Sun, H.; Liu, D.; Chen, H.; Wang, D. Study on lightweighting of CFRP bumper beam using entropy-based TOPSIS approach. Automot. Eng. 2021, 43, 421–428. [Google Scholar]
  31. Dammak, K.; El Hami, A. Multi-objective reliability based design optimization of coupled acoustic-structural system. Eng. Struct. 2019, 197, 109389–109395. [Google Scholar] [CrossRef]
  32. Yin, H.; Fang, H.; Xiao, Y.; Wen, G.; Qing, Q. Multi-objective robust optimization of foam-filled tapered multi-cell thin-walled structures. Struct. Multidiscip. Optim. 2015, 52, 1051–1067. [Google Scholar] [CrossRef]
  33. Pavlou, D.G. The theory of the S-N fatigue damage envelope: Generalization of linear, double-linear, and non-linear fatigue damage models. Int. J. Fatigue 2018, 110, 204–214. [Google Scholar] [CrossRef]
  34. Jiang, R.C.; Wang, D.F.; Qin, M.; Jiang, Y.F. Lightweight design of twist beam of rear suspension of passenger car based on fatigue life. J. Jilin Univ. (Eng. Technol. Ed.) 2016, 46, 35–42. [Google Scholar]
  35. Guo, H.; Chen, W.H.; Fan, X.Y.; Deng, Y.W.; Wu, H.M. Research of enhancement coefficient of automobile reliability enhancement test on proving ground. Chin. J. Mech. Eng. 2004, 40, 73–76. [Google Scholar] [CrossRef]
  36. Ba, S.; Myers, W.R.; Brenneman, W.A. Optimal sliced latin hypercube designs. Technometrics 2015, 57, 479–487. [Google Scholar] [CrossRef]
Figure 1. Flowchart of MCS calculation.
Applsci 11 05825 g001
Figure 2. Reliability optimization diagram.
Applsci 11 05825 g002
Figure 3. Flowchart of the proposed multi-objective reliability optimization method.
Applsci 11 05825 g003
Figure 4. Finite element model of suspension control arm.
Applsci 11 05825 g004
Figure 5. Loading and constraints of suspension control arm.
Applsci 11 05825 g005
Figure 6. Stress contour of control arm under in X axial unit load of outer point.
Applsci 11 05825 g006
Figure 7. Load spectrum of control arm.
Applsci 11 05825 g007
Figure 8. S-N curve of control arm material.
Applsci 11 05825 g008
Figure 9. Fatigue life contour of control arm.
Applsci 11 05825 g009
Figure 10. Parameterized model of the control arm and its design variables.
Applsci 11 05825 g010
Figure 11. Accuracy verification of Kriging models. (a) Fatigue life; (b) mass.
Applsci 11 05825 g011
Figure 12. Pareto front.
Applsci 11 05825 g012
Figure 13. Grey relational grade.
Applsci 11 05825 g013
Figure 14. Fatigue life nephogram of optimized control arm.
Applsci 11 05825 g014
Table 1. Natural frequency of the first six modes of control arm.
OrderNatural Frequency/Hz
1324.1
2357.1
3602.5
41003.9
51254.2
61439.4
Table 2. Results of stiffness analysis of control arm.
DirectionForce/NDisplacement/mmStiffness/N·mm1
X+20000.15612,821
Y+20000.07725,974
Table 3. Design variables and value range of control arm.
VariablesVariable DescriptionInitial ValueLower LimitUpper Limit
x1/mmVariation of flanging height0−55
x2Width scaling at outer point10.91.1
x3Width scaling at front point10.91.1
x4Width scaling at rear point10.91.1
x5Scaling of hole diameter10.91.1
x6/mmThickness546
Table 4. Deterministic multi-objective optimization results.
VariablesOptimal ValueCorrected ValueResponsesValue
x 1 /mm−4.9711−5.0Mass/kg2.88
x 2 0.946250.95Life/cycles1,080,000
x 3 1.09551.09First order natural frequency/Hz333.84
x 4 0.900050.90Longitudinal stiffness/N·mm−111,765
x 5 0.981210.98Transverse stiffness/N·mm−123,810
x 6 /mm4.99345.0
Table 5. Design variable probabilistic distributions.
VariablesMeanStandard DeviationDistribution
x 1 /mm−5.00.75Normal
x 2 0.950.14Normal
x 3 1.090.16Normal
x 4 0.900.14Normal
x 5 0.980.15Normal
x 6 /mm5.00.75Normal
Table 6. Grey relational coefficient.
Grey Relational CoefficientWeight
12‧‧‧110111
Mass0.67750.4280‧‧‧0.17300.09540.2837
Fatigue life0.35340.5154‧‧‧0.04540.11970.1210
First order natural frequency0.36780.7201‧‧‧0.02060.04080.0450
Longitudinal stiffness0.37740.7262‧‧‧0.02270.04460.0529
Transverse stiffness0.40790.5795‧‧‧0.03650.09320.0946
Reliability0.35200.3600‧‧‧0.23640.14500.4027
Table 7. Multi-objective reliability optimization results.
VariablesOptimal ValuesCorrected Values
x 1 /mm−4.9471−4.9
x 2 0.900290.90
x 3 1.098901.10
x 4 0.900910.90
x 5 0.900210.90
x 6 /mm5.34015.3
Table 8. Comparison of optimal design results.
Initial ValueDeterministic OptimizationReliability Optimization
Mass/kg3.162.883.03
Life/cycles1.39 × 1061.08 × 1064.39 × 106
First order natural frequency/Hz324.09333.84356.49
Longitudinal stiffness/N·mm−112,82111,76512,658
Transverse stiffness/N·mm−125,97423,81026,316
Reliability of fatigue life 0.900.97
Publisher’s Note: MDPI stays neutral with regard to jurisdictional claims in published maps and institutional affiliations.

