Article

H2O Collisional Broadening Coefficients at 1.37 µm and Their Temperature Dependence: A Metrology Approach

1
Physikalisch-Technische Bundesanstalt, Bundesallee 100, 38116 Braunschweig, Germany
2
Department of Mechanical Engineering, Reactive Flows and Diagnostics, Technical University of Darmstadt, Otto-Berndt-Str. 3, 64287 Darmstadt, Germany
*
Authors to whom correspondence should be addressed.
Appl. Sci. 2021, 11(12), 5341; https://doi.org/10.3390/app11125341
Submission received: 30 April 2021 / Revised: 2 June 2021 / Accepted: 4 June 2021 / Published: 8 June 2021

Abstract

:
We report self- and air collisional broadening coefficients for the H2O line at 7299.43 cm−1 and corresponding temperature coefficients for a temperature range spanning 293–573 K. New laser spectroscopic setups specifically designed for this purpose have been developed and are described. The line parameters reported here are in good agreement with those values reported in the HITRAN 2020 database, but the uncertainties have been reduced by factors of about 4, 1.3 and 4.4 for the self-broadening coefficient, air broadening coefficient and the temperature exponent of air broadening, respectively. Further, we combined our measurement approach with metrological data quality objectives, addressing the traceability of the results to the international system of units (SI) and evaluated the uncertainties following the guide to the expression of uncertainty in measurement (GUM).

1. Introduction

Water vapor is the most abundant greenhouse gas and is routinely measured in atmospheric chemistry research [1,2,3]. Atmospheric water vapor measurements are often performed by instruments such as balloon radiosondes and satellite-based infrared sensors [1]. Throughout recent years, several studies both in the lab and in the field have been performed to improve the accuracy and reproducibility of water vapor amount fraction (concentration) measurements (employing a variety of hygrometers) [1,3,4,5,6,7,8]. Studies in well-controlled environments comparing a wide variety of field hygrometers for atmospheric applications [1] have revealed large systematic discrepancies (about 10% and even larger in tropopause conditions) in the H2O concentration results. These discrepancies can be in part attributed to deficiencies in the measurements and the lack of SI-traceable hygrometer calibrations, in particular at the low concentration ranges [3].
Laser hygrometers, e.g., based on direct tunable diode laser absorption spectroscopy (dTDLAS), are increasingly used for the measurement of H2O in a broad range of applications [8,9,10,11,12,13] such as airborne measurements [14], optical open path pressure measurements [9], tomographic 2-D water vapor measurements [15], high-resolution water transpiration rate measurements in single plant leaves [12] or for trace water measurements down to the nmol/mol level [13]. For spectroscopic H2O measurements, the H2O absorption line in the near infrared (NIR) at about 1.37 µm (i.e., at 7299.43 cm−1) is almost ideal due to its good spectral isolation allowing simplified fitting schemes. Hence, this line is very frequently used in a multitude of applications and publications [8,11,12,14,15,16]. The use of this 1.37 µm H2O line originated from a dedicated line selection process and test measurements [3,11,17], as well as the availability of fairly low-cost (compared to the mid-infrared MIR) near-infrared optical elements and detectors from telecom mass applications that are hence easily available with excellent performance parameters. This is particularly true for the fiber-coupled diode lasers [13] that spurred the development of very compact field-compatible laser hygrometers [5,11,14].
In gas metrology, employing these 1.37 µm laser hygrometers to realize the most accurate H2O amount fraction measurements at the same time requires accurate (metrology compatible) spectral line data (line strength, collisional broadening coefficients) for this H2O line at 7299.43 cm−1. The curation of new improved line data will further improve the data quality of results delivered by a new generation of 1.37 µm laser hygrometers that is envisaged. The idea of measuring metrology-compatible line data for gas species amount fraction measurements has been promoted for a variety of molecules in different applications [10,18,19,20,21]. The line data are used, e.g., in new lab- and field-based laser absorption spectrometers being developed to be operated as calibration-free optical gas standards (OGSs) [3,7,8,11,13,14,22,23]. An OGS delivers direct SI-traceable gas species concentration results and can also complement gaseous calibration standards even at the µmol/mol (ppm) level [3,4,22]. A prominent spectroscopy technique for such OGSs is direct tunable diode laser absorption spectroscopy (dTDLAS). It should be noted here, as also detailed in our previous works [3,6,7,11,14,23,24,25], that dTDLAS is a variant of TDLAS that combines TDLAS with a special first principles data evaluation approach to directly extract absolute gas species concentrations without calibration of the spectrometer with gaseous reference standards.
Regarding H2O line data, collisional broadening coefficients are specifically required for spectroscopic measurements, e.g., those based on dTDLAS and similar spectroscopic techniques, where the absorption line has to be modeled (due to potential variations in the gas pressure, temperature or matrix during the measurements), e.g., with a Voigt profile. These line data, i.e., collisional broadening coefficients as well as line strengths, are usually taken from spectroscopic databases such as HITRAN [26] and GEISA [27]. In fact, these databases have large amounts of line data for a broad range of molecules. However, information on the traceability of the line data to the SI units and assessments of uncertainties following the guide to the expression of uncertainty in measurement (GUM) [28] are almost never provided [29]. However, there is a call for new and improved SI-traceable line data for specific applications, e.g., in atmospheric H2O measurements. A few studies did already focus on the measurement of SI-traceable line data and the evaluation of the associated uncertainties following GUM principles [10,18].
For the majority of laser hygrometers where the data evaluation concept does not require modeling of the absorption line employing line data, tedious pressure, temperature- and matrix-dependent calibration of the instrument is required. These sometimes difficult and complex calibration procedures can be avoided if accurate and reliable line data are used to fit the absorption line to determine the amount of water, i.e., in dTDLAS-OGS instruments [3,22]. Fitting the absorption line with accurate collisional broadening coefficients can significantly increase the speed of measurements due to a reduced number of fitting parameters, particularly important in the field where small variations in gas concentrations need to be captured as fast as possible, and the repeatability and reproducibility of the corresponding concentration results. The necessity of reliable collisional broadening coefficients (to improve concentration measurements and results) has also been demonstrated in a variety of applications [3,7,9,11,14,22].
Apart from dTDLAS, a variety of laser spectrometers have been employed aiming for high-accuracy H2O measurements, e.g., comparing results to a primary trace-moisture standard [30], performing absolute measurements of water vapor densities reaching an overall uncertainty of 0.8% [31], utilizing a frequency-stabilized cavity ring-down spectroscopy spectrometer for high-precision measurements of trace water vapor concentration and reaching a minimum detection of water vapor concentration of 0.7 ppb [32], applying wavelength modulation spectroscopy for H2O detection in combustion gases and achieving a precision of 2.1% [33], performing improved measurements of water vapor in the upper troposphere and lower stratosphere using direct absorption spectroscopy and comparing the results to other instruments [34] to understand discrepancies and measurements of spectral parameters of water-vapor transitions [35,36,37].
In this paper, we report improved and metrology-compatible collisional line data (i.e., self- and air broadening coefficients and their temperature dependence exponents) for the H2O line at 7299.43 cm−1 (000–101, 110–211) often used in atmospheric H2O measurements [3,5,6,8,9,11,12,13,14,15,16]. A laser spectroscopic system for measurements of H2O self-broadening coefficient and temperature dependences is presented, specially designed to address the difficulties in preparing and handling pure water vapor samples at between room temperature and 100 °C where the exponential dependence of the water vapor saturation pressure on temperature makes it difficult to study self-broadening. For air broadening and temperature dependence measurements, separate gas cells (and thus modified spectroscopic systems) are used.

2. H2O Collisional Broadening Measurements

The collisionally broadened line width (Lorentzian full width at half maximum, FWHM) of a molecular transition for a multicomponent gas mixture is typically expressed as
Δ v L = 2 · p self · γ self · T 0 T n s   + 2 · f p f · γ f · T 0 T n f
where the quantity pself is the partial pressure of the analyte molecule, i.e., here, water vapor (H2O), and pf is the partial pressure of the collision partner (foreign molecule, e.g., air). The reference temperature T0 to describe the temperature dependence is set to 296 K (e.g., in databases like HITRAN [26] or GEISA [27]). The quantities γself, γf, ns and nf are the self-broadening, foreign broadening coefficients and the temperature exponents of the self- and foreign broadening coefficient, respectively [10].

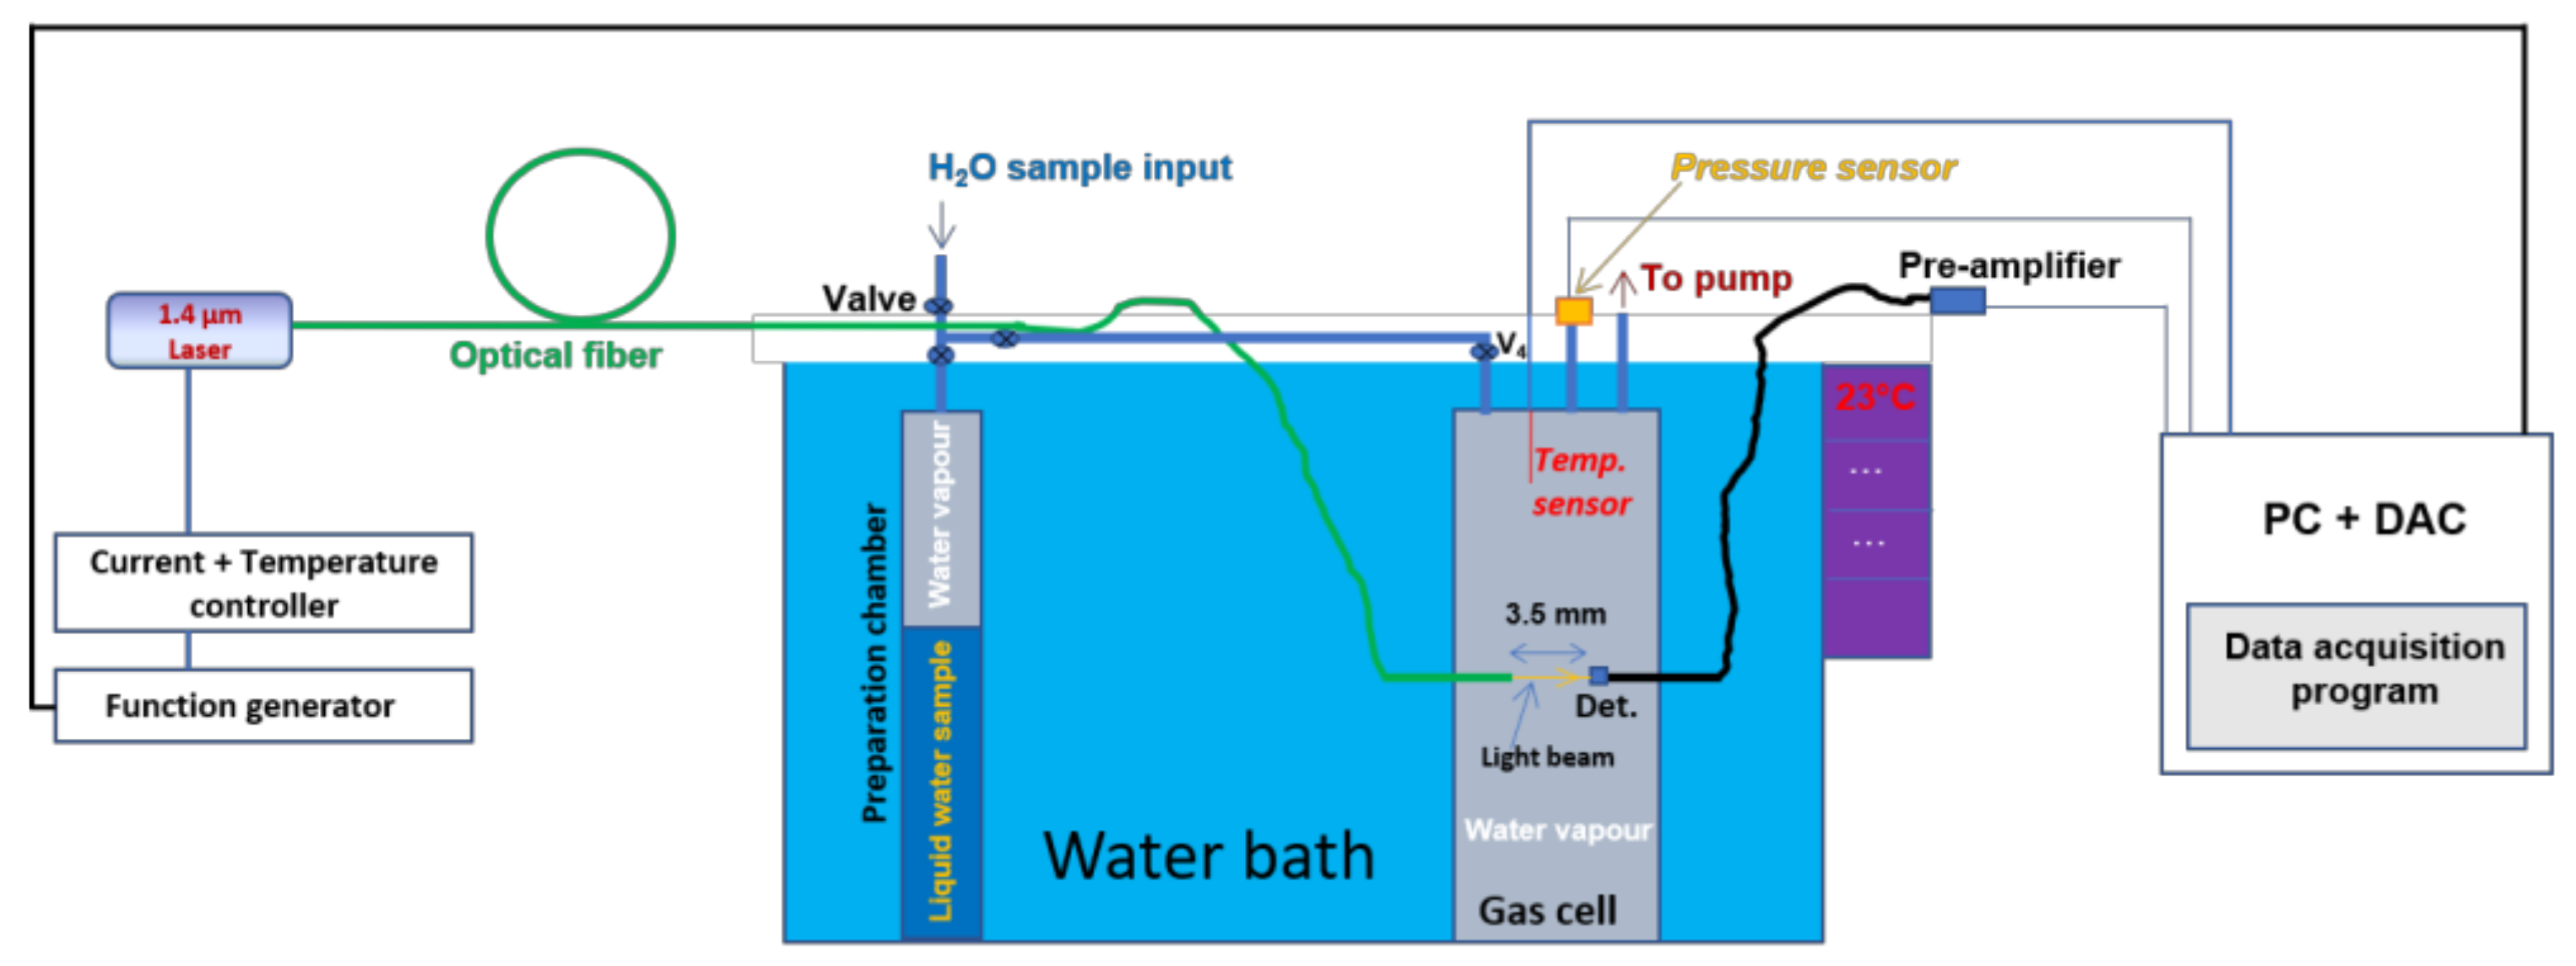
2.1. Setup for H2O Self-Broadening and Temperature Dependence at 1.37 µm

Figure 1 depicts the experimental setup employed in the H2O self-broadening measurements. The setup in Figure 1 consists of a dTDLAS spectrometer equipped with a DFB laser (manufacturer: NTT Electronics) emitting at about 1.37 µm, a water bath with a 14 L volume (whose temperature can be varied from 22–80 °C) and a stainless-steel gas cell with an optical path length of 3.5 mm. The water bath was used to ensure a high temperature stability of the gas cell, and by varying the water bath temperature, the gas temperature in the gas cell was also varied. The temperature stability of the water bath, at each temperature step, was found to be better than 90 mK (both horizontally and vertically).
For spectroscopic measurements, pure water vapor gas samples (from distilled water) were prepared (via evaporation from a preparation chamber as shown in Figure 1). The gas pressure stability 1σ, expressing the reproducibility, was typically better than 0.1 hPa. The measurements were performed in static conditions. The wavelength of the laser was continuously swept at 139.8 Hz across the probed H2O transition. As shown in Figure 1, the light from the laser was coupled into a single mode fiber, and subsequently passed through the absorbing medium (pure water vapor sample in the gas cell) and detected after a 3.5 mm absorption path with an InGaAs photodiode (Hamamatsu, Type: G8370-01, diameter = 1 mm). The light was emitted from the fiber as a cone with a full opening angle of <8 degrees. The light was deliberately not collimated to avoid the fringes typically generated by lenses and to achieve a sufficient signal to noise ratio and stability (1 × 10⁻⁴ cm−1) of the measured spectra. This was also possible and advisable due to the high output power (~32 mW) of the diode laser. The detector window was inclined against the light path in order to minimize feedback back into the fiber. Parasitic absorption in the laser head (observed to be in the ppm range [14]) was assumed to be insignificant for the measurements here, as the laser and fiber connectors, placed in a homemade enclosure, were purged with N2 at a constant flow rate.
The signal of the photodetector was pre-amplified with a low noise amplifier (Femto DLPCA 200), digitized by a data acquisition card (DAC, NI PCI-6289, 625 KS/s, 18 bit) and read in a personal computer (PC). An MKS pressure (resolution: 0.1 hPa) sensor and a PT100 (connected to the gas cell and in contact with the gas molecules: resolution of PT100 was 0.001 K) were employed to record the H2O vapor pressure and the gas temperature, respectively.

2.1.1. H2O Self-Broadening at 1.37µm

Typical spectra measured with the setup in Figure 1 are shown in Figure 2a. The absorbance data in Figure 2a were derived using measured H2O signals and a background 3rd order polynomial similar to [4,38]. It should be noted here that, for this work, we worked with a single path setup, i.e., there was no monitor detector recording the background signal. The background was reconstructed from the fit to the measured signal. This avoided the typical differential offsets in dual channel setups. The linear absolute wavenumber axis was restored via the dynamic tuning coefficients derived by means of signals measured with an air-spaced etalon similar to [4,18,22,38,39] and the H2O line position (~7299.432 cm−1) as an absolute wavelength reference point. The wavenumber axis was derived with a long-term repeatability uncertainty of 1% and a significantly higher precision, with this small deviation showing a good linearity. The retrieved FWHM of the fitted absorption line was influenced by the uncertainty of the wavenumber axis coefficient of 1% that was one part of the total uncertainty attributed to the Lorentzian FWHM. A Voigt profile was fitted to the data in order to derive the FWHM of the H2O line at 7299.43 cm−1. The fitting was performed with the line area kept free and a fixed Doppler width calculated using the measured gas temperature. It should be noted here that the flat residual structures (e.g., in Figure 2a) in this work show that the Voigt profile was appropriate to fit all data, and indicate that there was no need to use higher order line profiles like Galatry or Hartmann–Tran [40,41,42]. The peak absorbance for the data in Figure 2a was 0.06. For the data in Figure 2a, we calculated a standard deviation noise level from the residuals as σtotal = 7 × 10⁻⁴ (see bottom panel of Figure 2a), corresponding to a signal to noise ratio of 85. Employing the σlocal = 5 × 10⁻⁴ value, an optimal signal to noise ratio of 120 was reached for the H2O self-broadening measurements.
From Equation (1), and for self-broadening exclusively, there is no foreign molecule in the H2O sample, and the Lorentzian FWHM at the gas temperature T = 296 K can be expressed as
Δ v L = 2 · p H 2 O · γ H 2 O
The bottom panel of Figure 2b depicts a plot of the Lorentzian FWHM (y-axis, left), derived from consecutive measurements similar to the data in Figure 2a as the gas pressure in the cell was varied (the gas temperature maintained at 296 K) by means of the valve V4 (filling the gas cell in steps by slowly opening the valve) in Figure 1, as a function of the measurement number. The top panel of Figure 2b shows the measured gas temperature (the gas temperature was kept constant at 296 K (1σ = 32 mK)) across all measurements.
The right y-axis of Figure 2b shows the gas pressure measured at different values of the FWHM. As indicated by the dotted red boxes, 50 consecutive measurements were used to determine the repeatability (calculated as the standard deviation of the mean) of the measured Lorentzian width of 5.66 × 10⁻⁵ cm−1, i.e., 0.46% at, e.g., the FWHM of 0.012391 cm−1. We note here that the relative uncertainty from fitting to derive the Lorentzian FWHM was estimated to be 1.1%. This value was calculated from the statistical uncertainty (repeatability: 0.46%) and the uncertainty of 1% (estimated here based on our experiences [9,18]) due to lack of knowledge on the accuracy of the Voigt profile to fit H2O spectra as observed in [43]. This uncertainty component (1.1%) combined with the uncertainty of the wavenumber axis (1%, similar to [18]) was used to evaluate the combined uncertainty of the retrieved Lorentzian FWHM of 1.5% (relative). The red boxes (at the end of the measurement step where the highest temporal stability is found) show the regions where the analysis of the FWHM was performed at the different gas pressures (repeatability of the measured H2O pressure was 0.007 hPa, i.e., 0.09% at the lowest gas pressure of 8 hPa) shown on the y-axis (right). A check of the Lorentzian width versus line area showed no significant systematic effects due to absorption/desorption. The absorption/desorption effects are folded into the repeatability of the FWHM measurements.
Figure 3 shows the Lorentzian FWHM (derived from the data in Figure 2b, bottom panel) for pure self-broadening as a function of the H2O pressure pH2O. The uncertainties (error bars) of the Lorentzian FWHM and pH2O are 1.5% relative (as presented, estimated taking into account the repeatability of the measurements, fitting and the uncertainty of the wavenumber axis estimated similar to [7]) and 1.2% relative at 28.6 hPa, respectively. The uncertainties of the measured gas pressure were estimated considering the repeatability of the measurements and the respective uncertainties (derived using the calibration certificate) at the different pressure points. A generalized linear regression (GLR) was applied to the data in Figure 3 in order to derive the self-broadening coefficient for the H2O absorption line at 7299.43 cm−1. The GLR was performed using B_Least software promoted by ISO standard 6143 [44]. From the GLR in Figure 3, a self-broadening coefficient ƳH2O (evaluated from the slope, according to Equation (2)) of (4.243 ± 0.118)·10−4 cm−1/hPa was derived at (296 ± 1) K, corresponding to (0.430 ± 0.012) cm−1/atm, k = 1. The combined uncertainty of the self-broadening coefficient was 0.012 cm−1/atm (2.8% relative, k = 1). The quantity k is a coverage factor [28]. In this work, the units cm−1/atm were used in order to compare the results to those reported in the HITRAN database [26].

2.1.2. Temperature Dependence of H2O Self-Broadening

The temperature of the water bath (and thus the gas cell as measured by the PT100 in Figure 1) was varied from 296–348 K, while the preparation chamber (with the water sample) was connected to the gas cell (V4 opened). As the temperature of the gas cell and the H2O gas increased, the H2O pressure correspondingly increased from 26 hPa to 230 hPa and was recorded by the pressure sensor. Figure 4a depicts spectra (derived similarly as for Figure 2a) measured at the different temperatures and pressures, and showing the increased self-broadening of the H2O absorption line. A Voigt profile was fitted (in the same manner as in Figure 2a) to the data in Figure 4a in order to derive the Lorentzian FWHM. The bottom panel of Figure 4a depicts the residuals from a Voigt fit. Using the peak absorbance of 0.07 and 1 × total = 1·10−3, a signal to noise (S/N) ratio of 70 was found for the data in Figure 4a. Employing 1σLocal = 5 × 10⁻⁴ from the bottom panel of Figure 4a, an optimum S/N of 140 ould be reached for the measurements.
Considering the first term of Equation (1), the temperature dependence exponent nH2O can be derived from the following expression:
ln Δ v L 2 · γ H 2 O · p H 2 O = n H 2 O · ln T 0 T
Figure 4b shows a plot of ln Δ v L / 2 · γ H 2 O · p H 2 O as a function of ln T 0 / T . The uncertainties on both axes were estimated using the respective uncertainties of Δ v L , γ H 2 O ,   p H 2 O and T , i.e., 1.5 %, 2.8 %, 1.2 % at 28.6 hPa and 0.5 % relative, respectively. A GLR was applied to the data in Figure 4b, resulting in a slope value of ns = nH20 of 0.692 ± 0.011, k = 1, for the H2O absorption line at 7299.43 cm−1. The uncertainty of 0.017 corresponds to 1.6% relative. The bottom panel of Figure 4b depicts the residuals from the GLR and the top panel the measured gas temperature at the respective measurement points.

2.2. H2O Air Broadening and Temperature Dependence at 1.37 µm

2.2.1. H2O Air Broadening

For the air broadening measurements, the water bath was removed and the gas cell in Figure 1 was replaced with a gas cell with an optical path length of 20 cm. For the spectroscopic measurements using this new setup and probing the H2O line at 7299.43 cm−1, a H2O sample was prepared in the gas cell by manometric mixing, and after equilibration, the total gas pressure (stability: better than 0.1 hPa) was increased in steps (while measuring the absorption signals and recording the total gas pressure and gas temperature) by adding air into the gas cell. The uncertainty of the air pressure was 0.2% relative.
With knowledge of γH2O and nH2O, and using Equation (1), the H2O air broadening coefficient at gas temperature T can be derived using Equation (4),
Δ v L 2 · p H 2 O · γ H 2 O · T 0 T n H 2 O = 2 · γ a i r · p a i r
Figure 5 depicts Δ v L 2 · p H 2 O · γ H 2 O · T 0 / T n H 2 O as a function of 2 · p a i r . The H2O partial pressure pH2O was determined using the H2O amount fraction derived from the measured TDLAS spectra similar to [7] and employing the line strength value for the H2O line at 7299.43 cm−1 derived in a separate experiment [18]. A GLR was applied (with uncertainties in the x- and y-axis, estimated as being the uncertainties of the respective quantities) to the data in Figure 5, resulting in the slope value γair of (0.1034 ± 0.0017) cm−1/atm at (295.04 ± 1) K. The uncertainty 0.00168 cm−1/atm of the air broadening coefficients correspond to a relative uncertainty of 1.6 % (k = 1).

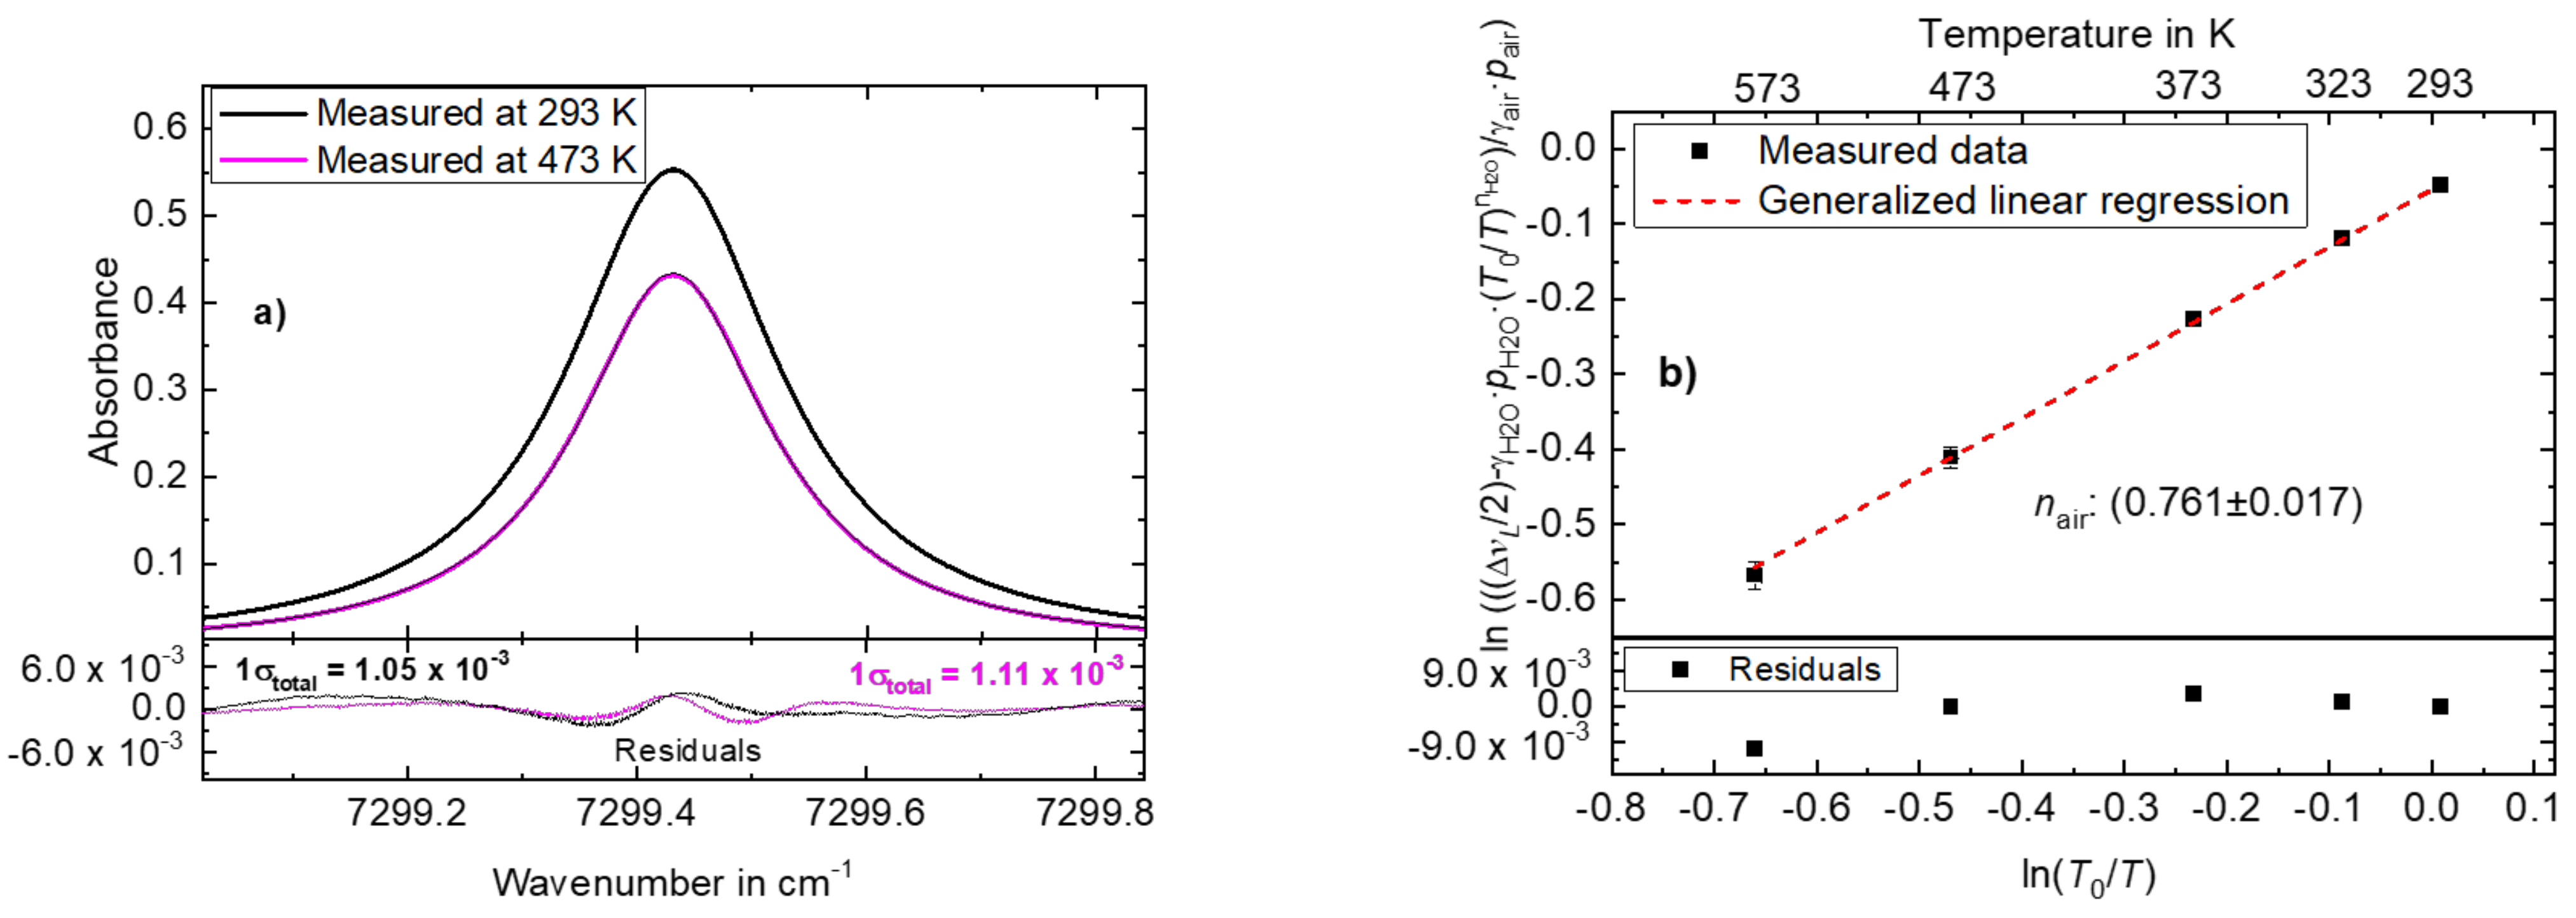
2.2.2. Temperature Dependence of H2O Air Broadening

In order to derive the temperature dependence coefficient of air broadening, the 20 cm gas cell was replaced by a heatable 38 cm single-pass gas cell (SITEC) with the cell body temperature sensor and the static/no flow pressure sensor directly connected to the gas cell. Due to the design and position of the pressure sensor, and similarly as for other experiments in this work, it was assumed that there was no pressure drop between the sensor and the gas cell. The temperature stability and gradient across the gas cell were better than 0.5 K and about 2 K. For the temperature dependence measurements using this spectroscopic system and also probing the H2O line at 7299.43 cm−1, a µmol/mol-level H2O in air mixture was prepared by manometric mixing in the 38 cm gas cell and the temperature of the gas cell (and thus the gas temperature) was varied from 290–600 K.
Figure 6a depicts typical absorbance data (derived similarly as for Figure 2a, measured at 293 K and 473 K, 100 averaged scans) for the temperature dependence measurements of air broadening. The data were fitted with a Voigt profile, similar to Figure 2a, to derive the Lorentzian FWHM ( Δ v L ) . The bottom panel of Figure 6a shows the residuals from the Voigt fit with 1σtotal = 1.05 × 10⁻³ and 1σtotal = 1.11 × 10⁻³ for the data at 293 K and 473 K, respectively. Using the residuals from the fits and the respective peak absorbances of 0.55 (at 293 K) and 0.43 (at 473 K), S/N values of 523 and 387 were found, respectively. The residual structures in Figure 6a are observed to be a result of the possible systematic deficiencies of the Voigt profile to model higher order line shape contributions like the Hartmann–Tran profile [40,41,42]. This is accounted for by the uncertainty of 1% attributed to the use of this line profile.
With the measured values of γH2O (at (296.00 ± 1.00) K), nH2O and γair (at (295.04 ± 1.00) K, covering the temperature of 296 K), and utilizing Equation (1), the temperature dependence exponent nair can be derived by means of Equation (5),
ln Δ v L / 2 γ H 2 O · p H 2 O · ( T 0 / T ) n H 2 O γ air · p air = n air · ln T 0 T  
Figure 6b depicts a plot of measured ln ( Δ v L / 2 γ H 2 O · p H 2 O · T 0 / T ) n H 2 O / γ air · p air as a function of ln T 0 / T . A GLR was applied to the data in Figure 6b, with the slope value of 0.761 ± 0.017 taken as the temperature dependence coefficient of air broadening nair. The combined uncertainty of 0.017 corresponds to a relative uncertainty of 2.2%, k = 1.

3. Discussion

The self- and air collisional broadening coefficients for the H2O absorption line at 7299.43 cm−1 have been measured employing direct tunable diode laser absorption spectroscopy (dTDLAS). Table 1 shows a summary of the collisional broadening coefficients and their respective temperature dependence exponent. As shown in Table 1, the parameters measured in this work for the H2O absorption line at 7299.43 cm1 agree within the reported uncertainties in the HITRAN 2020 database [26]. Compared to the uncertainties reported for the HITRAN 2020 data, an improvement (in the uncertainties of the line parameters reported in this work) by a factor of about 4, 1.3 and 4.4 has been reached for the self-broadening coefficient, the air broadening coefficient and the temperature dependence exponent coefficient for air broadening, respectively (see Table 1). The air broadening coefficient in this work also agrees with that in our previous work [9]. For the temperature exponent of self-broadening, no values are reported in HITRAN [26], and therefore no value from HITRAN is registered in Table 1. The relative deviation (well within the reported uncertainties for the HITRAN values) of the respective line data parameters are shown in the last row of Table 1. The results of this work in Table 1 were also compared to data in the GEISA database [27], resulting in similar relative deviations as for HITRAN [26], as shown in the last row of Table 1.
The uncertainties of the results in this work were calculated applying GUM [28] principles and employing the GUM workbench software [46]. To demonstrate, Table 2 shows an example uncertainty budget (single pressure point from Figure 3) for the self-broadening coefficient γH2O, showing the different input parameters (most significant quantities), values, standard uncertainties, relative standard uncertainties and relative contribution (index value [46]) of the uncertainties to the final uncertainty of γH2O, and the combined relative uncertainty (2.0 %) of the measured self-broadening coefficient. As shown in Table 2, the relative uncertainties of pH2O and Δ v L are 1.2% and 1.5%, respectively, with corresponding relative contributions of 39% and 61%, respectively. Thus, the 61% relative contribution here shows that Δ v L contributes the most to the combined uncertainty of γH2O. The uncertainty budget for the heated cell measurements (nair) is similar to Table 2. The relative uncertainties of the parameters (according to Equation (5)) Δ v L , pH2O, pair and T are 1.5% at 0.00269 cm−1, 1.7% at 46.4 hPa, 1.1% at 1107.4 hPa and 0.52% at 573.15 K, respectively. It should be noted here that, similarly as for γH2O, uncertainty budgets for nH2O, γair and nair also revealed that, except for nH2O, the uncertainty of Δ v L is the most significant source of uncertainty for the combined uncertainties of the measured line parameters. This indicates that, to further increase the line parameters’ accuracy (if at all required), future work should focus on reducing the uncertainty of Δ v L .
For data quality reasons, the results presented in this work do address the traceability to the international system of units (SI). The traceability of the results to the SI are addressed via the traceability of input parameters such as the measured gas temperature and pressure which are traceable to respective PTB standards. The work presents specific methods and analysis, especially for the self-broadening measurements, that can be taken up by the spectroscopy measurement communities in future works to measure H2O line data in an extended wavelength range.

4. Conclusions

For the accurate measurement of water self-broadening coefficients and their temperature dependence, we designed a new spectrometer, operating in a well-controlled environment (water bath) to achieve temperature stabilities better than 90 mK, and that is capable of measuring accurate and metrology-compatible self-broadening line data for H2O at 1.37 µm. The self-broadening coefficient of the H2O line at 7299.43 cm−1 and its temperature coefficient has been determined with GUM-compatible relative combined uncertainties of 2.8% and 1.6%, k = 1, respectively. With different gas cells in similar spectroscopic systems (without water immersion), the air broadening coefficient of the H2O line at 7299.43 cm−1 and its temperature coefficient have been determined with relative combined uncertainties of 1.6% and 2.2%, respectively. Compared to HITRAN 2020 data, significant improvements in the uncertainties by factors up to 4.4 have been achieved. The traceability of the results to the SI has been addressed via input parameters as the measured gas pressures and temperatures (that are traceable to respective PTB standards). The results presented in this work (uncertainties < 3%) are seen to already be fit for purpose in atmospheric H2O concentration measurements (employing the H2O line at 7299.43 cm−1) as well as H2O measurements in other applications covering the temperature range from 293 K to 573 K (extrapolations/usage outside this temperature range, e.g., down to 200 K, might be considered where appropriate) where absorption data have to be fitted with an appropriate line profile, e.g., a Voigt profile.

Author Contributions

Experiment concept: V.E. Experiment realization and data collection: J.A.N. Data evaluation and discussion: J.A.N. and V.E. Paper conceptualization writing—review and editing: J.A.N., O.W. and V.E. All authors have read and agreed to the published version of the manuscript.

Funding

Part of this work was supported via the EMRP ENV07 MeteoMet and ENV58 MeteoMet2 projects (https://www.meteomet.org/, accessed on the 29 April 2021). European Metrology Research Programme (EMRP) is jointly funded by the EMRP participating countries within EURAMET and the European Union.

Institutional Review Board Statement

Not applicable.

Informed Consent Statement

Not applicable.

Conflicts of Interest

The authors declare no conflict of interest.

References

  1. Fahey, D.W.; Gao1, R.-S.; Möhler, O.; Saathoff, H.; Schiller, C.; Ebert, V.; Krämer, M.; Peter, T.; Amarouche, N.; Avallone, L.M.; et al. The AquaVIT-1 intercomparison of atmospheric water vapor measurement techniques. Atmos. Meas. Tech. 2014, 7, 3177–3213. [Google Scholar] [CrossRef] [Green Version]
  2. Müller, R.; Kunz, A.; Hurst, D.F.; Rolf, C.; Krämer, M.; Riese, M. The need for accurate long-term measurements of water vapor in the upper troposphere and lower stratosphere with global coverage. Earths Future 2016, 4, 25–32. [Google Scholar] [CrossRef] [Green Version]
  3. Buchholz, B.; Böse, N.; Ebert, V. Absolute validation of a diode laser hygrometer via intercomparison with the German national primary water vapor standard. Appl. Phys. B 2014, 116, 883–899. [Google Scholar] [CrossRef]
  4. Pogany, A.; Wagner, S.; Werhahn, O.; Ebert, V. Development and Metrological Characterization of a Tunable Diode Laser Absorption Spectroscopy (TDLAS) Spectrometer for Simultaneous Absolute Measurement of Carbon Dioxide and Water Vapor. Appl. Spectrosc. 2015, 69, 257–268. [Google Scholar] [CrossRef]
  5. Buchholz, B.; Kühnreich, B.; Smit, H.G.J.; Ebert, V. Validation of an extractive, airborne, compact TDL spectrometer for atmospheric humidity sensing by blind intercomparison. Appl. Phys. B 2013, 110, 249–262. [Google Scholar] [CrossRef] [Green Version]
  6. Witzel, O.; Klein, A.; Meffert, C.; Wagner, S.; Kaiser, S.; Schulz, C.; Ebert, V. VCSEL-based, high-speed, in situ TDLAS for in-cylinder water vapor measurements in IC engines. Opt. Express 2013, 21, 19951. [Google Scholar] [CrossRef] [PubMed]
  7. Nwaboh, J.A.; Pratzler, S.; Werhahn, O.; Ebert, V. Tunable Diode Laser Absorption Spectroscopy Sensor for Calibration Free Humidity Measurements in Pure Methane and Low CO2 Natural Gas. Appl. Spectrosc. 2017, 71, 888–900. [Google Scholar] [CrossRef] [PubMed]
  8. Gurlit, W.; Zimmermann, R.; Giesemann, C.; Fernholz, T.; Ebert, V.; Wolfrum, J.; Platt, U.; Burrows, J.P. Lightweight diode laser spectrometer CHILD (Compact High-altitude In-situ Laser Diode) for balloonborne measurements of water vapor and methane. Appl. Opt. 2005, 44, 91–102. [Google Scholar] [CrossRef] [PubMed]
  9. Buchholz, B.; Afchine, A.; Ebert, V. Rapid, optical measurement of the atmospheric pressure on a fast research aircraft using open-path TDLAS. Atmos. Meas. Tech. 2014, 7, 3653–3666. [Google Scholar] [CrossRef] [Green Version]
  10. Nwaboh, J.A.; Werhahn, O.; Ebert, V. Line strength and collisional broadening coefficients of H2O at 2.7 μm for natural gas quality assurance applications. Mol. Phys. 2014, 112, 2451–2461. [Google Scholar] [CrossRef]
  11. Buchholz, B.; Kallweit, S.; Ebert, V. SEALDH-II—An Autonomous, Holistically Controlled, First Principles TDLAS Hygrometer for Field and Airborne Applications: Design–Setup–Accuracy/Stability Stress Test. Sensors 2017, 17, 68. [Google Scholar] [CrossRef]
  12. Hunsmann, S.; Wunderle, K.; Wagner, S.; Rascher, U.; Schurr, U.; Ebert, V. Absolute, high resolution water transpiration rate measurements on single plant leaves via tunable diode laser absorption spectroscopy (TDLAS) at 1.37 μm. Appl. Phys. B 2008, 92, 393–401. [Google Scholar] [CrossRef]
  13. Ebert, V.; Teichert, H.; Giesemann, C.; Saathoff, H.; Schurath, U. Fasergekoppeltes In-situ-Laserspektrometer für den selektiven Nachweis von Wasserdampfspuren bis in den ppb-Bereich (Fibre-Coupled In-situ Laser Absorption Spectrometer for the Selective Detection of Water Vapour Traces down to the ppb-Level). Tech. Mess. 2005, 72, 23–30. [Google Scholar] [CrossRef]
  14. Buchholz, B.; Ebert, V. Absolute, pressure-dependent validation of a calibration-free, airborne laser hygrometer transfer standard (SEALDH-II) from 5 to 1200 ppmv using a metrological humidity generator. Atmos. Meas. Tech. 2018, 11, 459–471. [Google Scholar] [CrossRef] [Green Version]
  15. Seidel, A.; Wagner, S.; Dreizler, A.; Ebert, V. Robust, spatially scanning, open-path TDLAS hygrometer using retro-reflective foils for fast tomographic 2-D water vapor concentration field measurements. Atmos. Meas. Tech. 2015, 8, 2061–2068. [Google Scholar] [CrossRef] [Green Version]
  16. Teichert, H.; Fernholz, T.; Ebert, V. Simultaneous in situ measurement of CO, H2O, and gas temperatures in a full-sized coal-fired power plant by near-infrared diode lasers. Appl. Opt. 2003, 42, 2043–2051. [Google Scholar] [CrossRef] [Green Version]
  17. Wunderle, K.; Fernholz, T.; Ebert, V. Selection of optimal absorption lines for tunable laser absorption spectrometers. In VDI Berichte; VDI: Düsseldorf, Germany, 2006; pp. 137–148. [Google Scholar]
  18. Pogány, A.; Klein, A.; Ebert, V. Measurement of water vapor line strengths in the 1.4–2.7µm range by tunable diode laser absorption spectroscopy. J. Quant. Spectrosc. Radiat. Transf. 2015, 165, 108–122. [Google Scholar] [CrossRef]
  19. Pogany, A.; Ott, O.; Werhahn, O.; Ebert, V. Towards traceability in CO2 line strength measurements by TDLAS at 2.7 µm. J. Quant. Spectrosc. Radiat. Transf. 2013, 130, 147–157. [Google Scholar] [CrossRef]
  20. Werwein, V.; Brunzendorf, J.; Serdyukov, A.; Werhahn, O.; Ebert, V. First measurements of nitrous oxide self-broadening and self-shift coefficients in the 0002-0000 band at 2.26 μm using high resolution Fourier transform spectroscopy. J. Mol. Spectrosc. 2016, 323, 28–42. [Google Scholar] [CrossRef] [Green Version]
  21. Padilla-Viquez, G.J.; Koelliker-Delgado, J.; Werhahn, O.; Jousten, K.; Schiel, D. Traceable CO2-R(12) line intensity for laser-spectroscopy-based gas analysis near 2 µm. IEEE Trans. Instrum. Meas. J. 2007, 56, 529–533. [Google Scholar] [CrossRef]
  22. Nwaboh, J.A.; Qu, Z.; Werhahn, O.; Ebert, V. Interband cascade laser-based optical transfer standard for atmospheric carbon monoxide measurements. Appl. Opt. 2017, 56, E84–E93. [Google Scholar] [CrossRef]
  23. Nwaboh, J.A.; Persijn, S.; Arrhenius, K.; Bohlén, H.; Werhahn, O.; Ebert, V. Metrological quantification of CO in biogas using laser absorption spectroscopy and gas chromatography. Meas. Sci. Technol. 2018, 29, 095010. [Google Scholar] [CrossRef]
  24. Nwaboh, J.A.; Meuzelaar, H.; Liu, J.; Persijn, S.; Li, J.; van der Veen, A.M.H.; Chatellier, N.; Papin, A.; Qu, Z.; Werhahn, O.; et al. Accurate analysis of HCl in biomethane using laser absorption spectroscopy and ion-exchange chromatography. Analyst 2021, 146, 1402. [Google Scholar] [CrossRef]
  25. Werhahn, O.; Petersen, J.C. (Eds.) TILSAM Technical Protocol V1_2010-09-29. 2010. Available online: http://www.euramet.org/fileadmin/docs/projects/934_METCHEM_Interim_Report.pdf (accessed on 29 April 2021).
  26. HITRAN Database. Available online: https://hitran.org/ (accessed on 29 April 2021).
  27. Jacquinet-Husson, N.; Scott, N.A.; Chédin, A.; Crépeau, L.; Armante, R.; Capelle, V.; Orphal, J.; Coustenis, A.; Boonne, C.; Poulet-Crovisier, N.; et al. The GEISA spectroscopic database: Current and future archive for Earth and planetary atmosphere studies. J. Quant. Spectrosc. Radiat. Transf. 2008, 109, 1043. [Google Scholar] [CrossRef]
  28. ISO. ISO Guide 98-3, Guide to the Expression of Uncertainty in Measurement; International Organization for Standardization: Geneva, Switzerland, 2008; ISBN 9267101889. [Google Scholar]
  29. Rothman, L.S.; Jacquinet-Husson, N.; Boulet, C.; Perrin, A.M. History and future of the molecular spectroscopic databases. Comptes Rendus Phys. 2005, 6, 897–907. [Google Scholar] [CrossRef]
  30. Abe, H.; Yamada, K.M.T. Performance evaluation of a trace-moisture analyzer based on cavity ring-down spectroscopy: Direct comparison with the NMIJ trace-moisture standard. Sens. Actuators A Phys. 2011, 165, 230–238. [Google Scholar] [CrossRef]
  31. Fasci, E.; Dinesan, H.; Moretti, L.; Merlone, A.; Castrillo, A.; Gianfrani, L. Dual-laser frequency-stabilized cavity ring-down spectroscopy for water vapor density measurements. Metrologia 2018, 55, 662–669. [Google Scholar] [CrossRef]
  32. Hodges, J.T.; Lisak, D. Frequency-stabilized cavity ring-down spectrometer for high-sensitivity measurements of water vapor concentration. Appl. Phys. B 2006, 85, 375–382. [Google Scholar] [CrossRef]
  33. Cai, T.; Wang, G.; Jia, H.; Chen, W.; Gao, X. Temperature and water concentration measurements in combustion gases using a DFB diode laser at 1.4 μm. Laser Phys. 2008, 18, 1133. [Google Scholar] [CrossRef]
  34. Sargent, M.R.; Sayres, D.S.; Smith, J.B.; Witinski, M.; Allen, N.T.; Demusz, J.N.; Rivero, M.; Tuozzolo, C.; Anderson, J.G. A new direct absorption tunable diode laser spectrometer for high precision measurement of water vapor in the upper troposphere and lower stratosphere. Rev. Sci. Instrum. 2013, 84, 074102. [Google Scholar] [CrossRef] [PubMed]
  35. Liu, X.; Jeffries, J.B.; Hanson, R.K. Measurements of spectral parameters of water-vapour transitions near 1388 and 1345 nm for accurate simulation of high-pressure absorption spectra. Meas. Sci. Technol. 2007, 18, 1185–1194. [Google Scholar] [CrossRef]
  36. Campargue, A.; Mikhailenko, S.N.; Vasilchenko, S.; Reynaud, C.; Béguier, S.; Čermák, P.; Mondelain, M.; Kassi, S.; Romanini, D. The absorption spectrum of water vapor in the 2.2 μm transparency window: High sensitivity measurements and spectroscopic database. J. Quant. Spectrosc. Radiat. Transf. 2017, 189, 407–416. [Google Scholar] [CrossRef] [Green Version]
  37. Sironneau, V.T.; Hodges, J.T. Line shapes, positions and intensities of water transitions near 1.28 μm. J. Quant. Spectrosc. Radiat. Transf. 2015, 152, 1–15. [Google Scholar] [CrossRef]
  38. Klein, A.; Ebert, V. Dual fiber-coupled laser hygrometer for fast in-situ gas analysis with minimized absorption path length. In Proceedings of the 58th Ilmenau Scientific Colloquium, Ilmenau, Germany, 8–12 September 2014. [Google Scholar]
  39. Nwaboh, J.A.; Werhahn, O.; Ortwein, P.; Schiel, D.; Ebert, V. Laser-spectrometric gas analysis: CO2–TDLAS at 2 µm. Meas. Sci. Technol. 2013, 24, 015202. [Google Scholar] [CrossRef] [Green Version]
  40. Tennyson, J.; Bernath, P.F.; Campargue, A.; Császár, A.G.; Daumont, L.; Gamache, R.R.; Hodges, J.T.; Lisak, D.; Naumenko, O.V.; Rothman, L.S.; et al. Recommended isolated-line profile for representing high-resolution spectroscopic transitions (IUPAC Technical Report). Pure Appl. Chem. 2014, 86, 1931–1943. [Google Scholar] [CrossRef] [Green Version]
  41. Ngo, N.H.; Lisak, D.; Tran, H.; Hartmann, J.-M. An isolated line-shape model to go beyond the Voigt profile in spectroscopic databases and radiative transfer codes. J. Quant. Spectrosc. Radiat. Transf. 2013, 129, 89–100. [Google Scholar] [CrossRef]
  42. Ngo, N.H.; Lisak, D.; Tran, H.; Hartmann, J.-M. Erratum to “An isolated line-shape model to go beyond the Voigt profile in spectroscopic databases and radiative transfer codes [J. Quant. Spectrosc. Radiat. Transf. 2013, 129, 89–100]. J. Quant. Spectrosc. Radiat. Transf. 2014, 134, 105. [Google Scholar] [CrossRef]
  43. Goldenstein, C.S.; Hanson, R.K. Diode-laser measurements of linestrength and temperature-dependent lineshape parameters for H2O transitions near 1.4 μm using Voigt, Rautian, Galatry, and speed-dependent Voigt profiles’. J. Quant. Spectrosc. Radiat. Transf. 2015, 152, 127–139. [Google Scholar] [CrossRef]
  44. ISO. Gas Analysis—Comparison Methods for Determining and Checking the Composition of Calibration Gas Mixtures—ISO 6143:2001; International Organization for Standardization: Geneva, Switzerland, 2001. [Google Scholar]
  45. Birk, M.; Wagner, G. Temperature-dependent air broadening of water in the 1250–1750 cm−1 range. J. Quant. Spectrosc. Radiat. Transf. 2012, 113, 889–928. [Google Scholar] [CrossRef]
  46. Metrodata. GUM Workbench Professional Version 2.4 and GUM Workbench Manual for Version 2.4; Metrodata GmbH: Grenzach-Wyhlen, Germany. Available online: http://www.metrodata.de (accessed on 29 April 2021).
Figure 1. Schematic of the setup used for self-broadening measurements and temperature dependence. Det: detector.
Applsci 11 05341 g001
Figure 2. (a) Plot of measured—purely self-broadened—spectra of H2O at 296 K as a function of wavenumber. A Voigt profile is fitted to the data. Residuals of the Voigt fit are plotted in the bottom panel. (b) Bottom panel: Lorentzian width measured at different H2O pressures as a function of measurement number. The red dashed rectangular boxes represent the data region chosen for the determining of ƳH2O (repeatability—50 measurements: 0.6%, 0.05%). Top panel: The gas temperature over the entire measurement time.
Applsci 11 05341 g002
Figure 3. Measured Lorentzian FWHM of H2O versus measured water vapor pressure (pH2O). A generalized linear regression (GLR, solid blue line) was applied to the data. The bottom panel depicts the residuals from the GLR fit.
Applsci 11 05341 g003
Figure 4. H2O self-broadening measurements. (a) Plot of the measured absorbance data at different temperatures and pressures as a function of wavenumber. Voigt profiles (solid lines with different colors) are fitted to the measured data. Bottom panel: residuals from the different Voigt fits. (b) A GLR applied to ln ( Δ v L / 2 · γ H 2 O · p H 2 O versus ln ( T 0 / T ) to determine the temperature dependence exponent of self-broadening nH2O. Root mean square of the error (RMS error): 1.12 × 10⁻¹⁶. Top panel: measured gas temperature at the respective points.
Applsci 11 05341 g004
Figure 5. A GLR linear regression applied to measured data to determine the air broadening coefficient (γair) of the H2O line at 7299.43 cm−1 at (295.04 ± 1) K. RMS error: 1.04 × 10⁻¹⁶. The correlation coefficients between the x- and y-axis are assumed to be unity.
Applsci 11 05341 g005
Figure 6. (a) Temperature dependence exponent of air broadening: absorbance data at 293 K and 473 K. (b) A GLR linear regression applied to measured data to determine the temperature dependence coefficient of air broadening. RMS error: 1.30 × 10⁻¹⁶.
Applsci 11 05341 g006
Table 1. Self- and air broadening coefficients and respective temperature dependence coefficients for the H2O absorption line at 7299.43 cm1. For this comparison table, all uncertainties (urel) are expanded (k = 2), with k = 2 producing an interval with a level of confidence of 95% that the true value is included [28,39].
ParameterγH2O in cm−1/atmnH2Oγair in cm−1/atmnair
ValueurelValueurelValueurelValueurel
HITRAN20200.460±20%- 0.1032±4.0%0.730±19.2% *
This work0.430±5.6%0.692±3.2%0.1034±3.2%0.761± 4.4%
Improvement ~4× - ~1.3x ~4.4×
Rel. dev. to HITRAN2020−6.5%-0.2%4.2%
Rel. dev. to GEISA [27] +−6.5%-0.2%4.0
Note: The expanded uncertainty for the HITRAN2020 values are taken as the upper limit multiplied by a coverage. Factor of 2 assuming a normal distribution. RD: relative deviation of this work from HITRAN2020. * The average uncertainty of 0.07 taken according to HITRAN [26] and [45]. + Thus far, we could not find the associated uncertainties for the GEISA line data here.
Table 2. Uncertainty budget for the self-broadening coefficient γH2O in this work.
ParameterValueStandard UncertaintyRelative Standard Uncertainty (k = 1)Index (Individual Contribution)
Partial pressure of H2O (pH2O)28.6 hPa *0.34 hPa1.20%39%
Lorentzian line width ( Δ v L ) 0.024 cm−13.6 × 10⁻⁴ cm−11.50%61%
H2O self-broadening coefficient (γH2O)0.430 cm−1/atm 2.00% b
* 28.6 hPa = 0.02822 atm. b This corresponds to an expanded uncertainty of 4 % (k = 2).
Publisher’s Note: MDPI stays neutral with regard to jurisdictional claims in published maps and institutional affiliations.

