
Edge-Preserving Image Denoising Based on Lipschitz Estimation


Abstract
:1. Introduction
2. Method
Principle of the Method
3. Multi Scale Analysis Based Edge Detection
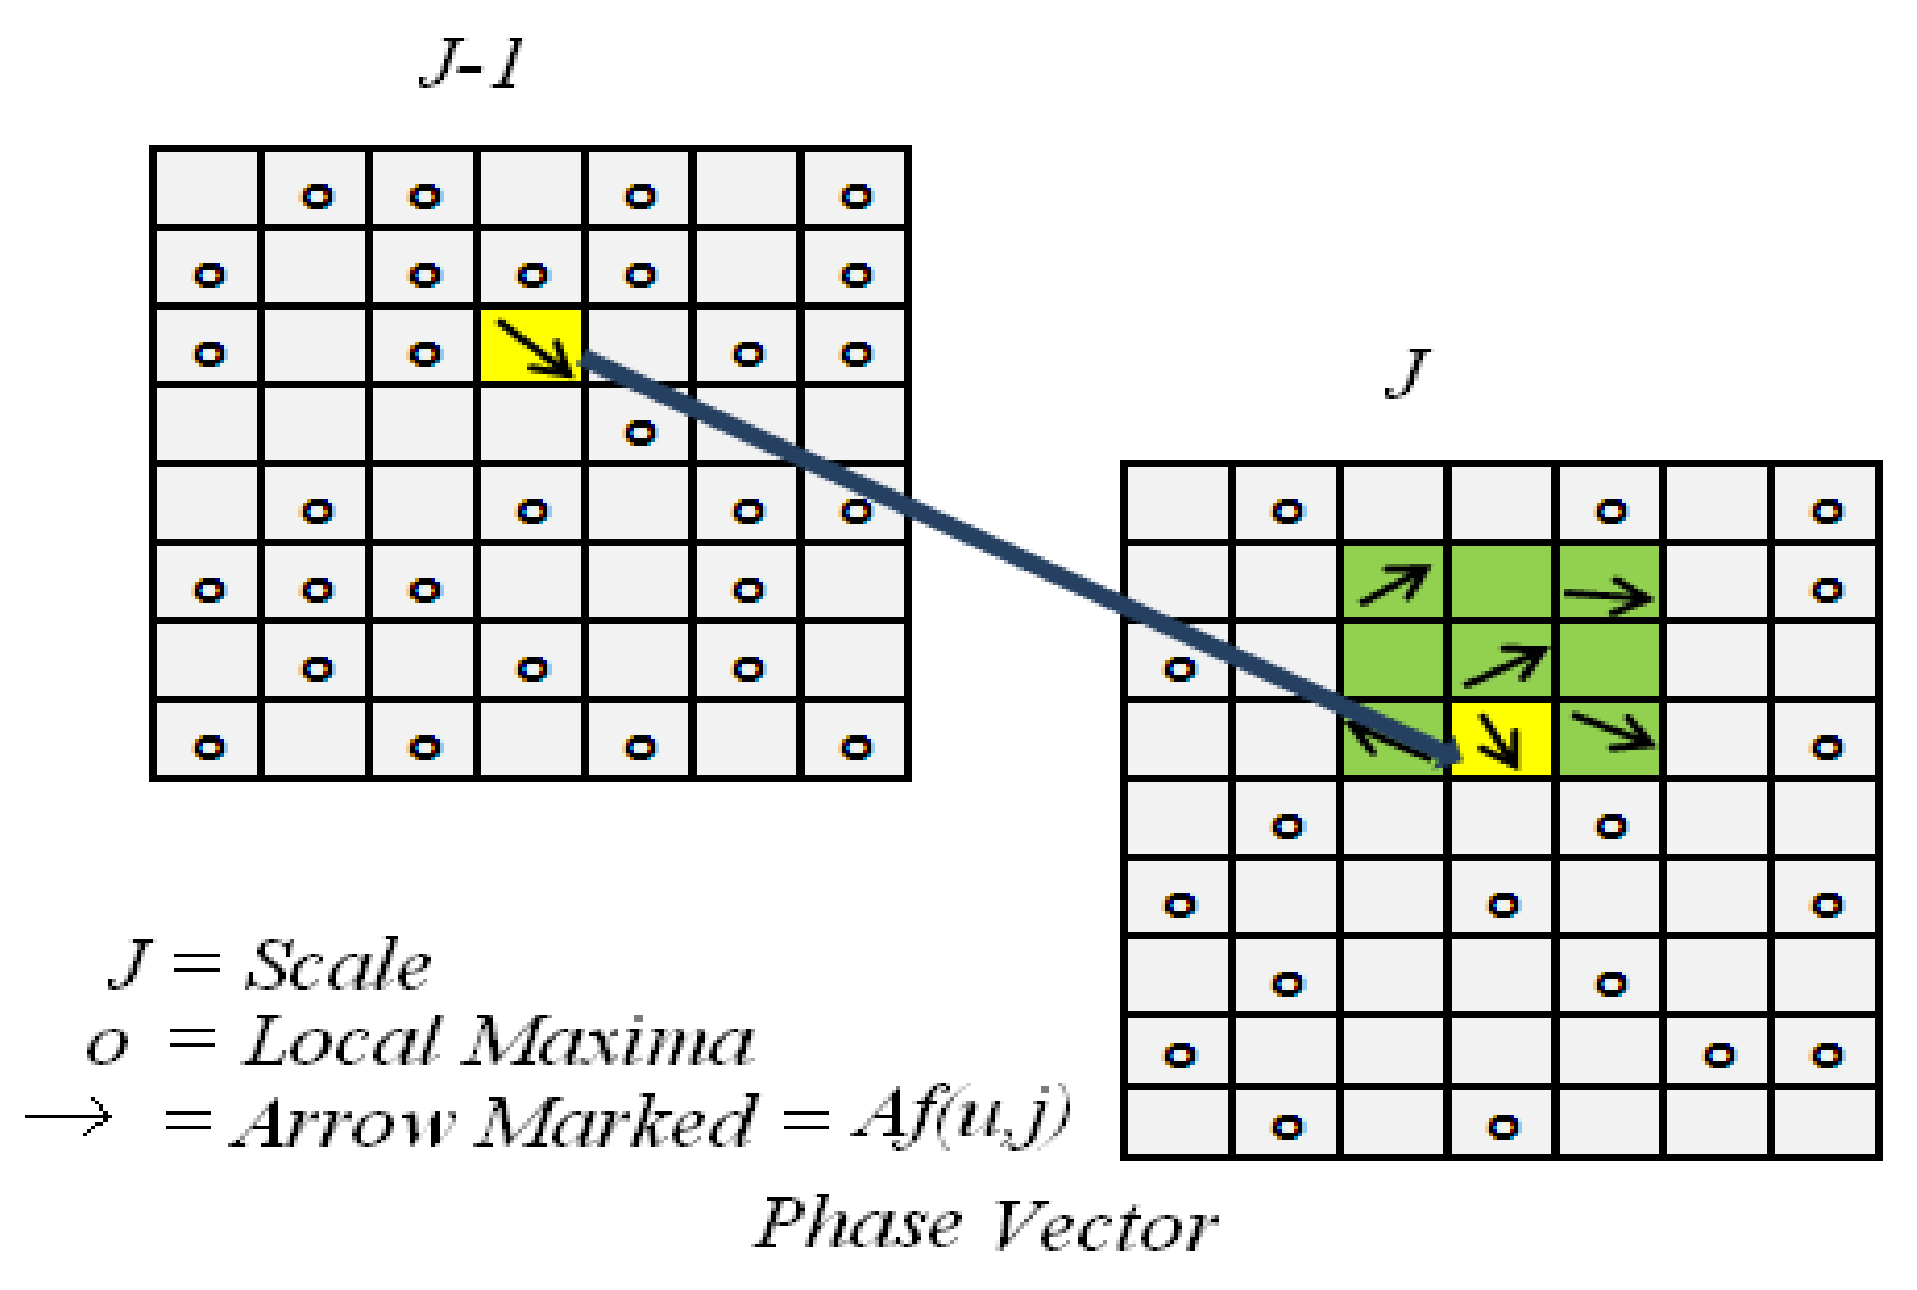
Local Maxima Extraction
4. Lipschitz Based Image Restoration
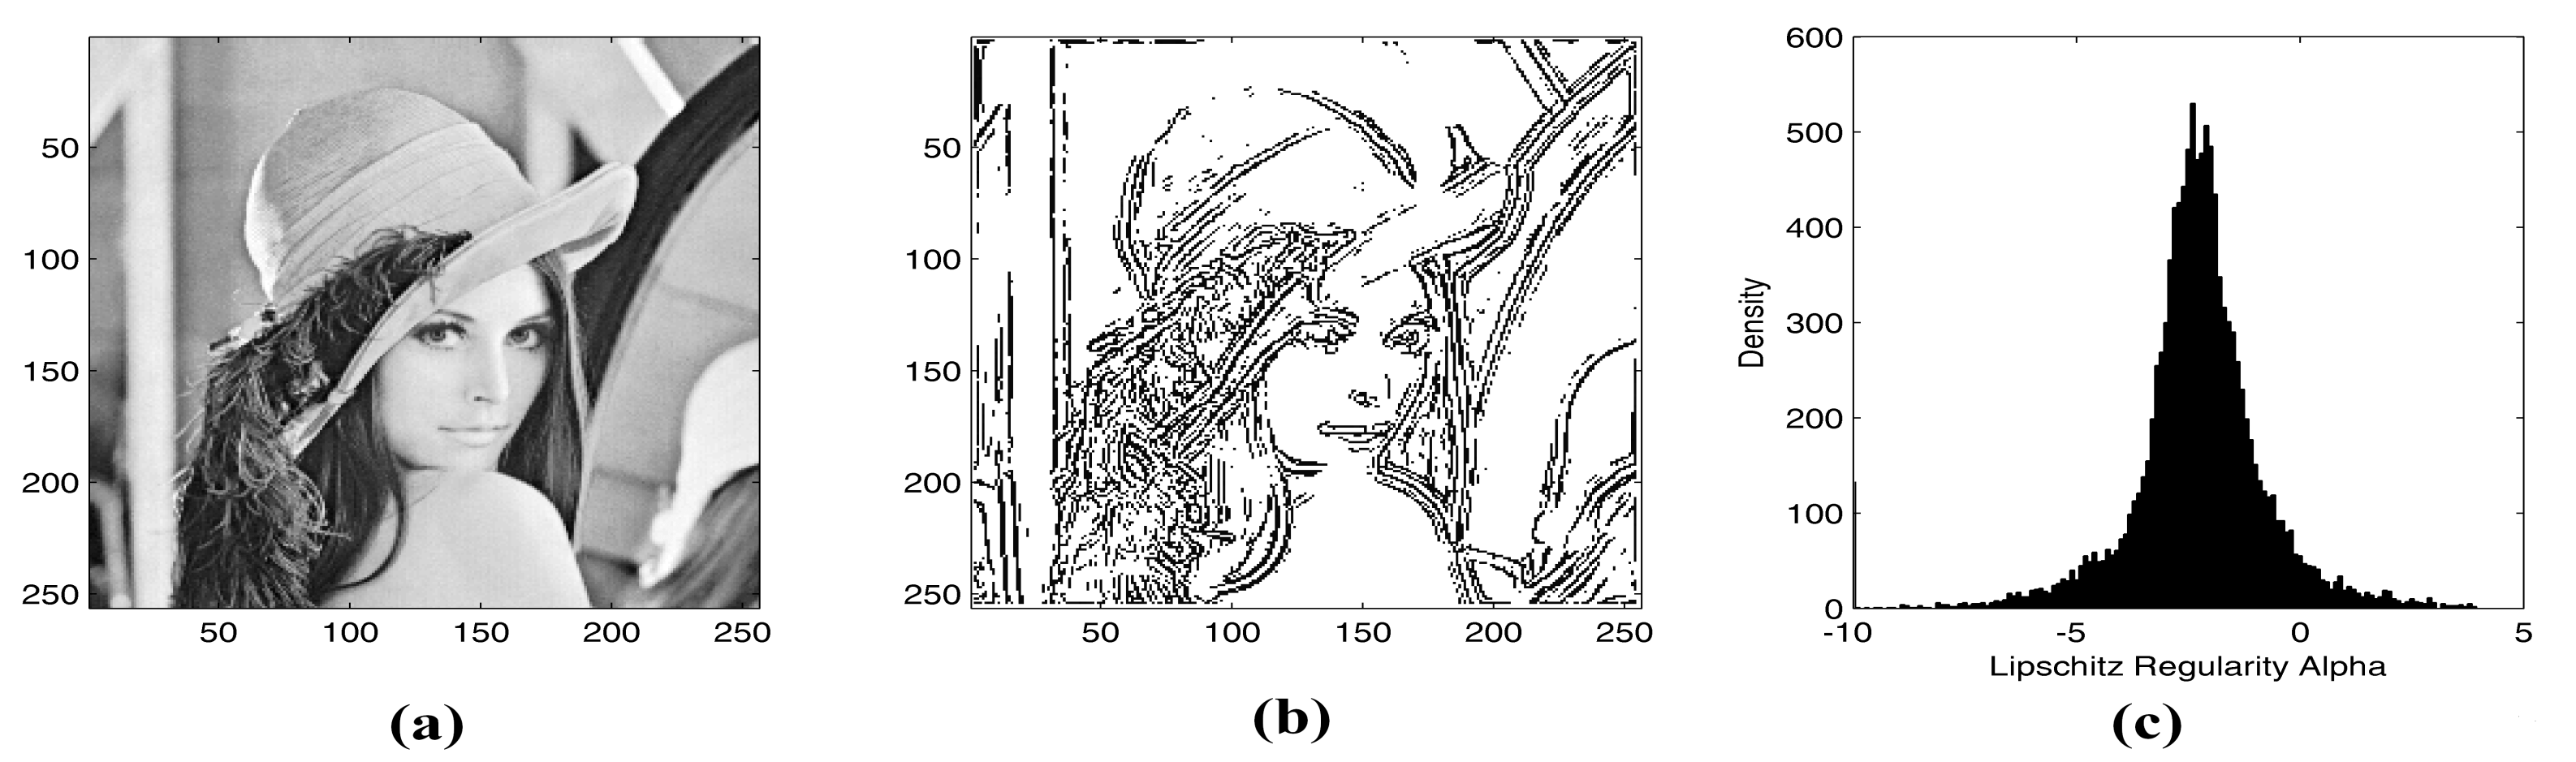
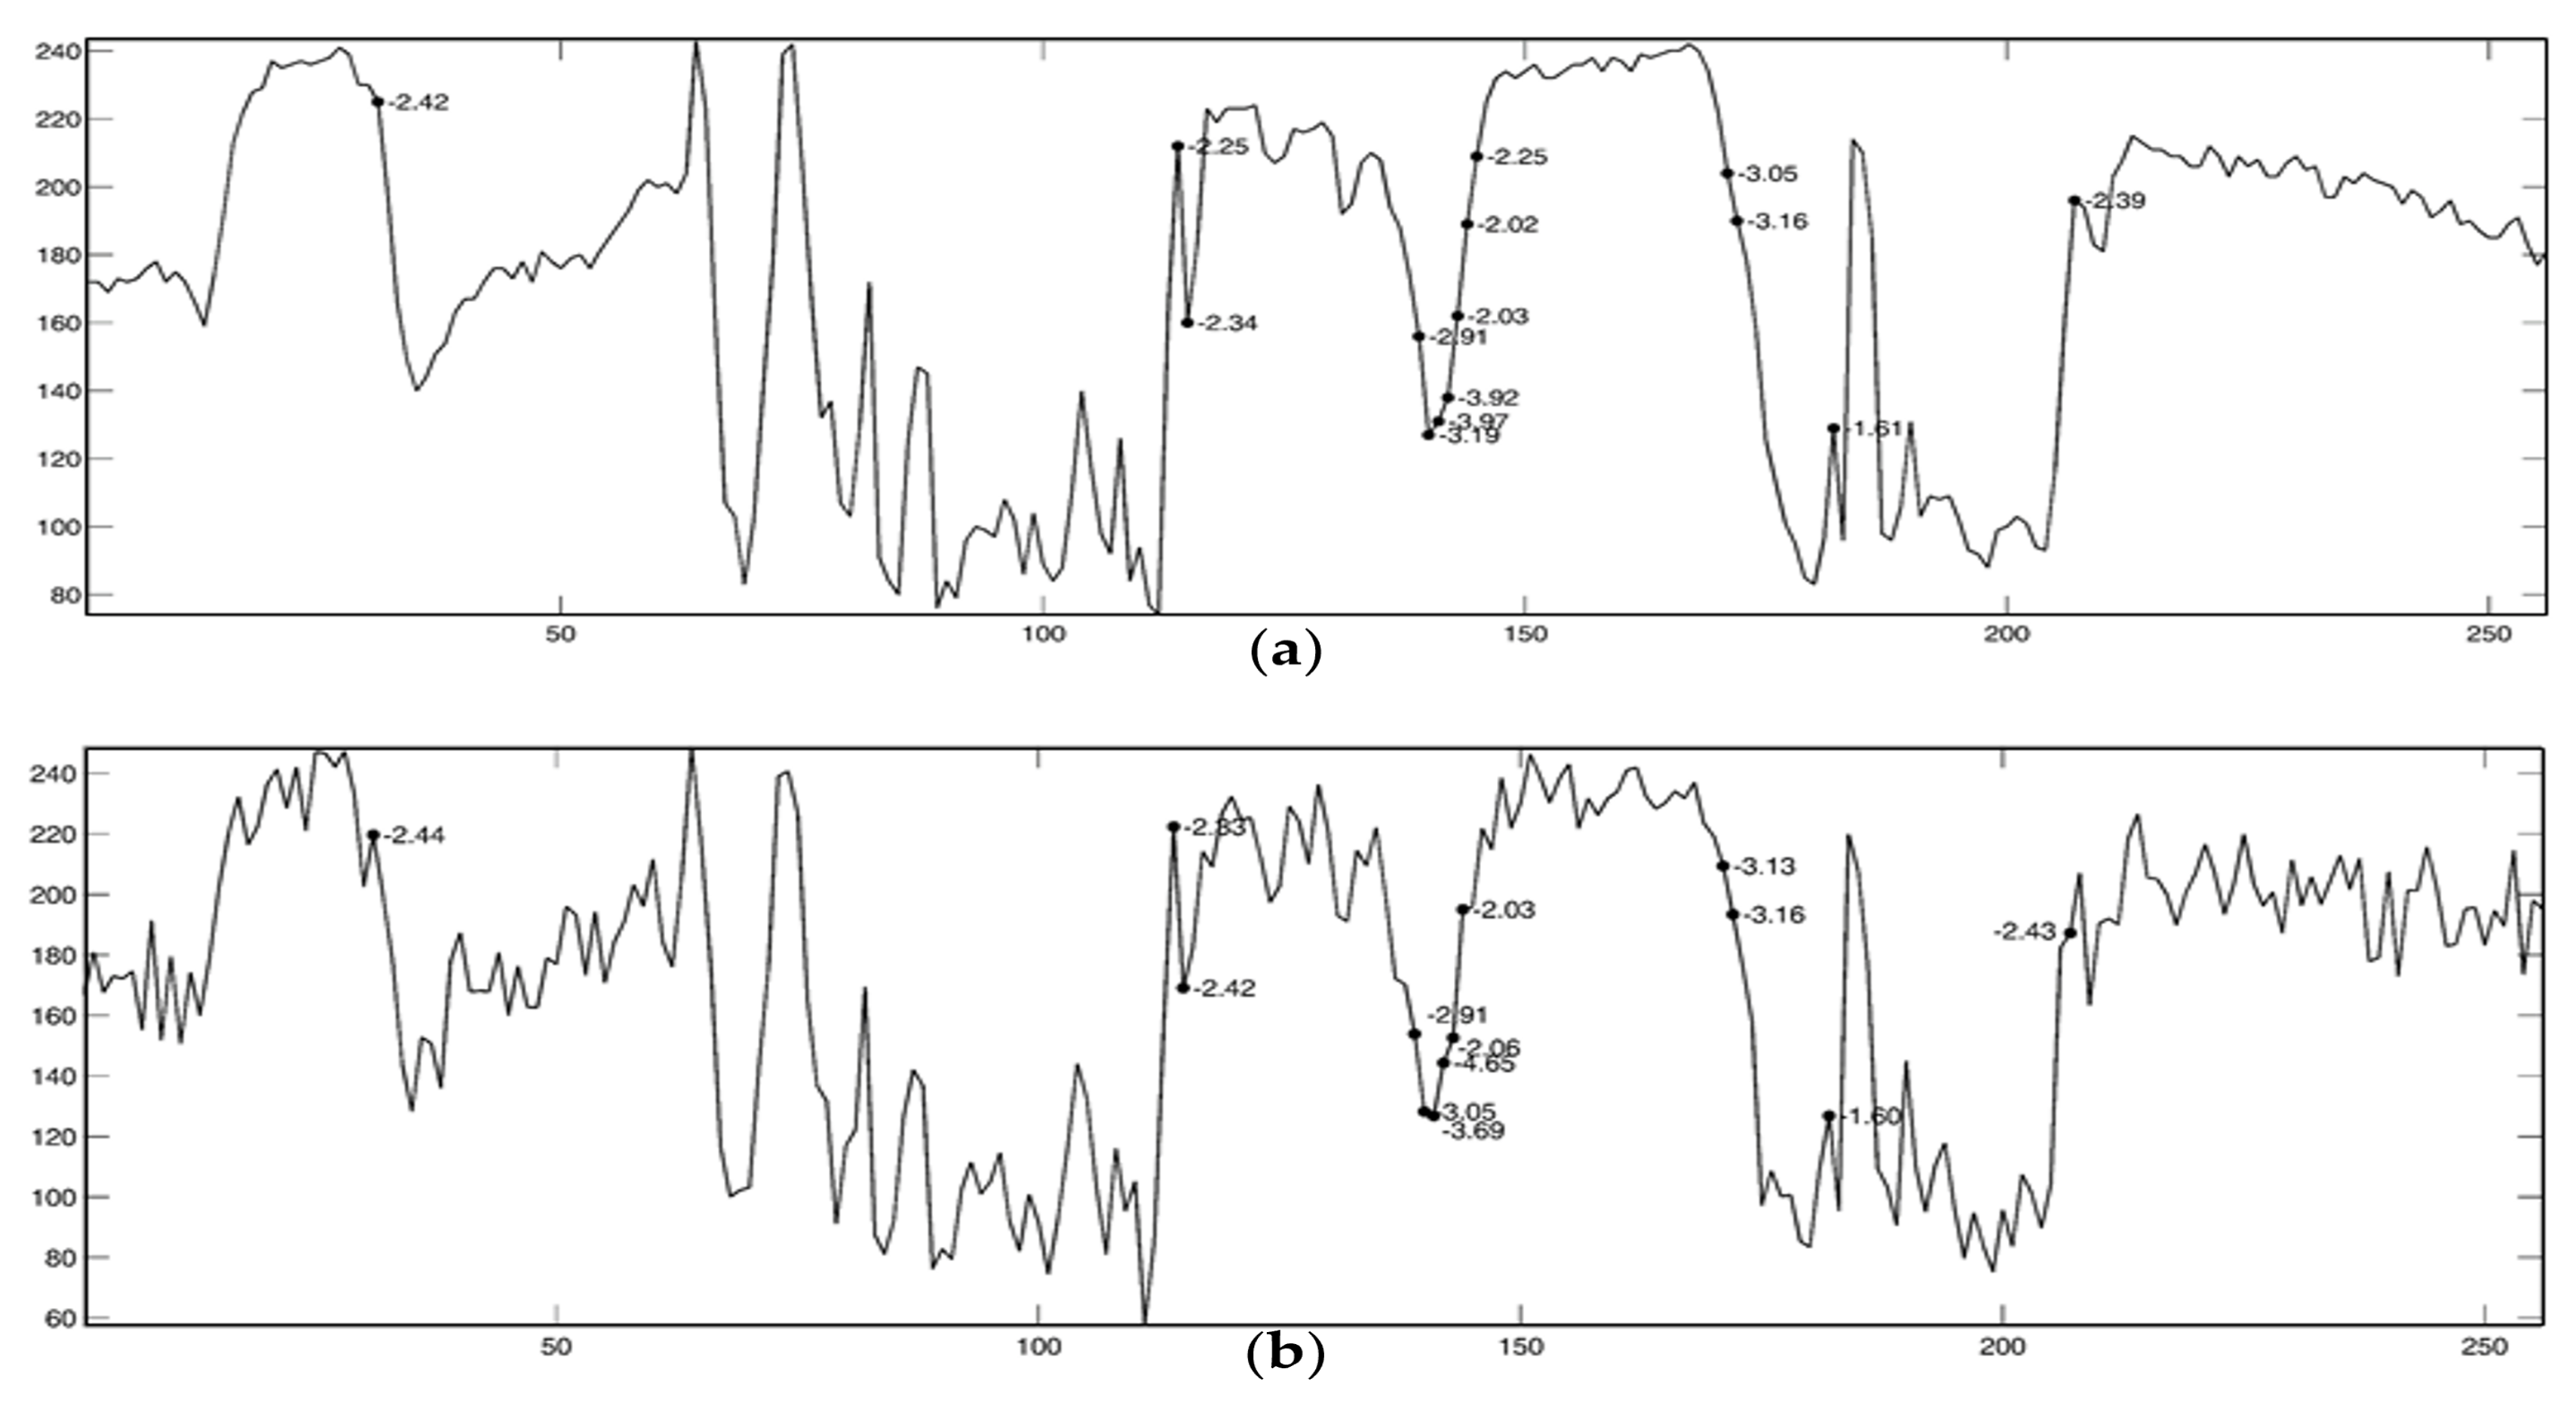
4.1. Lipschitz Regularity in the Context of Images
4.2. Restoration
Parametric Estimation
5. Results and Analysis
6. Conclusions
Author Contributions
Funding
Conflicts of Interest
Appendix A
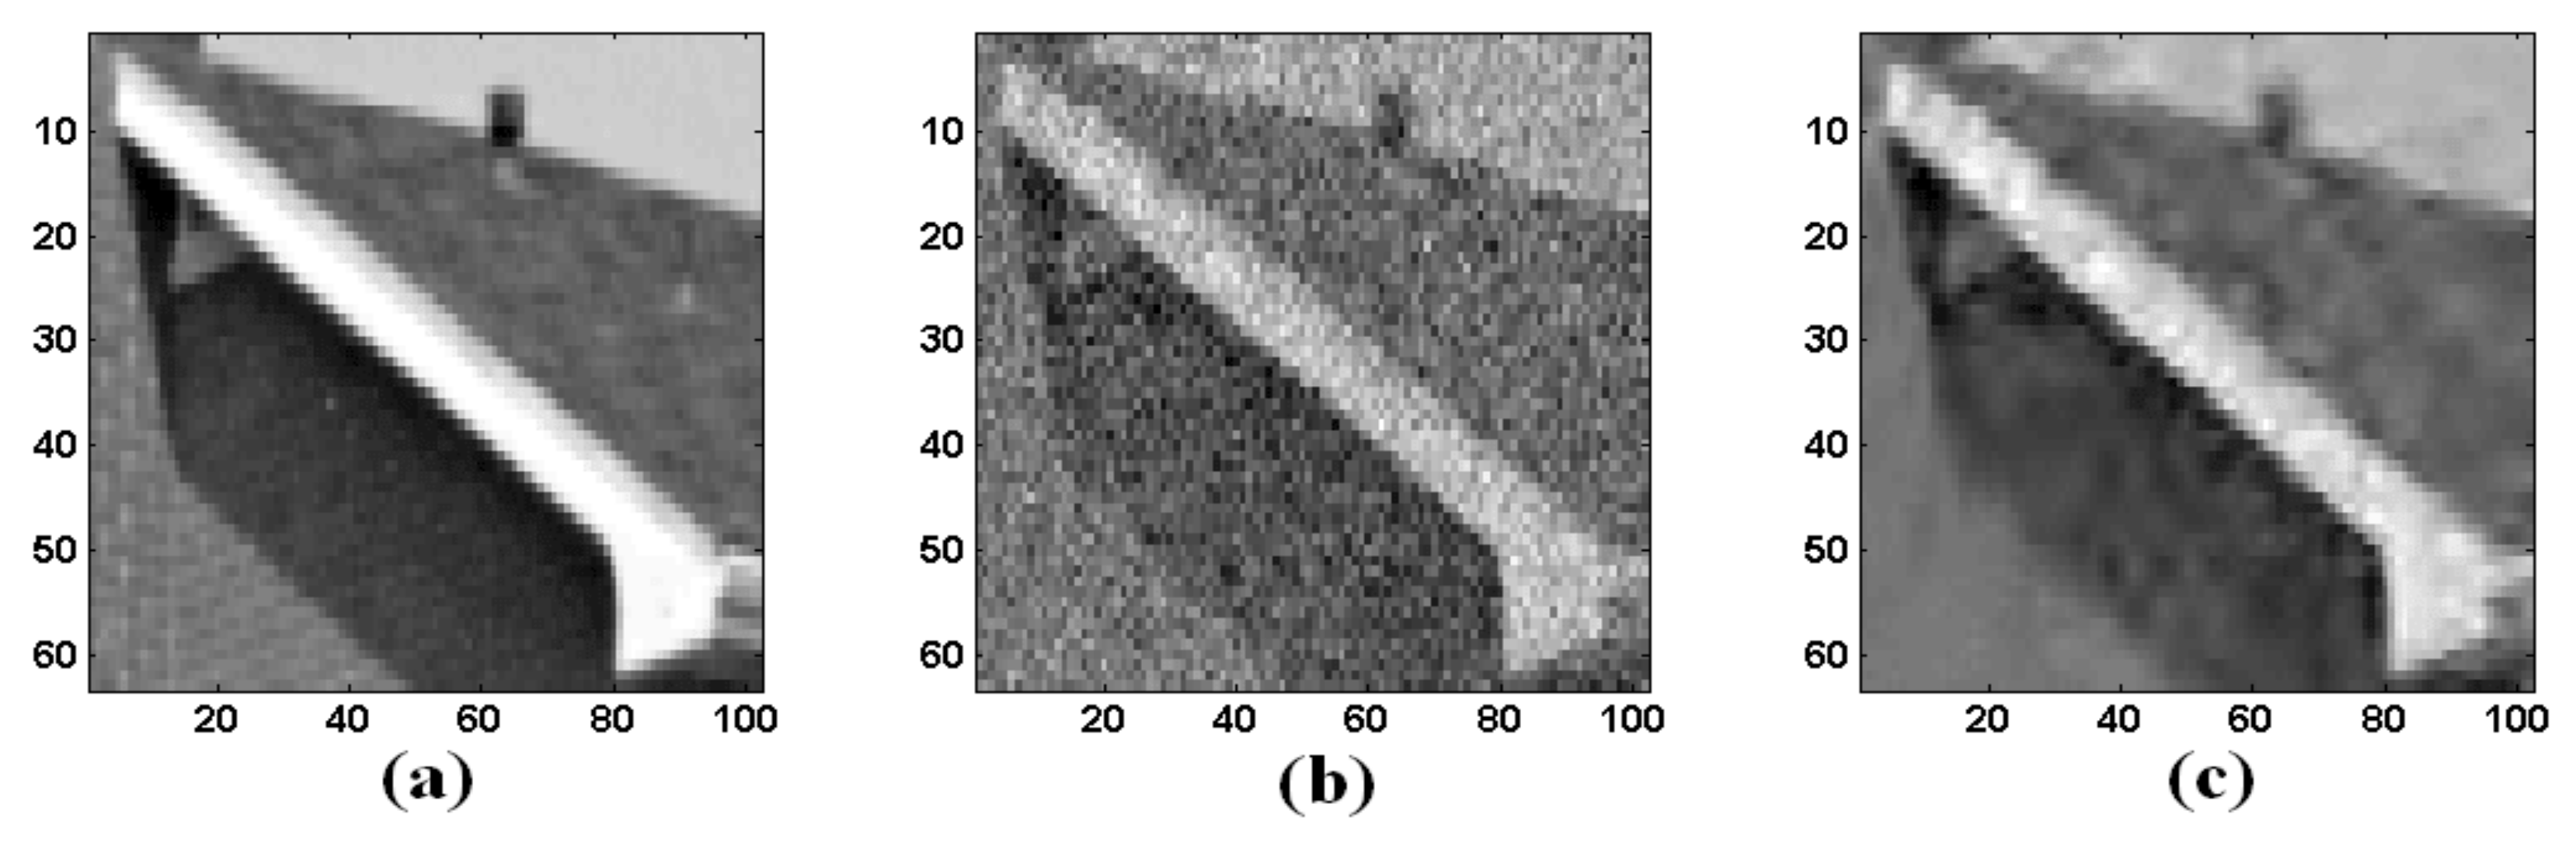
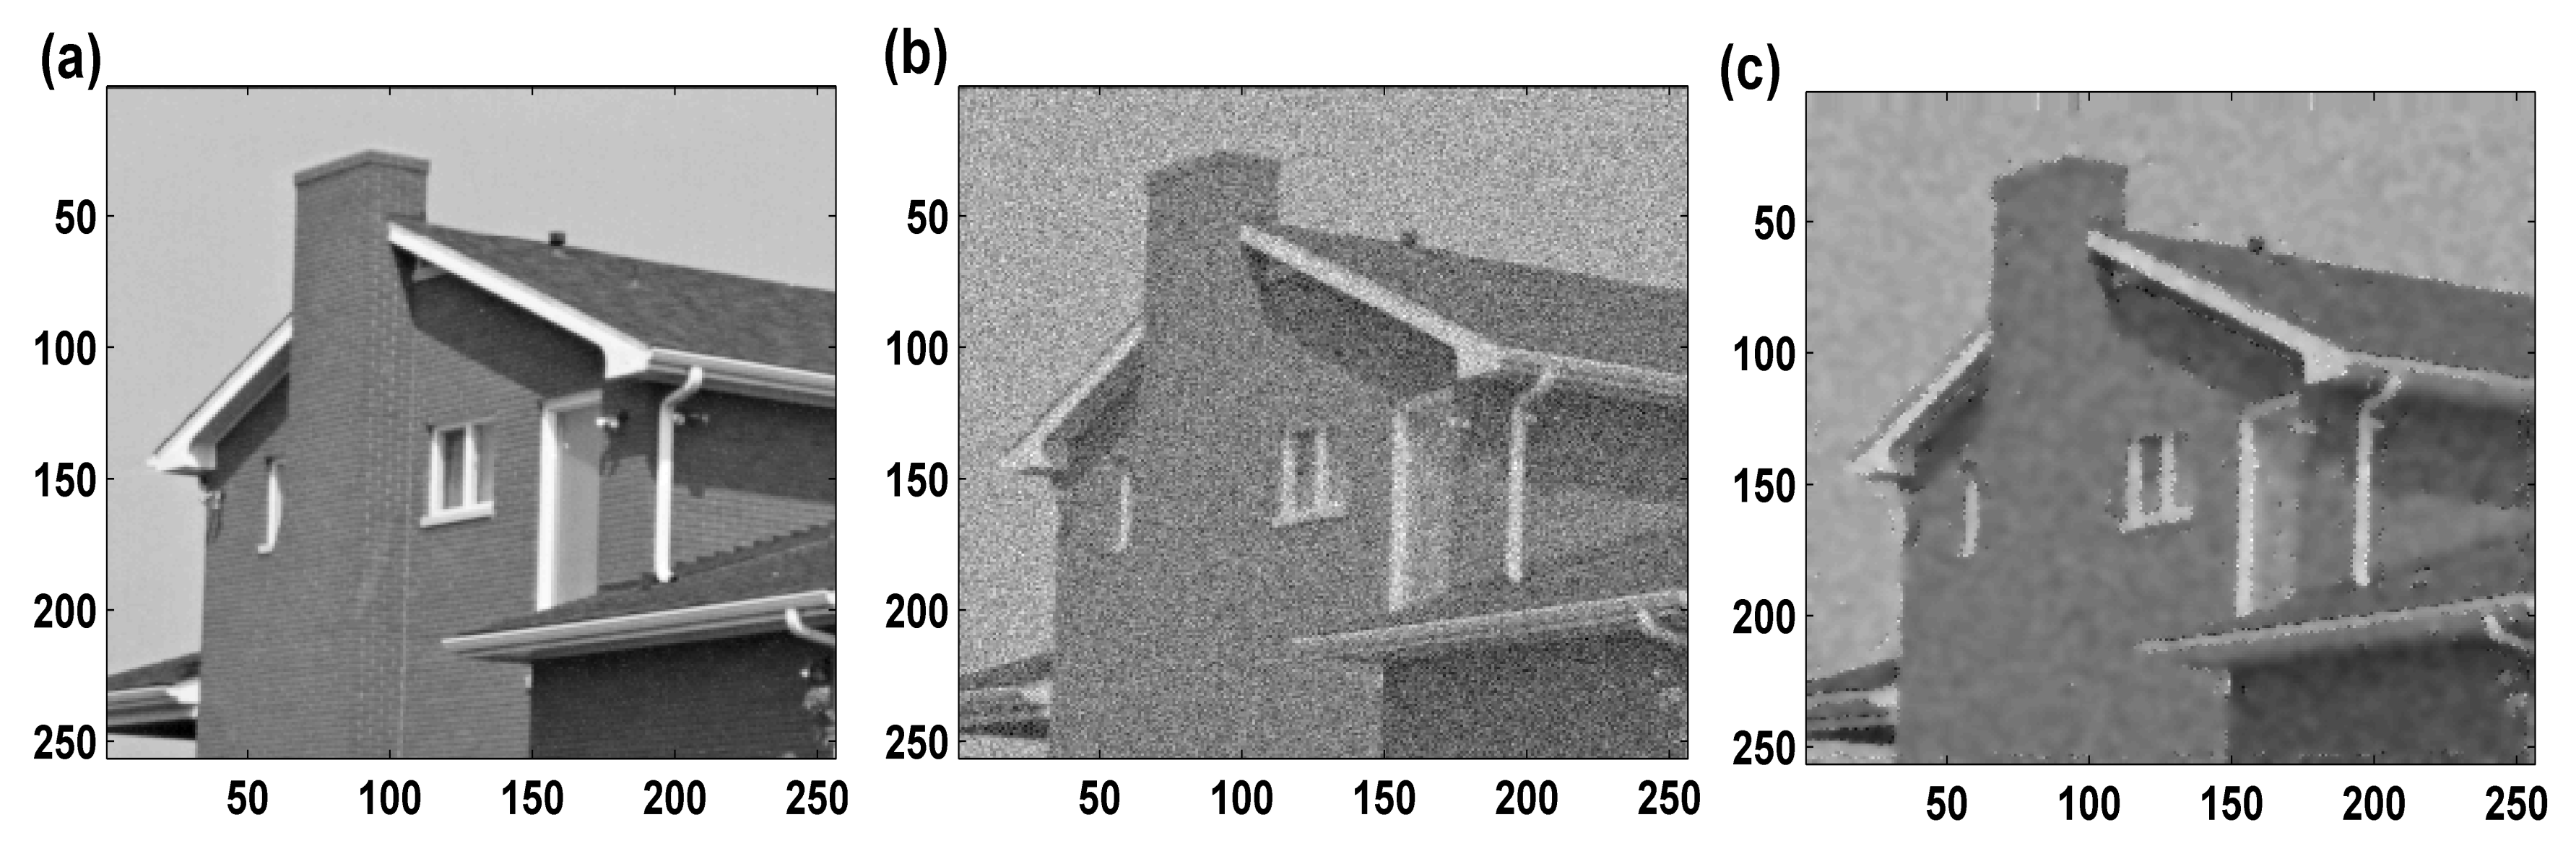
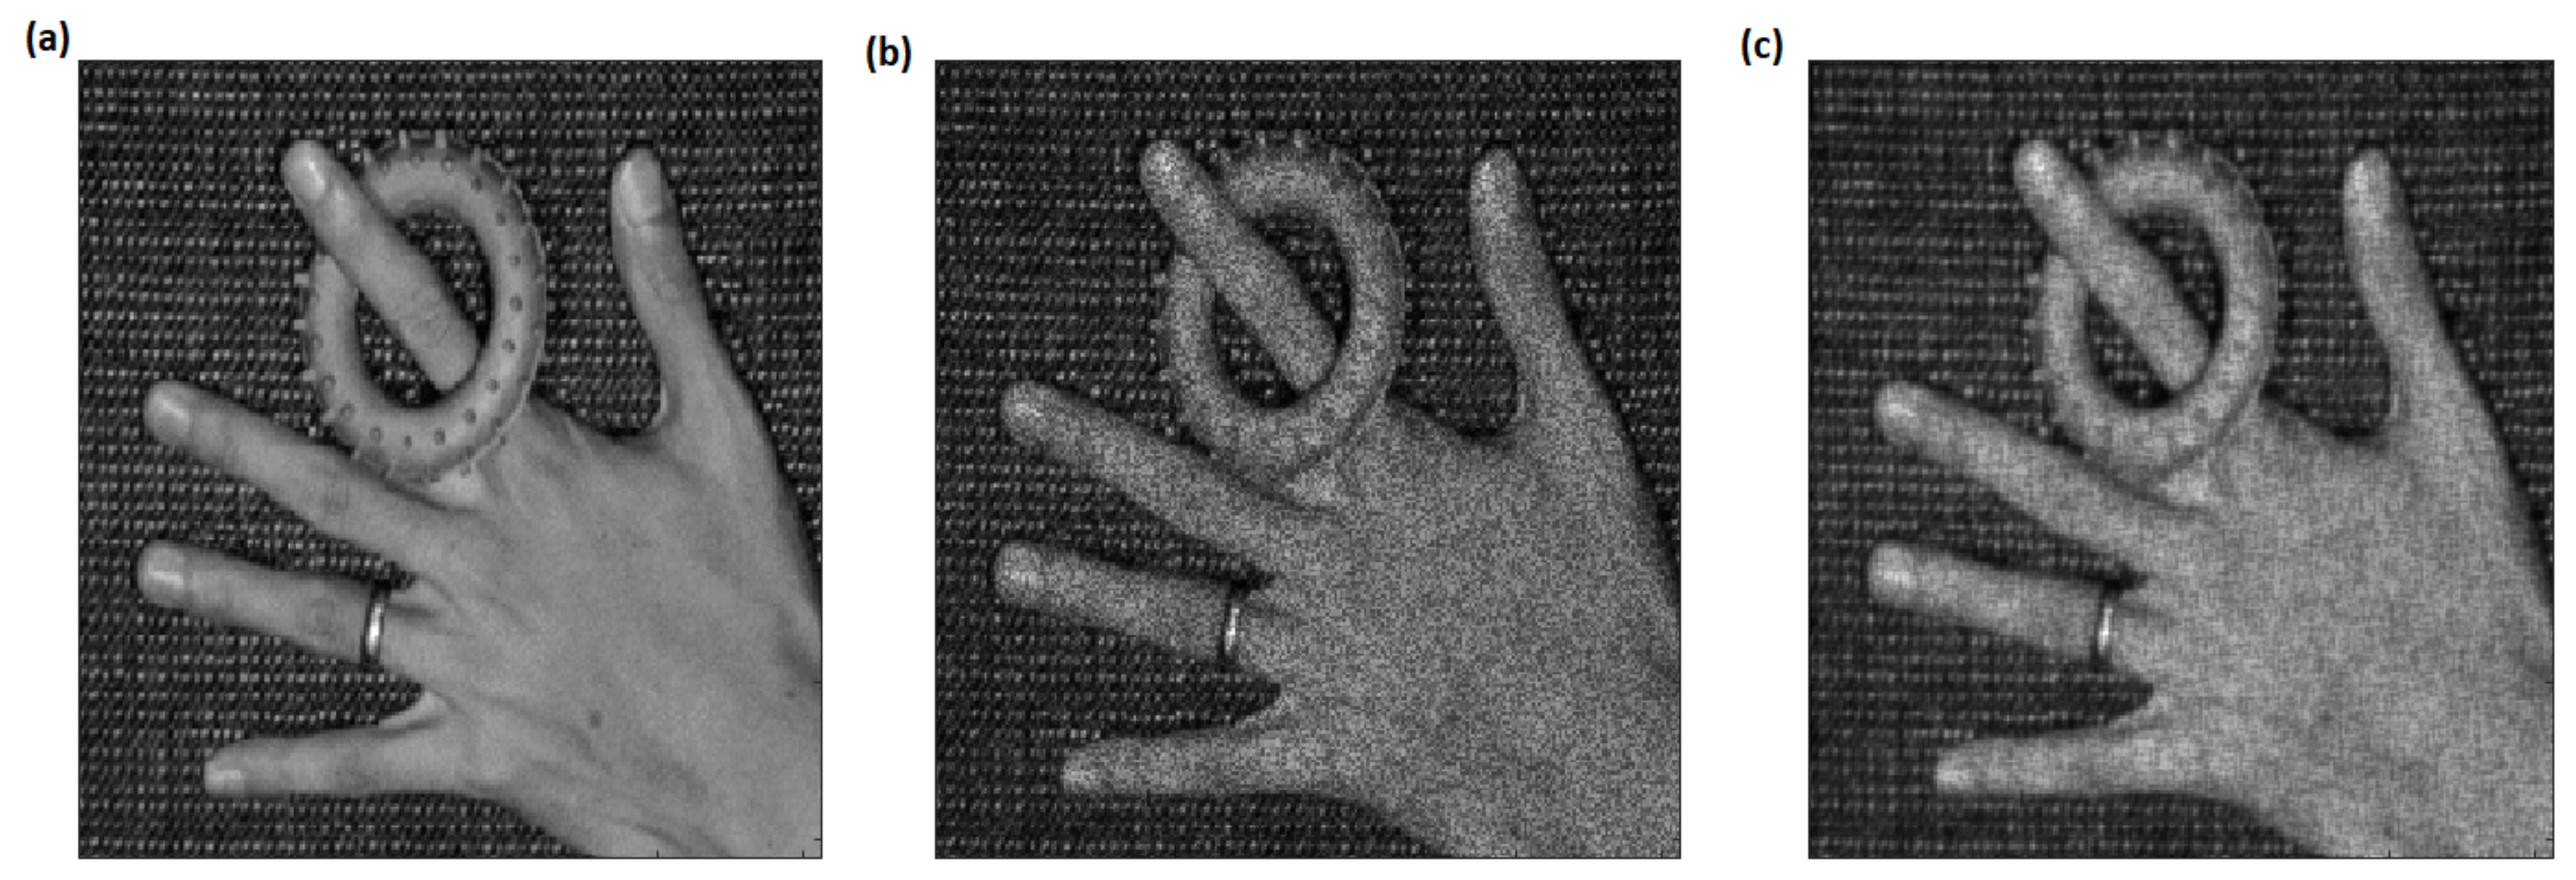
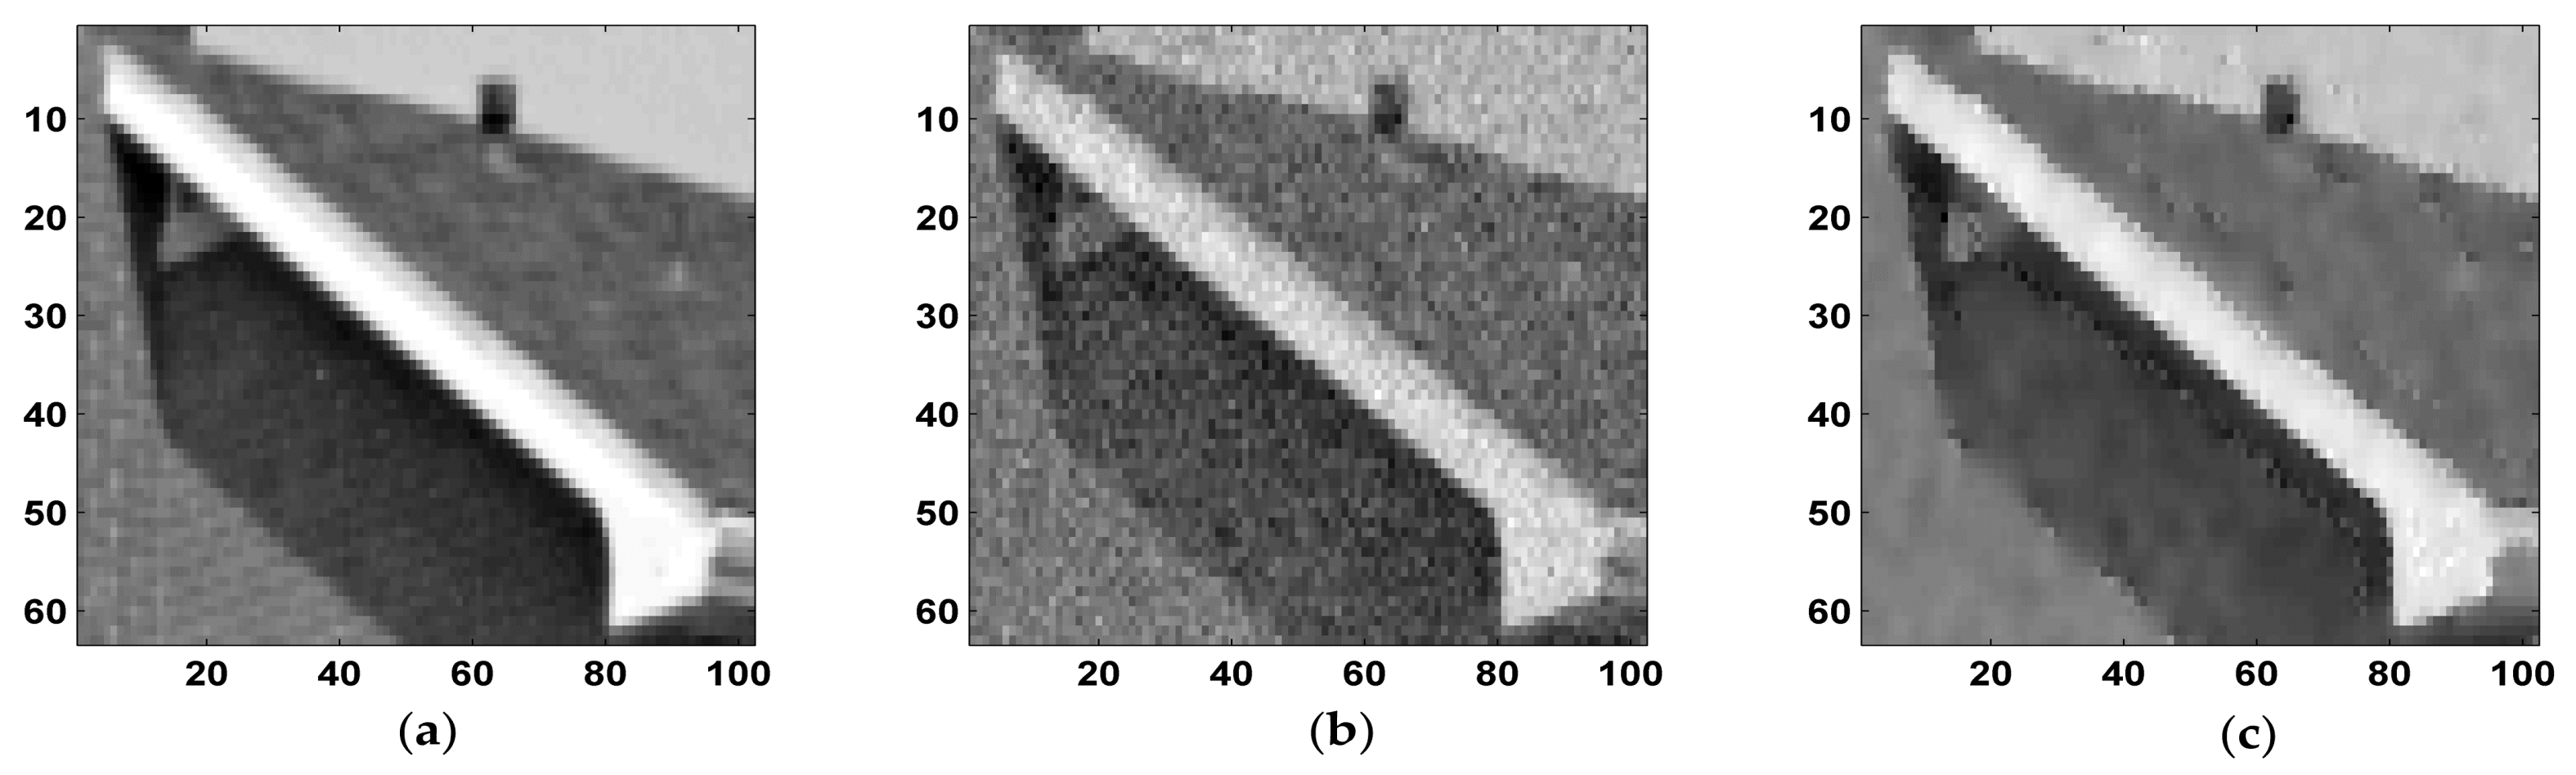
- We assume that the given image specify the model:f is the noise-free signal, and is the white Gaussian noise .
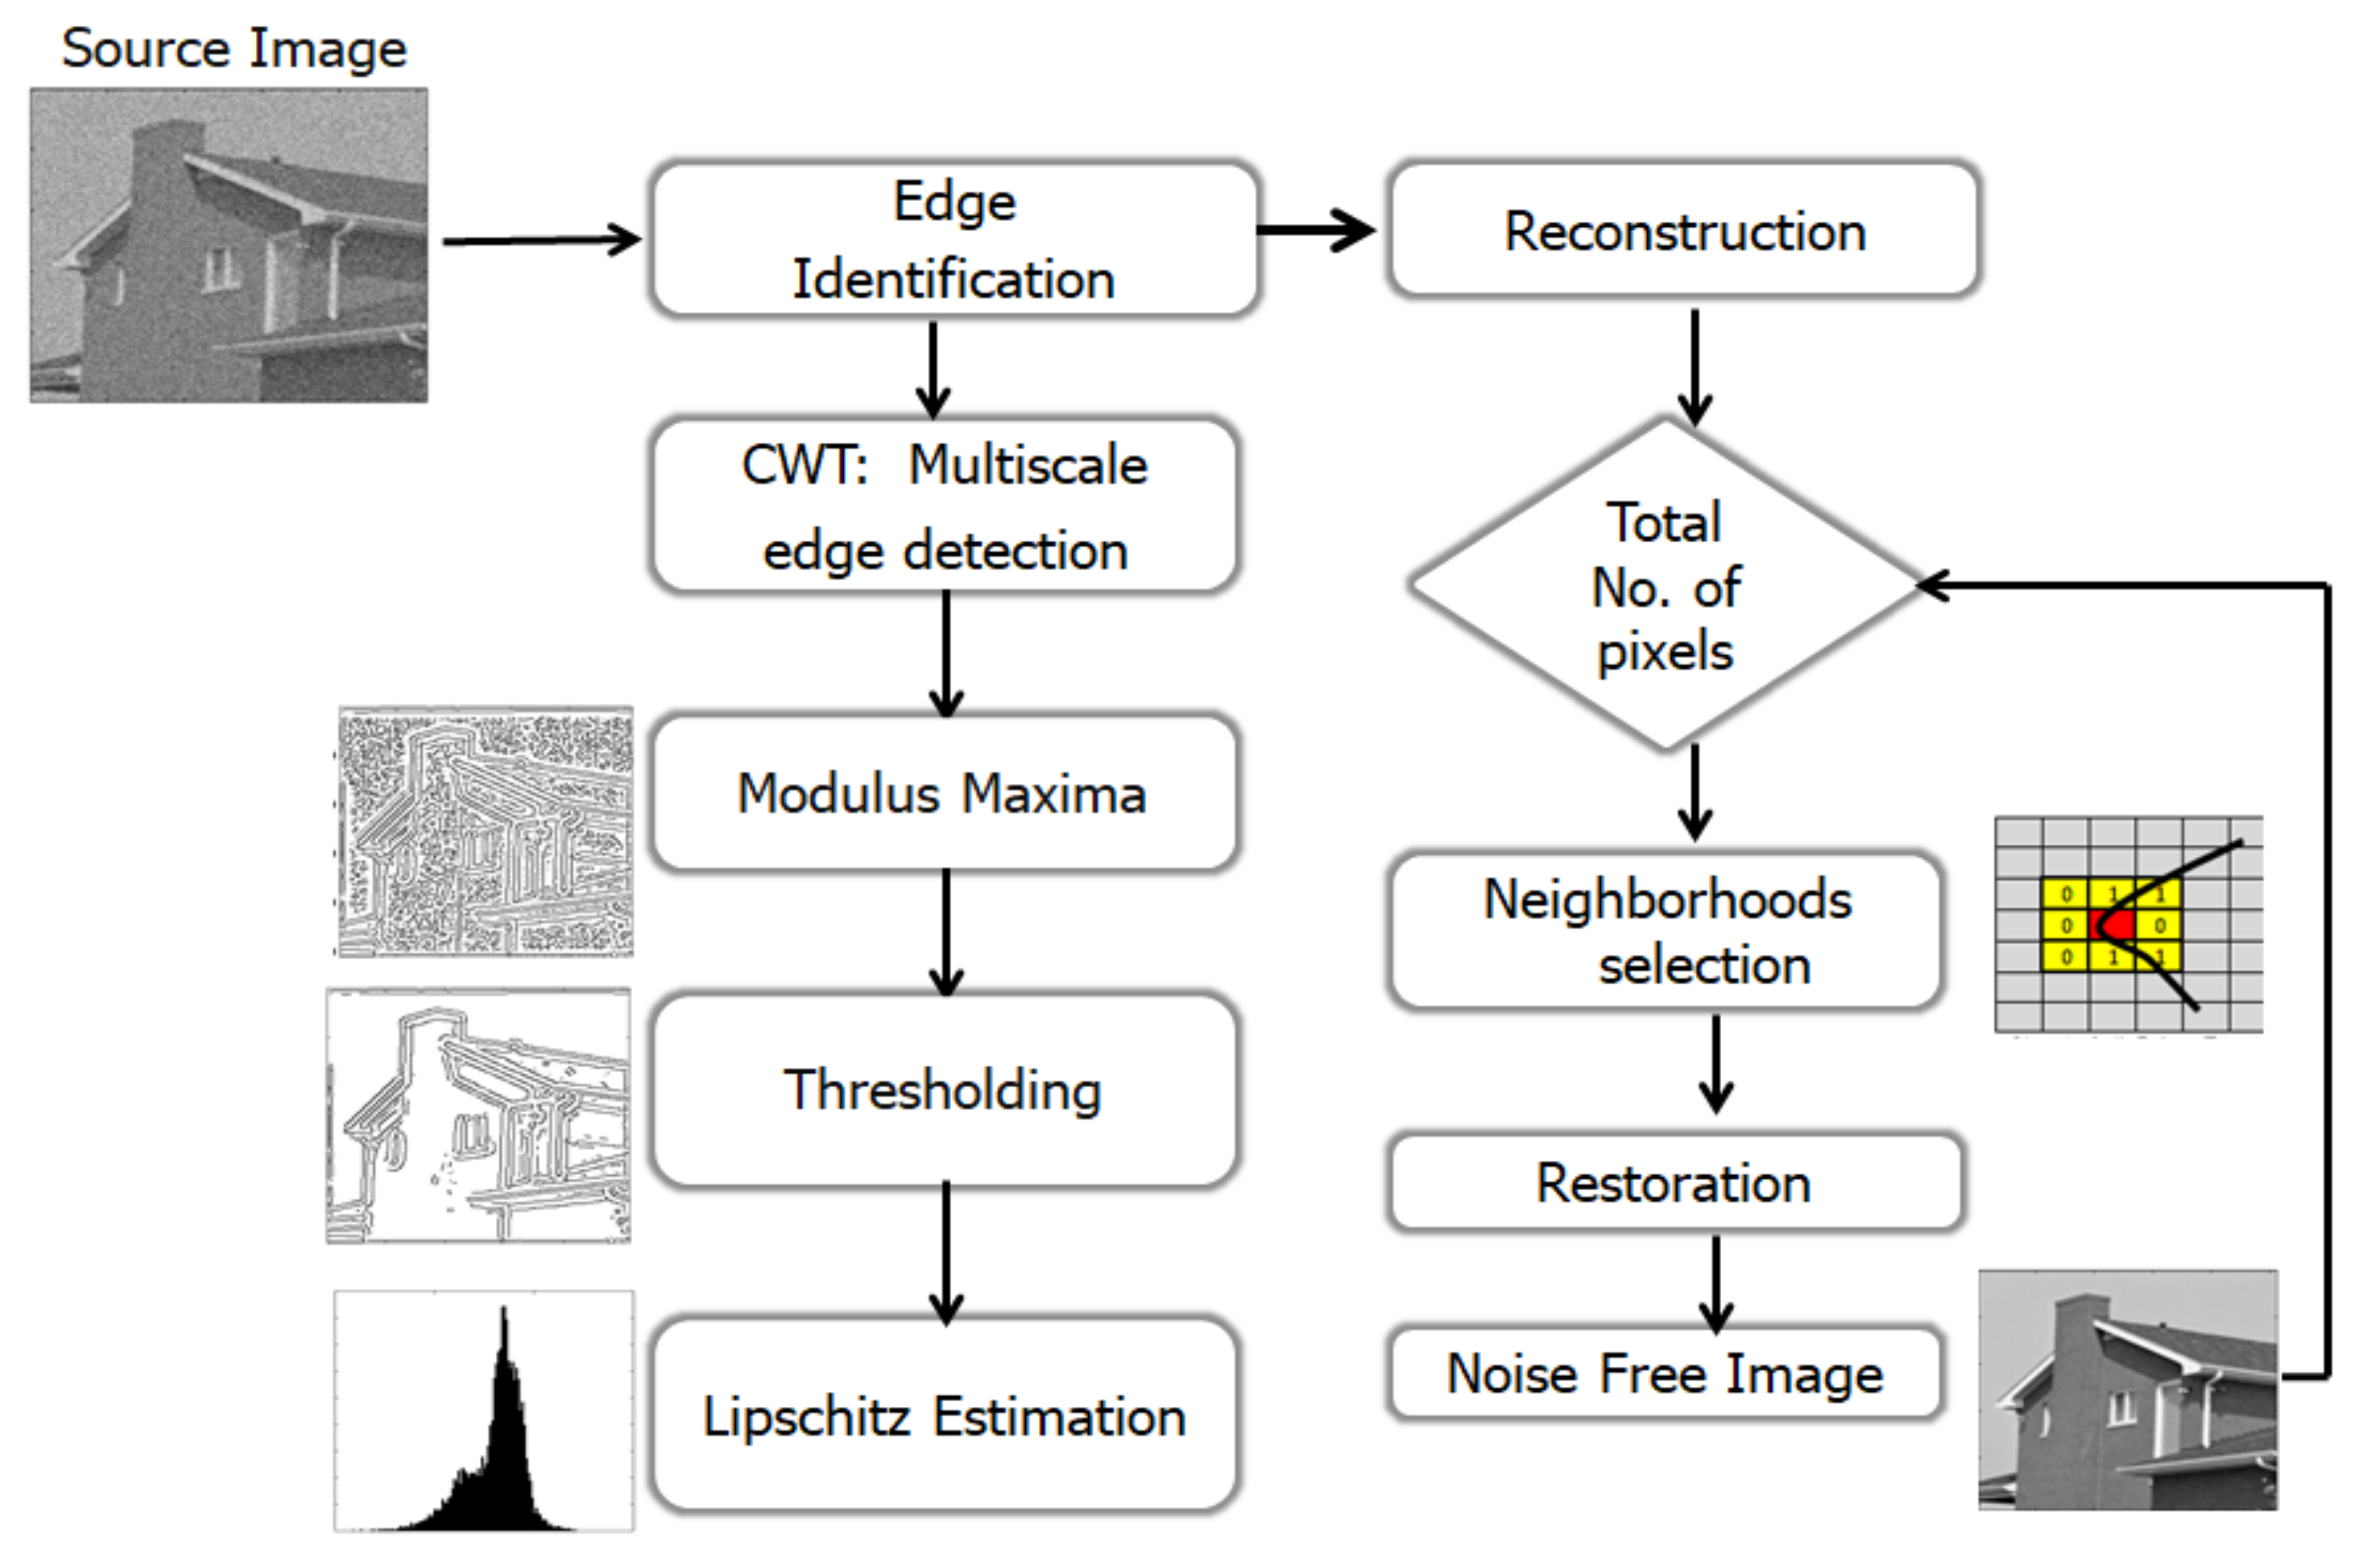
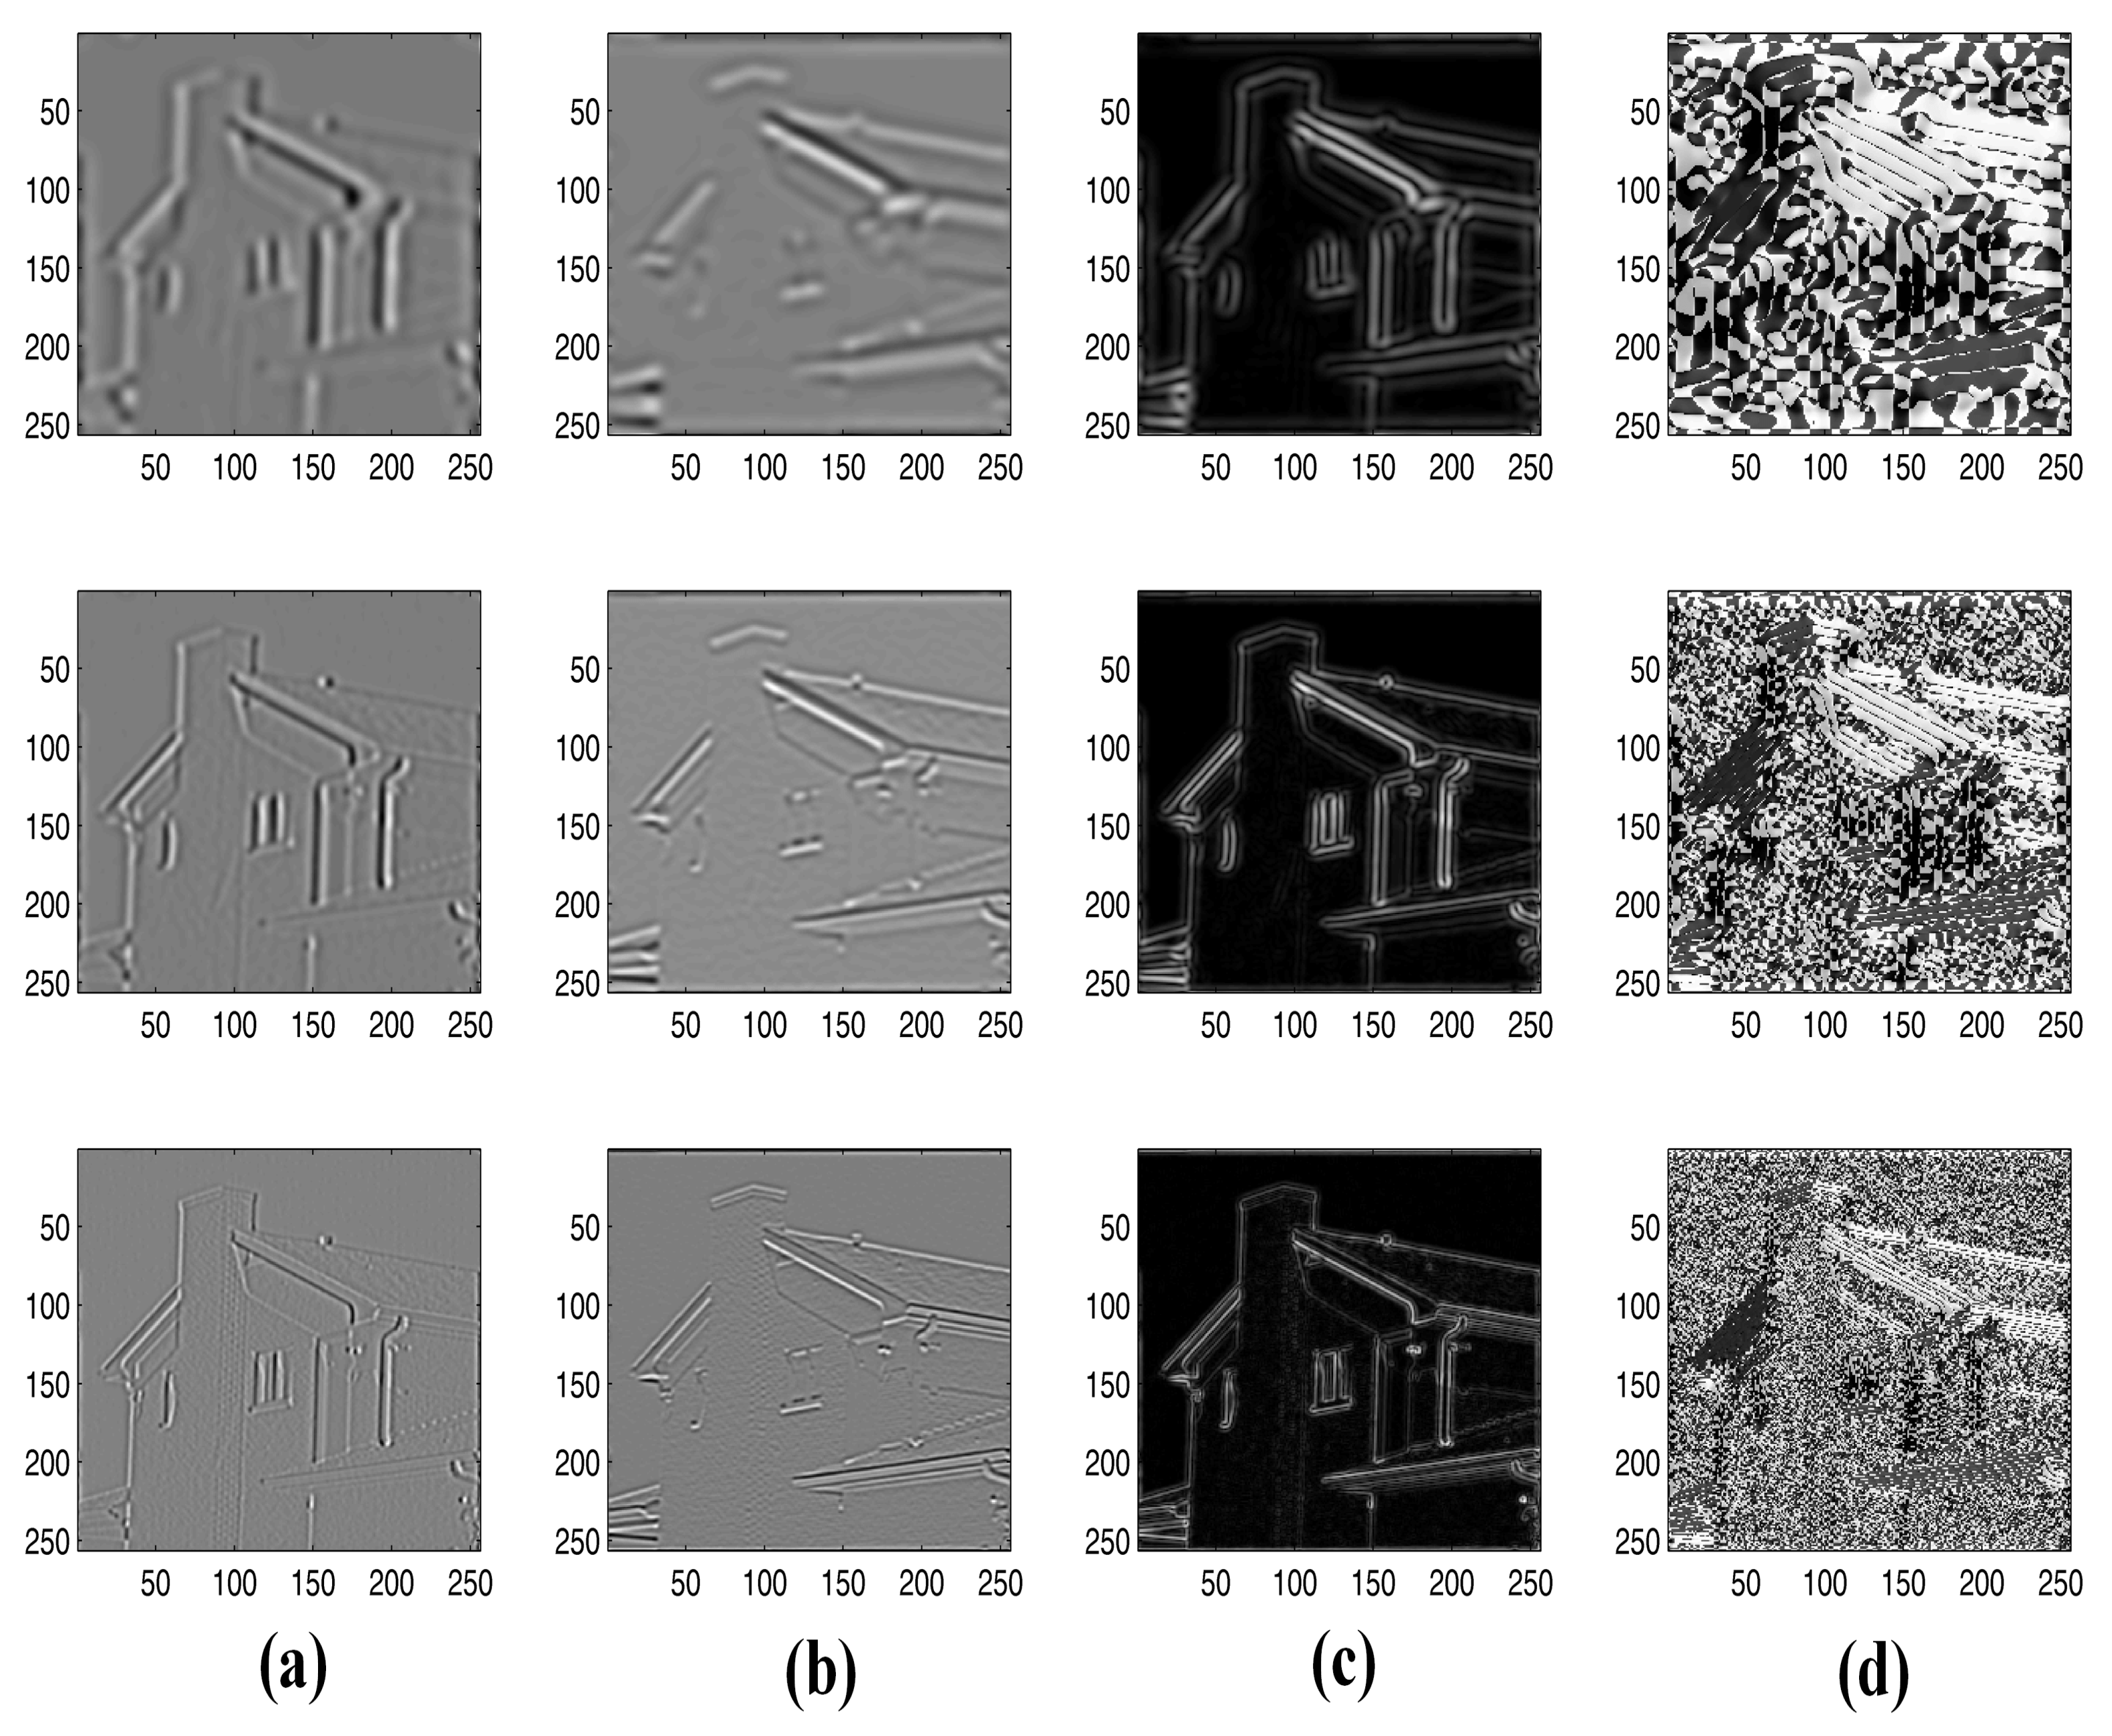
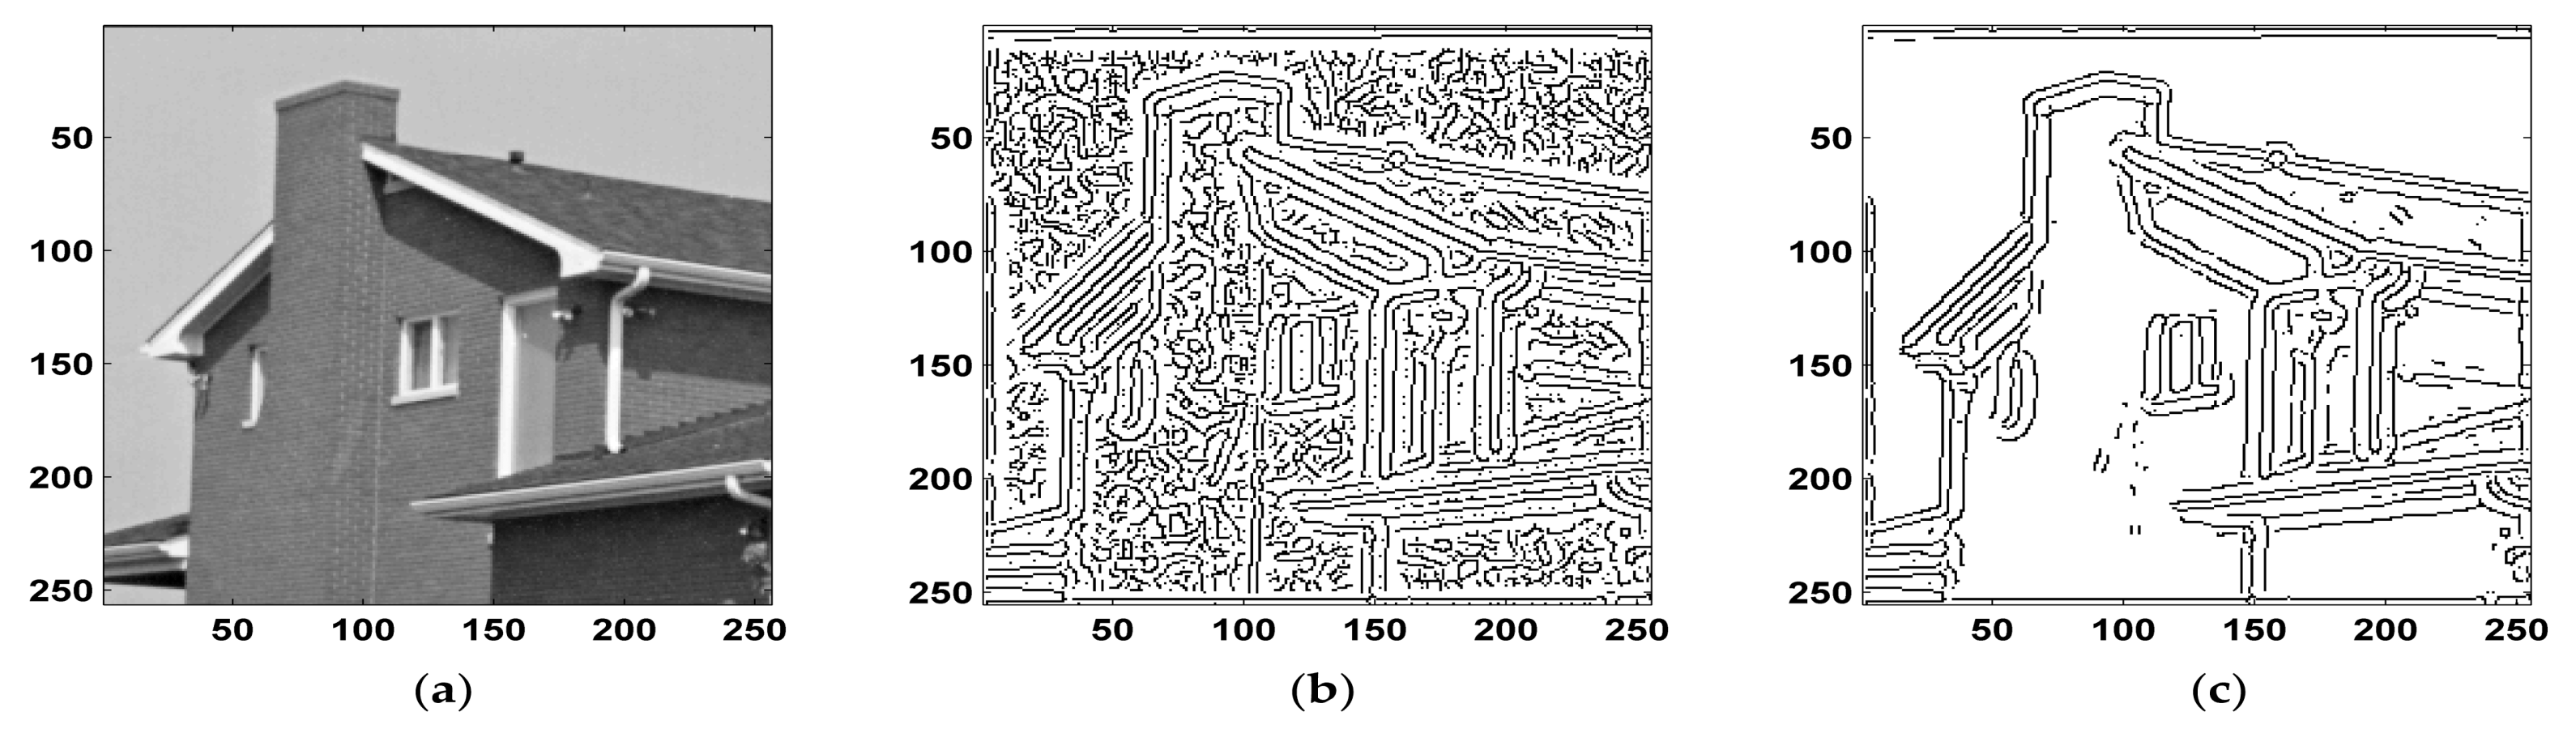
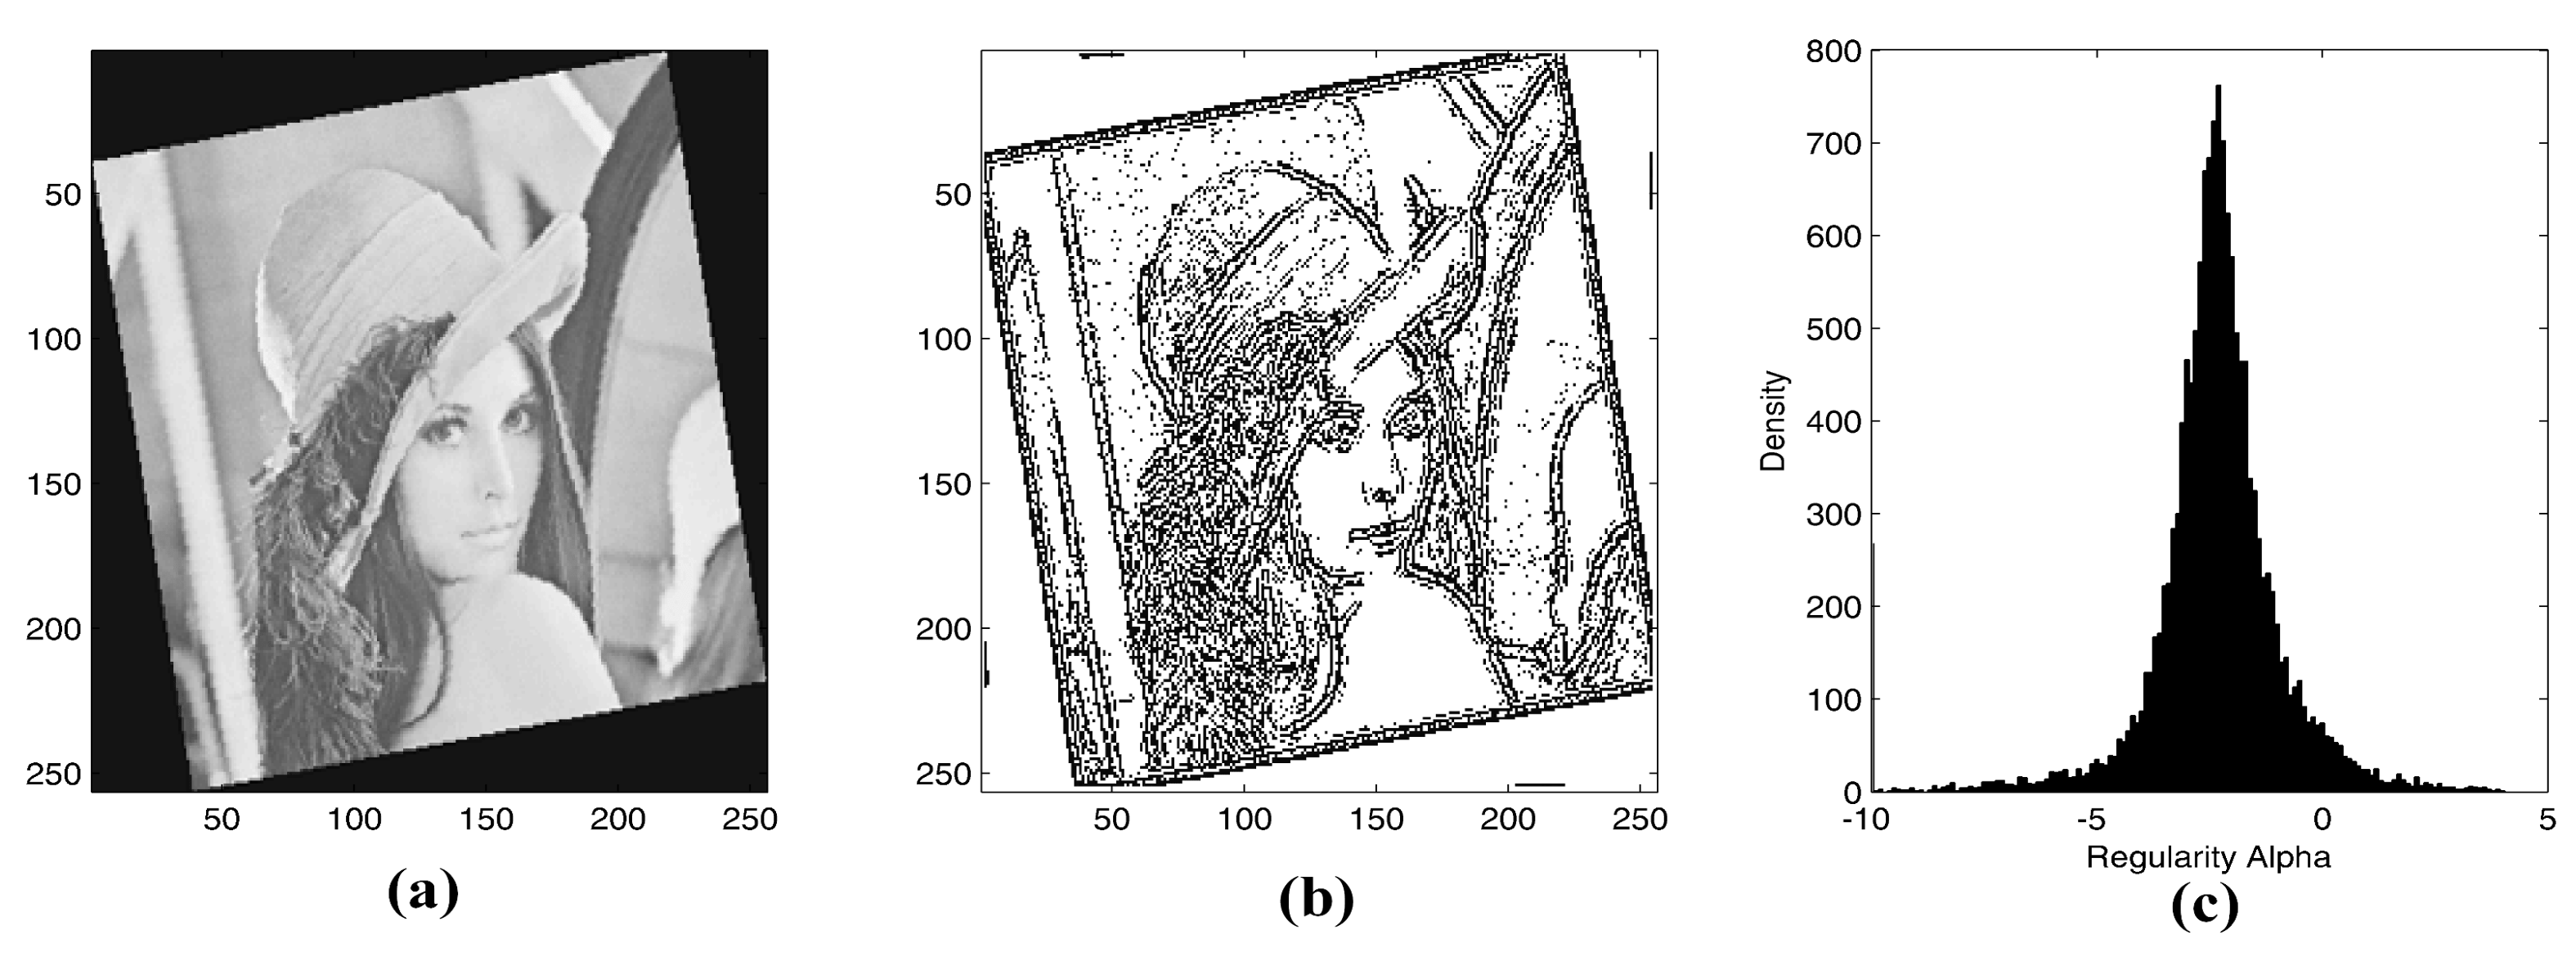
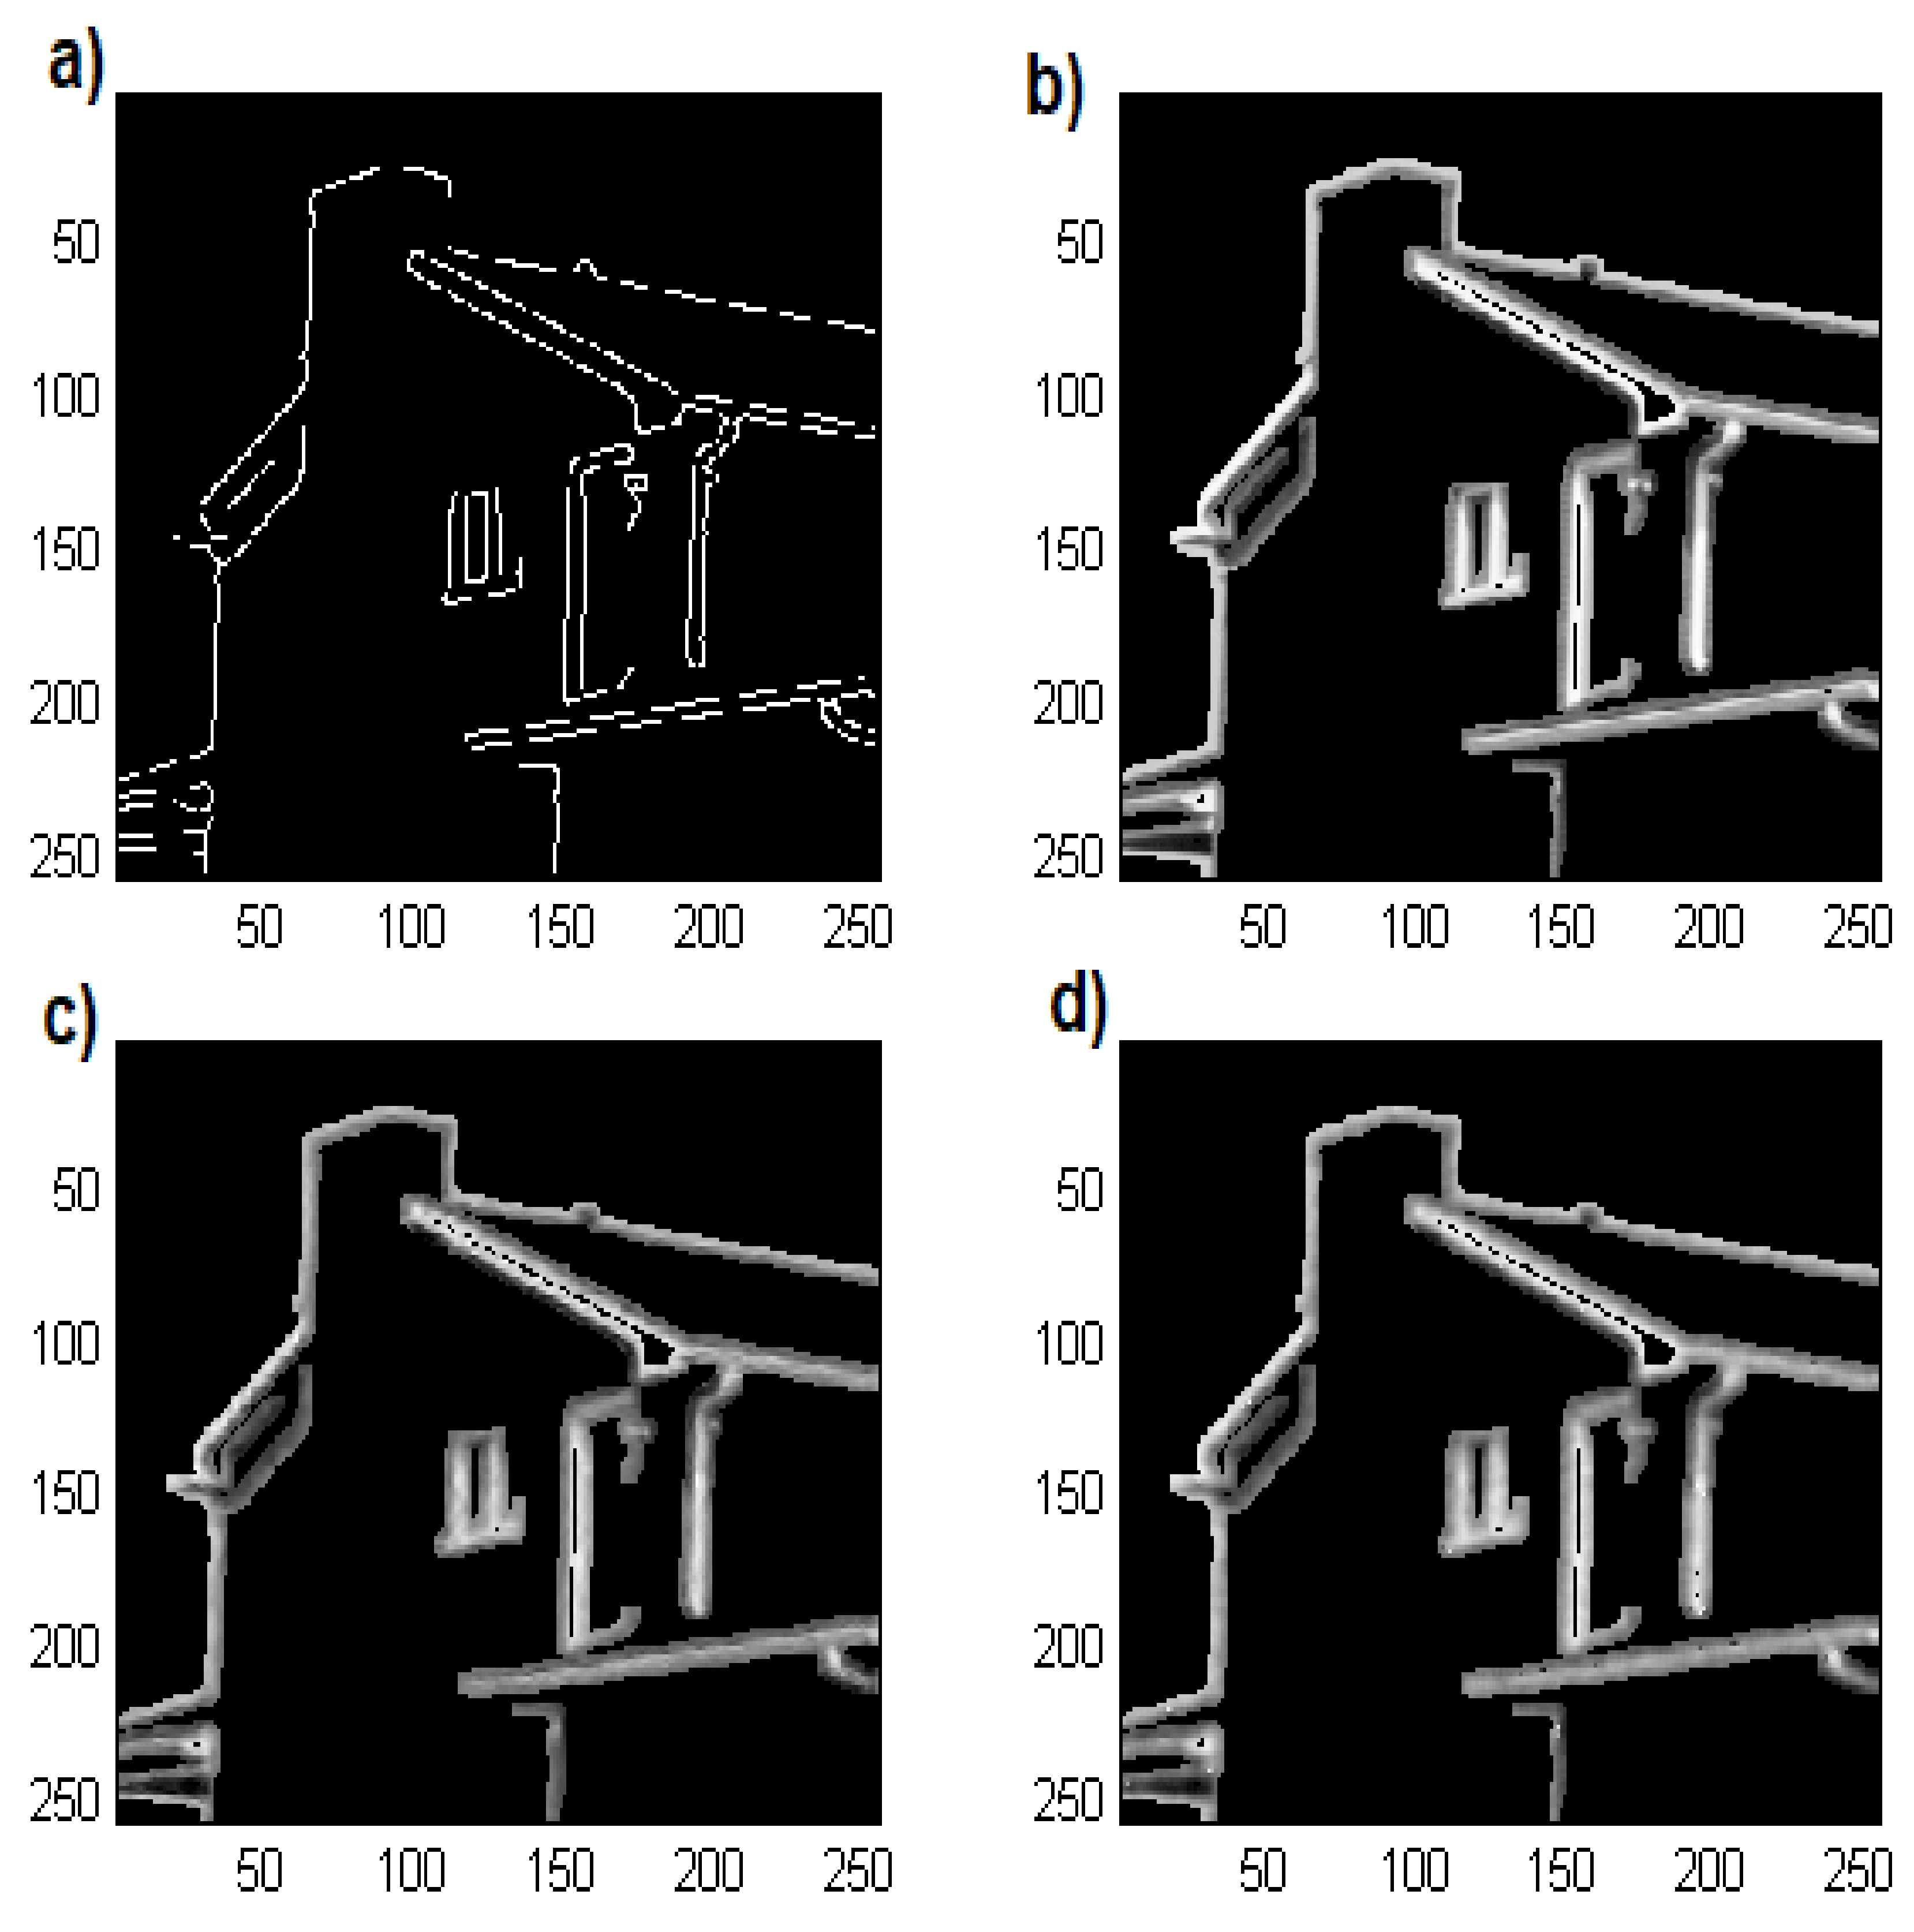
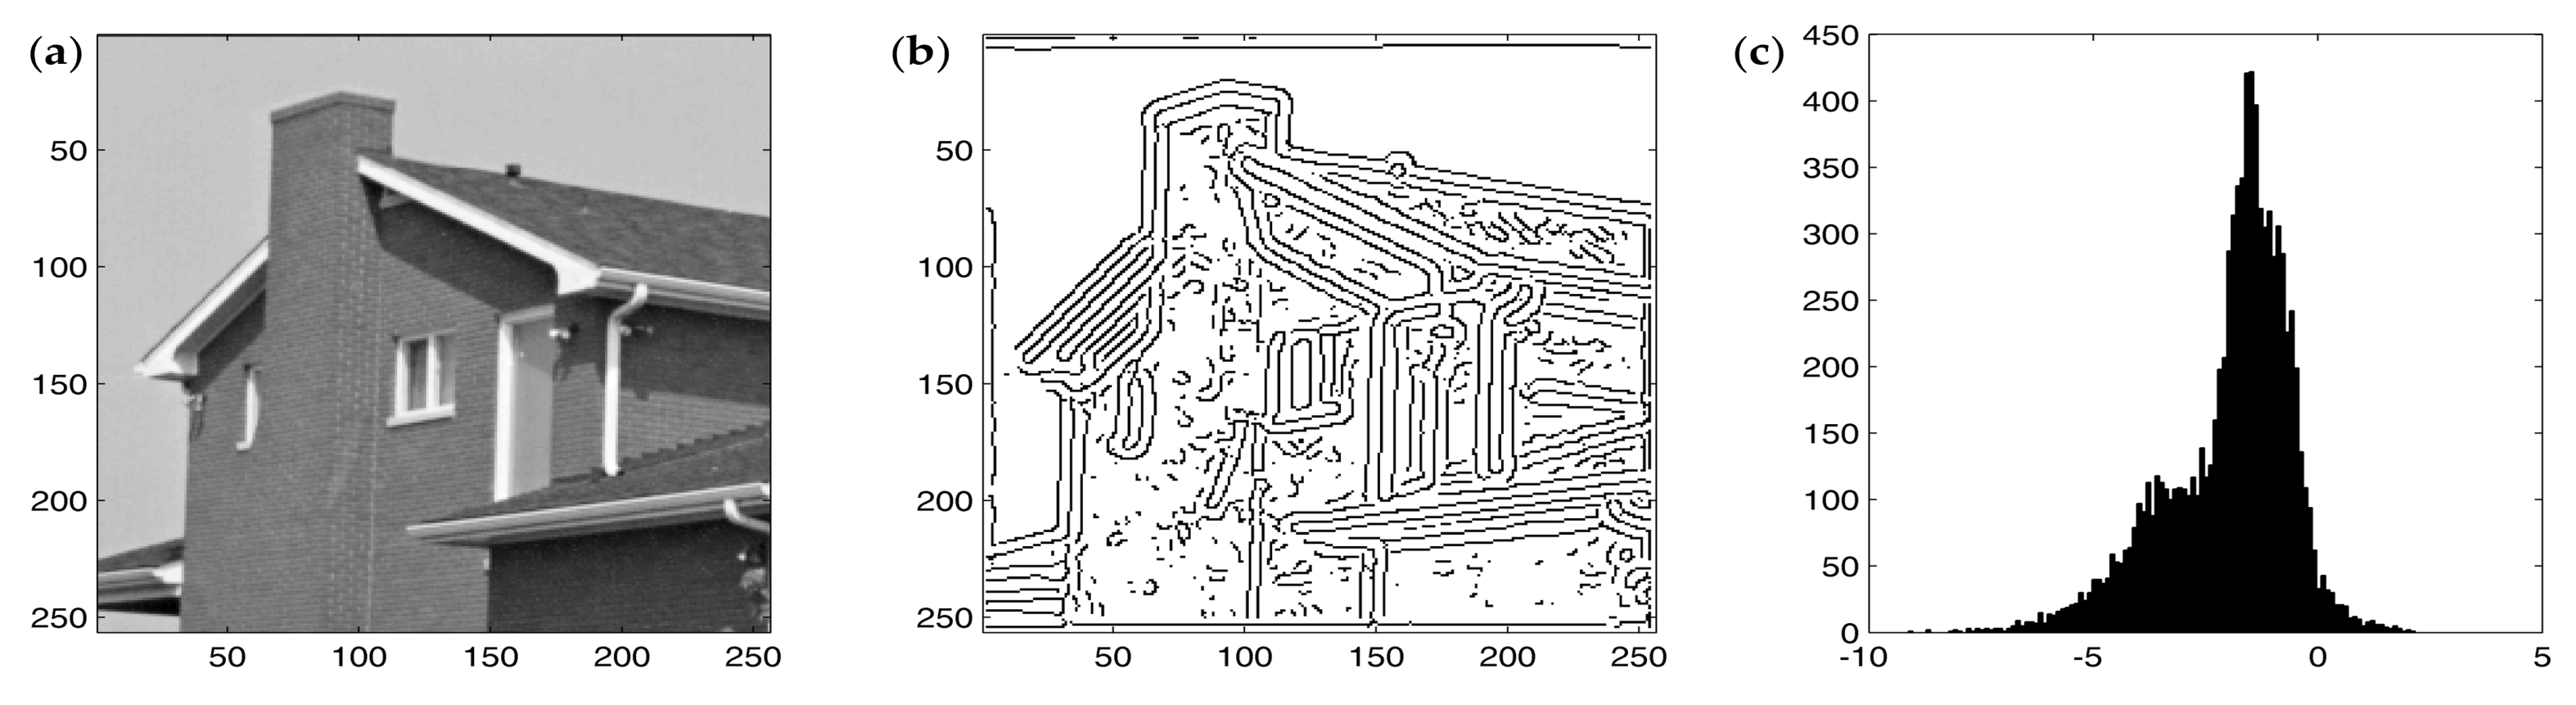
- At first, we applied wavelet transform based multiscale analysis to detect edges using modulus maxima.
- Lipschitz exponents separate edges from noise and background.
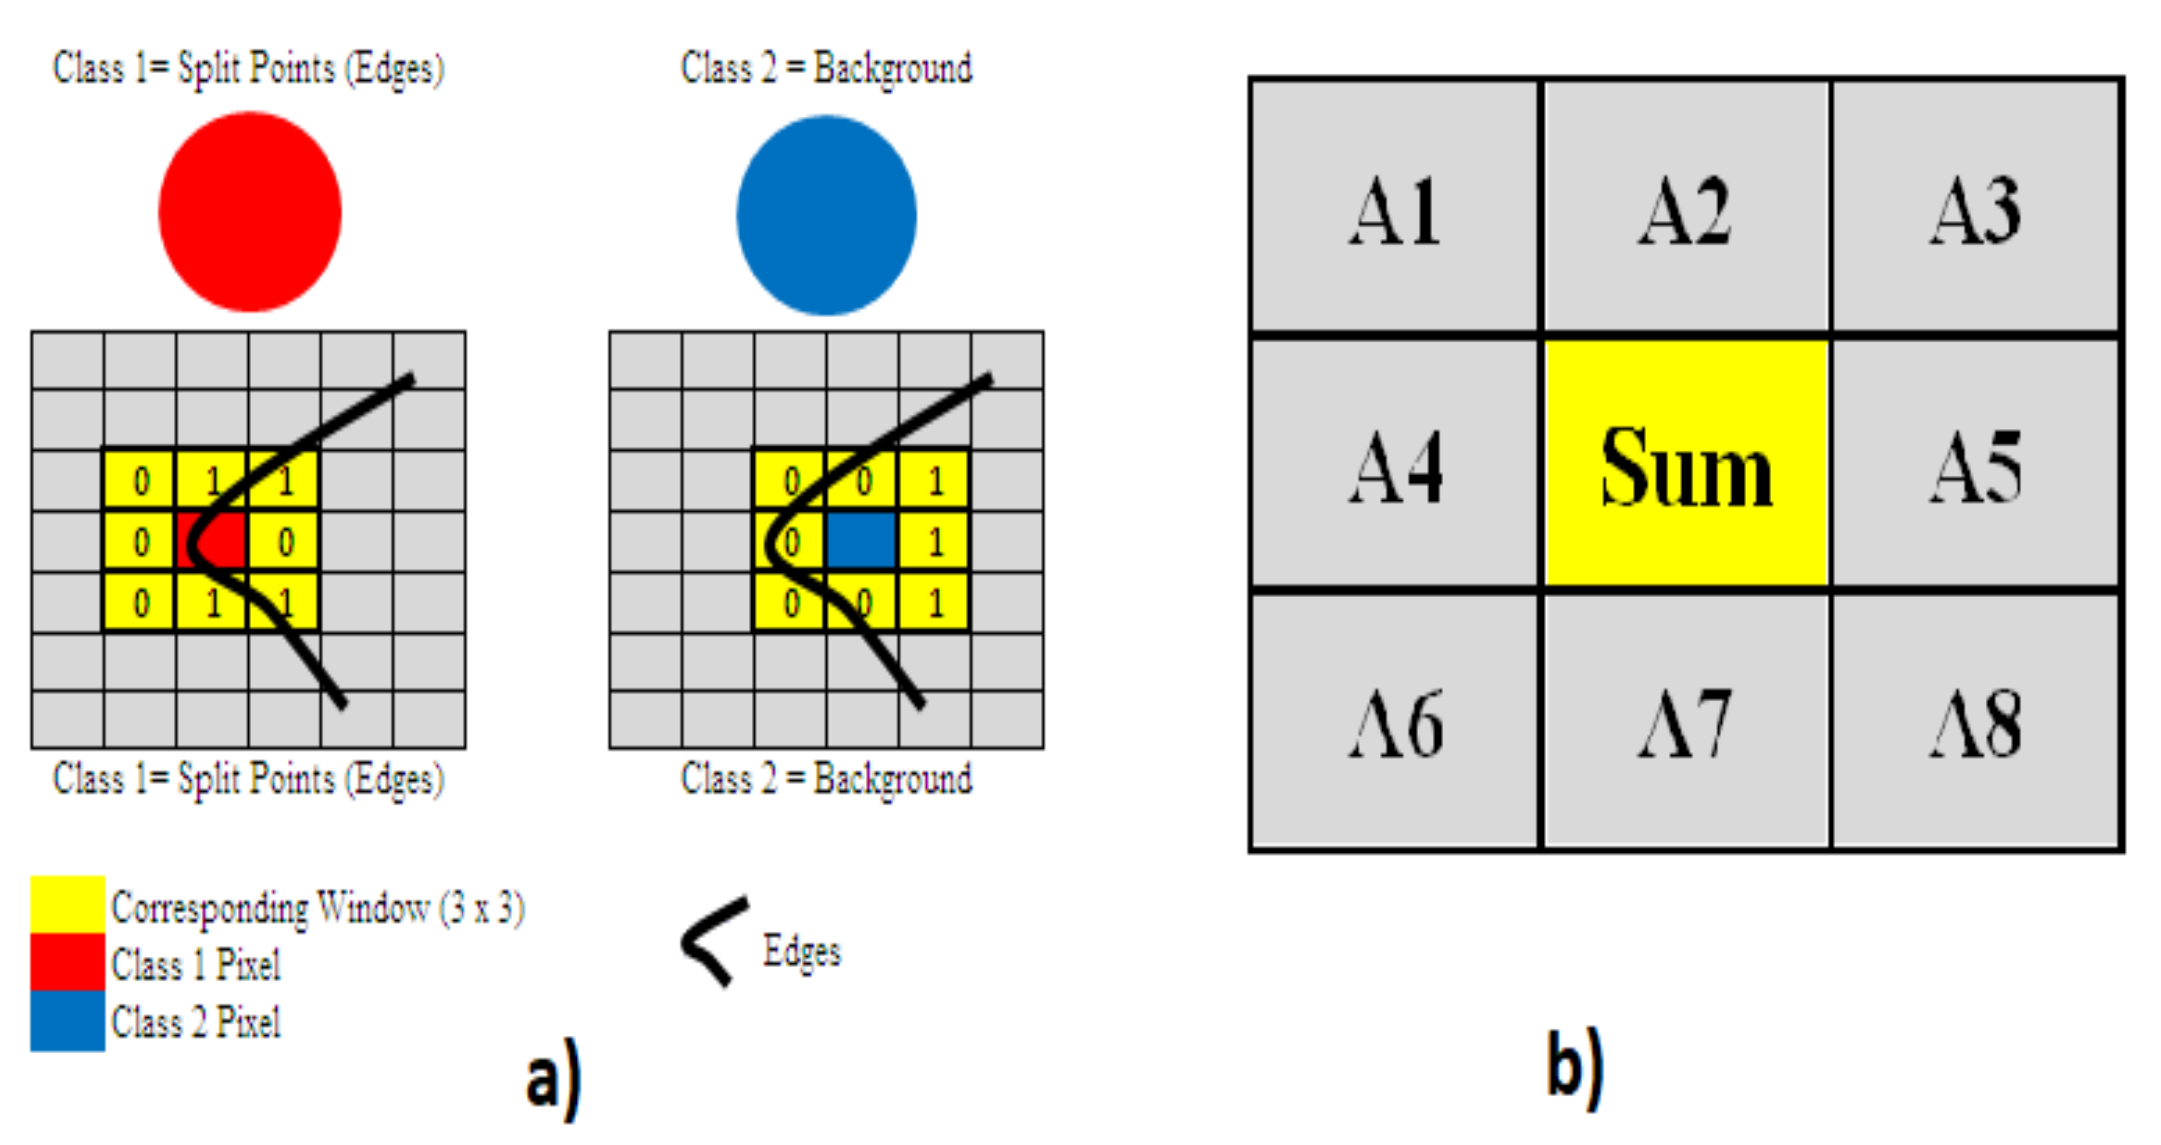
- Definition of classes were defined representing edge and background pixels respectively.
- Restoration algorithm. (assuming maximum smoothness).is the minimum root mean square error.
References
- Goyal, B.; Dogra, A.; Agrawal, S.; Sohi, B.; Sharma, A. Image denoising review: From classical to state-of-the-art approaches. Inf. Fusion 2020, 55, 220–244. [Google Scholar] [CrossRef]
- Bruckstein, A.; Lindenbaum, M.; Fischer, M. On gabor contribution to image enhancement. Comput. Methods Programs Biomed. 1994, 27, 1–8. [Google Scholar]
- Malik, J.; Perona, P. Scale space and edge detection using anisotropic diffusion. IEEE Trans. Pattern Anal. 1990, 12, 629–639. [Google Scholar]
- Catté, F.; Lions, P.L.; Morel, J.M.; Coll, T. Image selective smoothing and edge detection by nonlinear diffusion. J. Numer. Anal. 1992, 29, 845–866. [Google Scholar] [CrossRef]
- Hosotani, F.; Inuzuka, Y.; Hasegawa, M.; Hirobayashi, S.; Misawa, T. Image Denoising With Edge-Preserving and Segmentation Based on Mask NHA. IEEE Trans. Image Process. 2015, 24, 6025–6033. [Google Scholar] [CrossRef] [PubMed]
- Yaroslavsky, L. Digital Picture Processing—An Introduction; Springer: Berlin/Heidelberg, Germany, 1985. [Google Scholar]
- Manduchi, R.; Tomasi, C. Bilateral filtering for gray and color images. In Proceedings of the Sixth International Conference on Computer Vision, Bombay, India, 7 January 1998; pp. 839–846. [Google Scholar]
- Chatterjee, P.; Milanfar, P. patch-based near optimal image denoising. IEEE Trans. Image Process. 2012, 21, 1635–1649. [Google Scholar] [CrossRef] [PubMed]
- Walker, J.S.; Chen, Y.J. Image Denoising Using Tree-based Wavelet Subband Correlations and Shrinkage. Opt. Eng. 2000, 39, 2900–2908. [Google Scholar]
- Tessens, L.; Pizurica, A.; Alecu, A.; Munteanu, A.; Philips, W. Context adaptive image denoising through modeling of curvelet domain statistics. J. Electron. Imaging 2008, 17, 033021. [Google Scholar] [CrossRef]
- Taswell, C. Experiments in Wavelet Shrinkage Denoising. J. Comput. Methods Sci. Eng. 2001, 1, 315–326. [Google Scholar] [CrossRef] [Green Version]
- Starck, J.L.; Canduesy, E.J.; Donoho, D.L. The Curvelet Transform for Image Denoising. IEEE Trans. Image Process. 2002, 11, 670–684. [Google Scholar] [CrossRef] [Green Version]
- Pesquet, J.C.; Benyahia, A.B.; Chaux, C. A SURE Approach for Digital Signal/Image Deconvolution Problems. IEEE Trans. Signal Process. 2009, 57, 4616–4632. [Google Scholar] [CrossRef]
- Patil, S.S.; Patil, A.B.; Deshmukh, S.C.; Chavan, M.N. Wavelet Shrinkage Techniques for Images. Int. J. Comput. Appl. 2010, 7, 975–8887. [Google Scholar] [CrossRef]
- Gao, L.; Wang, G.; Liu, J. Image denoising based on edge detection and pre thresholding Wiener filtering of multi-wavelets fusion. Int. J. Wavelets Multiresolut. Inf. Process. 2015, 13, 1550031. [Google Scholar] [CrossRef]
- Buades, A.; Coll, B.; Morel, J.M. On image denoising methods. In Tech. Note, CMLA; Research Center for Applied Maths, Universite Paris-Saclay: Paris, France, 2004; Volume 5. [Google Scholar]
- Buades, A.; Coll, B.; Morel, J.M. A Review of Image Denoising Algorithms, with a New One. Multiscale Model. Simul. 2005, 4, 490–530. [Google Scholar] [CrossRef]
- Seo, H.J.; Chatterjee, P.; Takeda, H.; Milanfar, P. A Comparison of Some State of the Art Image Denoising Methods. In Proceedings of the Conference Record of the Forty-First Asilomar Conference on Signals, Systems and Computers, Pacific Grove, CA, USA, 4–7 November 2007; pp. 518–522. [Google Scholar]
- Blu, T.; Luisier, F. The SURE-LET approach to image denoising. IEEE Trans. Image Process. 2007, 16, 2778–2786. [Google Scholar] [CrossRef] [Green Version]
- Chen, G.Y.; Kegl, B. Image denoising with complex ridgelets. Pattern Recognit. 2007, 40, 578–585. [Google Scholar] [CrossRef]
- Alkinani, M.H.; El-Sakka, M.R. Patch-based models and algorithms for image denoising: A comparative review between patch-based images denoising methods for additive noise reduction. EURASIP J. Image Video Process. 2017, 2017, 58. [Google Scholar] [CrossRef]
- Naveed, K.; Shaukat, B.; Ehsan, S.; Mcdonald-Maier, K.D.; ur Rehman, N. Multiscale image denoising using goodness-of-fit test based on EDF statistics. PLoS ONE 2019, 14, e0216197. [Google Scholar] [CrossRef]
- Bnou, K.; Raghay, S.; Hakim, A. A wavelet denoising approach based on unsupervised learning model. EURASIP J. Adv. Signal Process. 2020, 2020. [Google Scholar] [CrossRef]
- Jain, P.; Tyagi, V. A survey of edge-preserving image denoising methods. Inf. Syst. Front. 2016, 18, 159–170. [Google Scholar] [CrossRef]
- Pizurica, A. Image Denoising Algorithms: From Wavelet Shrinkage to Non-local Collaborative Filtering. Wiley Encycl. Electr. Electron. Eng. 2017, 10. [Google Scholar] [CrossRef]
- Chandrajit Pal, A.C.; Ghosh, R. A Brief Survey of Recent Edge-Preserving Smoothing Algorithms on Digital Images. arXiv 2015, arXiv:1503.07297. [Google Scholar]
- Mallat, S. A Wavelet Tour of Signal Processing, 2nd ed.; Academic Press: Cambridge, MA, USA, 1998. [Google Scholar]
- Grossmann, A.; Morlet, J. Decomposition of Hardy Functions into Square Integrable Wavelets of Constant Shape. SIAM J. Math. Anal. 1984, 15, 723–736. [Google Scholar] [CrossRef]
- Sendur, L.; Selesnick, I.W. Bivariate shrinkage functions for wavelet-based denoising exploiting interscale dependency. IEEE Trans. Signal Process. 2002, 50, 2744–2756. [Google Scholar] [CrossRef] [Green Version]


| House | Lena | ||||||
|---|---|---|---|---|---|---|---|
| Sigma | Input (dB) | SSplit (dB) | Δ | Sigma | Input (dB) | SSplit (dB) | Δ |
| 15 | 24.61 | 31.50 | ≈6 | 15 | 24.61 | 32.08 | ≈7 |
| 20 | 22.11 | 29.93 | ≈7 | 20 | 22.11 | 30.80 | ≈8 |
| 25 | 20.17 | 29.09 | ≈8 | 25 | 20.17 | 29.98 | ≈9 |
| 30 | 18.59 | 28.89 | ≈10 | 30 | 18.59 | 29.09 | ≈10 |
| 35 | 17.25 | 27.85 | ≈10 | 35 | 17.25 | 28.43 | ≈11 |
| Pepper | Hand | ||||||
| Sigma | Input (dB) | SSplit (dB) | Δ | Sigma | Input (dB) | SSplit (dB) | Δ |
| 15 | 24.61 | 29.34 | ≈5 | 15 | 24.61 | 28.77 | ≈4 |
| 20 | 22.11 | 29.53 | ≈7 | 20 | 22.11 | 28.13 | ≈6 |
| 25 | 20.17 | 28.89 | ≈8 | 25 | 20.17 | 27.74 | ≈7 |
| 30 | 18.59 | 28.79 | ≈9 | 30 | 18.59 | 27.13 | ≈8 |
| 35 | 17.25 | 28.05 | ≈10 | 35 | 17.25 | 26.39 | ≈9 |
| Sigma | Input (dB) | SURE-LET (dB) | Sureshrink | Visu Shrink | Bivariate Shrinkage | SSplit (dB) |
|---|---|---|---|---|---|---|
| 15 | 24.65 | 32.17 | 31.59 | 27.48 | 32.06 | 32.08 |
| 20 | 22.14 | 30.94 | 30.22 | 26.46 | 30.73 | 30.81 |
| 25 | 20.17 | 30.03 | 29.14 | 25.67 | 29.81 | 29.97 |
| 30 | 18.62 | 29.32 | 28.38 | 25.14 | 28.94 | 29.11 |
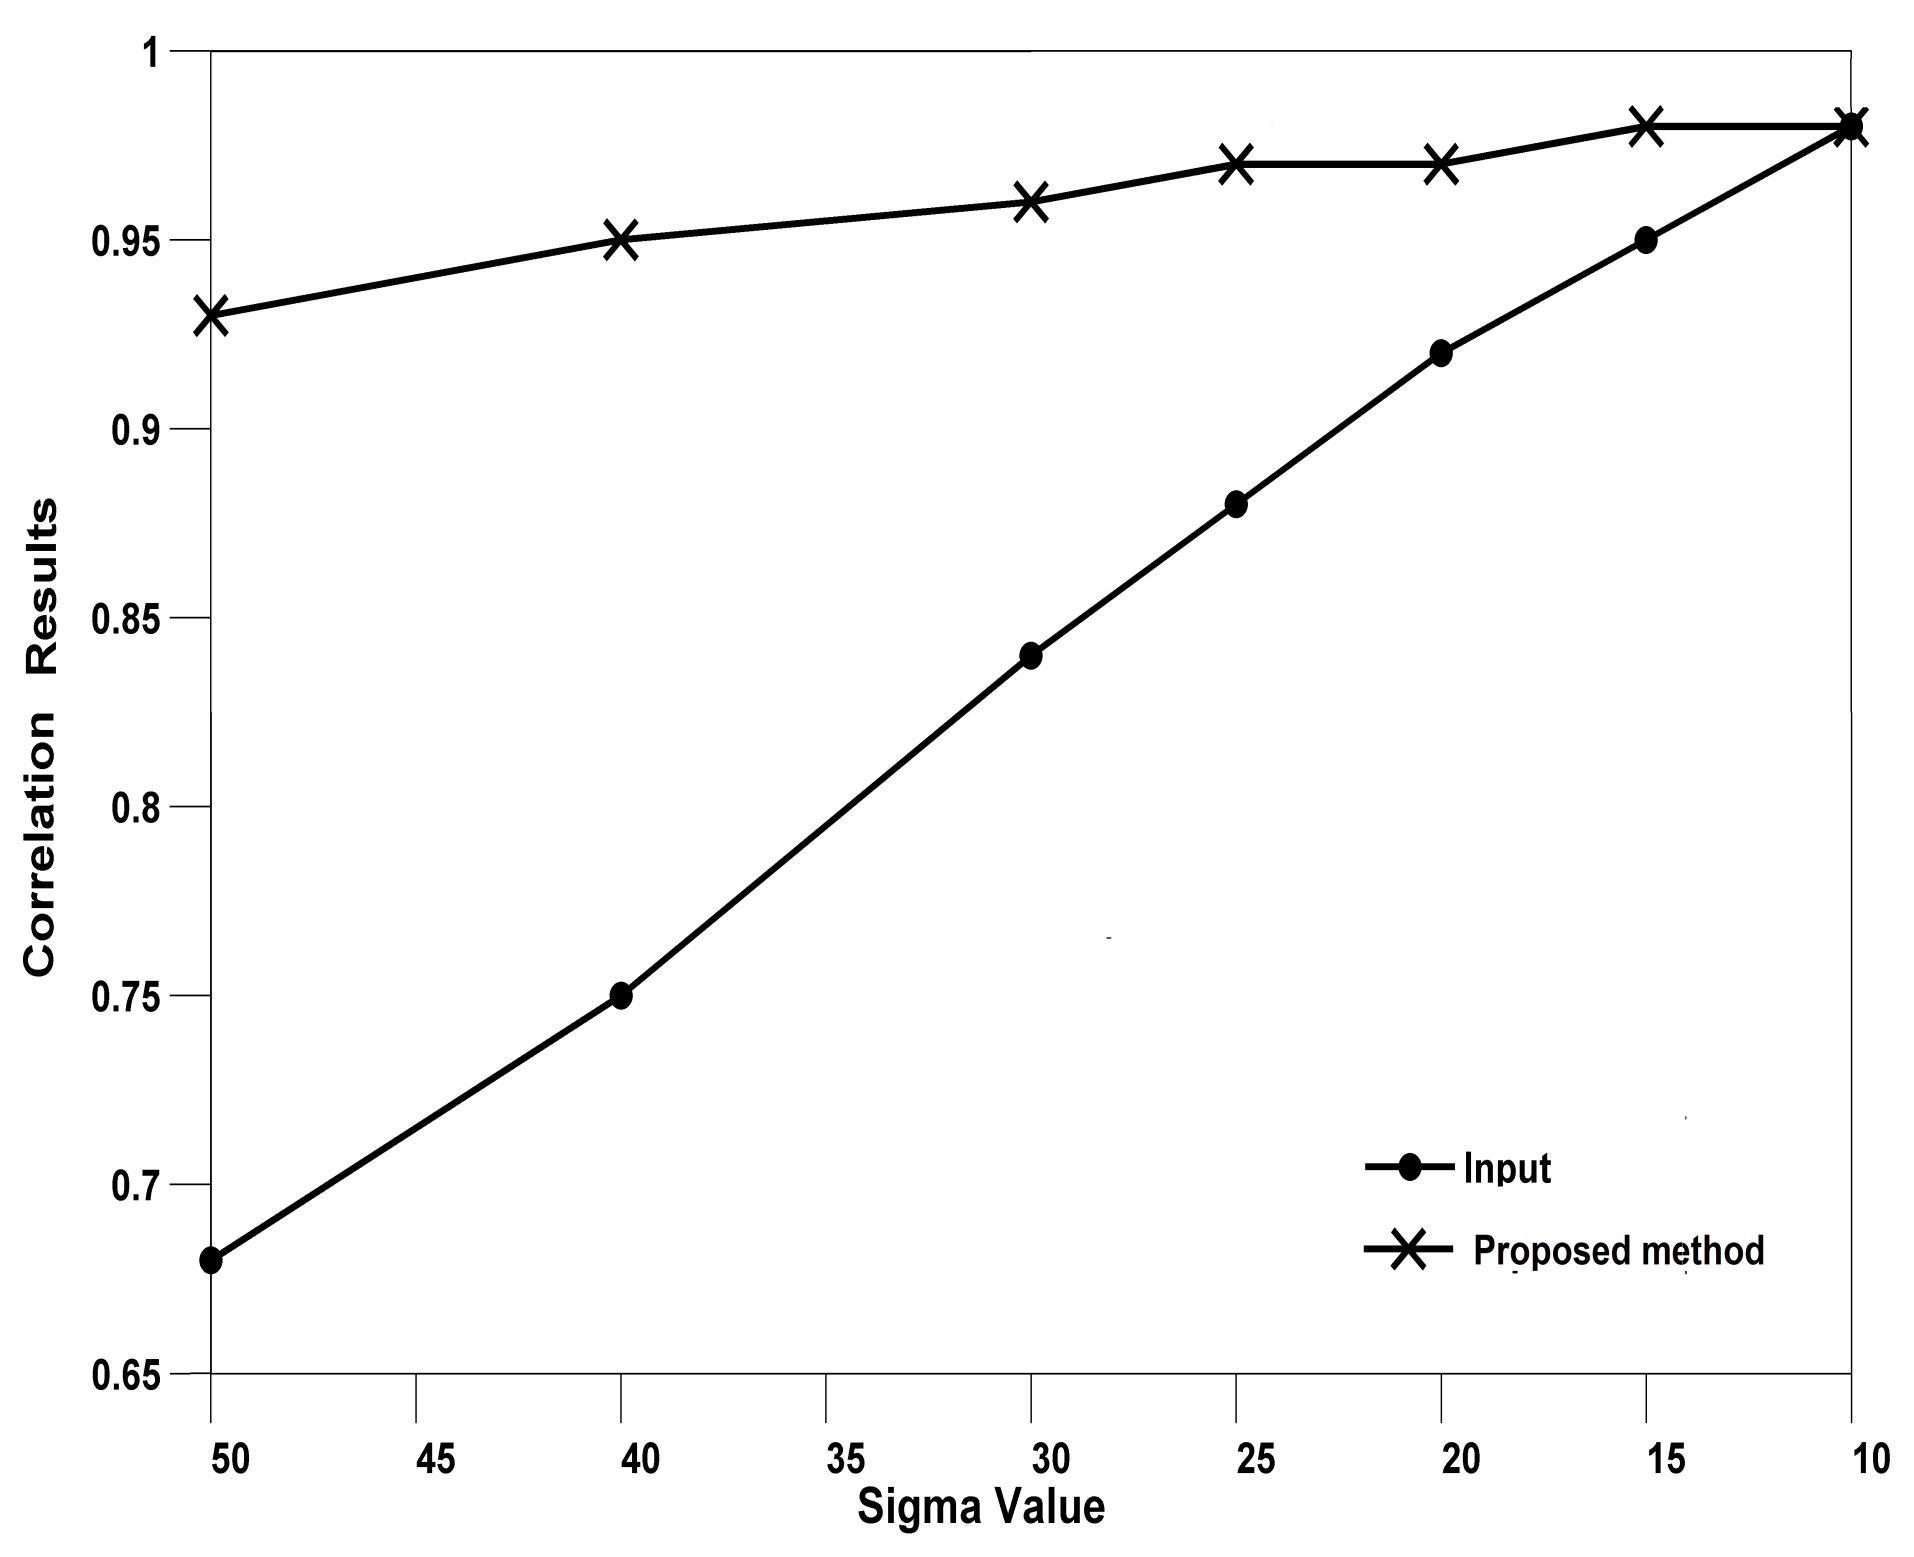
| Sigma | Input | SURE-LET | Bishrink | NeighSure | SSplit |
|---|---|---|---|---|---|
| 10 | 0.53 | 0.66 | 0.58 | 0.60 | 0.63 |
| 20 | 0.34 | 0.53 | 0.47 | 0.50 | 0.58 |
| 30 | 0.246 | 0.46 | 0.42 | 0.43 | 0.45 |
| 40 | 0.18 | 0.414 | 0.37 | 0.39 | 0.41 |
| 50 | 0.14 | 0.37 | 0.33 | 0.35 | 0.36 |
| Sigma | Input | SURE-LET | Bishrink | NeighSure | SSplit |
|---|---|---|---|---|---|
| 10 | 0.56 | 0.73 | 0.49 | 0.57 | 0.69 |
| 20 | 0.37 | 0.61 | 0.41 | 0.43 | 0.58 |
| 30 | 0.27 | 0.54 | 0.37 | 0.38 | 0.53 |
| 40 | 0.21 | 0.49 | 0.33 | 0.35 | 0.44 |
| 50 | 0.16 | 0.44 | 0.31 | 0.32 | 0.42 |
Publisher’s Note: MDPI stays neutral with regard to jurisdictional claims in published maps and institutional affiliations. |
© 2021 by the authors. Licensee MDPI, Basel, Switzerland. This article is an open access article distributed under the terms and conditions of the Creative Commons Attribution (CC BY) license (https://creativecommons.org/licenses/by/4.0/).
Share and Cite
Jalil, B.; Jalil, Z.; Fauvet, E.; Laligant, O. Edge-Preserving Image Denoising Based on Lipschitz Estimation. Appl. Sci. 2021, 11, 5126. https://doi.org/10.3390/app11115126
Jalil B, Jalil Z, Fauvet E, Laligant O. Edge-Preserving Image Denoising Based on Lipschitz Estimation. Applied Sciences. 2021; 11(11):5126. https://doi.org/10.3390/app11115126
Chicago/Turabian StyleJalil, Bushra, Zunera Jalil, Eric Fauvet, and Olivier Laligant. 2021. "Edge-Preserving Image Denoising Based on Lipschitz Estimation" Applied Sciences 11, no. 11: 5126. https://doi.org/10.3390/app11115126
APA StyleJalil, B., Jalil, Z., Fauvet, E., & Laligant, O. (2021). Edge-Preserving Image Denoising Based on Lipschitz Estimation. Applied Sciences, 11(11), 5126. https://doi.org/10.3390/app11115126