Abstract
Beyond 5G networks will be fundamental towards enabling sustainable mobile communication networks. One of the most challenging scenarios will be met in ultra-dense networks that are deployed in densely populated areas. In this particular case, mobile network operators should benefit from new assessment metrics and data science tools to ensure an effective management of their networks. In fact, incorporating architectures allowing a cognitive network management framework could simplify processes and enhance the network’s performance. In this paper, we propose the use of composite indicators based on key performance indicators both as a tool for a cognitive management of mobile communications networks, as well as a metric which could successfully integrate more advanced user-centric measurements. Composite indicators can successfully synthesize and integrate large amounts of data, incorporating in a single index different metrics selected as triggers for autonomous decisions. The paper motivates and describes the use of this methodology, which is applied successfully in other areas with the aim of ranking metrics to simplify complex realities. A use case that is based on a universal mobile telecommunications system network is analyzed, due to technology simplicity and scalability, as well as the availability of key performance indicators. The use case focuses on analyzing the fairness of a network over different coverage areas as a fundamental metric in the operation and management of the networks. To this end, several ranking and visualization strategies are presented, providing examples of how to extract insights from the proposed composite indicator.
1. Introduction
Mobile data traffic growth has been leading the evolution of mobile communications standards up to the recent finalization of the 3rd Generation Partnership Project (3GPP) Release 16 [1,2]. Enhanced mobile broadband (eMBB), massive machine-type communications (mMTC), and ultra reliable low latency communications (URLLC) are the three main pillars that classify the full set of key performance indicators (KPIs) [3] in the Fifth generation (5G) of mobile communication networks [4]. This standard includes a wide range of applications, some of them very demanding in terms of capacity and latency (e.g., virtual reality), and it extends to vertical sectors, such as automated factories, energy grids, connected vehicles, etc.
Mobile communications standards are at the core of the Information and Communication Technologies (ICTs) and, hence, they are fundamental towards achieving the sustainable development goals (SDGs), as established in the 2030 Agenda [5]. In fact, standardization of beyond 5G networks should target the reduction of global greenhouse gas emissions and contribute within the whole ICTs framework to keep the carbon emission levels in vertical sectors as in 2015, as supported by the Global e-Sustainability Initiative (GeSI) (http://gesi.org/). The aim is to reduce the increasing effect of global connectivity and Internet usage on the global energy consumption.
One of the largest challenges will be met in densely populated areas, since the capacity of mobile communications networks will be easily reached. United Nations predictions establish that, by 2050, 70% of the world’s population will be concentrated in densely populated urban areas. In fact, half of humanity (3.5 billion people) lives in cities today and five-billion people are projected to live in cities by 2030. SDGs define several lines of action regarding this scenario. In particular, Goal 11 “sustainable cities and communities” has been proposed in order to tackle this problem, and it is within this Goal, where the smart city paradigm, which is intertwined with beyond 5G communication technologies, becomes of paramount importance. ICTs are then the key in order to ensure a minimum quality of life for citizenship, allowing for the development of affordable and sustainable infrastructures and services.
Smart cities require a dense deployment of sensing nodes or access points in order to gather the massive amount of data that are needed to perform the different applications based on the Internet of Things (IoT). Ultra-dense networks are foreseen from the point of view of mobile communications networks [6]. Ultra-dense networks, which can be seen as a densification of heterogeneous networks, are key in 5G cellular network technology [7]. Heterogeneous networks stood as the natural evolution of homogeneous macrocell-based networks, and they have been traditionally defined as the deployment of small cells (femtocells, picocells, relays, or remote radio heads) in the same geographical area as regular macrocells [8]. Unlike macrocell base stations, small base stations are not regularly spaced; instead, they are scattered over the macrocell network.
Traditional metrics for measuring and comparing the performance of different designs and technologies in homogeneous networks are the coverage probability and spectral efficiency. However, the particular features of ultra-dense networks support the use of metrics, such as user rate distribution or area spectral efficiency [8]. When evaluating the performance of a given technological solution for mobile communications networks, the main focus is in how capacity achieving this is. However, fairness is a fundamental concept from the point of view of the operation and management of the networks [9], which addresses from the allocation and supply of resources to users [10], to the balance between different communication layers. Hence, fairness is an important input for obtaining a sustainable usage of ultra-dense networks in densely populated areas.
Recent 5G standards and beyond 5G research items introduce softwarization, programmability, and virtualization at different layers of the network in order to enable the optimization of global performance, efficiency, automation, and security. Thanks to this new enablers, there is a huge flexibility potential, which paves the way for a cognitive management of mobile communications networks, including the aspects of self-optimization and self-reconfiguration, which are fundamental in ultra-dense networks. However, aspects, such as the mobility of 5G users, which depends on human behavior, increase the dynamics of the network (connection to different antennas, for example), complicating its optimal management. Recently, [11] explores the calculation of advanced spatial metrics, which can be combined with other KPIs, in order to create composed metrics that are used to enhance the dynamic placement of services. In the scenario of a smart city with an ultra-dense deployment of mobile communications networks, a cognitive network management framework is fundamental, in such a way that the monitoring and calculation of real time metrics drive an autonomous decision-making framework. Reference [11] compiles and classifies references in the field of defining performance metrics to launch autonomous behaviors in cognitive network management. These metrics include KPIs and parameters that are related to resources, network functionalities, wireless, or service metrics.
1.1. Introducing Composite Indicators
In this paper, we explore the use of composite indicators as a tool for cognitive management of mobile communications networks, with the aim of evaluating the performance of a network in terms of fairness among clusters of cells, as a first step towards achieving more sustainable infrastructures in the smart city framework. The objective of the paper is to motivate and apply the methodology for the construction of composite indicators in an analysis of a mobile communications network under selected scenarios. Network KPIs are the set of variables that are used in the paper as data to build the composite indicators. In our case, KPIs will be selected following the proposed methodology, in order to cover the main features of the network.
Composite indicators have been used as a ranking metric in areas, such as human development [12], global competitiveness [13], or ocean health [14]. Basically, these indicators are the result of a mathematical combination of a set of variables and they help in simplifying complex realities in order to assist decision making processes. On the one hand, composite indicators can successfully synthesize and integrate large amounts of data, and hence, advanced data science software tools are already available to apply this methodology. This particular feature positions composite indicators and the underlying methodology as an interesting tool in future beyond 5G networks, since they may be able to incorporate in a single index the different metrics that were proposed as triggers for autonomous decisions. Mobile network operators (MNO) can then properly weight each one of the metrics following the proposed methodology according to their optimization schemes and business interests. In this case, the composite indicator could serve as a first step, indicating whether a more advanced solution needs to be met. Note that this process could help reducing complexity with an increasing size of the topology, which is one of the drawbacks that calculation of this type of metrics faces. As shown in [15], there are already architectures which allow for data normalization or aggregation towards achieving higher level metrics, which are fundamental steps in the proposed methodology. On the other hand, as described in [16], there is a need to find a flexible methodology that can deal with the fast rate of service changes and the constant technology evolution, as well as to define new user-centric KPIs that could help in linking network KPIs with the end user Quality of Experience (QoE). The Hotspot score is a current solution to rank sectors within a network, but it is really dependent on equipment vendors, operators, and the expertise built over the years. Our aim in this paper is to propose the composite indicator’s methodology as a valid framework for dealing with this challenge.
Traditional network-centric KPIs have been used in advanced mathematical optimization problems, such as in [17], for example, where the aim is to obtain a multi-criteria based on KPIs to recover the coverage map of a cellular network. However, industry and academy have both been discussing the need for shifting from network-centric KPIs to user-centric KPIs [18], as a bridge that could help in linking KPIs with the end user Quality of Experience (QoE) [16,19,20,21,22,23]. Reference [16] explores how to obtain an index outperforming the Hotspot score, by introducing data driven tools that could automate the current empirically-based process. In [19,20], data are gathered from the users in order to establish the correlation between the users’ perception and the actual performance of the network. Note that references [16,19,20] do actually have access to massive MNO data. In [21], radio KPIs are combined with user end-to-end performance metrics by introducing the mean opinion score (MOS). The aim is to provide application developers with useful information in order to link network KPIs and user experience. Reference [22] discusses the need for shifting towards user-centric KPIs and provides an applicability example that is based on real measurements from a 3G/4G customer. Finally, the work that is presented in [23] concludes that there is a need to define new downlink-throughput related KPIs for effectively integrating the analysis of the end user QoE. Interestingly, the methodology that is proposed in this paper can perfectly encompass these advanced user-centric schemes, as it will be shown later in Section 3.6, demonstrating its flexibility and generality.
1.2. Contributions
The contributions of this work can be summarized, as follows:
- a flexible methodology based on ten steps to define composite indicators for cognitive management of mobile communications networks is proposed;
- KPIs are used as input data to construct the composite indicator;
- indications about how to tailor each step are given for a use case based on Universal Mobile Telecommunications System (UMTS) networks;
- composite indicators are obtained for different scenarios and objectives assuming clusters of cells based on coverage area; and,
- different visualization strategies are applied as an example of how to extract useful insights from the derived composite indicators.
The remainder of the paper is organized, as follows. Section 2 presents the methodology and a brief discussion regarding KPIs, while Section 3 applies the methodology to a UMTS-based use case. Different visualizations of the results are presented and discussed in Section 4, and conclusions are drawn in Section 5.
2. Methodology and Data Selection
Composite indicators can assist decision-making and monitoring processes, due to their ability to obtain a simplified concept by aggregating several dimensions of a single process. These indicators need to be robust, since they rely on statistical parameters. In this paper, we follow the methodology that was proposed by the Competence Center on Composite Indicators and Scoreboards (JRC-COIN) [24], coordinated by the Joint Research Center (JRC) from the European Commission. The JRC is a service that provides independent scientific evidence in order to support the European Commission policies.
The JRC-COIN and the Organization for Economic Co-operation and Development (OECD) published a Handbook [25], with the aim of guiding the construction and use of composite indicators. Basically, the Handbook recommends following an iterative process of 10 steps, which are summarized in the following.
- Step 1:
- Theoretical framework. It establishes the basis for the selection and combination of variables. It is important to develop a clear definition of the multidimensional process to be measured, as well as the added-value of the composite indicator.
- Step 2:
- Data selection. This step covers the analytical correctness, the coverage, relevancem and how quantifiable are the indicators with respect to the process under measurement.
- Step 3:
- Multivariate analysis. It checks the structure and coherence of the data set and supports the choice of method for data aggregation. This analysis is usually done by applying techniques, such as principal components analysis, Cronbach coefficient alpha, and cluster analysis.
- Step 4:
- Imputation of missing data. Missing values can distort the outcome of the composite indicator. Methods that are used to deal with this issue are data deletion, mean substitution, regression, multiple imputation, nearest neighbor, or ignore them, among others.
- Step 5:
- Normalization. Normalization is the step that ensures that indicators are using a common basis. The data properties and the objective of the composite indicator should be carefully considered. Some methods apply truncation of extreme values or functional transformations before applying the actual normalization technique. Ranking, standardization, min-max, methods that are based on distance, categorical scale, indicators above or below the mean, or cyclical indicators are some of the methods that are used at this step.
- Step 6:
- Weighting. There is no standard methodology for weighting the individual indicators before aggregating them in order to obtain the composite indicator. Some of the methods that are commonly used are the equal weights option or methods based on statistical models (principal components analysis, data envelopment, regression, or unobserved components models) or based on expert opinion (budget allocation, public opinion, analytic hierarchy process, or conjoint analysis).
- Step 7:
- Aggregating indicators. In the aggregation step, the most applied techniques are based on additive methods. Other aggregation methods can be applied, such as geometric aggregations or non compensatory multi-criteria analysis.
- Step 8:
- Sensitivity analysis. This step tries to increase the transparency of the composite indicator. The sensitivity analysis measures the dependency of the composite indicator with respect to the available information, and it is closely related to uncertainty analysis.
- Step 9:
- Link to other measures. In this step, the correlation with other indicators or indexes is measured.
- Step 10:
- Visualization. The final step consists of presenting the results of the composite indicator in such a way that clear messages are delivered for decision-making processes.
In our case, basic variables will be KPIs, which are usually derived aiming at a given network optimization target that is defined by MNO. Several inputs are available to build KPIs, such as cumulative counters, constant values, time counters, percentages, or even previously stored KPIs. Usually, KPIs are defined by mathematical expressions that involve sums, divisions, or percentages [26]. There can be correlation between KPIs or even to elements in the network topology. The correlation to a part of the network topology is referred to as aggregation level. KPIs definitions and requirements can be found in [3,27,28] for Release 16, for example. KPIs are arranged in six categories, namely, accessibility, retainability, integrity, availability, mobility, and energy efficiency.
The main difficulty found when building KPIs is the source of information, which is, the way that the data are filtered and collected. Focusing on the radio access part of the network, three main sources of information can be defined. The drive test methods collect KPIs at sampling points in the region of interest while using a motor vehicle that is equipped with wireless signal receivers. Several sampling methods have been defined and, although the data obtained are reliable and real, KPIs cannot change dynamically with time, sampling points can only be defined in accessible regions and the cost is elevated. Network event counters do not provide a user vision, such as drive tests, but they do offer a global vision of the network. Finally, registering signaling traces between the user and the network assumes that the network elements can gather and forward to upper communication layers a massive amount of data. Note that network event counters and trace analysis are able to extract real-time information in order to assess the performance of the network from the operator point of view.
In the following section, the above steps will be tailored while assuming a UMTS-based mobile communication network and appropriate KPIs will be selected according to the methodology requirements. Our system model comprises a MNO with cells that are clustered according to area coverage. Five clusters are defined, namely, urban macro, suburban, urban micro, rural macro, and rural micro, as shown in Figure 1.
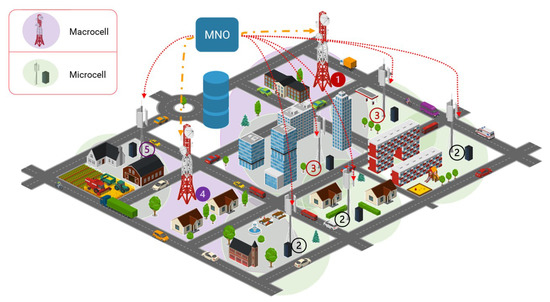
Figure 1.
Mobile network operators (MNO) builds the composite indicator from KPIs of 5 different clusters of cells: urban macro (1), suburban (2), urban micro (3), rural macro (4), and rural micro (5).
3. Use Case: UMTS Networks
In this section, we will develop a use case that is based on UMTS technology, similar to the one shown in [20]. Although we are currently immersed in the race towards Release 17 of 5G, this choice is motivated by the maturity of the technology and the simulation and availability of KPIs [26]. Note that, as pointed out in [16], the exact list of KPIs and their values in 4G or 5G are not usually available, due to their sensitive and vendor-related nature. Some signal or channel related open data sets can be found, for example, in [29,30,31]. Moreover, recent reports show that Third generation (3G) technologies will hold around an 18% share of global mobile connections in 2025, excluding cellular IoT [32]. In regions, such as Sub Saharan Africa, this percentage increases up to 58%. Therefore, solutions adopting 3G technologies in advanced scenarios, such as ultra-dense networks, are justified, especially when targeting sustainable infrastructures, since 3G technologies will remain active in the next decade in large regions of the world. However, the majority of selected KPIs can also be found in 4G technology for the sake of generality.
In the remainder of the section, steps 1 to 9, as presented in Section 2, will be particularized while assuming a UMTS-based network. Visualization (step 10) and a discussion of the results will be provided in Section 4.
3.1. Theoretical Framework
At this point, the basis for the selection of variables is established. As study elements, groups of UMTS cells are generated with different characteristics. Among the KPIs categories, five of them are selected to cover the main features of the network, which is, accessibility (ability of a service to be obtained, within specified tolerances and other conditions), retainability (probability that a service, once obtained, will continue to be provided under given conditions for a given duration), integrity (degree to which a service is provided without excessive impairments), mobility (handover performance), and quality. The added value of the obtained composite indicator is the opportunity to detect trends and patterns from a global vision of the network.
Three levels are considered in the process: (i) individual indicators, which are KPIs that are built based on counters; (ii) thematic indicators, where KPIs are grouped according to the area; and, (iii) the composite indicator.
3.2. Data Selection
In this step, variables for each one of the categories established in the previous step are selected. Note that this selection should seek to maximize the quality of the final result. The variables should be determined following the quality dimensions of relevance (qualitative assessment of the value contributed by the data), interpretability (simplicity of understanding, using and analyzing the data), coherence (consistency of the data; data can be combined in different ways), timeliness (length of time between data availability and the related event), accessibility (conditions in which data are accessed), credibility (confidence in the data), and accuracy (closeness between the values provided and the unknown true values), according to [25].
In this case, basic KPIs that are defined by the 3GPP are determined as variables. In each category, the most representative ones are selected and, in the specific cases of accessibility and retention categories, KPIs that discriminate by service are accounted for in order to evaluate the performance in both voice circuit switched (CS) and packet switched (PS) data. Next, a description of the KPIs established for each category is provided:
- Accessibility
Two KPIs are selected with the aim of breaking down the service between data or voice services. There will be a loss of generality, since this selection does not take into account where accessibility problems remain, nor does it distinguish whether accessibility will be good or bad in the radio resource allocation phase or at the stages of establishment of the radio bearer, congestion, or use of resources. The call setup success rate (CSSR) is the considered KPI, which indicates the percentage of calls that require access from a service, and this is satisfactorily provided. The PS and CS versions are included.
- Retainability
The KPIs that were selected in this category aim to quantify the falls according to the service. Three KPIs are considered, covering the data services (DROP HSPA and DROP R99) and the voice service (DROP CS). The difference between High Speed Packet Access (HSPA) [33] and R99 (Release 99 [34]) is the underlying technology, since R99 was the first 3G version of the standard and HSPA offers better throughput values. With these KPIs, the performance of the network is covered and, in addition, it is possible to differentiate by users (voice services, low data speed, and high data speed).
- Integrity
In this category, throughput is the selected KPI, since it indicates the performance that is achieved by the network. This KPI collects the average throughput of each of the connections that are established in the network. It is defined as the number of bits per second that the user perceives in the network.
- Mobility
Three KPIs that differentiate three different types of mobility are selected: mobility in the same frequency (intra-freq), mobility to a different frequency (inter-freq), and handovers (HO) or transfers to 2G. The corresponding KPIs are INTRA-HO (percentage of HOs in the same frequency between different cells), INTER-HO (percentage of HOs in different frequencies between different cells), and inter-radio access technology (INTER-RAT) HO (percentage of HOs to 2G technology), respectively.
With these KPIs, a global vision of network mobility is achieved, although the vision of mobility by service is lost. This choice is justified, because bad retention values can lead to bad values in mobility, so there is more weight, in that sense, to the other statistical dimension.
- Quality
Two KPIs are considered here. The first one is the ratio between the received energy from the pilot signal chip (Ec) to the noise density (N0), which is, Ec/N0. This KPI provides a measurement of the interference that was measured by the user at a cell level. The second KPI is the received signal code power (RSCP), which indicates whether the average receive signal level is adequate or not. Both of the KPIs are measured in dBm.
Table 1 summarizes the selected KPIs and highlights their match with the requirements that were established by the methodology. The table shows that they fulfill the requirements to be used as variables towards obtaining the composite indicator. Note that the selection is similar to the one that is presented in [20]. Slightly different versions of the selected KPIs are also available in LTE, e.g., INTER-RAT HO in LTE refers to HOs to UMTS technology. Because of this, the extension of the proposed methodology to LTE is straightforward.

Table 1.
Selected variables (KPIs). Fulfilling of requirements according to the methodology.
2
3.3. Multivariate Analysis
As stated in the theoretical framework step, groups or clusters of cells with different characteristics are generated, with similar features within the cells that belong to a cluster, and differences between cells belonging to different clusters. At this point, different criteria to group the cells can be used, e.g., cells can be grouped by area coverage, the type of cell (macrocell, microcell, femtocell, etc.), or scenarios (stadium, railway, etc), among others. It is also possible to group the cells by technology, e.g., 2G, 3G, or 4G. In our use case, the clustering step will not use factor or cluster analysis [25] to group the cells, since categories and variables (KPIs) have been clearly defined in the data selection step. More precisely, the criterion here is to group the cells according to area coverage, and five clusters are defined, namely, urban macro, suburban, urban micro, rural macro, and rural micro.
It has to be pointed out that the object of the paper is not to compare real scenarios, since these KPIs are the property of MNO and it is not allowed to use them externally. Because of this, the value of the variables should not be considered in the strict sense; they have been generated following consistent measurements that can occur in UMTS networks [26].
Data for each cluster are obtained by considering different scenarios in the KPIs included in the quality dimension, which is, the Ec/N0 and the RSCP. In order to avoid bias in the rest of the variables and, thus, conditioning the composite indicator, the rest of variables are generated while using random distributions, obtaining possible values within the range of values that are typical for networks and guaranteed by the manufacturer. Please refer to Appendix A for detailed information on how the variables are simulated for each cluster.
Regarding mobility KPIs, differences between clusters are created while keeping consistency in mind, assuming that the mobility between cells of the same frequency is always more successful than between cells of different frequency or even of different technology. Mobility is determined by the correct definition of neighborhood relations between cells, so bad values may indicate that the cell neighbors are not properly configured for intra-freq, inter-freq, or inter-RAT HOs.
3.4. Missing Data
Problems with missing data will depend on the time interval under consideration and the number of network elements. For the selected KPIs, the calculation already assumes this loss, since they are expressed in percentage.
The proposed missing data allocation algorithm is based on the percentage of data availability time. If this is greater than 90%, then data are just taken. If the data availability is between 70% and 90% of the total time, substitution or regression methods are used in order to complete the data. Finally, if the availability is below 70%, data are discarded. In our case, the missing data are completed by using the mean value of each cluster of cells.
3.5. Normalization
Normalization is required prior to any data aggregation, as the indicators in a data set often have different measurement units. While taking into account that the network can include thousands of cells, a method decreasing the computation time should be used. With this aim, each KPI is divided here by the median of its distribution. Note that the normalization method needs to be consistent with the aggregation step when building the composite indicator. In our case, the geometric method is used, which weights each category so the sum adds to 100.
Applying the geometric method requires positive numbers. Because all of the variables that were considered in each category are either negative or positive, we guarantee that, by dividing them by the median, they are all positive. Moreover, all the variables are centered in 1. Thus, a value that is equal to 1 denotes that it is a KPI above the median, while values below the median will be between 0 and 1, and values above the median will be above 1. As a drawback, the magnitude information of the value is lost with the normalization.
The normalization step allows for establishing rankings in order to compare clusters. For example, in our scenario, clusters of cells could be ranked without valuing the magnitude of KPIs themselves, in a way that a ’good’ cluster and a ’bad’ cluster can be identified, even if all of the clusters show actually a good performance.
3.6. Weighting
Reference [25] includes a compilation of the most used weighting methods, and the compatibility with the most used aggregation methods. In a benchmarking framework, weights can have a considerable effect in the resulting composite indicator, since weights are basically ’value judgments’.
Equal weighting is one of the most used methods when building composite indicators. This weighting method assumes that all of the variables have the same value, but it has the drawback of preventing the identification of a lack of statistical or empirical basis when there is not enough knowledge of the inner structure of the data. In addition, when variables are grouped into dimensions, which are later aggregated into the composite indicator, equal weighting of the variables may introduce unequal weighting of the dimensions, and an unbalanced composite indicator could be obtained.
Ideally, the budget allocation is the most suitable method for weighting in the considered use case, since a group of experts would define what to evaluate based on the MNO’s business models. Network operators could then give more weight to those categories of their interest, or identify optimization strategies in clusters achieving bad performance [16].
A second option would be the public opinion poll. In this case, the user could seamlessly decide which mobile network to connect to based on a questionnaire with simple questions, which would be linked to the statistical dimensions that were included in the composite indicator. For this option, data from MNO should be open, reliable, and accessible. For the sake of sustainable networks, questions addressing the statistical dimension related to it should be included. Note that this second option encompasses the user-centric approaches that were followed in [19,20], for example, since the input data from the users were gathered.
In the use case, two scenarios are simulated. In the first one, an equal weight method is applied, which gives the same weight to all of the categories. In the second one, a public opinion poll is implemented, differentiating between a user interested in a voice service (CS) and a user interested in a data service (PS). Table 2, Table 3 and Table 4 present the weights considered for the categories or the KPIs according to the scenarios.
Table 2.
Equal weight method.
Table 3.
Public opinion, CS user. Variables that are related to voice service are weighted.
Table 4.
Public opinion, PS user. Variables related to data service are weighted.
3.7. Aggregating Indicators, Sensitivity Analysis and Other Measurements
Step 7 is not applied in the considered use case, since no higher order dimensions are defined. Refer to [25] for a discussion on the aggregation methods. The same applies for steps 8 and 9. Regarding step 8, the uncertainty of the composite indicator relies on the number of selected KPIs. Hence, in order to reduce the uncertainty, a large number of KPIs should be considered, then complicating the analysis of the obtained composite indicator. To the best of our knowledge, no similar analysis has been performed before, so it is not possible to correlate the composite indicator with similar indexes, especially because these data are property of MNO and are not available.
4. Results and Visualization
The calculations have been performed while using the statistical software for data science STATA (https://www.stata.com/). Variables (KPIs) for each cluster, scenario and category are created while using the methodology described in Appendix A. Missing data are completed, as referred to in Section 3.4 and KPIs are then normalized, as indicated in Section 3.5 while using the function median. In order to calculate the composite indicator in the equal weight scenario, KPIs in each category are first averaged using the function rowmean. Table 5 shows the values that were obtained for each category. Subsequently, the composite indicator is achieved by applying the weights as indicated in Table 2, which boils down to the following expression:
Table 5.
Values per category.
In the case of the CS and PS scenarios, different weights are applied in order to highlight voice or data services, respectively. According to Table 3, the expression for the indicator in the CS scenario is given by:
while in the PS scenario, it is given by:
Table 6 shows the composite indicator obtained in each cluster according to the different scenarios.
Table 6.
Composite indicator per cluster and scenario.
The composite indicator of cluster 1 obtains the largest value in two out of the three scenarios considered (equal weight and PS), while cluster 5 obtains the smallest value in the three scenarios. Cluster 3 obtains the second smallest value in the equal weight and PS scenarios. Cluster 2 obtains the largest value in the case of the CS scenario.
One of the advantages of composite indicators is the easiness of visualization through the ranking of the results. In the following, different visualization strategies are used in order to extract further insight into the results shown in Table 6.
First, composite indicators values are depicted in Figure 2 while using a line plot where the clusters have been arranged according to the ranking that was obtained in the equal weight scenario. This type of plot allows checking the ranking and possible shifts of positions according to the composite indicator, but it also allows for observing the distances between clusters and between composite indicators when several indicators are built (as it is this case).
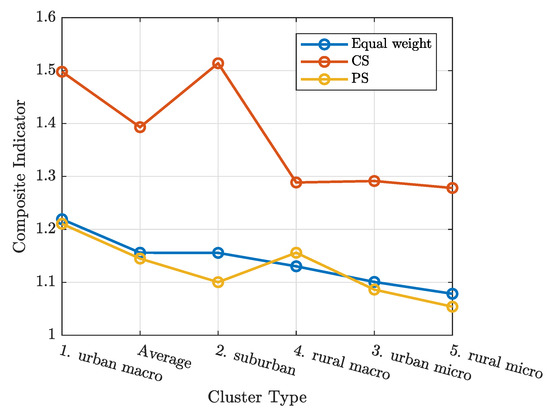
Figure 2.
Composite indicators according to clusters.
Figure 2 shows the robustness of the different clusters versus the considered scenarios. In this way, ranking positions do not significantly change for each scenario. It is clear that a cluster ranking can be established, helping MNO in making decisions for each cluster in order to optimize a given cluster. Note that, not only the position, but also the distance between clusters, should be evaluated here. A similar plot can be obtained arranging the clusters in the CS or PS scenarios, respectively.
A second type of line plot can be obtained by focusing on the rankings for each scenario, as shown in Figure 3. In addition to the three scenarios that were considered in this work, we have tailored the Hotspot score [16] in order to include it as a baseline in the cluster rankings comparison. The Hotspot score is a traditional indicator, which indicates how problematic a given sector (cluster in our case) is. Basically, it is calculated by comparing the KPI value with the thresholds established by the vendors [35]. The higher the score, the more problematic the cluster. Hotspot score results are not separately presented for each service (CS or PS), since we found that the ranking of the clusters remains unaltered after changing the weights. Thus, this score is not sensitive to the specific service, confirming the lack of flexibility that traditional metrics exhibit. Figure 3 shows that, as stated above, cluster ranking in the composite indicator case remains similar for the three scenarios under consideration. This type of plot is useful when a composite indicator is evaluated in different time instants, so the relative position of the clusters can be determined, as well as possible variations. In addition, it is also possible to observe whether this position remains over a given time horizon. Figure 3 exemplifies one key aspect of composite indicators, which is that a ‘bad’ value of a cluster in a given scenario can be ‘disguised’ in other scenarios. That is the case of cluster 2 in the figure, which exhibits a different position in the ranking for each evaluated scenario, ranging from being the worst in the CS case to being the best in the Hotspot.
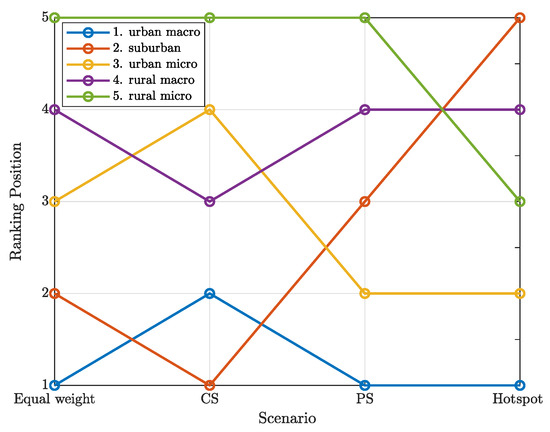
Figure 3.
Cluster ranking according to scenario.
Spider charts are powerful visualization tools in the framework of composite indicators. This tool allows for evaluating the distance of the different composite indicators with respect to an indicator that is built with normalized values. In order to obtain this plot, we can normalize by the average indicator or by the total composite indicator, and evaluate the relative distances that are obtained by each cluster. In a first approach, a normalization by the average indicator is performed by dividing the indicators obtained per cluster by their average indicator (see the values in Table 6), and multiplying by 100. For example, in the case of cluster 1, the normalized value in the equal weight scenario is obtained as . Following this normalization, the average indicator is equal to 100 after normalization.
Table 7 shows the numerical results of this normalization, while Figure 4 plots the corresponding spider chart, clearly indicating the line that is associated to the average indicator. Figure 4 shows that cluster 1 remains far from the average for the three scenarios, although cluster 2 is the one that achieves the largest value in the CS scenario, as seen before. As an example of use of this plot, let us assume a MNO that, in view of these results, decides not to invest in cluster 1 given the good results, shifting to the objective of achieving a network as homogeneous as possible in terms of the composite indicator. However, this result can also confirm the mobile network strategy if optimizing cluster 1 was its objective in the first place. This would be the case for a MNO operating a large city with a large share of the market. In this scenario, it might be of interest to continue investing in cluster 1 in order to keep its dominant position.
Table 7.
Composite indicator using reference to average indicator per cluster. Average indicator = 100.00.
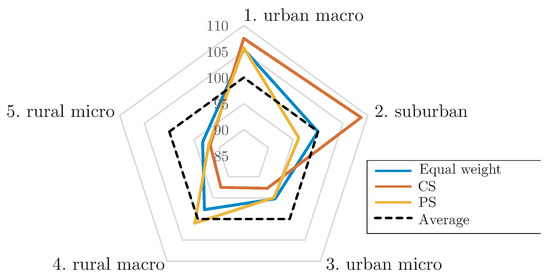
Figure 4.
Composite indicator in the three scenarios taking as a reference the average indicator. Average indicator = 100.00.
Finally, it is also possible to obtain a spider chart, taking, as a reference, a given cluster. As an example, we will obtain the plot assuming that cluster 1 is the reference area, but the procedure is the same for the remaining clusters. By using cluster 1 as a reference, the plot indicates the effort that the remaining clusters need to do in order to reach this cluster’s performance. Table 8 shows the results after normalizing (all of the indicators are divided by the cluster 1 value and multiplied by 100), while Figure 5 depicts the spider chart. In this plot, it is interesting to note the large performance gap between cluster 4 and 5.
Table 8.
Composite indicator obtained normalizing with respect to reference cluster 1 = 100.00.
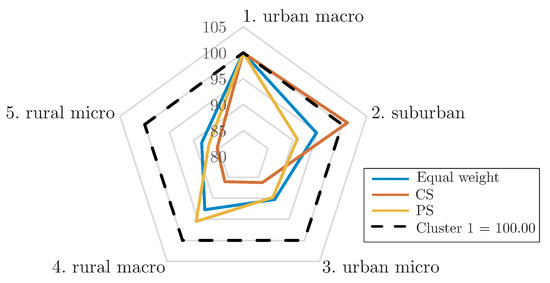
Figure 5.
Composite indicator in the three scenarios taking as a reference cluster 1. Cluster 1 = 100.00.
5. Conclusions
A methodology for building composite indicators is presented in this paper as a flexible tool for mobile communications network management. Key performance indicators are used as input data in order to build the composite indicators, covering the quality dimensions of relevance, interpretability, coherence, timeliness, accessibility, credibility, and accuracy. A Universal Mobile Telecommunications Systems network is considered as a use case, and a total of eleven key performance indicators are selected from the categories of accessibility, retainability, integrity, mobility, and quality. From this set, three different aggregation methods are applied, an equal weight method, a public opinion method that is based on voice service users, and a public opinion method based on data service users. The aim of the use case is to build a composite indicator that could help in assessing the fairness of a mobile communications network when considering different clusters of cells. More precisely, urban macro, suburban, urban micro, rural macro, and rural micro environments are generated. The composite indicators that are obtained in the three aggregation methods are ranked for the five clusters of cells, following different strategies. In addition, visualization tools that are based on spider charts allow for comparing the results normalizing with respect to the average performance, or with respect to a given cluster, enabling the mobile network operator to identify which clusters of cells require a larger investment.
The proposed methodology is able to extract useful insights and it can be extended in order to cover standards, such as LTE, by changing the basic set of key performance indicators. In fact, mobile network operators should decide which key performance indicators to include, according to their business model. As future work, the time dimension will be included in the methodology.
Author Contributions
Conceptualization, C.B.-M.; Data curation, J.S.; Investigation, C.B.-M.; Methodology, C.B.-M. and J.S.; Software, J.S.; Visualization, J.P. and S.R.; Writing—original draft, C.B.-M. and J.P.; Writing—review & editing, J.P. and S.R. All authors have read and agreed to the published version of the manuscript.
Funding
Carmen Botella-Mascarell would like to thank the Generalitat Valenciana (AICO/2020/154 Project). Sandra Roger would like to thank the Spanish Ministry of Science, Innovation and Universities (RYC-2017-22101 Grant), and the Generalitat Valenciana (GV/2020/046 Project).
Data Availability Statement
Statistics to replicate the data are available in the paper.
Conflicts of Interest
The authors declare no conflict of interest. The funders had no role in the design of the study; in the collection, analyses, or interpretation of data; in the writing of the manuscript, or in the decision to publish the results.
Abbreviations
The following abbreviations are used in this manuscript:
| COIN | Competence center on composite indicators and scoreboards |
| CS | Circuit switched |
| CSSR | Call setup success rate |
| eMBB | Enhanced mobile broadband |
| GeSI | Global e-Sustainability Initiative |
| HSPA | High speed packet access |
| ICTs | Information and communication technologies |
| INTER HO | Inter handover |
| INTER-RAT HO | Inter-radio access technology handover |
| INTRA HO | Intra handover |
| IoT | Internet of Things |
| JRC | Joint Research Centre |
| KPIs | Key performance indicators |
| mMTC | Massive machine-type communications |
| MNO | Mobile network operators |
| MOS | Mean opinion score |
| OECD | Organization for economic co-operation and development |
| QoE | Quality of experience |
| RSCP | Received signal code power |
| SDGs | Sustainable development goals |
| UMTS | Universal mobile telecommunications system |
| URLLC | Ultra reliable low-latency communications |
| 3G | Third generation |
| 4G | Fourth generation |
| 5G | Fifth generation |
| 3GPP | 3rd Generation Partnership Project |
Appendix A
In this appendix, the methodology to obtain the statistics for each KPI is detailed. The calculations have been performed using the statistical software for data science STATA (https://www.stata.com/). To generate the KPIs, the minimum KPI values recommended by the manufacturer HUAWEI [35] for an acceptable network performance and a satisfactory quality of service perceived by the user are assumed. Considering these minimum values, we generate a Poisson distribution of lambda value 1 for all KPIs (except for Ec/N0 and RSCP), as it is the distribution that best resembles the characteristic distribution in these cases. The goal is that the probability of having better values is lower as we approach the theoretical maximums. For Ec/N0 and RSCP a Gaussian distribution is generated, with a mean given by the values provided in [35]. Table A1 collects the statistics used when generating the variables (KPIs) for each cluster according to the above methodology.
Table A1.
Statistics of variables (KPIs) according to clusters.
Table A1.
Statistics of variables (KPIs) according to clusters.
| Cluster | KPI | Cells | Mean | Minimum | Maximum |
|---|---|---|---|---|---|
| 1: urban macro | CSSR PS | 5000 | 0.991 | 0.661 | 1.000 |
| CSSR CS | 5000 | 0.998 | 0.808 | 1.000 | |
| DROP HSPA | 5000 | 0.011 | 0.000 | 1.000 | |
| DROP R99 | 5000 | 0.010 | 0.000 | 0.375 | |
| DROP CS | 5000 | 0.008 | 0.000 | 0.500 | |
| THROUGHPUT | 5000 | 1629.887 | 0.000 | 9642.500 | |
| INTRA-HO | 5000 | 0.999 | 0.750 | 1.000 | |
| INTER-HO | 5000 | 0.968 | 0.067 | 1.000 | |
| INTER-RAT HO | 5000 | 0.953 | 0.034 | 1.000 | |
| Ec/N0 | 5000 | −13.728 | −26.403 | −6.227 | |
| RSCP | 5000 | −89.939 | −106.000 | −57.830 | |
| 2: suburban | CSSR PS | 500 | 0.988 | 0.785 | 1.000 |
| CSSR CS | 500 | 0.998 | 0.947 | 1.000 | |
| DROP HSPA | 500 | 0.007 | 0.000 | 0.141 | |
| DROP R99 | 500 | 0.009 | 0.000 | 0.200 | |
| DROP CS | 500 | 0.008 | 0.000 | 0.308 | |
| THROUGHPUT | 500 | 1723.808 | 0.000 | 5709.760 | |
| INTRA-HO | 500 | 0.999 | 0.978 | 1.000 | |
| INTER-HO | 500 | 0.976 | 0.500 | 1.000 | |
| INTER-RAT HO | 500 | 0.947 | 0.500 | 1.000 | |
| Ec/N0 | 500 | −9.658 | −18.860 | −5.840 | |
| RSCP | 500 | −86.942 | −101.65 | −66.661 | |
| 3: urban micro | CSSR PS | 2000 | 0.995 | 0.800 | 1.000 |
| CSSR CS | 2000 | 0.999 | 0.877 | 1.000 | |
| DROP HSPA | 2000 | 0.007 | 0.000 | 0.237 | |
| DROP R99 | 2000 | 0.005 | 0.000 | 0.089 | |
| DROP CS | 2000 | 0.008 | 0.000 | 0.250 | |
| THROUGHPUT | 2000 | 1807.736 | 198.490 | 11167.780 | |
| INTRA-HO | 2000 | 1.000 | 0.979 | 1.000 | |
| INTER-HO | 2000 | 0.989 | 0.214 | 1.000 | |
| INTER-RAT HO | 2000 | 0.978 | 0.250 | 1.000 | |
| Ec/N0 | 2000 | −9.611 | −15.630 | −5.660 | |
| RSCP | 2000 | −89.267 | −104.260 | −75.280 | |
| 4: rural macro | CSSR PS | 1000 | 0.990 | 0.621 | 1.000 |
| CSSR CS | 1000 | 0.998 | 0.893 | 1.000 | |
| DROP HSPA | 1000 | 0.009 | 0.000 | 1.000 | |
| DROP R99 | 1000 | 0.007 | 0.000 | 0.200 | |
| DROP CS | 1000 | 0.007 | 0.000 | 0.250 | |
| THROUGHPUT | 1000 | 1588.249 | 0.000 | 6773.530 | |
| INTRA-HO | 1000 | 0.999 | 0.963 | 1.000 | |
| INTER-HO | 1000 | 0.972 | 0.135 | 1.000 | |
| INTER-RAT HO | 1000 | 0.952 | 0.250 | 1.000 | |
| Ec/N0 | 1000 | −12.086 | −23.400 | −6.804 | |
| RSCP | 1000 | −92.220 | −104.680 | −74.690 | |
| 5: rural micro | CSSR PS | 1500 | 0.991 | 0.426 | 1.000 |
| CSSR CS | 1500 | 0.998 | 0.915 | 1.000 | |
| DROP HSPA | 1500 | 0.006 | 0.000 | 0.101 | |
| DROP R99 | 1500 | 0.009 | 0.000 | 0.333 | |
| DROP CS | 1500 | 0.005 | 0.000 | 0.185 | |
| THROUGHPUT | 1500 | 1671.802 | 0.000 | 5873.350 | |
| INTRA-HO | 1500 | 1.000 | 0.992 | 1.000 | |
| INTER-HO | 1500 | 0.972 | 0.200 | 1.000 | |
| INTER-RAT HO | 1500 | 0.944 | 0.167 | 1.000 | |
| Ec/N0 | 1500 | −10.175 | −19.000 | −5.190 | |
| RSCP | 1500 | −87.533 | −107.865 | −70.848 |
References
- Ericsson. Ericsson Mobility Report. 2020. Available online: https://www.ericsson.com/en/mobility-report/reports/june-2020 (accessed on 20 November 2020).
- 3GPP. Third Generation Partnership Project (3GPP). Release 16. Available online: http://www.3gpp.org/release-16 (accessed on 20 November 2020).
- 3GPP TSG SA. Key Performance Indicators (KPI) for Evolved Universal Terrestrial Radio Access Network (E-UTRAN): Definitions. TS 32.450 V16.0.0. 3GPP, 2020. Available online: https://portal.3gpp.org/desktopmodules/Specifications/SpecificationDetails.aspx?specificationId=2025 (accessed on 20 November 2020).
- 3GPP. Third Generation Partnership Project (3GPP). Release 15. Available online: http://www.3gpp.org/release-15 (accessed on 20 November 2020).
- Sustainable Development Goals. Available online: https://www.un.org/sustainabledevelopment/ (accessed on 20 November 2020).
- Kamel, M.; Hamouda, W.; Youssef, A. Ultra-dense networks: A survey. IEEE Commun. Surv. Tut. 2016, 18, 2522–2545. [Google Scholar] [CrossRef]
- Marsch, P.; Bulakci, O.; Queseth, O.; Boldi, M. 5G System Design: Architectural and Functional Considerations and Long Term Research; Wiley & Sons Ltd.: Hoboken, NJ, USA, 2018. [Google Scholar]
- Andrews, J. Seven ways that HetNets are a cellular paradigm shift. IEEE Commun. Mag. 2013, 51, 136–144. [Google Scholar] [CrossRef]
- Shi, H.; Venkatesha Prasad, R.; Niemegeers, I. Fairness in wireless networks: Issues, measures and challenges. IEEE Commun. Surv. Tut. 2014, 16, 5–24. [Google Scholar]
- Li, J.; Chen, X.; Botella, C.; Svensson, T.; Eriksson, T. Resource allocation for OFDMA systems with multi-cell joint transmission. In Proceedings of the IEEE 13th International Workshop on Signal Processing Advances in Wireless Communications (SPAWC), Cesme, Turkey, 17–20 June 2012; pp. 179–183. [Google Scholar]
- Sanchez-Navarro, I.; Bernal Bernabe, J.; Alcaraz-Calero, J.M.; Wang, Q. Advanced spatial network metrics for cognitive management of 5G networks. Soft Comput. 2020. [Google Scholar] [CrossRef]
- 2019 Human Development Report. Available online: http://hdr.undp.org/en/2019-report (accessed on 20 November 2020).
- Global Competitiveness Report. Available online: https://www.weforum.org/reports/global-competitiveness-report-2019 (accessed on 20 November 2020).
- Ocean Health Index. Available online: http://www.oceanhealthindex.org (accessed on 20 November 2020).
- Neves, P.; Calé, R.; Rui Costa, M.; Parada, C.; Parreira, B.; Alcaraz-Calero, J.; Wang, Q.; Nightingale, J.; Chirivella-Perez, E.; Jiang, W.; et al. The SELFNET Approach for Autonomic Management in an NFV/SDN Networking Paradigm. Int. J. Distrib. Sens. N. 2016. [Google Scholar] [CrossRef]
- Leontiadis, I.; Finamore, A.; Dimopoulos, G.; Papagiannaki, K. The good, the bad, and the KPIs: How to combine performance metrics to better capture underperforming sectors in mobile networks. In Proceedings of the IEEE 33rd International Conference on Data Engineering (ICDE), San Diego, CA, USA, 19–22 April 2017. [Google Scholar]
- Liu, Y.; Huangfu, W.; Zhang, H.; Long, K. Multi-criteria coverage map construction based on adaptive triangulation-induced interpolation for cellular networks. IEEE Access 2019, 7, 80767–80777. [Google Scholar] [CrossRef]
- Liotou, E.; Elshaer, H.; Schatz, R.; Irmer, R.; Dohler, M.; Passas, N.; Merakos, L. Shaping QoE in the 5G ecosystem. In Proceedings of the Seventh International Workshop on Quality of Multimedia Experience (QoMEX), Pilos, Greece, 26–29 May 2015. [Google Scholar]
- Ericsson.Ericsson White Paper. Measuring and Improving Network Performance. 2014. Available online: https://www.ericsson.com/whitepapers (accessed on 20 November 2020).
- Monserrat, J.F.; Alepuz, I.; Cabrejas, J.; Osa, V.; López, J.; García, R.; Domenech, M.J.; Soler, V. Towards user-centric operation in 5G networks. EURASIP J. Wirel. Comm. 2016, 2016, 6. [Google Scholar] [CrossRef]
- Alepuz, I.; Cabrejas, J.; Monserrat, J.F.; Perez, A.G.; Pajares, G.; Gimenez, R. Use of mobile network analytics for application performance design. In Proceedings of the Network Traffic Measurement and Analysis Conference (TMA), Dublin, Ireland, 21–23 June 2017. [Google Scholar]
- Sánchez-González, J.; Sallent, O.; Pérez-Romero, J.; Agustí, R. On extracting user-centric knowledge for personalised Quality of Service in 5G networks. In Proceedings of the IFIP/IEEE Symposium on Integrated Network and Service Management (IM), Lisbon, Portugal, 8–12 May 2017. [Google Scholar]
- Casas, P.; Sackl, A.; Schatz, R.; Janowski, L.; Turk, J.; Irmer, R. On the quest for new KPIs in mobile networks: The impact of throughput fluctuations on QoE. In Proceedings of the IEEE International Conference on Communication Workshop (ICCW), London, UK, 8–12 June 2015. [Google Scholar]
- Competence Centre on Composite Indicators and Scoreboards. Available online: https://composite-indicators.jrc.ec.europa.eu/ (accessed on 20 November 2020).
- Organization for Economic Co-Operation and Development. Handbook on Constructing Composite Indicators. Methodology and User Guide; OECD Publishing: Paris, France; Available online: https://www.oecd.org/els/soc/handbookonconstructingcompositeindicatorsmethodologyanduserguide.htm (accessed on 20 November 2020).
- Kreher, R. UMTS Performance Measurement. A Practical Guide to KPIs for the UTRAN Environment; John Wiley & Sons, Ltd.: England, UK, 2006. [Google Scholar]
- 3GPP TSG SA. Key Performance Indicators (KPI) for Evolved Universal Terrestrial Radio Access Network (E-UTRAN). Requirements. TS 32.451 V16.0.0. 3GPP, 2019. Available online: https://portal.3gpp.org/desktopmodules/Specifications/SpecificationDetails.aspx?specificationId=2026 (accessed on 20 November 2020).
- 3GPP TSG SA. 5G end to end Key Performance Indicators (KPI). TS 28.554 V17.0.0. 3GPP, 2020. Available online: https://portal.3gpp.org/desktopmodules/Specifications/SpecificationDetails.aspx?specificationId=3415 (accessed on 20 November 2020).
- Meixner, B.; Kleinrouweler, J.W.; Cesar, P. 4G/LTE Channel Quality Reference Signal Trace Data Set. In Proceedings of the 9th ACM Multimedia Systems Conference (MMSys), Amsterdam, Netherlands, 12–15 June 2018; pp. 387–392. [Google Scholar]
- Raca, D.; Quinlan, J.J.; Zahran, A.H.; Sreenan, C.J.A. Beyond Throughput: A 4G LTE Dataset with Channel and Context Metrics. In Proceedings of the 9th ACM Multimedia Systems Conference (MMSys), Amsterdam, Netherlands, 12–15 June 2018; pp. 387–392. [Google Scholar]
- Raca, D.; Leahy, D.; Sreenan, C.J.; Quinlan, J.J. Beyond Throughput, The Next Generation: A 5G Dataset with Channel and Context Metrics. In Proceedings of the 11th ACM Multimedia Systems Conference (MMSys), Istanbul, Turkey, 8–11 June 2020. [Google Scholar]
- GSM Association. The Mobile Economy; GSM Association, 2020; Available online: https://www.gsma.com/mobileeconomy/ (accessed on 20 November 2020).
- 3GPP. Third Generation Partnership Project (3GPP). HSPA. Available online: https://www.3gpp.org/technologies/keywords-acronyms/99-hspa (accessed on 20 November 2020).
- 3GPP. Third Generation Partnership Project (3GPP). Release 1999. Available online: https://www.3gpp.org/specifications/releases/77-release-1999 (accessed on 20 November 2020).
- Huawei Technologies Co., Ltd. Huawei RAN KPI for Performance Management; Huawei Technologies Co., Ltd: Shenzhen, China, 2006. [Google Scholar]
Publisher’s Note: MDPI stays neutral with regard to jurisdictional claims in published maps and institutional affiliations. |
© 2020 by the authors. Licensee MDPI, Basel, Switzerland. This article is an open access article distributed under the terms and conditions of the Creative Commons Attribution (CC BY) license (http://creativecommons.org/licenses/by/4.0/).