Article

Detection of Non-Technical Losses Using SOSTLink and Bidirectional Gated Recurrent Unit to Secure Smart Meters

1
Department of Computer Science, COMSATS University Islamabad, Islamabad 44000, Pakistan
2
Department of Electrical Engineering, University of Engineering and Technology Peshawar, Bannu 28100, Pakistan
3
Department of Computer Science, College of Computer, Qassim University, Buraydah 51452, Saudi Arabia
4
BIND Research Group, College of Computer, Qassim University, Buraydah 51452, Saudi Arabia
5
School of Electrical Engineering and Computer Science, National University of Sciences and Technology, Islamabad 44000, Pakistan
6
Department of Computer Science, COMSATS University Islamabad, Wah 47000, Pakistan
7
Department of Computer Science and Engineering, Sejong University, Seoul 05006, Korea
*
Authors to whom correspondence should be addressed.
Appl. Sci. 2020, 10(9), 3151; https://doi.org/10.3390/app10093151
Submission received: 7 April 2020 / Revised: 24 April 2020 / Accepted: 28 April 2020 / Published: 30 April 2020

Abstract

:
Energy consumption is increasing exponentially with the increase in electronic gadgets. Losses occur during generation, transmission, and distribution. The energy demand leads to increase in electricity theft (ET) in distribution side. Data analysis is the process of assessing the data using different analytical and statistical tools to extract useful information. Fluctuation in energy consumption patterns indicates electricity theft. Utilities bear losses of millions of dollar every year. Hardware-based solutions are considered to be the best; however, the deployment cost of these solutions is high. Software-based solutions are data-driven and cost-effective. We need big data for analysis and artificial intelligence and machine learning techniques. Several solutions have been proposed in existing studies; however, low detection performance and high false positive rate are the major issues. In this paper, we first time employ bidirectional Gated Recurrent Unit for ET detection for classification using real time-series data. We also propose a new scheme, which is a combination of oversampling technique Synthetic Minority Oversampling TEchnique (SMOTE) and undersampling technique Tomek Link: “Smote Over Sampling Tomik Link (SOSTLink) sampling technique”. The Kernel Principal Component Analysis is used for feature extraction. In order to evaluate the proposed model’s performance, five performance metrics are used, including precision, recall, F1-score, Root Mean Square Error (RMSE), and receiver operating characteristic curve. Experiments show that our proposed model outperforms the state-of-the-art techniques: logistic regression, decision tree, random forest, support vector machine, convolutional neural network, long short-term memory, hybrid of multilayer perceptron and convolutional neural network.

1. Introduction

In the modern world, electricity utilization is increasing day by day. It is broadly categorized into six main areas. These areas are residential, industrial, commercial, traction, agriculture, and other activities [1]. More than 65% of energy is consumed by residential regions [2]. Traditional grid is replaced with smart grid because it has some limitations, i.e., one-way communication, manual monitoring and restoration, central distribution with few sensors, etc. [3], whereas in smart grid, the information flows in two ways between the utility and the consumer [4,5]. It also helps utilities to produce electricity according to the customer’s needs [6,7,8].
Electricity losses take place during generation, transmission, and distribution. There are two types of losses: technical and non-technical [9]. Technical losses occur in the electrical system by internal actions, for example, problem in the transformer or issue in the transmission lines [10]. Non-technical Losses (NTL) occur in the electrical system by external actions, for example unknown and incorrect flow of electricity, inaccurate meter readings, non-payment of bills by customers, and errors in maintaining database records [11]. Electricity theft is one of the major causes of NTL. There are different types of electricity theft including meter tampering or by passing, smart meter hacking, etc. [12]. Different types of issues take place due to electricity theft like revenue loss, electricity surging, and heavy load on electrical systems [13]. According to Zheng et al. [14], one-hundred million Canadian dollars are wasted every year as a result of electricity theft. This loss of power supply can be enough for 77,000 users for a year.
We have mapped problems with proposed solutions as shown in Table 1.
Recently, many authors proposed different approaches to solve these issues, which are broadly classified into three main categories: Artificial Intelligence (AI) and Machine Learning (ML)-based, State-based, and game theory-based systems. State-based approaches observe the structure in which information is collected from different resources. However, the additional cost of hardware devices is required to implement the model. Moreover, on site inspection is used to detect electricity theft. However, it is not possible to inspect each user within a short period of time. In game theory-based approaches, there is a game between utility and electricity theft [15]. However, these approaches have high False Positive Rate (FPR) and low detection rate. The most challenging problem in game theory based solutions is to defined the rules and interaction between players. On the other hand, the main focus of machine learning and artificial intelligence based systems is to analyze the patterns of real time series data. These systems extract useful information from a dataset by analyzing electricity consumption patterns [16]. Any deviation or changes in the consumption patterns may lead to electricity fraud case or illegal action [17,18]. Additional hardware devices are required to detect theft, and these devices have high maintenance cost. Domain experts are required for data analysis and final decision-making. Therefore, there is a need to develop automated electricity theft detection method to overcome these issues [14]. Figure 1 shows the normal and abnormal consumption of energy in two months (i.e., August and September 2016).
The main contributions of this research are summarized as follows.
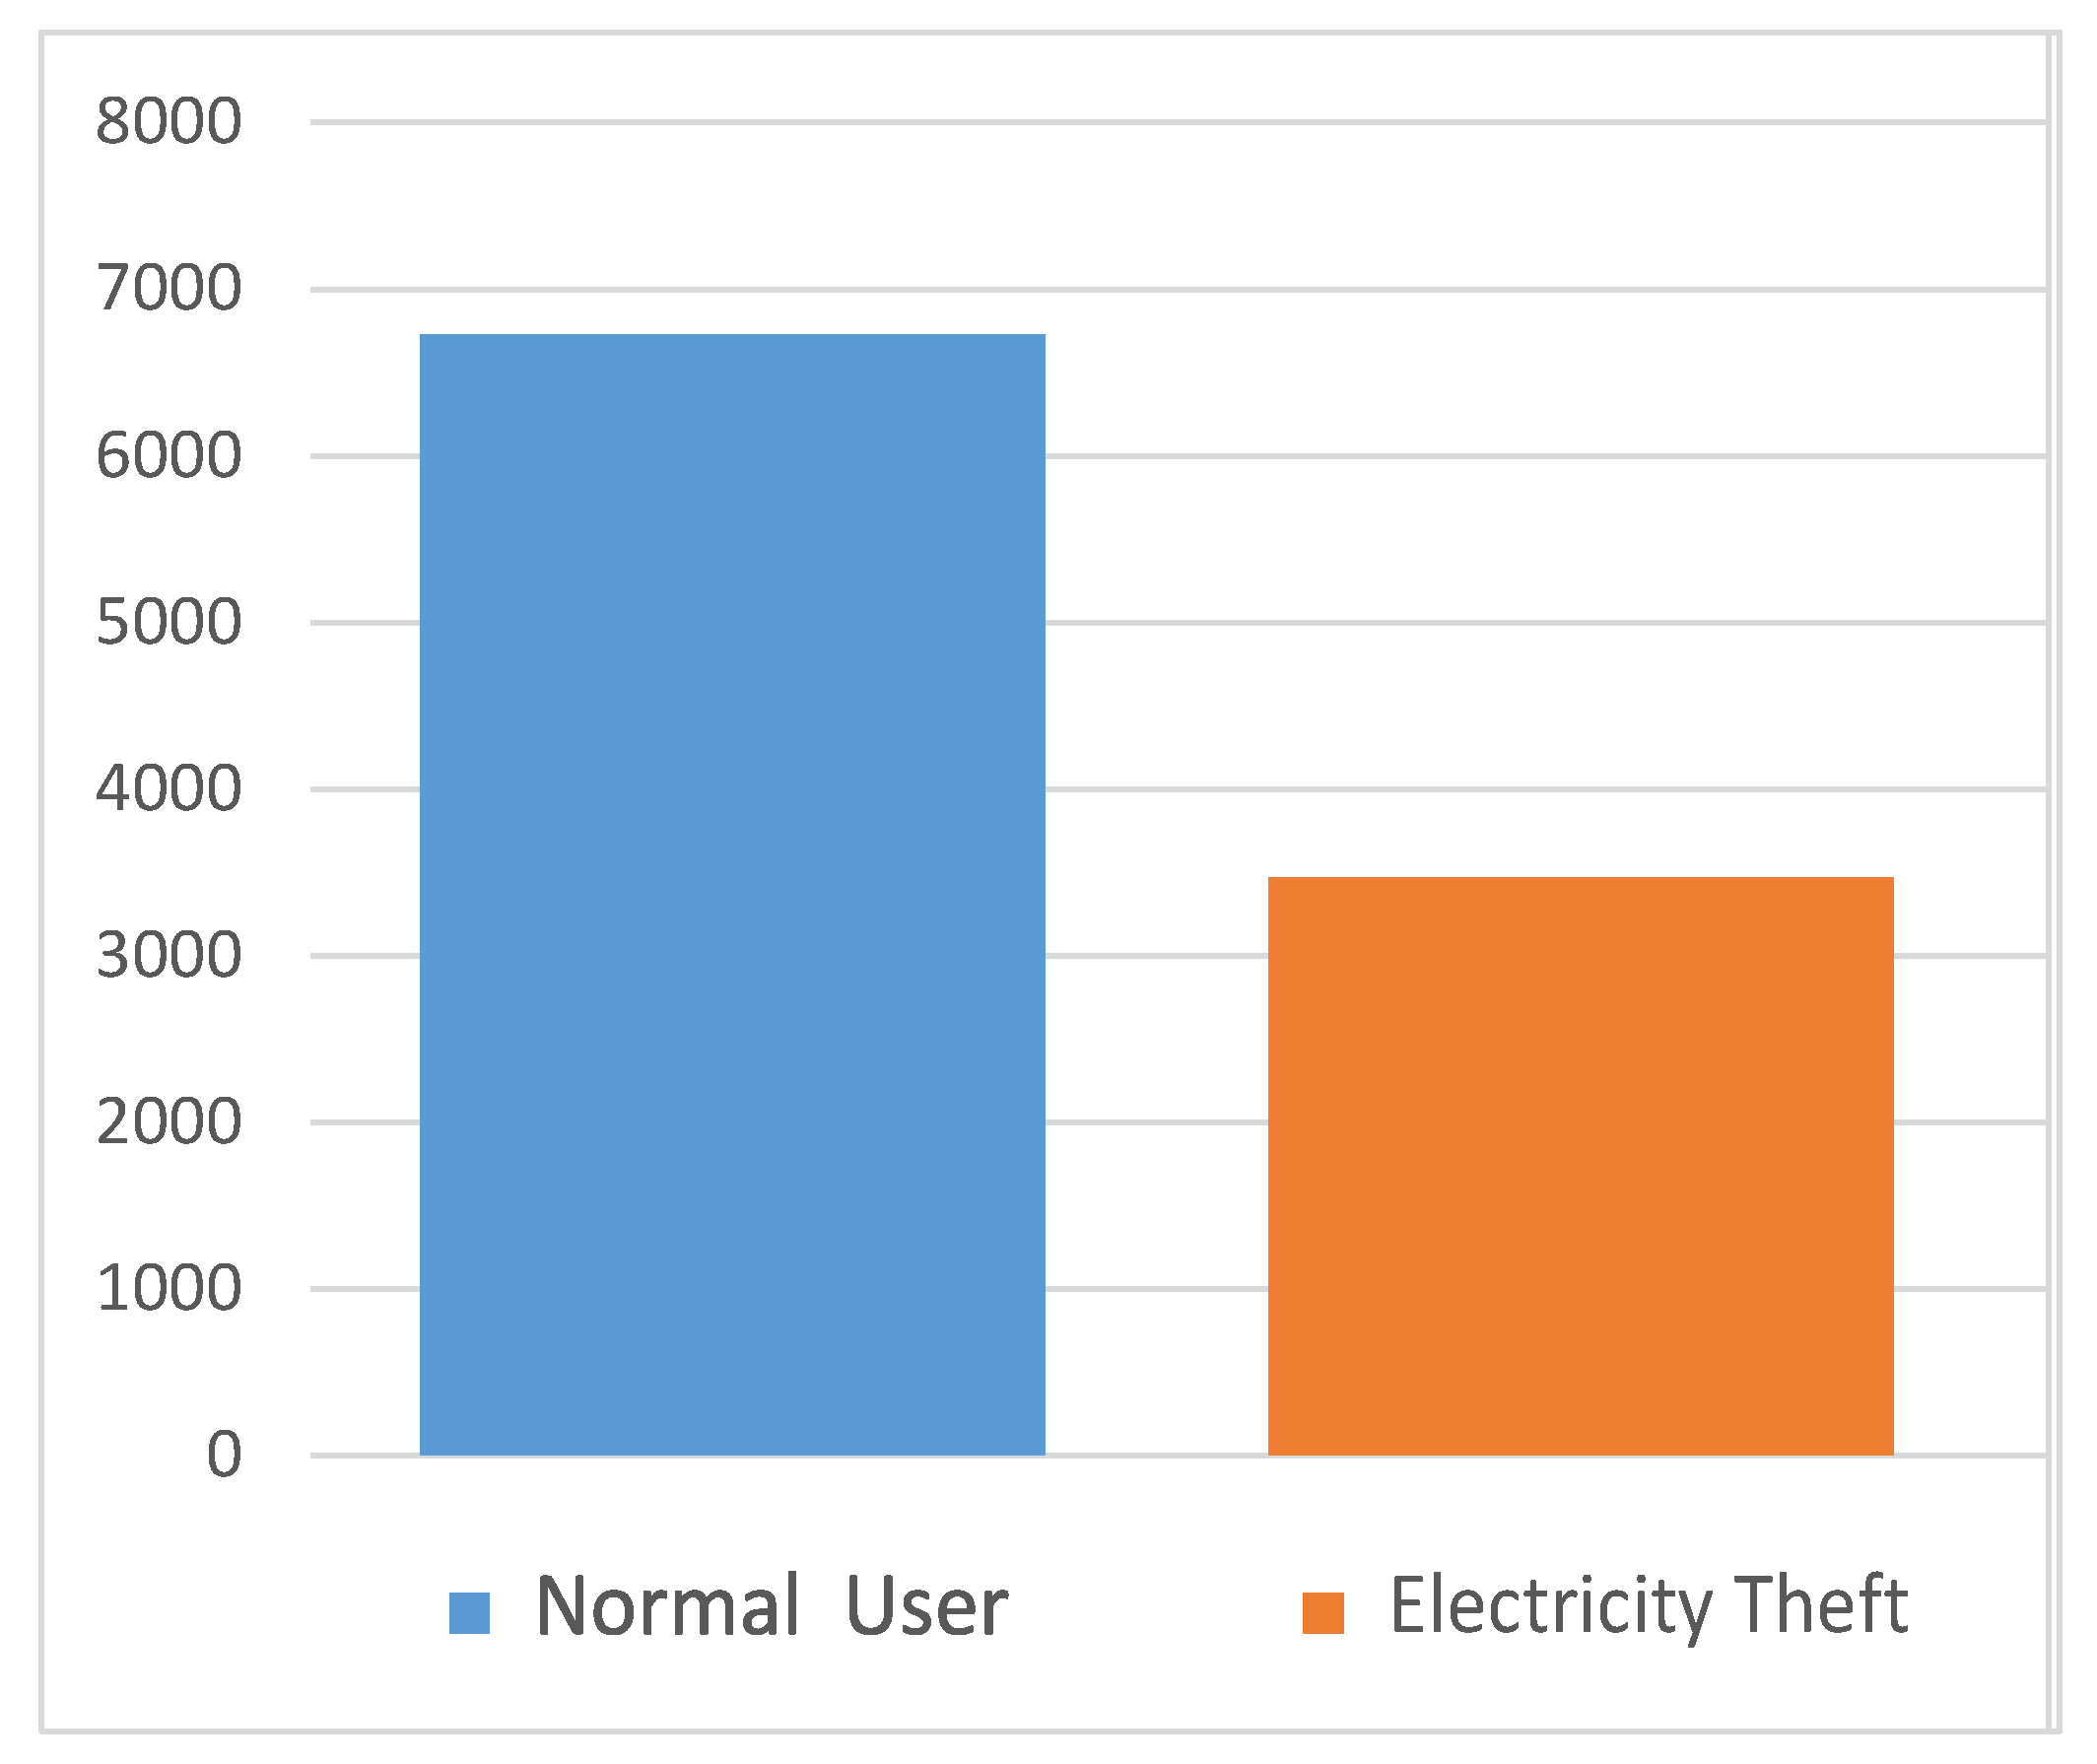
  • The problem of imbalanced data is solved by employing the Smote Over Sampling Tomik Link (SOSTLink) sampling method.
  • Feature extraction is done by applying Kernel Principal Component Analysis (KPCA) that reduces dimensionality.
  • The Bidirectional Gated Recurrent Unit (BGRU) model is used as classifier, which is used to detect NTL in smart grid.
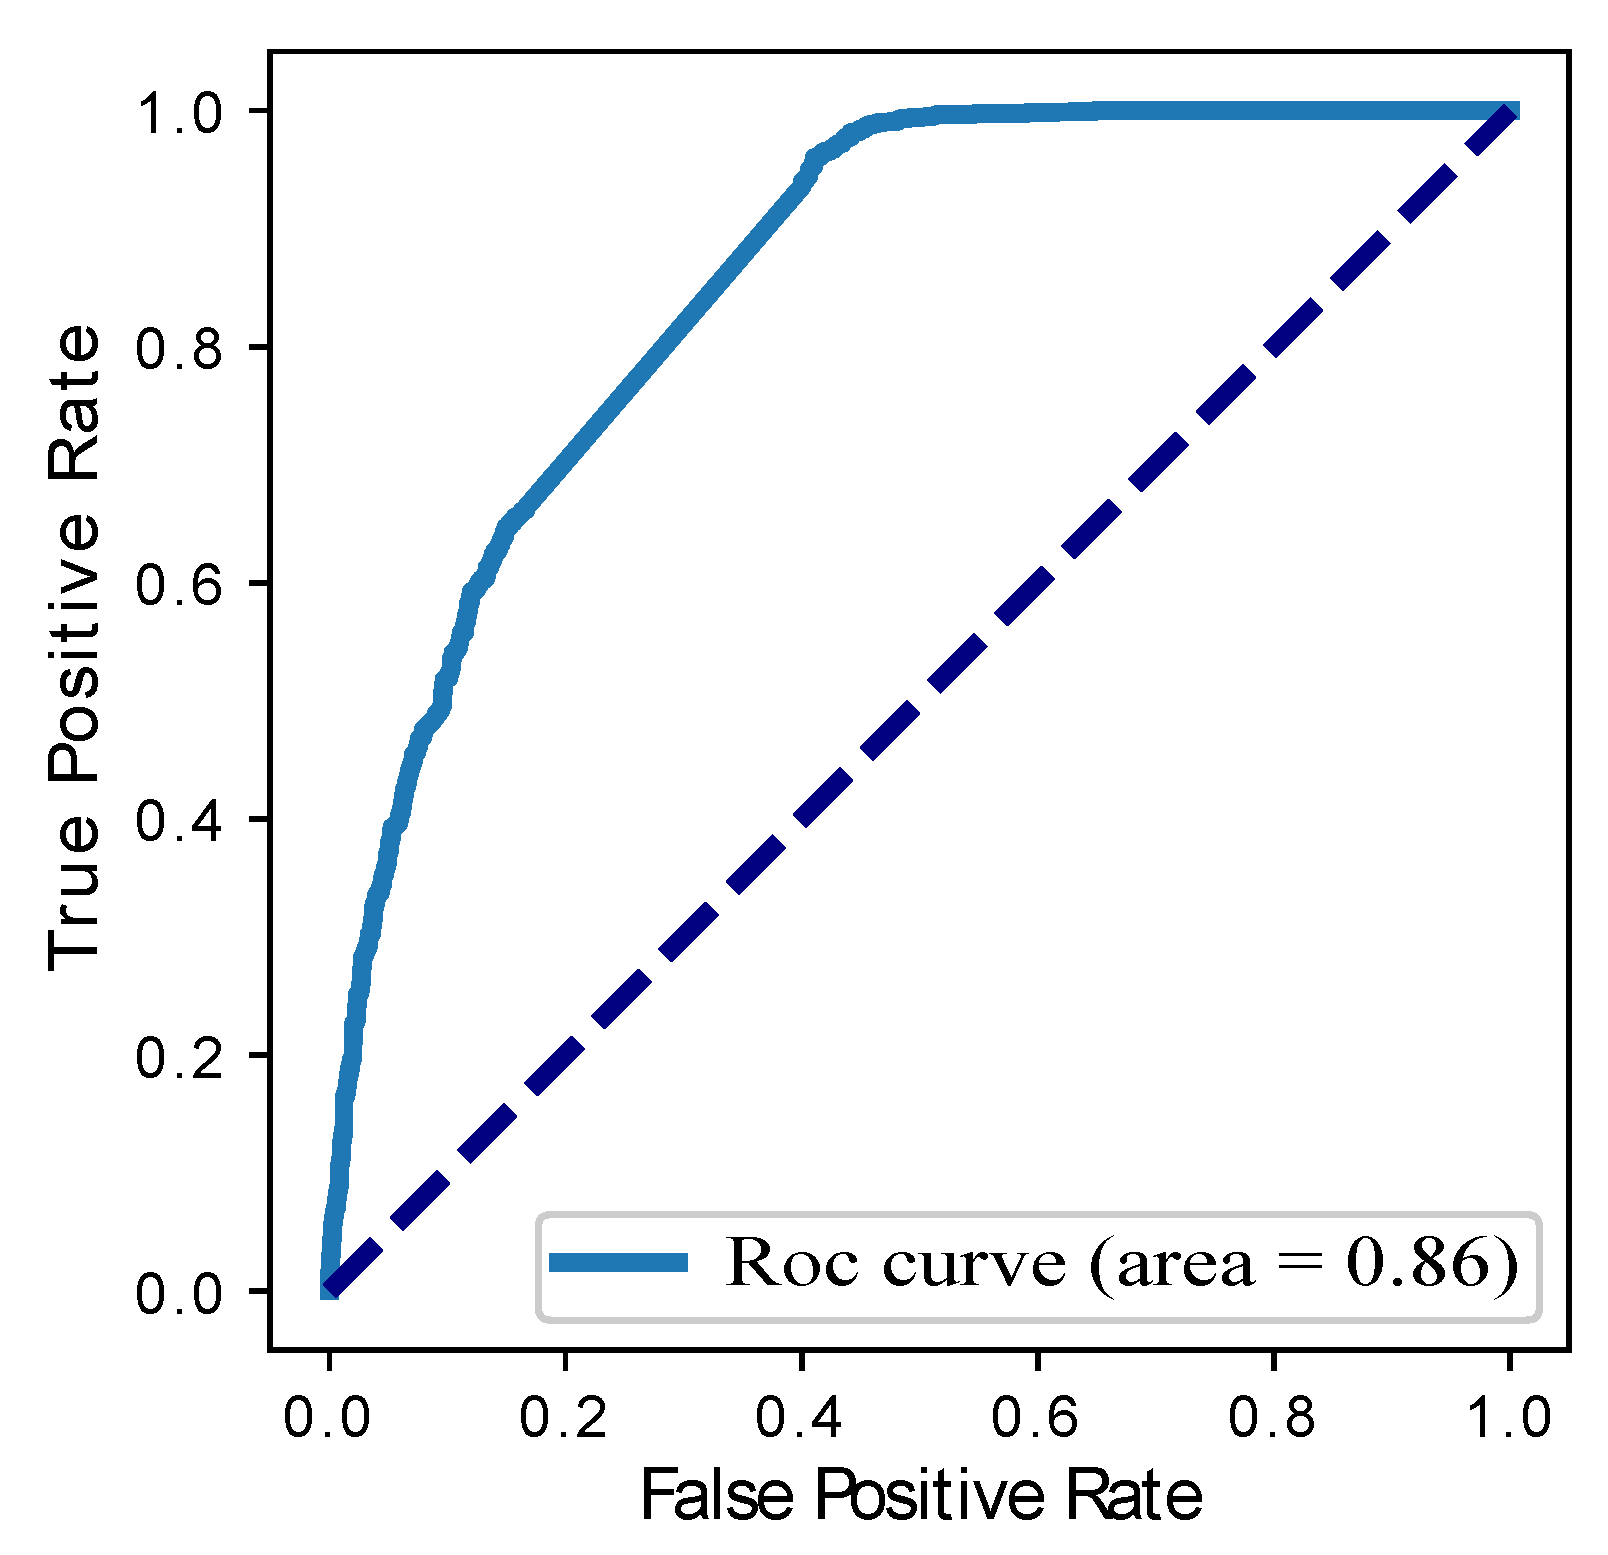
  • Finally, we have used suitable metrics to evaluate the performance of proposed model including Receiver Operating Characteristic (ROC) curve, F1-score, precision, and recall.

2. Literature Review

A detailed survey of existing studies are presented in this section. Zheng et al. [14], have proposed wide and deep Convolutional Neural Network (CNN) to capture the periodicity from State Grid Corporation of China (SGCC) dataset. However, the time complexity of wide and deep CNN model is very high, being a hybrid model. The number of non-fraudulent customers is greater than the number of fraudulent customers, which causes the class imbalance problem. The authors have addressed the issue of class imbalance using large scale data in [19]. For this purpose, the authors proposed Random undersampling Boosting (RusBoost) and Maximal Overlap Discrete Wavelet Packet Transform (MODWPT) for classification using real smart meter data from commercial and industrial zones [19]. However, the limitation of random undersampling is the underfitting problem, biased selection of samples, and removal of useful information from the majority class.
A metaheuristic technique, namely, the Binary Black Hole Algorithm (BBHA), is used to select the most representative features using real time-series data collected from a Brazilian agency in [20]. However, challenges in BBHA include being stuck in local minima and class imbalance problem [21]. The authors have proposed a Clustering technique by Fast Search and Find of Density Peaks (CFSFDP) combined with Maximum Information Coefficient (MIC) based on the method in [22]. They use an Irish dataset of real smart meter project [23]. The dataset consists of residential, small and medium size enterprises with 5000 customers within 500 days. However, observer meters are installed for smart meter security. The installation and maintenance costs of hardware resources are very high.
Authors have combined K-means clustering and Deep Neural Network (DNN) to secure the smart meter [17]. This combined approach is used to detect the anomalies in normal electricity usage of Irish data. Razavi et al. [18] have proposed finite mixture clustering model and genetic programming to discover new characteristics for theft detection. It is applied on the customer behavior trails from 2009–2010 in Ireland. The main concern of the study is feature engineering, rather than accurate classification. However, it has high FPR, which leads to high on-site inspection cost.
A detailed literature review is presented in Table 2.
The authors have deployed a deep learning methodology in which data is represented as an image [11]. This methodology is specifically designed to accommodate large scale data. Many machine learning techniques have been applied for Electricity Theft Detection (ETD) including the Long Short-Term Memory (LSTM) method proposed in [24]. LSTM is not only used for single entity data, but it is also used to learn long-term dependency sequences. The data is collected from electricity load diagrams duration of 2011–2014. However, the delay time occurs during the detection of anomaly.
Spiri’c et al. [25] have proposed a fuzzy logic method to minimize the total loss. This method determines the loss between electricity usage and supply. Fuzzy logic has some limitations such as it requires large data for training, and expert team for creating fuzzy rules. This method is time-consuming and complex, and it is not considered as an optimal solution. The authors have proposed gradient boosting based method for ETD, which is composed of Extreme Gradient Boosting (XGBoost), categorical boosting, and light boosting and uses Irish dataset [7]. These methods consume more memory, time, and are unable to handle categorical data. Li et al. [26] have proposed Smart Energy Theft System (SETS) in smart homes, which is an IoT-based solution for ETD. A peer-to-peer computing-based method named multiple linear regression is used [27].
Coma-Puig et al. [28] have proposed NTL detection method for energy utility to observe loss between generation, and distribution. Data is collected from leading electricity provider in Spain. Viegas et al. [29] have proposed fuzzy Gustafson–Kessel (GK) clustering to detect NTL using a real dataset. Saeed et al [30] have proposed ensemble bagged tree-based algorithm to detect NTL. The data is collected from Multan Electric Power Company (MEPCO) in Pakistan. The bagging algorithm did not not perform well because it causes an overfitting problem.
Ghasemi et al. [31] have proposed Probabilistic Neural Network (PNN), and Levenberg–Marquardt method to detect two types of electricity thefts: first, where an individual consumes a portion of the required energy illegally, and second, where an individual consumes all the required energy illegally. The authors have proposed Extreme Gradient Boosting (EGB) trees to rank the customers according to their anomalous consumption behavior in [32]. Data is collected from commercial, and industrial users of Endesa. A hybrid model based on CNN and RF has been proposed by the Li et al. [33] to detect NTL in smart grid. Real time-series data is collected from energy utility of Ireland and London. Hasan et al. [34] have proposed a hybrid model of neural networks named as CNN and LSTM, using the SGCC dataset, which is publicly available. Singh et al. [35] have proposed a Principal Component Analysis (PCA) approximation to find the electricity theft. Data is collected from an Irish leading center for qualitative data.

3. Problem Statement
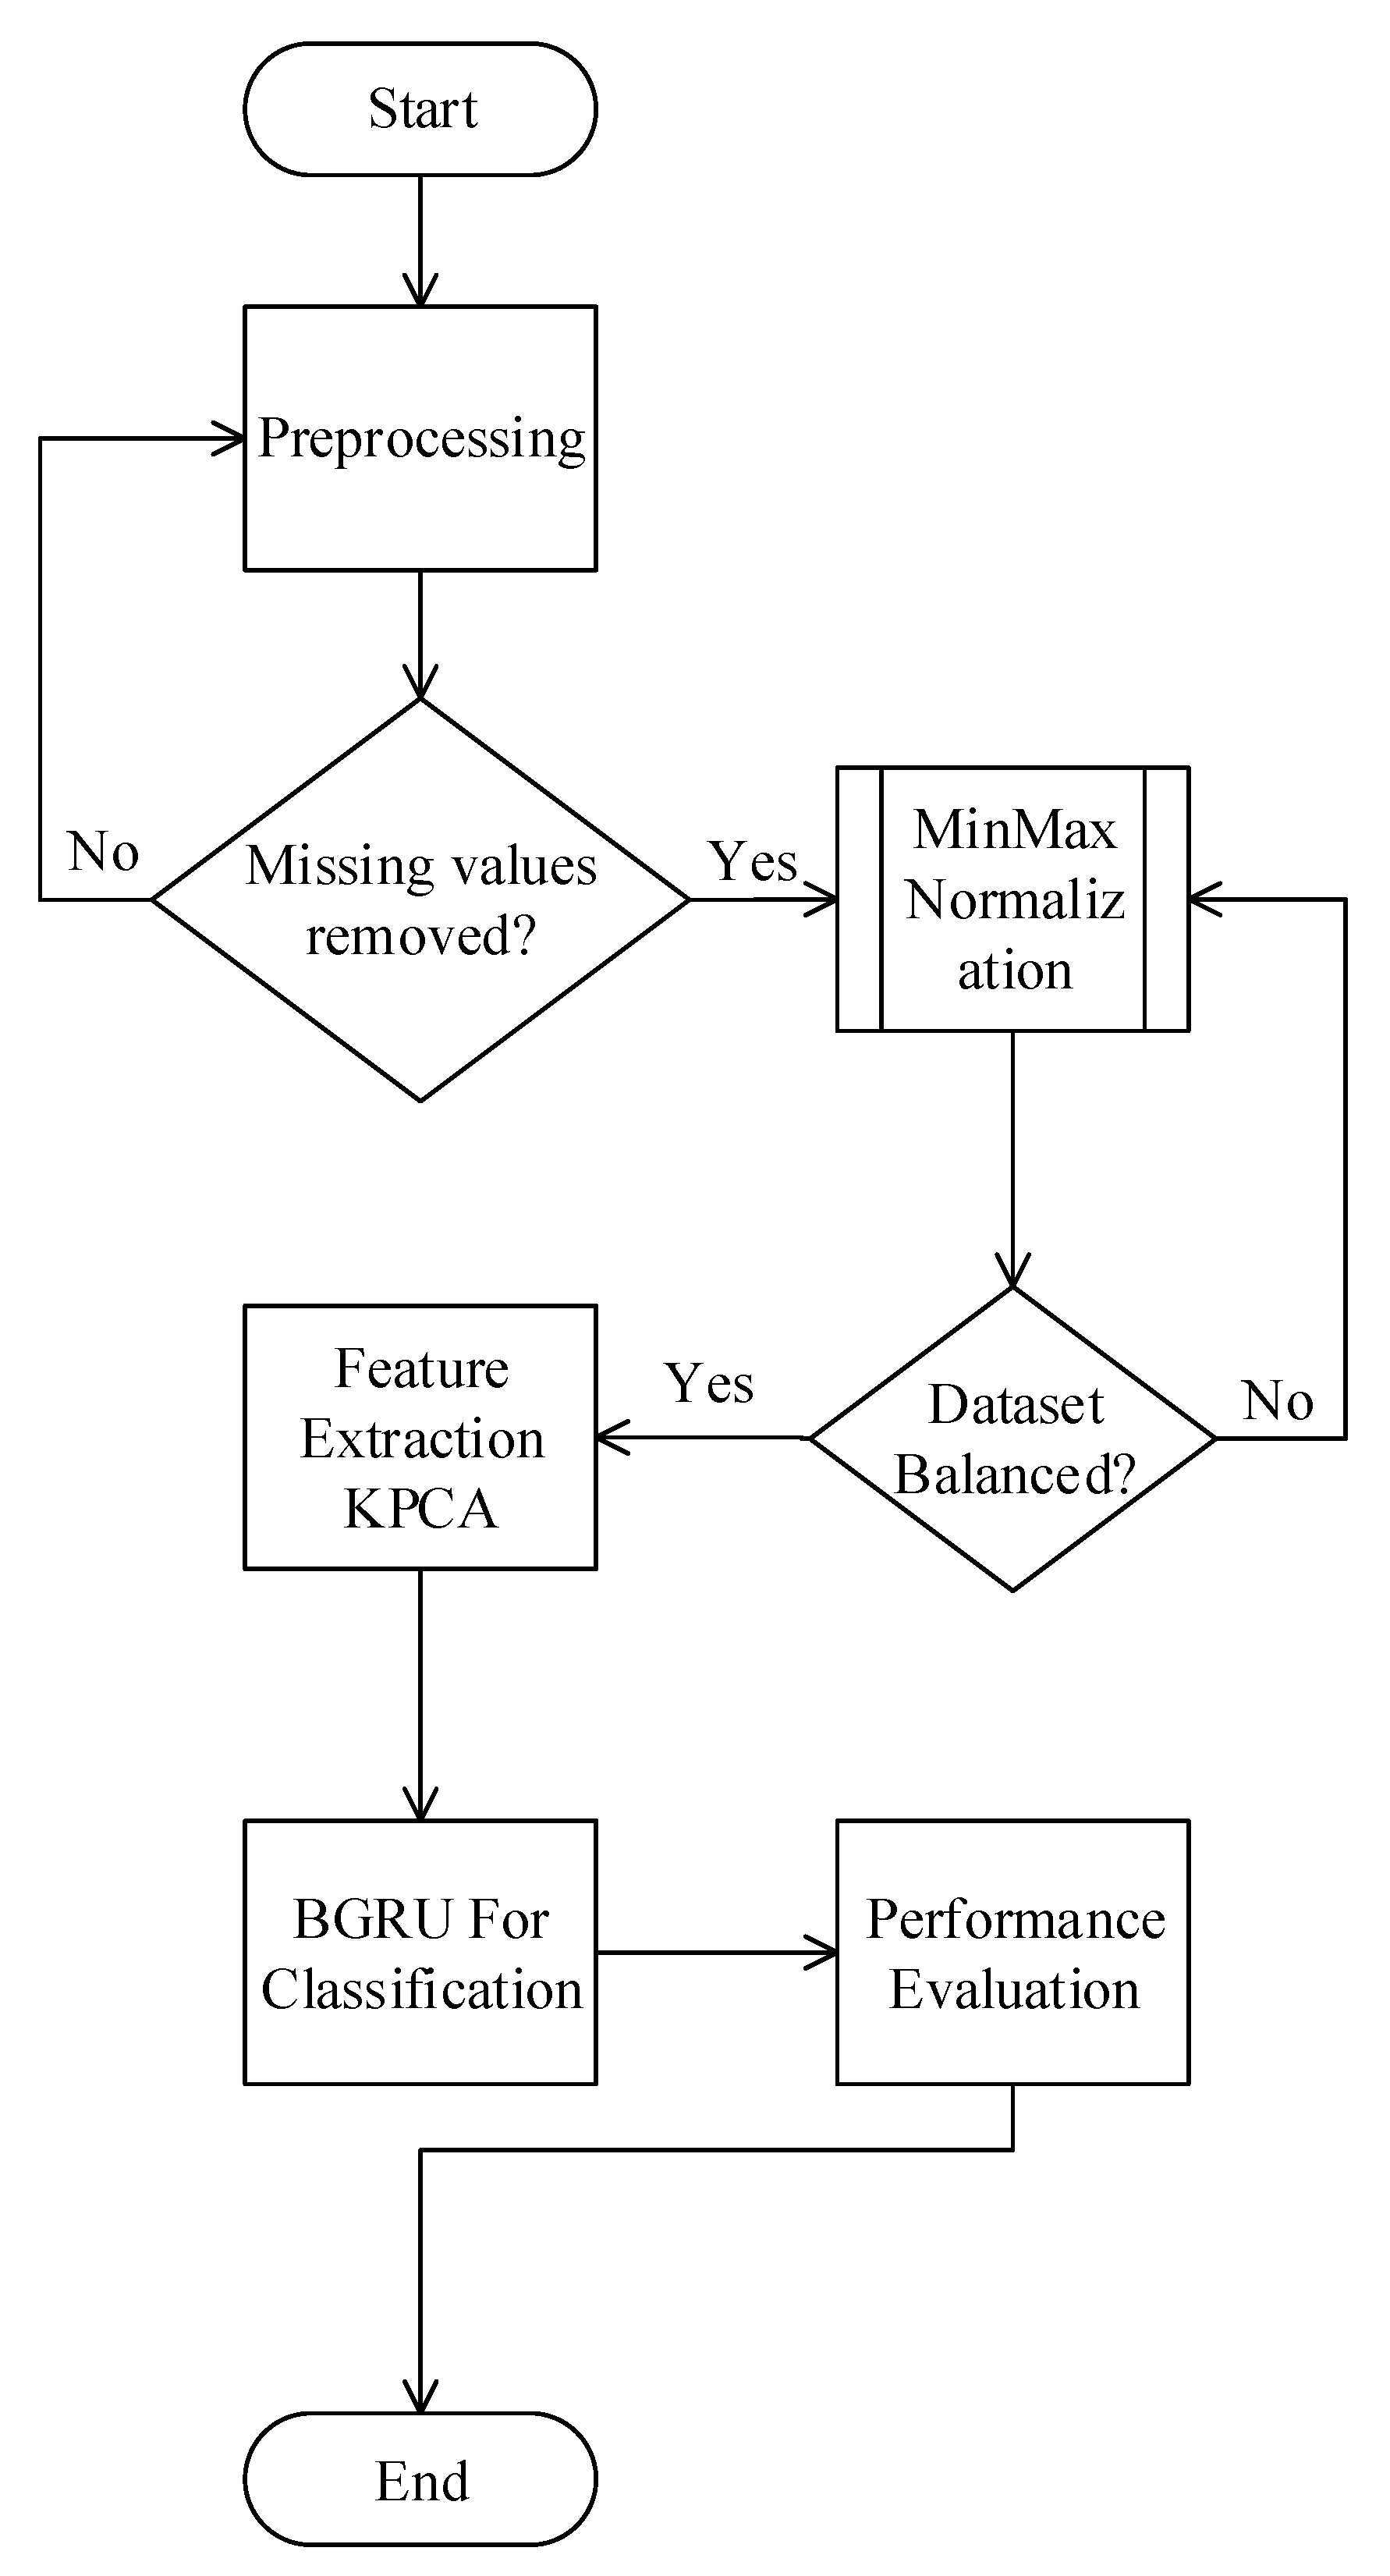
Electricity theft is a serious issue for utilities due to billions of dollars lost annually. Many machine learning approaches have been proposed to detect NTL. However, further research is needed to encounter some important problems.
Zheng et al. [14] have proposed wide and deep CNN for ETD. However, the execution time is high because it is a hybrid model. FPR is not calculated. Moreover, the imbalanced nature of the data is not considered.
Avila et al. [19] have proposed RusBoost for NTL detection. However, important information is lost due to random undersampling. Moreover, it requires high engagement of experts and execution time.
Buzau et al. [36] have proposed a hybrid model which consists of LSTM and MLP to secure smart grid from electricity theft. However, this requires high memory to capture anomalies in consumption data. Furthermore, the execution time and FPR of LSTM is very high, which leads to high inspection cost in ETD.

4. Proposed Model

To solve the aforementioned problems, we propose a model which is a combination of KPCA and BGRU. The proposed system model for ETD is shown in Figure 2, which is based on five steps: data preprocessing using imputation and normalization, the problem of imbalanced data is encountered using SOSTLink method, feature extraction using KPCA, bidirectional GRU for classification, and performance metrics. Flow chart of proposed model is shown in Figure 3.

4.1. Electricity Consumption Data

The dataset released by SGCC is used in this research, which is publicly available [14].

4.2. Data Preprocessing

A data preprocessing step is important because the performance of a model not only depends on algorithms, but also on the quality of data. Generally, real time-series data is noisy, inconsistent, and incomplete (missing values), which increases the difficulty of mining useful information. The SGCC dataset contains missing and incorrect values due to various factors like breakdown of smart meter, unscheduled maintenance of data storage, and unreliable transmission measurement [14]. Consequently, to attain high performance in NTL detection, many preprocessing techniques have been used in the literature. For that reason, we perform preprocessing using imputation and normalization. To remove missing values, we use a simple imputation method. In this method, empty values are considered as Not a Number (NaN) and their forward and backward values are checked. If these values exist, NaN is replaced by the mean of these two numbers; otherwise, zero is replaced in all empty fields. We normalize the data by applying MinMax normalization, which normalize the data between 0 and 1. The formula of MinMax normalization is follows,
n = ( x t m i n ) t m a x t m i n
where n represents newly generated values, x is the selected cell on which operations are performed, t m i n is the minimum value of the column, and t m a x is the maximum value of the column.

4.3. Handling Imbalance Data

SGCC dataset causes model bias towards the majority class. Figure 4 shows that normal users are greater in number as compared to abnormals, due to which the model misclassifies the minority class. To address the imbalanced data problem, two methods are used in the literature: cost function and sampling techniques. In this paper, we use the sampling technique. There are two types of sampling techniques: random undersampling and random oversampling. In random undersampling, some data points from the majority class are discarded and the majority class is made equal to the minority class. This sampling technique requires less execution time but leads to the loss of important information. In random oversampling, data points from the minority class are replicated randomly, so no information is lost and both majority and minority classes are balanced.
In this paper, we propose SOSTLink, which is a combination of oversampling technique Synthetic Minority Oversampling TEchnique (SMOTE) and undersampling technique Tomek Link. The SMOTE algorithm is used for oversampling and Tomek Link is used for undersampling. SMOTE generates data points by taking the means of two numbers from the minority class. For example, take an instance of the minority class as ( y 1 , y 2 ) , if its nearest neighbor is chosen as ( y 1 , y 2 ) , then the generated data points shown in Equation (2)
( y 1 , y 2 ) = ( y 1 , y 2 ) + r a n d o m ( 0 , 1 )
where,
X = ( y 1 y 1 ) , ( y 2 y 2 )
Random function provides a random number between 0 and 1. By applying SMOTE, minority class data points are generated and balanced with the majority class. Figure 5 shows the data set after applying SMOTE. However, it does not consider neighboring examples from other class. This can increase overlapping of same class data, introduce additional noise, and keep its prediction away from actual residential customers. Moreover, it cannot be applied to high-dimensional data. Tomek Link is used for undersampling in case the observations near to the borderline of minority class are removed [37]. The undersampling steps are as follows.
  • Read input from the dataset.
  • Minority samples are generated from input dataset.
  • Majority samples, which are nearest neighbors of minority observation, are also generated.
  • Combine both observation samples from majority and minority.
  • Delete all majority samples that are the nearest neighbor of minority samples.
  • Now dataset is undersampled as observations from majority class are removed.
In our proposed SOSTLink, samples are generated in the minority class and samples are removed from the majority class as shown in Figure 6. It corresponds to the desired ratio of the number of samples in the minority class over the number of samples in the majority class.

4.4. Feature Extraction using KPCA

Feature extraction is a process in which the most relevant features are extracted from the original dataset. In the literature, many methods have been proposed for feature extraction. In this research, we use KPCA for feature extraction. It extracts useful information from the entire dataset as much as possible, without losing important information. It is a variant of Principal Component Analysis (PCA) with kernel function. It uses a kernel function to project the dataset into a higher-dimensional feature space, where it is linearly separable. To implement the KPCA algorithm, the following steps are involved.
  • The first step is the choice of kernel mapping k ( x m , x n ) .
  • Based on training data { x n , ( n = 1 , , N ) } , we get K.
  • To get λ i and a i , solve eigenvalue problem of K.
  • For each given data point x, obtain its principal components in the feature space: ( f ( x ) · ϕ i ) = n = 1 N a n ( i ) k ( x , x n )

4.5. Bidirectional Gated Recurrent Unit for Classification

In traditional neural network and CNN models, weights are updated during backpropagation, due to which the problem of vanishing gradient and exploding gradient occurs. To resolve these issues, LSTM and GRU are used as advanced versions of the Recurrent Neural Network (RNN). However, LSTM has some limitations over GRU. LSTM has more parameters, besides being time-consuming and less efficient. It needs more data for generalization. Therefore, GRU is considered a better classification model as compared to the traditional neural networks, CNN, and LSTM models. Figure 7 shows the overall architecture of GRU.
GRU is proposed by Cho et al., which is the advanced version of RNN [38]. It easily learns long-term dependencies and resolves the problem of vanishing gradient [39]. The structure of GRU is slightly different from LSTM. LSTM consists of three gates, whereas GRU consists of two gates. Update and reset are the two gates of GRU. The update gate is the combination of input and forget gate of LSTM, and the reset gate is applied directly to the previous hidden state. Thus, GRU has fewer parameters, faster training process, and requires less data for generalization. For short-term dependencies, the reset gate is activated, and for long-term dependencies, the update gate is used. GRU uses a combination of both gates, so input sequences are passed through the deep network and all the gradients are kept. The relationship between the input and output gates is described in Equations (4)–(7).
u ( t ) = σ ( W u x t + W u h t 1 + b u )
ħ ( t ) = t a n h ( W . [ r t ] h t 1 + W x t )
h ( t ) = ( 1 u ( t ) ) h t 1 + u t ħ t
r ( t ) = σ ( W r x t + W r h t 1 + b r )
where r ( t ) is the reset gate, u ( t ) is update gate, and W is parameter. σ is the sigmoid function and tanh is hyperbolic tangent function.
BGRU is used in [40] for natural language processing.We get our motivation from work in [40] and used BGRU in our proposed model as shown in Figure 8. Bidirectional GRU is the latest version of bidirectional RNN. To make a prediction of a current observation, it uses information from the previous time step and forward time step. In GRU, information flows from left to right by computing each value. The output of GRU is passed to BGRU as input. In the final prediction, information flows from right to left starting from final time step and moving to the initial time step. In our proposed model, we use five layers: GRU, BGRU, flatten, dropout, and dense. We use 100 neurons in GRU layer and 50 neurons in the bidirectional layer. Moreover, the flatten layer is used to convert multidimensional data into one-dimensional data.

4.6. Study of Hyperparameters Used for Experiments

The performance of proposed model depends on its hyperparameters. We have achieved the desired performance by selecting the optimal number of hidden layers. We perform a number of experiments by changing the value of alpha. We get the optimal value of alpha on a hit and trial basis. As shown in Figure 4, data is transformed using Random Oversample Technique. Table 3 shows the values of the hyperparameters.

5. Experimental Results

A variable which is used to control the training process of BGRU is known as an epoch. In our model, we run the program for 25 epochs. After the 17th epoch, the accuracy remains constant. On the training data, accuracy gradually starts increasing and reaches 95%. While at testing, the accuracy slightly fluctuates. The dataset has some zero values. At the 4th epoch, the BGRU trains over the batch containing zero values, which causes overfitting. As shown in Figure 9, the accuracy of the proposed BGRU model is 94%.
We also calculate the loss of the proposed model. For loss, we conduct 16 iterations. At each step, loss decreases and reaches a 0.1 minimum at the training phase. At the testing phase, the minimum loss is less then 0.2. Loss of training and testing data is the same. The selected batch at the 2nd to 4th epoch consists of zero values; therefore, overfitting occurs at 4th iteration. Figure 10 indicates that the proposed model performs well on training and testing data.

5.1. Performance Comparison

To evaluate the performance of proposed model, we compare BGRU with Decision Tree (DT), Support Vector Machine (SVM), Logistic Regression (LR), Random Forest (RF), CNN, LSTM, and Multilayer Perceptron-Convolutional Neural Network (MLP-CNN).

5.1.1. Decision Tree

DT is also used for classification of energy theft. It has the power of decision-making in order to perform NTL detection. It works for complex problems because of its high adaptability.

5.1.2. Support Vector Machine

SVM is a classification method that is used in literature for binary classification. In the literature, many studies have compared their model with SVM.

5.1.3. Logistic Regression

Logistic Regression (LR) is a binary classification method which is equivalent to the single hidden layer of neural network. Sigmoid activation function is used in LR, with values ranging from 0 to 1.

5.1.4. Random Forest

The building block of Random Forest (RF) is multiple DT. In recent studies, it is used to identify thefts in power distribution. It has achieved better accuracy along with reducing overfitting issue.

5.1.5. Convolutional Neural Network

CNN is used to perform NTL detection. CNN is a multilayered deep learning model suitable for complex problems.

5.1.6. Long Short Term Memory

LSTM is a classifier used for theft detection, which learns temporal correlations from time series. In LSTM, the input is given in a sequence to train the model. In existing studies, many authors compare their classifiers with LSTM.

5.1.7. Multilayer Perceptron-Convolutional Neural Network

The Multilayer Perceptron Convolutional Neural Network (MLP-CNN) is a hybrid model, in which MLP maps input data with output data and CNN is a deep learning model. We compare our results with this model.

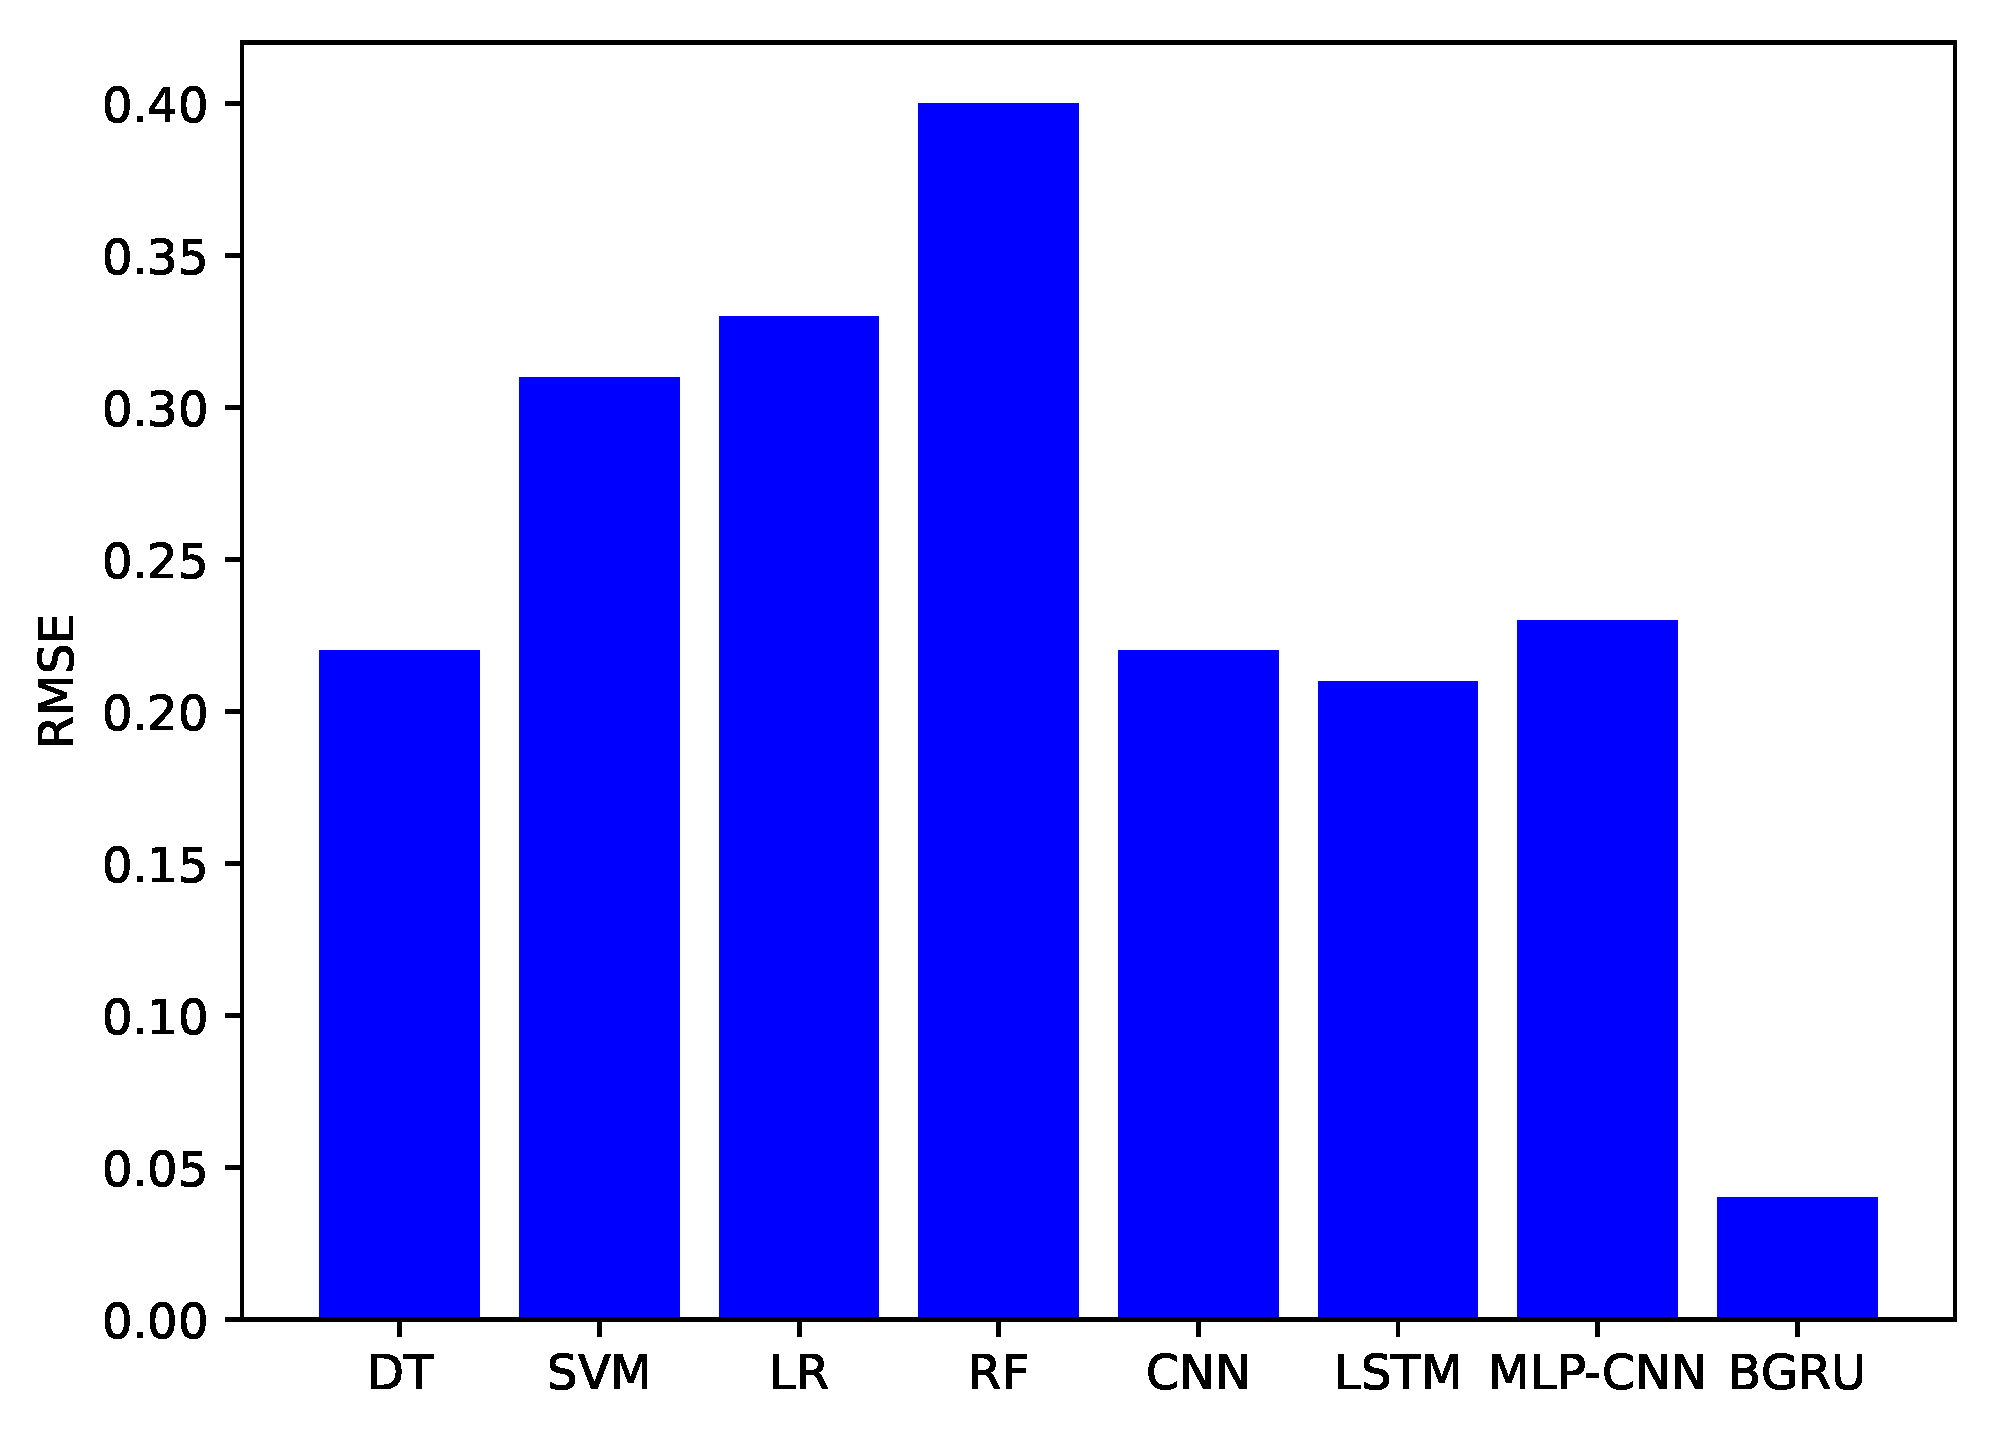
5.2. Performance Metrics

The objective of NTL detection is to minimize the inspection cost and maximize the electricity theft detection. Performance metrics are computed from confusion matrix which is shown in Figure 11. It is used to evaluate the performance of a classifier on test data. This matrix is appropriate when we have a verified number of thefts in a dataset [41]. From this matrix, four possible outcomes are generated. These outcomes are True Positive (T+), False Positive (F+), True Negative (T-), and False Negative (F-). In T+, classifier correctly detects thefts as Fraudsters. In F+, normal users are detected as theft by the classifier. In T-, normal users are correctly identified by classifier. Whereas in F-, thefts are detected as normal users by the classifier. These outcomes are then used to calculate precision, recall, and F1-score. In this research, we have used precision, F1-score, recall, and ROC curve [19].
P r e c i s i o n = T r u e + T r u e + + F a l s e +
R e c a l l = T r u e + T r u e + + F a l s e
F 1 S c o r e = ( 1 + β 2 ) × P r e c i s i o n × R e c a l l β 2 × P r e c i s i o n + R e c a l l
R O C = R e c a l l + S p e c i f i c i t y 2
Precision, recall, F1-score, ROC curve, and Root Mean Square Error (RMSE) are important metrics for model evaluation. Table 4 and Figure 12 show the comparison of existing techniques with proposed model based on different performance metrics. The precision value of CNN is 0.65, which is lowest among all models, while BGRU has the highest precision value which is 0.80. Likewise, the precision values of LR, RF, and SVM are 0.72, 0.72, and 0.69, respectively. Similarly, the lowest recall valve is 0.58 for SVM and 0.89 for the proposed model which is highest recall value. Recall values of LR, RF, and CNN are 0.73, 0.70, and 0.73, respectively. The F1-score of BGRU, LR, RF, SVM, and CNN is 0.85, 0.65, 0.60, 0.56, and 0.85, respectively.
FPR is considered as an important performance metric. In FPR, normal users are classified as theft, which raises the model’s misclassification rate. If FPR is high, the inspection cost is also high. The objective of NTL detection is to minimize the inspection cost. We have calculated the FPR of benchmark models as shown in Figure 13. The proposed model has the lowest FPR of 0.06, whereas SVM has the highest FPR.
The ROC curve is another performance metric for classification problems. It tells us how confident our model is to differentiate between the normal and theft users. Figure 13 shows the ROC curve of the proposed BGRU model. The value of ROC curve is 0.86 of BGRU model. The score of ROC curve improved greatly by applying the SOSTLink method.
We also calculate the RMSE of our proposed model and also for comparison techniques. RMSE gives relatively high weights to large errors and it is very useful when large errors are undesirable. It takes the average of root square of errors. The formula of RMSE is as follows,
R M S E = Σ i = 1 n ( a i b i ) 2
RMSE calculates the distance between acutal sample and predictied sample. The RMSE of BGRU is 0.044, which is lowest as compared to other existing deep learning models as shown in Figure 14; however, the RMSE of RF is highest at 0.400.
The existing techniques have low ROC curve as compared to the proposed model. ROC curve of CNN is 0.65, LR is 0.73, SVM is 0.57, LSTM is 0.82, MLP-CNN is 0.81, and RF is 0.70, respectively. Figure 15, Figure 16, Figure 17, Figure 18, Figure 19, Figure 20, Figure 21 and Figure 22 show the experimental results of comparative techniques in terms of ROC. Among seven different theft detection algorithms, the BGRU algorithm performs better as compared to traditional machine learning approaches.
The execution time of BGRU and the other existing deep learning models is shown in Figure 23, where execution time of LSTM is 30 min and execution time of MLP-CNN is 25 min. BGRU has the lowest execution time recorded as 15 min. This shows that BGRU is more efficient as compared to LSTM and MLP-CNN.

6. Conclusions

Electronic gadgets are growing rapidly, and because of this demand for electricity is increasing day by day. Losses occurs during generation, transmission, and distribution. In the literature, many studies have been proposed to deal with non-technical losses. However, still there is need to improve FPR and a better balancing technique to achieve good results. In this paper, first we remove missing values by imputation method and normalized the data by applying MinMax normalization. Second, we propose SOSTLink sampling technique, which is hybrid of two sampling techniques SMOTE and Tomik Link for balancing the imbalance data. Finally, we used bidirectional GRU for classification of NTL detection by analyzing the electricity consumption patterns of consumers. In order to evaluate the model performance, we use five performance evaluation metrics using real electricity consumption dataset of SGCC. Dataset consists of customer identification number, flag, and features. There are 1035 features that are the daily consumption of electricity. We compare the proposed system model with other existing techniques like, SVM, RF, LR, LSTM, CNN, and MLPCNN and show that our BGRU outperforms these techniques.
In future work, we will integrate other methods with BGRU to yield better results. Moreover, we will apply the BGRU model in other areas such as bank fraud and other theft detection problems.

Author Contributions

H.G. and N.J. proposed and implemented the main idea. I.U. and A.M.Q. wrote the simulation section. M.K.A. and G.P.J. organized and refined the manuscript. All authors worked together and responded to the honorable reviewers’ comments. All authors have read and agreed to the final version of the manuscript.

Acknowledgments

This research was supported by the Sejong University, New Faculty Research Fund.

Conflicts of Interest

The authors declare no conflicts of interest.

References

  1. Rao, K.R.M. The services sector in the Indian economy. In Services Marketing; Maran, A., Soma, B., Eds.; Pearson Education: Noida, India, 2011; pp. 76–77. [Google Scholar]
  2. Masip-Bruin, X.; Marin-Tordera, E.; Jukan, A.; Ren, G.J. Managing resources continuity from the edge to the cloud: Architecture and performance. Future Gener. Comput. Syst. 2018, 79, 777–785. [Google Scholar] [CrossRef] [Green Version]
  3. Guo, Z.; Zhou, K.; Zhang, X.; Yang, S. A deep learning model for short-term power load and probability density forecasting. Energy 2018, 160, 1186–1200. [Google Scholar] [CrossRef]
  4. Wang, K.; Xu, C.; Zhang, Y.; Guo, S.; Zomaya, A.Y. Robust big data analytics for electricity price forecasting in the smart grid. IEEE Trans. Big Data 2017, 5, 34–45. [Google Scholar] [CrossRef]
  5. Khalid, R.; Javaid, N.; Al-zahrani, F.A.; Aurangzeb, K.; Qazi, E.U.H.; Ashfaq, T. Electricity Load and Price Forecasting Using Jaya-Long Short Term Memory (JLSTM) in Smart Grids. Entropy 2020, 22, 10. [Google Scholar] [CrossRef] [Green Version]
  6. Tong, C.; Li, J.; Lang, C.; Kong, F.; Niu, J.; Rodrigues, J.J. An efficient deep model for day-ahead electricity load forecasting with stacked denoising auto-encoders. J. Parallel Distrib. Comput. 2018, 117, 267–273. [Google Scholar] [CrossRef]
  7. Punmiya, R.; Choe, S. Energy theft detection using gradient boosting theft detector with feature engineering-based preprocessing. IEEE Trans. Smart Grid 2019, 10, 2326–2329. [Google Scholar] [CrossRef]
  8. Aslam, S.; Khalid, A.; Javaid, N. Towards efficient energy management in smart grids considering microgrids with day-ahead energy forecasting. Electr. Power Syst. Res. 2020, 182, 106232. [Google Scholar] [CrossRef]
  9. Simões, P.F.M.; Souza, R.C.; Calili, R.F.; Pessanha, J.F.M. Analysis and short-term predictions of non-technical loss of electric power based on mixed effects models. Soc. Econ. Plan. Sci. 2020, 100804. [Google Scholar] [CrossRef]
  10. Komolafe, O.M.; Udofia, K.M. Review of electrical energy losses in Nigeria. Niger. J. Technol. 2020, 39, 246–254. [Google Scholar]
  11. Li, J.; Wang, F. Non-Technical Loss Detection in Power Grids with Statistical Profile Images Based on Semi-Supervised Learning. Sensors 2020, 20, 236. [Google Scholar] [CrossRef] [Green Version]
  12. Liu, Y.; Liu, T.; Sun, H.; Zhang, K.; Liu, P. Hidden Electricity Theft by Exploiting Multiple-Pricing Scheme in Smart Grids. IEEE Trans. Inf. Forensics Secur. 2020, 15, 2453–2468. [Google Scholar] [CrossRef]
  13. Jawad, Y.A.; Ayyash, I. Analyze the Loss of Electricity in Palestine Case Study: Ramallah and Al-Bireh Governorate. Int. J. Energy Econ. Policy 2020, 10, 7–15. [Google Scholar] [CrossRef]
  14. Zheng, Z.; Yang, Y.; Niu, X.; Dai, H.N.; Zhou, Y. Wide and deep convolutional neural networks for electricity-theft detection to secure smart grids. IEEE Trans. Ind. Inform. 2017, 14, 1606–1615. [Google Scholar] [CrossRef]
  15. Naz, A.; Javaid, N.; Rasheed, M.B.; Haseeb, A.; Alhussein, M.; Aurangzeb, K. Game Theoretical Energy Management with Storage Capacity Optimization and Photo-Voltaic Cell Generated Power Forecasting in Micro Grid. Sustainability 2019, 11, 2763. [Google Scholar] [CrossRef] [Green Version]
  16. Mujeeb, S.; Alghamdi, T.A.; Ullah, S.; Fatima, A.; Javaid, N.; Saba, T. Exploiting Deep Learning for Wind Power Forecasting Based on Big Data Analytics. Appl. Sci. 2019, 9, 4417. [Google Scholar] [CrossRef] [Green Version]
  17. Assia, M.; Khelifa, B. A Hybrid Model for Anomalies Detection in AMI System Combining K-means Clustering and Deep Neural Network. CMC Tech Sci. Press 2019, 60, 15–39. [Google Scholar] [CrossRef] [Green Version]
  18. Razavi, R.; Gharipour, A.; Fleury, M.; Akpan, I.J. A practical feature-engineering framework for electricity theft detection in smart grids. Appl. Energy 2019, 238, 481–494. [Google Scholar] [CrossRef]
  19. Avila, N.F.; Figueroa, G.; Chu, C.C. NTL Detection in Electric Distribution Systems Using the Maximal Overlap Discrete Wavelet-Packet Transform and Random Undersampling Boosting. IEEE Trans. Power Syst. 2018, 33, 7171–7180. [Google Scholar] [CrossRef]
  20. Manzoor, A.; Javaid, N.; Ullah, I.; Abdul, W.; Almogren, A.; Alamri, A. An intelligent hybrid heuristic scheme for smart metering based demand side management in smart homes. Energies 2017, 10, 1258. [Google Scholar] [CrossRef] [Green Version]
  21. Ramos, C.C.; Rodrigues, D.; de Souza, A.N.; Papa, J.P. On the study of commercial losses in Brazil: A binary black hole algorithm for theft characterization. IEEE Trans. Smart Grid 2018, 9, 676–683. [Google Scholar] [CrossRef]
  22. Zheng, K.; Chen, Q.; Wang, Y.; Kang, C.; Xia, Q. A novel combined data-driven approach for electricity theft detection. IEEE Trans. Ind. Inform. 2019, 15, 1809–1819. [Google Scholar] [CrossRef]
  23. Commission for Energy Regulation. CER Smart Metering Project Electricity Customer Behaviour Trial, 2009–2010; SN: 0012-00; Irish Social Science Data Archive: Dublin, Ireland, 2012.
  24. Fenza, G.; Gallo, M.; Loia, V. Drift-aware methodology for anomaly detection in smart grid. IEEE Access 2019, 7, 9645–9657. [Google Scholar] [CrossRef]
  25. Spirić, J.V.; Stanković, S.S.; Dočić, M.B. Identification of suspicious electricity customers. Int. J. Electr. Power Energy Syst. 2018, 95, 635–643. [Google Scholar] [CrossRef]
  26. Li, W.; Logenthiran, T.; Phan, V.T.; Woo, W.L. A novel smart energy theft system (SETS) for IoT-based smart home. IEEE Int. Things J. 2019, 6, 5531–5539. [Google Scholar] [CrossRef]
  27. Micheli, G.; Soda, E.; Vespucci, M.T.; Gobbi, M.; Bertani, A. Big data analytics: An aid to detection of non-technical losses in power utilities. Comput. Manag. Sci. 2019, 16, 329–343. [Google Scholar] [CrossRef]
  28. Coma-Puig, B.; Carmona, J. Bridging the Gap between Energy Consumption and Distribution through Non-Technical Loss Detection. Energies 2019, 12, 1748. [Google Scholar] [CrossRef] [Green Version]
  29. Viegas, J.L.; Esteves, P.R.; Vieira, S.M. Clustering-based novelty detection for identification of non-technical losses. Int. J. Electr. Power Energy Syst. 2018, 101, 301–310. [Google Scholar] [CrossRef]
  30. Saeed, M.S.; Mustafa, M.W.; Sheikh, U.U.; Jumani, T.A.; Mirjat, N.H. Ensemble Bagged Tree Based Classification for Reducing Non-Technical Losses in Multan Electric Power Company of Pakistan. Electronics 2019, 8, 860. [Google Scholar] [CrossRef] [Green Version]
  31. Ghasemi, A.A.; Gitizadeh, M. Detection of illegal consumers using pattern classification approach combined with Levenberg-Marquardt method in smart grid. Int. J. Electr. Power Energy Syst. 2018, 99, 363–375. [Google Scholar] [CrossRef]
  32. Buzau, M.M.; Tejedor-Aguilera, J.; Cruz-Romero, P.; Gómez-Expósito, A. Detection of non-technical losses using smart meter data and supervised learning. IEEE Trans. Smart Grid 2018, 10, 2661–2670. [Google Scholar] [CrossRef]
  33. Li, S.; Han, Y.; Yao, X.; Yingchen, S.; Wang, J.; Zhao, Q. Electricity Theft Detection in Power Grids with Deep Learning and Random Forests. J. Electr. Comput. Eng. 2019, 1–12. [Google Scholar] [CrossRef]
  34. Hasan, M.; Toma, R.N.; Nahid, A.A.; Islam, M.M.; Kim, J.M. Electricity Theft Detection in Smart Grid Systems: A CNN-LSTM Based Approach. Energies 2019, 12, 3310. [Google Scholar] [CrossRef] [Green Version]
  35. Singh, S.K.; Bose, R.; Joshi, A. Energy theft detection for AMI using principal component analysis based reconstructed data. IET Cyber Phys. Syst. Theory Appl. 2019, 4, 179–185. [Google Scholar] [CrossRef]
  36. Buzau, M.; Tejedor-Aguilera, J.; Cruz-Romero, P.; Gómez-Expósito, A. Hybrid Deep Neural Networks for Detection of Non-Technical Losses in Electricity Smart Meters. IEEE Trans. Power Syst. 2020, 35, 1254–1263. [Google Scholar] [CrossRef]
  37. Wang, W.; Song, J.; Xu, G.; Li, Y.; Wang, H.; Su, C. ContractWard: Automated Vulnerability Detection Models for Ethereum Smart Contracts. IEEE Trans. Netw. Sci. Eng. 2020, 1–12. [Google Scholar] [CrossRef] [Green Version]
  38. Cho, K.; van Merriënboer, B.; Gulcehre, C.; Bahdanau, D.; Bougares, F.; Schwenk, H.; Bengio, Y. Learning phrase representations using RNN encoder-decoder for statistical machine translation. arXiv 2014, arXiv:1406.1078. [Google Scholar]
  39. Kim, P.S.; Lee, D.G.; Lee, S.W. Discriminative context learning with gated recurrent unit for group activity recognition. Pattern Recognit. 2018, 76, 149–161. [Google Scholar] [CrossRef]
  40. Lee, H.G.; Park, G.; Kim, H. Effective integration of morphological analysis and named entity recognition based on a recurrent neural network. Pattern Recognit. Lett. 2018, 112, 361–365. [Google Scholar] [CrossRef]
  41. Ding, N.; Ma, H.; Gao, H.; Ma, Y.; Tan, G. Real-time anomaly detection based on long short-Term memory and Gaussian Mixture Model. Comput. Electr. Eng. 2020, 79, 106458. [Google Scholar] [CrossRef]
Figure 1. Two months electricity consumption data of a normal customer.
Applsci 10 03151 g001
Figure 2. Proposed system model.
Applsci 10 03151 g002
Figure 3. Flow chart of proposed system model.
Applsci 10 03151 g003
Figure 4. Normal data.
Applsci 10 03151 g004
Figure 5. Data after applying Synthetic Minority Oversampling TEchnique (SMOTE) algorithm.
Applsci 10 03151 g005
Figure 6. Smote Over Sampling Tomik Link (SOSTLink) sampling.
Applsci 10 03151 g006
Figure 7. The overall architecture of the Gated Recurrent Unit (GRU).
Applsci 10 03151 g007
Figure 8. Working of bidirectional Gated Recurrent Unit (GRU).
Applsci 10 03151 g008
Figure 9. BGRU accuracy.
Applsci 10 03151 g009
Figure 10. BGRU log loss.
Applsci 10 03151 g010
Figure 11. Confusion matrix.
Applsci 10 03151 g011
Figure 12. Comparison of BGRU with other techniques.
Applsci 10 03151 g012
Figure 13. Comparison of BGRU with ther techniques in terms of False Positive Rate (FPR).
Applsci 10 03151 g013
Figure 14. Comparison of BGRU with other techniques in term of Root Mean Square Error (RMSE).
Applsci 10 03151 g014
Figure 15. Receiver Operating Characteristic (ROC) curve of BGRU.
Applsci 10 03151 g015
Figure 16. ROC curve of Support Vector Machine (SVM).
Applsci 10 03151 g016
Figure 17. ROC curve of Decision Tree (DT).
Applsci 10 03151 g017
Figure 18. ROC curve of Logistic Regression (LR).
Applsci 10 03151 g018
Figure 19. ROC curve of Random Forest (RF).
Applsci 10 03151 g019
Figure 20. ROC curve of Long Short-Term Memory (LSTM).
Applsci 10 03151 g020
Figure 21. ROC curve of ROC curve of CNN.
Applsci 10 03151 g021
Figure 22. ROC curve of Multilayer Perceptron-Convolutional Neural Network (MLP-CNN).
Applsci 10 03151 g022
Figure 23. Execution time of BGRU and other deep learning techniques.
Applsci 10 03151 g023
Table 1. Mapping of problems with solutions.
S. NoProblemsProposed Solution
1Trapped in local minimaAdam optimization
2Time complexity of hybrid modelBGRU single model
3Imbalanced classSOSTLink method
4UnderfittingSOSTLink method
5Missing values are not handledImputation is performed
6FPR is not calculatedFPR is calculated
Table 2. Overview of existing methodologies.
Problem AddressedSolution ProposedDatasetLimitations
One-dimensional data fails to capture periodicity [14]Wide and deep CNNSGCC (2014–2016)Computational complexity, FPR is not calculated, Imbalance class problem
Required label dataset with additional information, poor accuracy [22]Combine two techniques. MIC-CFSFDPIrish CER smart metering projectAdditional hardware cost FPR is not calculated, Low detection accuracy
NTL detection [19]RusBoost and MODWPTIndustrial and commercial sectors in Honduras of ChinaUnderfitting, time complexity Selection of a biased sample, loss of information
Feature engineering required [21]BBHABrazilian electricity regulatory agencyTrapped in local minima, No preprocessing, Imbalance class problem
Hacking of smart meters [17]Combine two techniques. K-means and DNNIrish (2012)Imbalance dataset
Smart meter hacking, counterfeit the data [18]Finite mixture model clustering and a genetic programming algorithmReal time data from Ireland in (2009–2010)High FPR
NTL detection and accuracy is low [11]Proposed a methodology in which collected data is represented as image with the help of deep learning.power company in China.Imbalance class problem, Selection of a biased sample
Electricity theft detection and high FPR [24]LSTMElectricity load diagrams (2011–2014)High prediction error, High delay time in anomaly occur and detection
Loss between electricity usage and electricity supply [25]Fuzzy logicCustomers monthly invoiced billsRequire experts for analyses, Complex, Takes a lot of time to develop Fuzzy rules
Less number of verified customers in dataset, due to which accuracy is compromised [7]GBTDSmart energy dataset by IrishComputationally expensive
ETD in IoT-based network [26]SETsData is collected from Aeon lab named as Z-Wave based in UKAdditional hardware cost and maintenance cost
NTL detection [27]Multiple Linear Regression modelMinistry of Power distribution based in India (2013)Not explain the impact of accurately detected users
Detection of energy theft in utilities is a challenge [28]Implement machine learning technique in utility company to detect gap between generation and consumptionData is collected from leading electricity provider in SpainFPR is not calculated, Imbalance dataset
NTL detection is performed on synthetic data set to achieve low FPR [29]GK clusteringData is collected from commission for energy regulation based in IrishClass imbalance problem, Need large data and experts, Time complexity is high
NTL detection in Pakistan [30]ensemble bagged tree-based algorithmMEPCO in PakistanComputationally expensive
NTL detection [31]PNN and Levenberg–MarquardtPennsylvania–New Jersey–Maryland (PJM) Largest power system operator based in USAccuracy is low, FPR is not calculated, imbalance dataset
Not rank the customers according to their anomalous behavior [32]XG BoostData is collected from commercial and industrial users of EndesaCannot handle large data, High execution time, memory hungry
NTL detection [33]CNN and RFData is collected from sustainable energy authority of Ireland and electricity utility of LondonTime complexity is high because of hybrid model
Energy theft [34]Combines CNN and LSTM for theft detectionSGCCHigh execution time
Table 3. Parameters of Bidirectional Gated Recurrent Unit (BGRU).
ParametersValues of BGRUValues of LSTM
Input Neuron30,600643,200
Activation FunctionSigmoidSigmoid
Number of Outputs100400
Epoch2525
Number of dense layer101401
Execution time36s per iteration73s per iteration
Table 4. Performance metrics.
ModelsPrecisionRecallF1-ScoreROC CurveRMSE
LR0.720.730.650.730.33
RF0.720.700.600.700.40
SVM0.690.580.560.570.31
DT0.750.710.720.700.22
CNN0.650.730.850.650.22
LSTM0.720.710.720.820.21
MLP-CNN0.710.670.680.810.23
Our Proposed BGRU0.800.890.850.860.04

