Article

Correlation between Lesion Progression and Depolarization Assessed by Polarization-Sensitive Optical Coherence Tomography

1
TU Dresden, Faculty of Medicine Carl Gustav Carus, Anesthesiology and Intensive Care Medicine, Clinical Sensoring and Monitoring, Fetscherstr. 74, 01307 Dresden, Germany
2
TU Dresden, Faculty of Medicine Carl Gustav Carus, Policlinic of Operative and Pediatric Dentistry, Fetscherstr. 74, 01307 Dresden, Germany
3
TU Dresden, Faculty of Medicine Carl Gustav Carus, Medical Physics and Biomedical Engineering, Fetscherstr. 74, 01307 Dresden, Germany
*
Authors to whom correspondence should be addressed.
These authors contributed equally to this work.
Appl. Sci. 2020, 10(8), 2971; https://doi.org/10.3390/app10082971
Submission received: 1 April 2020 / Revised: 20 April 2020 / Accepted: 20 April 2020 / Published: 24 April 2020
(This article belongs to the Special Issue Optical Coherence Tomography and Its Applications II)

Abstract

:
The detection of early stages of caries is still one of the major challenges in preservative dentistry. Since it is known from polarized light microscopy (PLM) that intrinsic enamel birefringence is affected by demineralization, polarization-sensitive optical coherence tomography (PSOCT) could facilitate the noninvasive detection and assessment of early carious lesions. The present study aims to correlate enamel lesion progression and depolarization measurements based on PSOCT in an artificial demineralization model. A total of 18 enamel slabs were prepared from bovine incisor teeth and demineralized in an acetic buffer solution for up to 49 days. The degree of polarization (DOP)—indicating depolarization and thus, demineralization—was calculated from PSOCT measurements and compared to lesion depth which was measured from PLM images. Artificial lesions showed characteristic zones of natural enamel demineralization in PLM images. DOP representations showed no depolarization for sound, nondemineralized enamel, whereas significant changes were found after 15 days of acid-exposition. The linear regression analysis of the DOP and the measured lesion depth showed a substantial correlation ( R 2 = 0.71 ). The results indicate that PSOCT-based depolarization imaging provides an unambiguous contrast for initial enamel demineralization which is correlated to the lesion progression.

1. Introduction

The interpretation of polarization changes at dental hard tissue with polarized light microscopy (PLM) represents a milestone in caries research that has provided significant contributions to the understanding of the histopathological nature of the caries process [1]. In 1958, it was shown that demineralization of enamel is accompanied by distinct changes of polarization properties [2]. Polarization-sensitive optical coherence tomography (PSOCT) obtains depth-resolved images of polarization properties noninvasively with high resolution (typically 5–20 µm) and, as it is based on near-infrared light, without the hazards of ionizing radiation. In 2000, Baumgartner et al. presented the first PSOCT measurements of dental structures [3] and characterized the birefringence of the enamel, which is due to the anisotropy of hydroxyapatite crystals, organized in rodlike structures. The depolarizing effect of initial enamel lesions observed in PSOCT measurements was reported by Everett et al. [4] and has been documented for natural and artificial lesions [5,6]. In the context of dental PSOCT applications, depolarization has usually been detected by evaluating co- and cross-polarization intensities, and previous work demonstrated the potential of the cross-polarization signal for quantifying enamel demineralization and remineralization [7]. In particular, calculating the integrated cross-polarization reflectivity of near-surface signals showed significant results [8,9]. However, both native enamel birefringence and demineralization-induced depolarization contribute to an increased cross-polarization signal [5], which can be especially detrimental to the assessment of hidden caries, i.e., sound birefringent enamel with underlying depolarizing caries. In recent studies, we concluded that the representation of the degree of polarization (DOP) as a PSOCT-based measure of depolarization seems to be the most appropriate representation for the detection of early carious lesions in comparison with other measures such as co- and cross-polarization intensities, total reflectivity, retardation, and optic axis orientation [10,11]. Furthermore, we improved this approach by noise-immune processing, as introduced by Makita et al. [12], and demonstrated that the DOP also supports the assessment of suspect occlusal enamel lesions [13]. Hence, the feasibility of DOP-based caries detection has been demonstrated, but not yet its potential in the distinction of stages.
Most in vitro studies for caries research involve extracted teeth, representing very heterogeneous specimens with differences in tooth morphology, caries progression stage, age, and dietary-dependent alterations that cause varying optical properties. The application of a controlled, standardized demineralization model at comparable specimens allows a more coherent investigation of consecutive stages of the caries process and related changes of optical properties [14]. As an appropriate dental substrate for these models, bovine enamel specimens with artificial carious lesions show a mineral distribution and structure that resembles lesions at human teeth, and that can be considered as a comparable alternative to human teeth in caries research [6,15,16].
The presented study aims at assessing the stage of enamel demineralization by PSOCT-based DOP measurements. Although studies on cross-polarization OCT indicate a correlation due to the presumably same source of contrast, i.e., depolarization, the correlation of demineralization stages and the DOP has not yet been presented. Therefore, we analyze the DOP at bovine enamel specimens in an artificial demineralization model with consecutive stages of lesion progression and compare those findings with the lesion depth measured at thin cross sections with PLM.

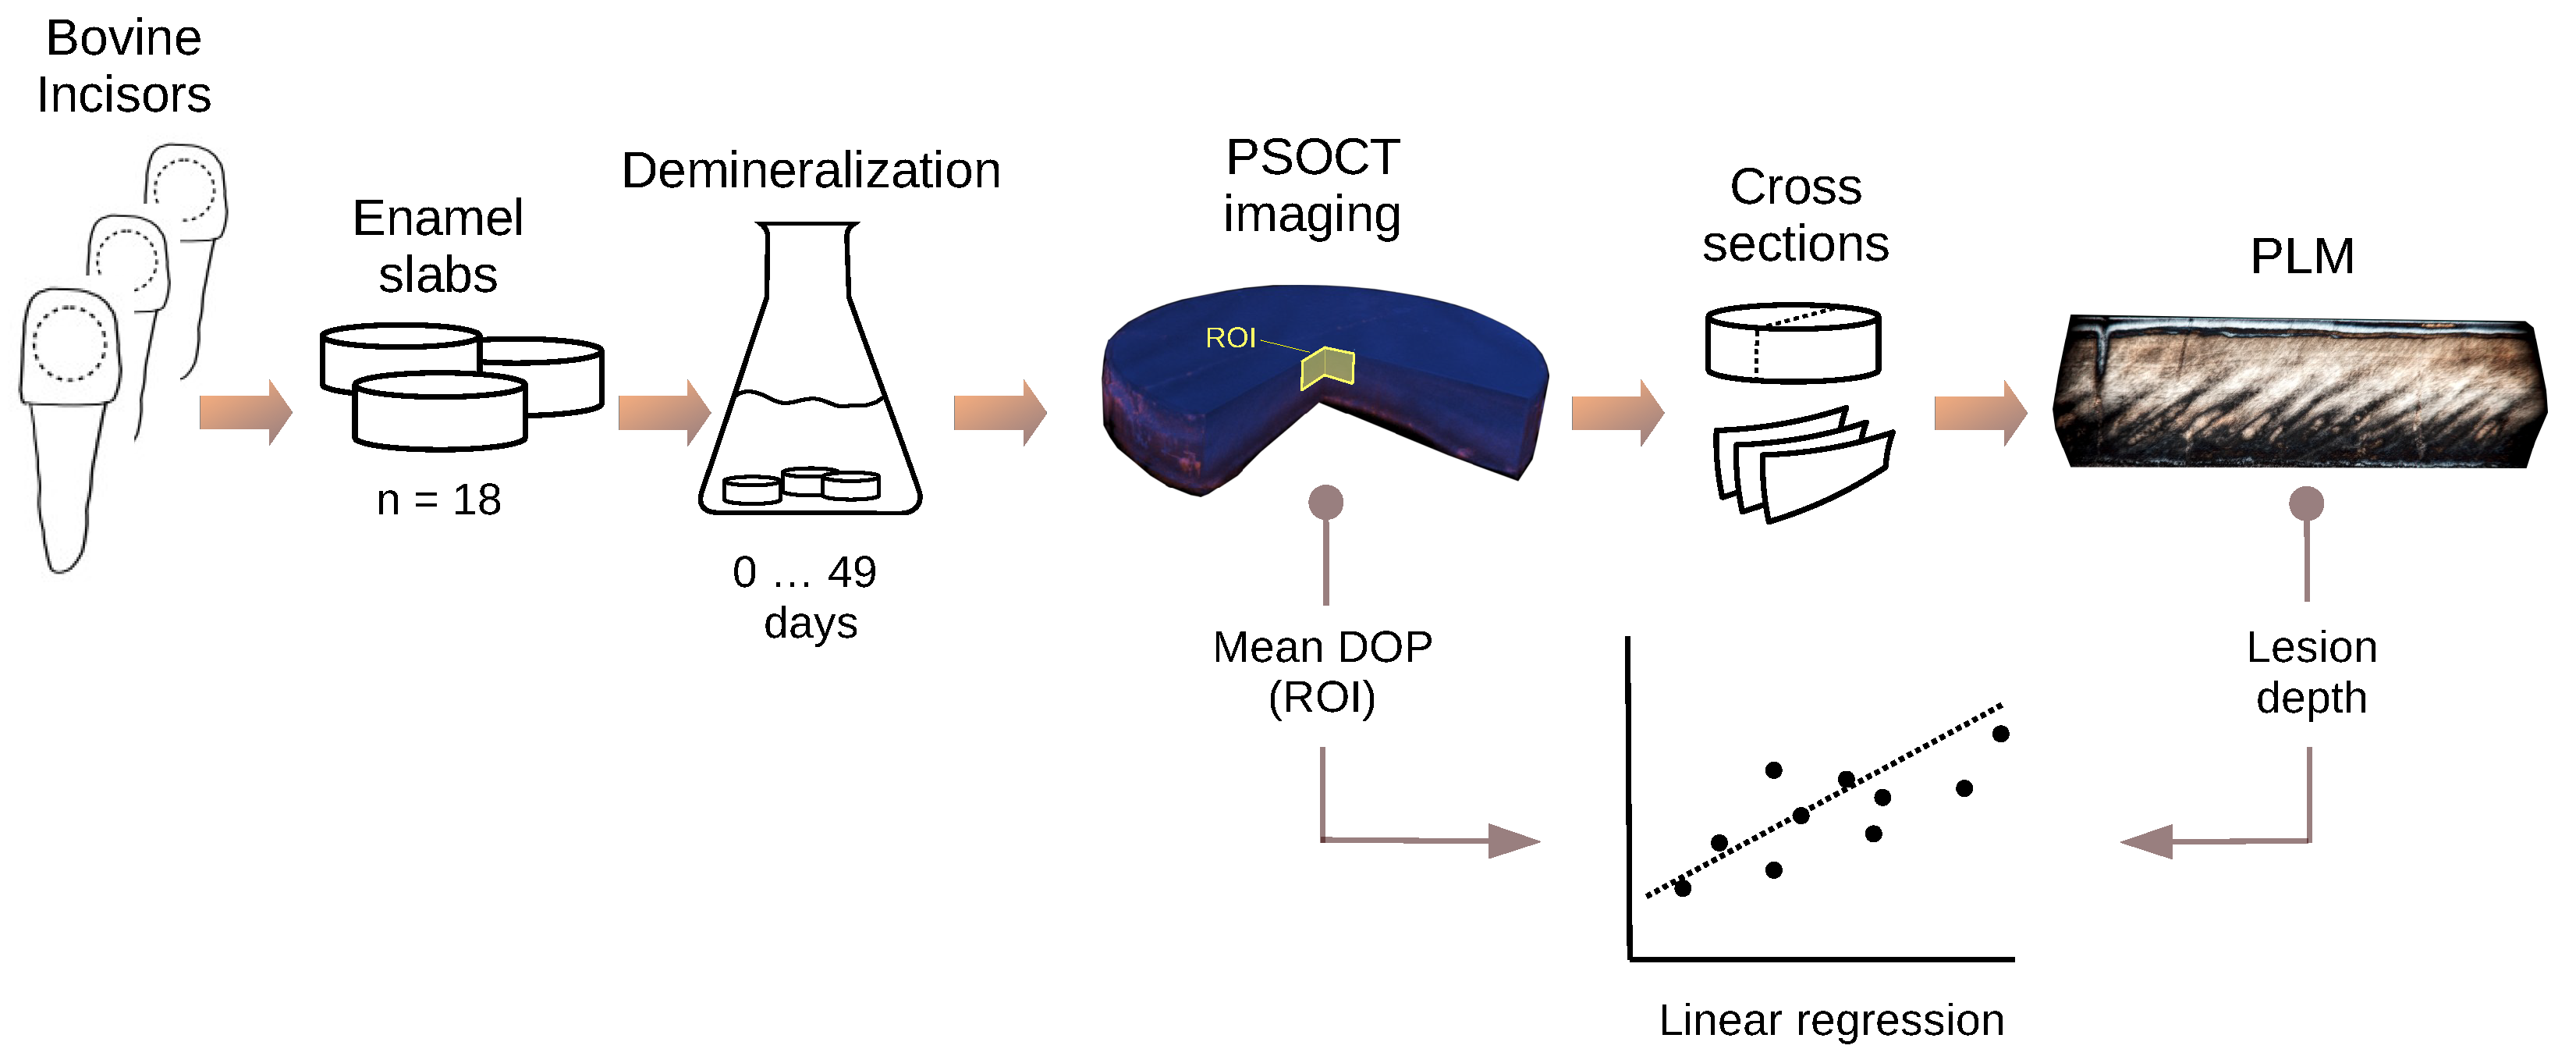
2. Materials and Methods

The general workflow for demineralization analysis is illustrated in Figure 1 and involves the following procedure steps:

2.1. Specimen Preparation

A number of 18 bovine enamel slabs (4.5 mm diameter, approximately 2 mm thickness) were prepared from incisor teeth of 2-year-old cattle. After wet-grinding and polishing of the remaining enamel surface with up to 4000 grit abrasive paper, the resulting smear layer was removed by steam jet and ultrasonification with 3% NaOCl for 3 min [17]. The slabs were washed twice for 5 min in distilled water activated by ultrasound, disinfected in 70% ethanol for 10 min (ultrasound), then washed and stored in distilled water [18,19].

2.2. Artificial Demineralization Model

The demineralization procedure followed a simplified model that has been used in numerous studies for caries research [20,21,22,23,24]. The prepared enamel slabs were stored at 37 °C in an acidic buffer solution according to Buskes et al. [25]. The solution was prepared by mixing 5 L distilled water, 2.205 g CaCl2 + 2H2O (3.0 mM), 2.041 g KH2PO4 (3.0 mM), 10 mL MHDP-solution (6 µM; prepared from 100 mL distilled water with 0.0528 g methylenediphosphoric acid), 14.3 mL CH3COOH (50 mM), and 10 M KOH to titrate the solution at pH 4.95. The pH value was controlled every day and adjusted if necessary. In order to ensure constant composition of the solvents, the solution was exchanged every week. The 18 slabs were stored in the solution for up to 49 days. Every 3rd to 4th day, one slab was removed for analysis, providing an even distribution of the 18 samples over the exposition time of up to 49 days. Thus, each of the slabs represents a specific duration of acid exposition and, presumably, demineralization stage.

2.3. Polarization-Sensitive OCT Imaging

A detailed description of the PSOCT system used in this study can be found in a previously published paper [10]. In brief, it consists of a 1310 nm swept laser source with 110 nm spectral bandwidth and 50 kHz sweep rate, a Michelson interferometer with a single circularly polarized illumination of the sample, and a polarization-diverse balanced detection. PSOCT imaging was done utilizing custom acquisition software and took about 30 s per volume. The underlying concept of polarization and image formation for PSOCT based on the Jones and Stokes formalism has been widely described, e.g., by de Boer et al. [26]. The DOP was calculated from spatially averaged and noise-corrected Stokes components [13], and covers values in a range from 0 (complete depolarization, yellow) to 1 (no depolarization, blue). For the analysis of DOP values, a region of interest (ROI) of approximately 2 mm × 2 mm at the center of the slabs was selected and the mean DOP to a depth of 300 µm (thinnest enamel layer thickness of the slabs, assuming a refractive index at 1300 nm of 1.631 [27]) was calculated. Cross-sectional images (B-scans) of the color-encoded DOP with intensity overlay of 45 dB dynamic range above the determined noise level [11,13] and depth projections (en-face) of the mean DOP to a depth of 300 µm were used for representation. In order to ensure constant measurement conditions and to prevent hydration-related variations of the scattering in porous enamel [28], the PSOCT measurements were performed with a water drop on top of the slabs, covered by a cover slip.

2.4. Polarized Light Microscopy of Thin Sections
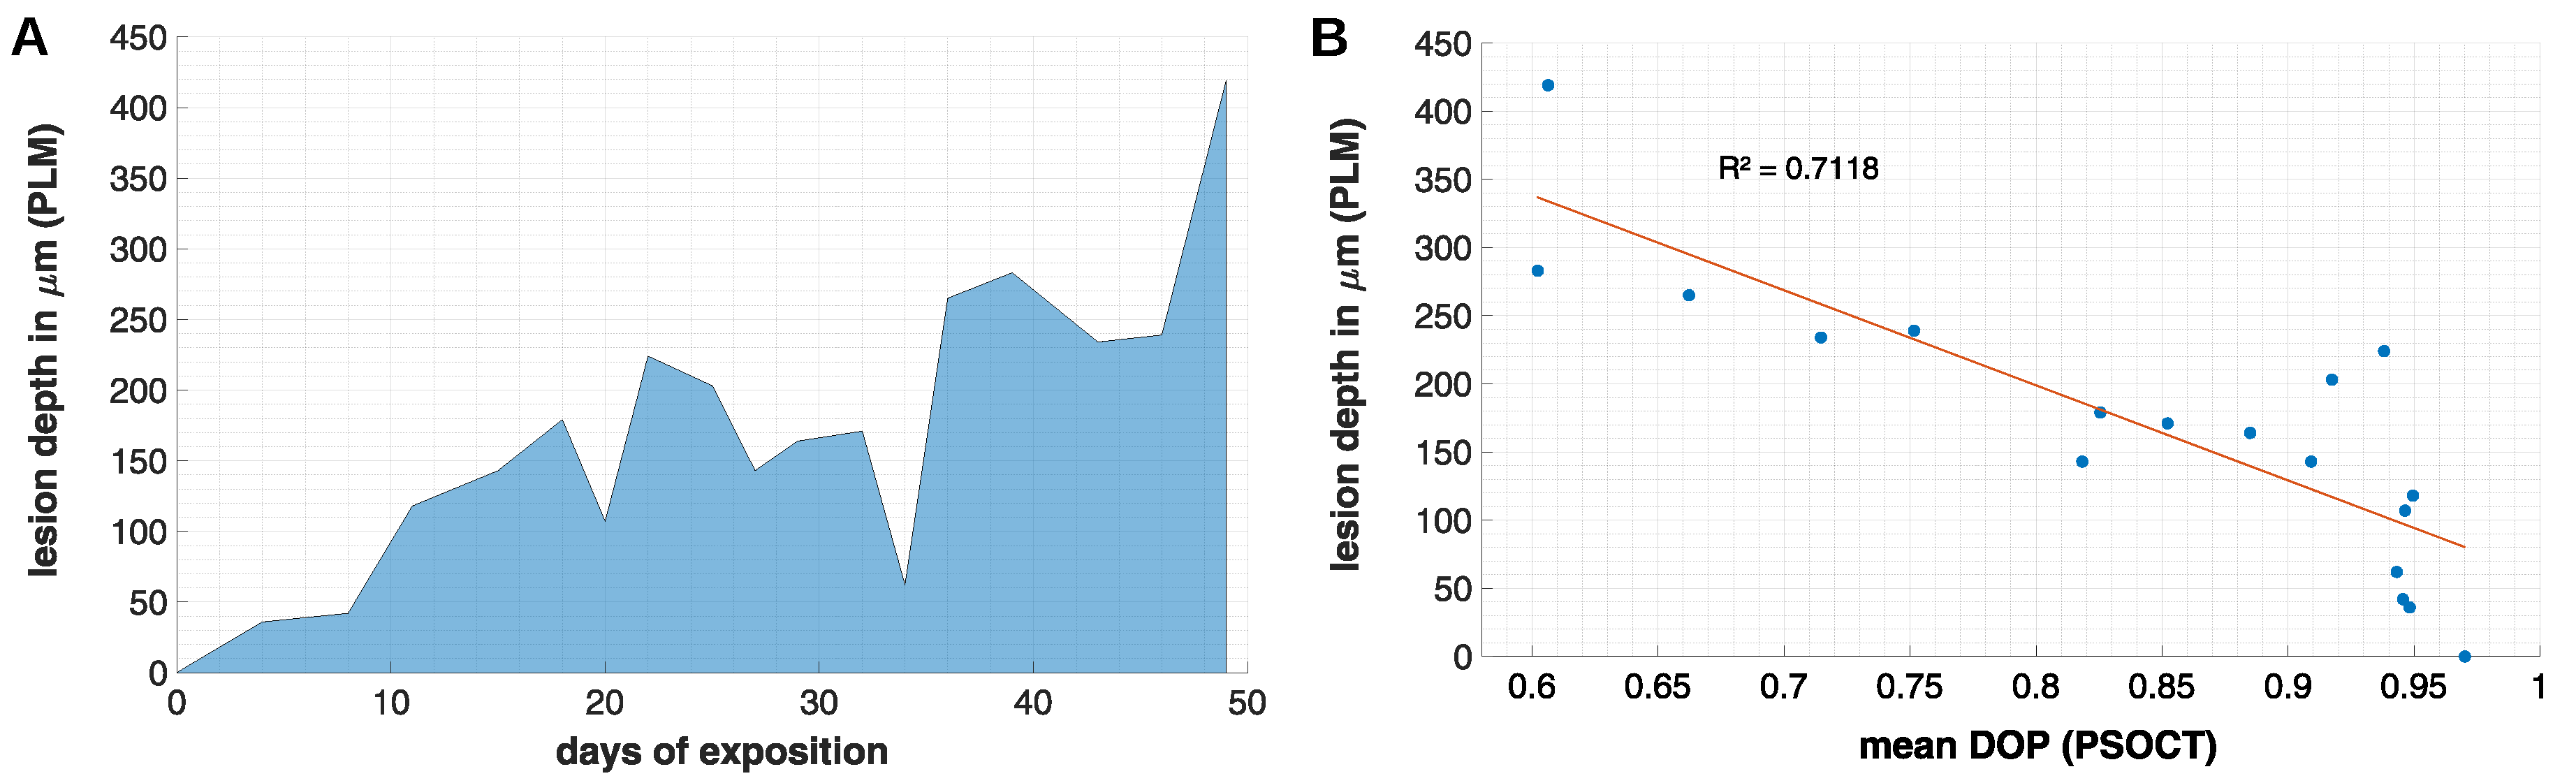
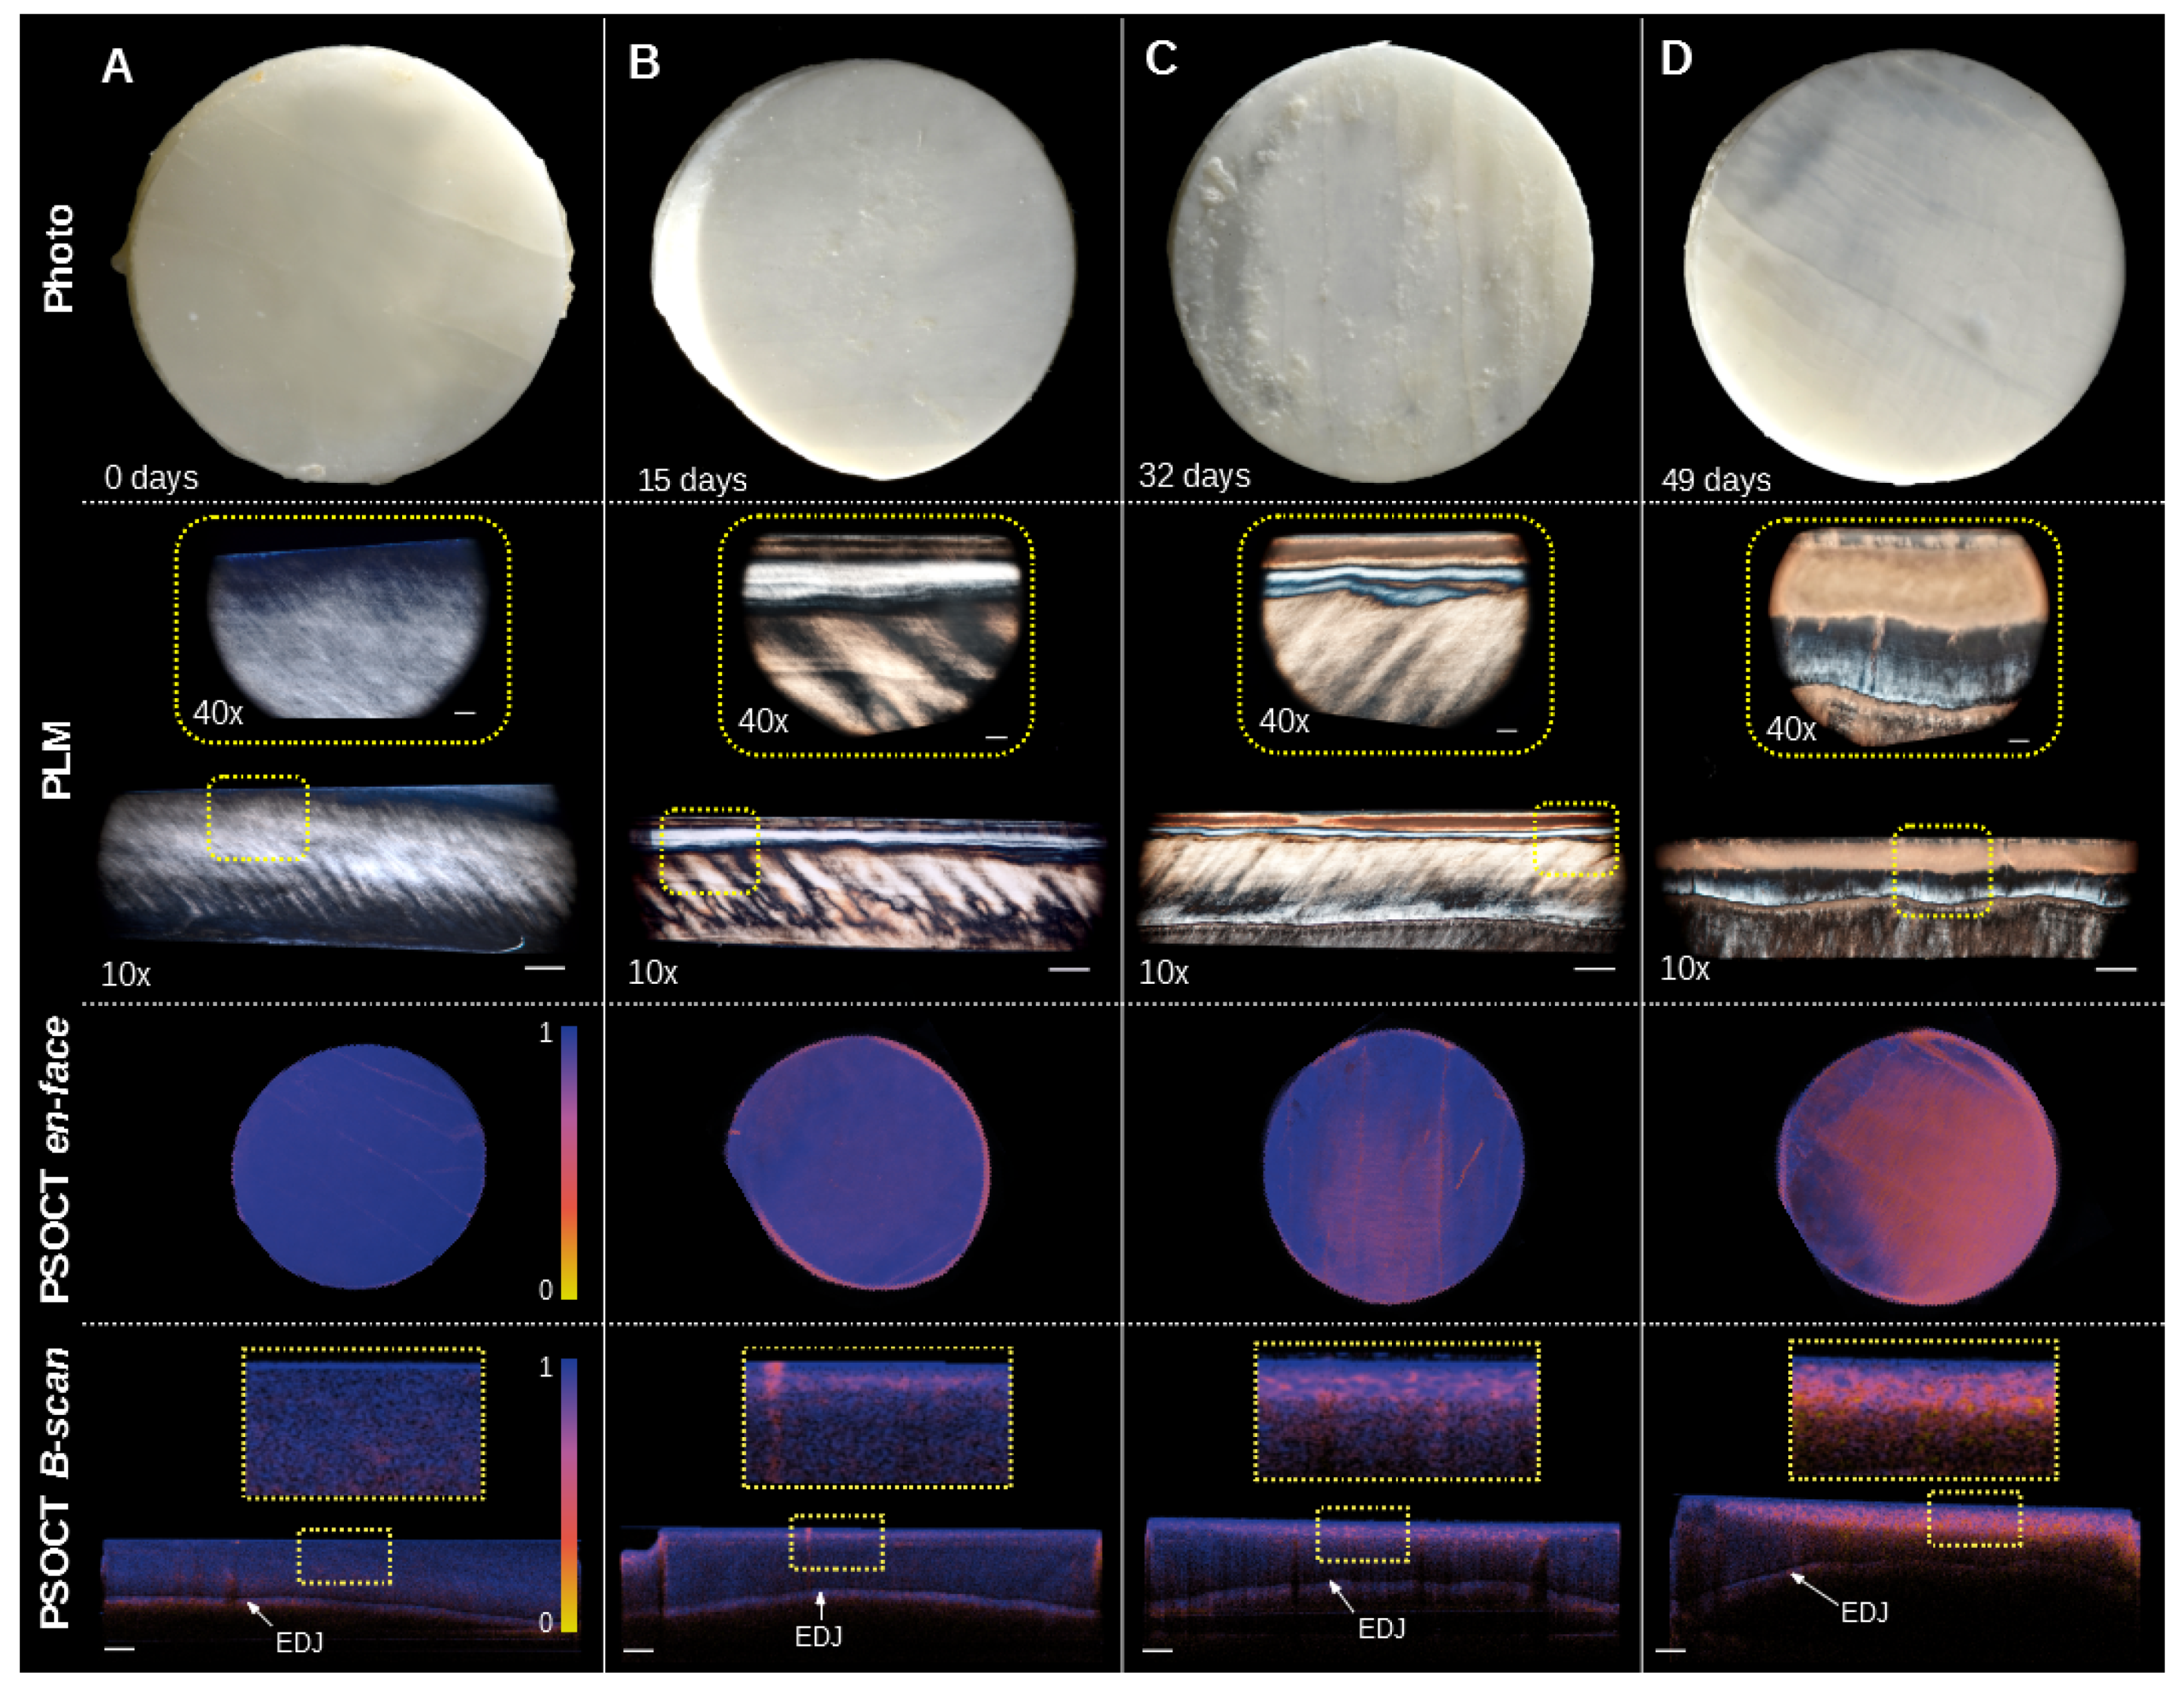
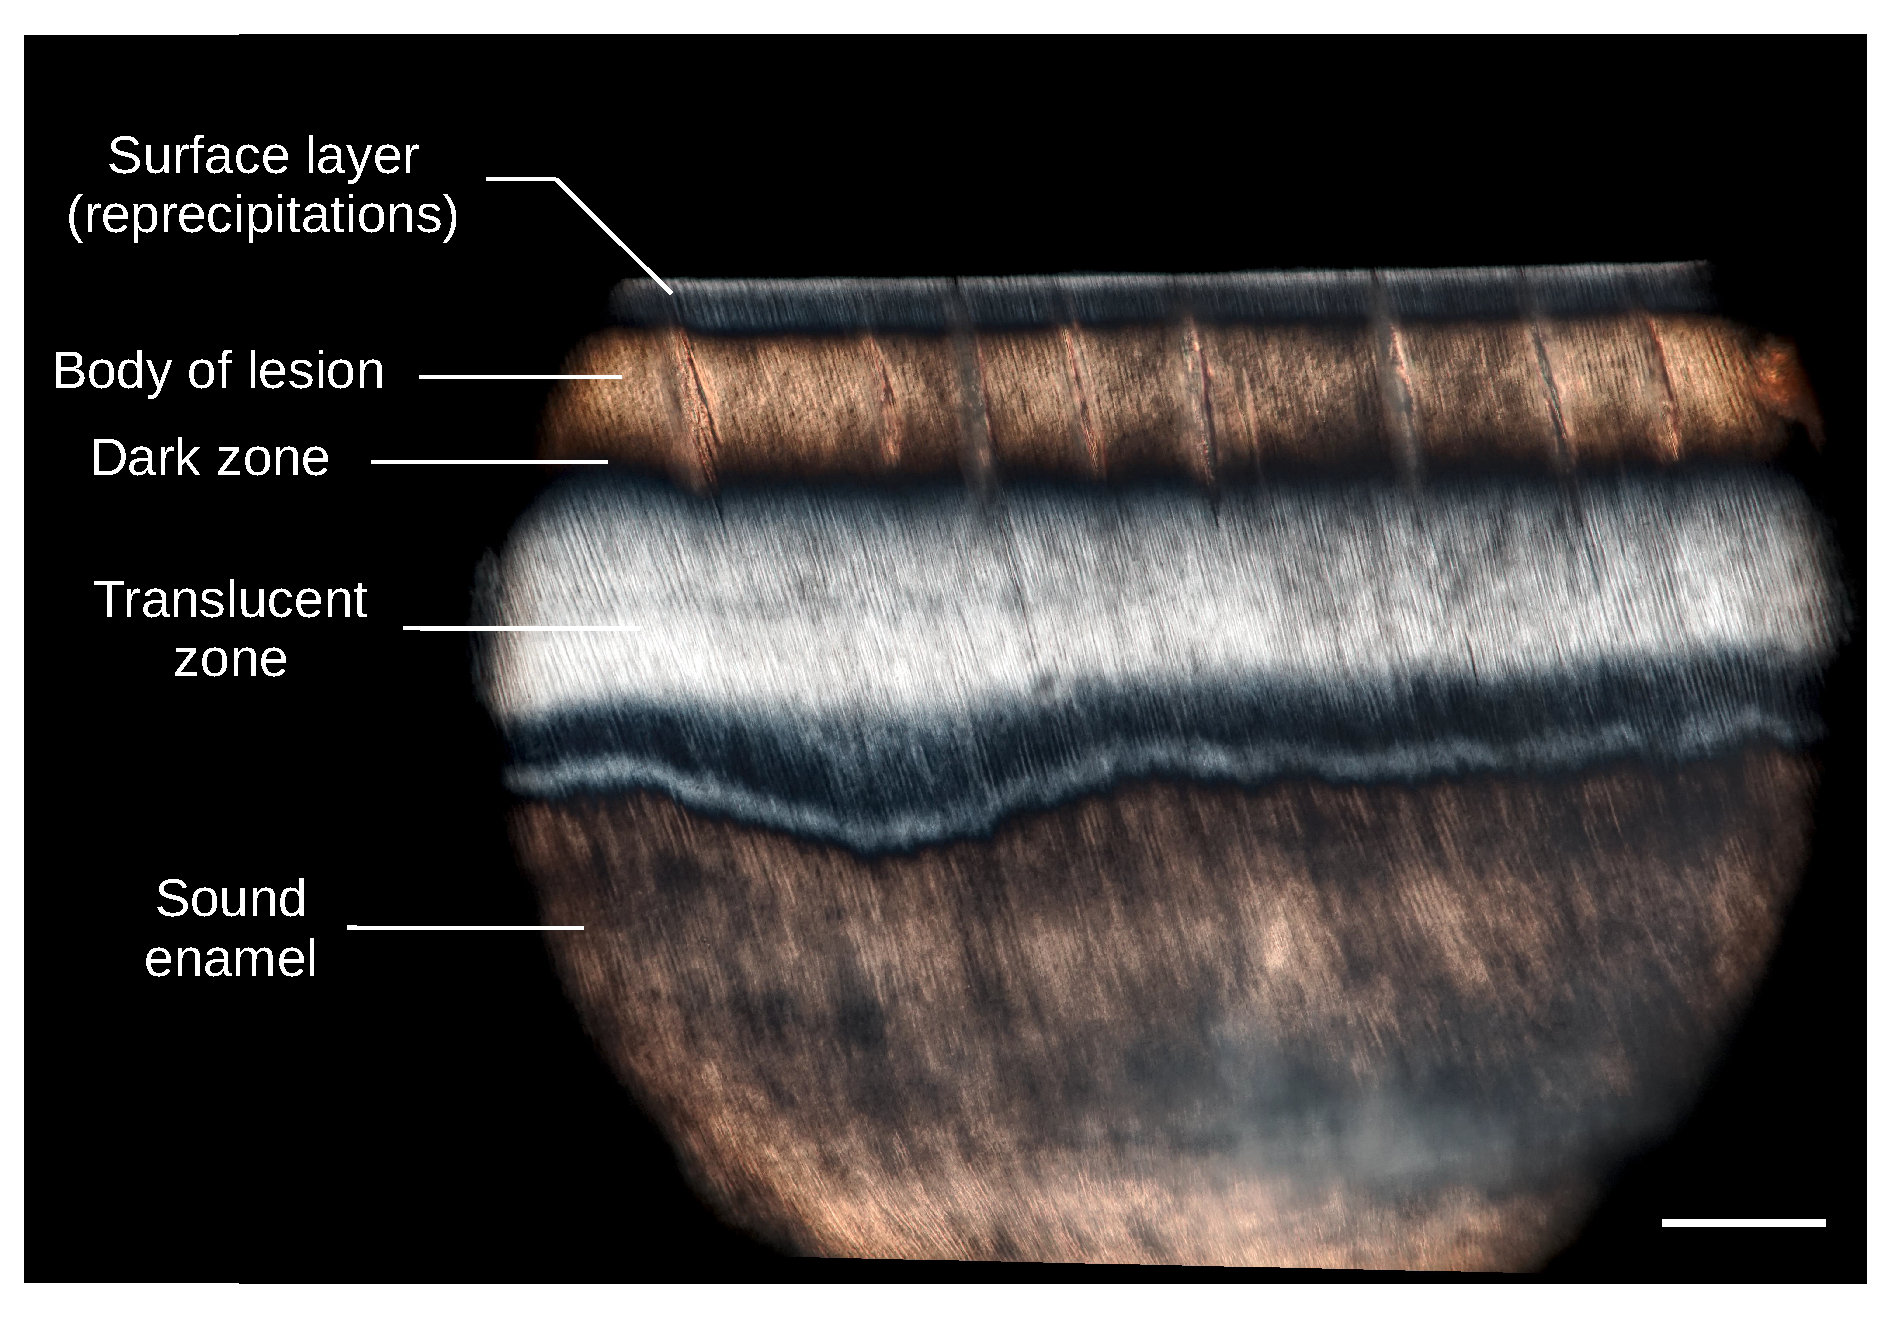
After the demineralization process, the slabs were embedded in a plastic polymerization system (Technovit 9100, Kulzer GmbH, Hanau, Germany) and cut into thin cross sections of about 50 µm to 80 µm thickness. The thin sections were analyzed with a light microscope (Leica DMRB, Leica Microsystems GmbH, Wetzlar, Germany), equipped with a perpendicularly adjusted polarizer and analyzer in the beam path and objectives with 10× and 40× magnification, and without utilizing an immersion medium. For PLM evaluation, the thin section at the center of the slab was used, and lesion depth was measured with the open-source image analysis software Fiji/ImageJ [29]. Lesion depth measurements, which evaluated the lesion extent up to the translucent zone if present, were compared with the obtained mean DOP values at the central ROI by linear regression analysis.

3. Results

An overview of the results by means of specific time points and samples of the demineralization protocol is shown in Figure 2. With increasing exposition time in the acetic buffer solution, i.e., samples representing the specific duration, changes of the enamel translucency were visible in the photographs. The slabs developed a brighter surface with increased scattering and partly adhesion of the dissolved minerals (Figure 2C). The photographs also show irregularly distributed demineralization areas at the enamel surface, causing a marmorizing effect of the slab (Figure 2D). In sound enamel, the PLM images at Figure 1A reveal the ordered, diagonal-aligned structure of the hydroxyapatite crystal that reaches to the surface of the enamel layer. After 15 days of exposition in the acetic buffer solution, the slabs developed characteristic zones of demineralization (Figure 3) [30,31]. This includes the surface zone of high mineral content, similar to sound enamel due to the redeposition of dissolved material—i.e., reprecipitations; the body of the lesion with greatest demineralization and porosity; an intermediate dark zone with altered birefringence and structure of the enamel; and a translucent zone of less large pores and initial demineralization.
In the further course, the demineralization layer was predominantly defined by the body of the lesion (Figure 2C,D; PLM). The measured thickness of the demineralization layer increased over time (Figure 4A) whereas the maximum lesion depth was 419 µm at day 49. The general increase of lesion depth over time also showed a high variability with an outlier at day 34 (Figure 4A; lesion depth: 62 µm). PSOCT en-face representations of DOP values showed no depolarizing effect at the sound enamel layer at day 0, which can be confirmed by the cross-sectional B-scan (Figure 2A; PSOCT). A slightly higher depolarization was observed at day 15 (Figure 2B; PSOCT en-face), which became more pronounced in the corresponding B-scan where a subsurface layer with decreased DOP is present (zoom view of PSOCT B-scan at Figure 2B). With further demineralization, an increased depolarization is visible, indicated by decreasing DOP values in the en-face projections at Figure 2C,D. The corresponding B-scans show a strong depolarization (low DOP values). The linear regression between lesion depth measured with PLM and the mean DOP values at the central region of interest showed a substantial linear correlation (Figure 4B; R 2 = 0.7118 ).

4. Discussion

PSOCT-based representations of depolarization were presented for imaging enamel demineralization induced by an artificial lesion model and compared with PLM images of corresponding thin sections. Even though optical coherence tomography is not capable of resolving histological features as represented by microscopy, previous work has demonstrated the potential of assessing the related intrinsic characteristics from the scattering and attenuating properties [32]. Here, PSOCT enables the nondestructive detection of scattering and polarization properties linked to early demineralization, which typically cannot be detected in bitewing radiographs. For this purpose, we adapted the noise-immune DOP as proposed by Makita et al. [12] and found a visible depolarization contrast at DOP representations for early demineralization stages that were confirmed by PLM images. Besides the common B-scan representation providing a section plane similar to PLM, en-face imaging provided an overview of the extent of the demineralization area. These sample-specific variations, resulting in variations of the measured lesion depth over the investigated time period (Figure 4A), could be due to variations of the surface and sample morphology, i.e., microcracks or surface roughness. In addition, flattening and polishing during the manual preparation process of the slabs presumably made the surface more susceptible to dissolution compared to clinical conditions [33]. The simplified demineralization model produced characteristic zones of demineralization (see Figure 3) that can be found in natural enamel lesions [30,31]. It should be noted that this model did not aim to simulate in situ conditions considering remineralization and cycle-based processes, but rather to assess the suitability of DOP imaging for monitoring the initial caries process under constant conditions and the relation to progression stage. Hereby, the regression analysis shows a clear linear correlation between the lesion depth and the calculated mean DOP values. However, high DOP values were associated with a high variation of lesion depths, whereas this relationship was more consistent with a linear decrease of the DOP at demineralization depths >150 µm.
Since the results of PLM showed that those demineralizations were dominated by the body of the lesion, we hypothesize that changes of polarization that contributes to the DOP representations are mainly determined by structures that exhibit a pore volume of 5%–25% (sound enamel: 0.1%) [2]. This hypothesis is supported by depolarization measurements based on polarization-resolved Raman microscopy at initial enamel caries that showed that the depolarization ratio of a hydroxyapatite-associated band intensity is also primarily determined by the body of the lesion [34]. A further demineralization with an increased exposition time to the acetic buffer solution could expand the correlation to lower depolarization values and higher lesion depths. Based on the observed heterogeneous demineralization process, it should be considered that this correlation could be impaired by an inaccurate matching of the selected thin section for PLM and the analyzed DOP region. In order to minimize specimen-specific variations, DOP analysis of the same specimen for the entire demineralization protocol will be part of further investigations. Since such a longitudinal study design does not allow destructive imaging with PLM, X-ray microcomputed tomography could be used as a complementary reference method during the study and supported by conclusive PLM and histological examination of the samples.
Overall, the results indicate that assessing the demineralization stage by means of the DOP is feasible. As this investigation showed the correlation of near-surface demineralization and DOP measurements, it is in mutual correspondence with cross-polarization OCT-based studies [5,8,9], but did not yet prove the DOP’s decisive advantages in the presence of various polarization alterations, e.g., a layered structure of sound birefringent enamel and underlying depolarizing caries. Lippok et al. demonstrated that PSOCT-based quantitative depolarization measurements are possible for retinal pigment epithelium imaging, even in the presence of additional polarization changes, i.e., sample and system birefringence [35]. Further studies are supposed to leverage this approach towards quantitative assessment of enamel demineralization independent of ambient conditions.
There are different optical and nonoptical techniques for the detection and diagnosis of early caries lesions available, e.g., Raman spectroscopy and hyperspectral imaging [36] for in vitro research, or transillumination and fluorescence imaging for clinical and preclinical applications [37]. Our long-term goal is the clinical application of the DOP-based caries assessment, thus, integrating PSOCT in an intraoral probe setup is needed for an in-depth analysis of the proposed capabilities and the comparison with currently available modalities. Due to its noninvasive and nonionizing properties, PSOCT can be used in short intervals. Therefore, such a probe will potentially support the concept of minimally invasive dentistry by enabling the assessment of noncavitated lesions regarding their stage and progression.

5. Conclusions

In this study, PSOCT-based depolarization imaging at early stages of enamel demineralization was compared with lesion progression assessed by PLM. Despite the limitations of the simplified demineralization model, we found that the degree of polarization provides an intuitive contrast that showed good correlation with lesion progression. The additional en-face representation further enhances the spatial extension of the demineralization area. The implementation of the presented method in miniaturized dental probes could allow the in vivo evaluation of the DOP representation as a potential imaging modality for early caries detection.

Author Contributions

Conceptualization, all authors; methodology, F.T., J.G., S.B., and C.H.; software, J.G. and L.K.; validation, T.R., S.B., and J.W.; formal analysis, F.T. and J.G.; investigation, F.T. and J.G.; resources, F.T., J.G., T.R., and S.B.; data curation, F.T. and J.G.; writing—original draft preparation, F.T. and J.G.; writing—review and editing, all authors; visualization, F.T. and J.G.; supervision, J.W., L.K., E.K., and C.H.; project administration, F.T. and L.K.; funding acquisition, F.T., J.W., L.K., E.K., and C.H. All authors have read and agreed to the published version of the manuscript.

Funding

This project is co-financed with tax funds based on the budget decided by the members of the Saxon State Parliament. This project was supported by the European Union/European Social Fund (ESF) and the Free State of Saxony within the ESF junior research group “Optical Technologies in Medicine” (project number 100270108). The author Jonas Golde was supported by the European Union/European Social Fund (ESF) and the Free State of Saxony within a doctoral scholarship (project number 100284305).

Acknowledgments

We want to thank Diana Jünger for preparing the thin sections and Thomas Klinke for support in interpreting PLM images.

Conflicts of Interest

The authors declare no conflict of interest.

References

  1. Darling, A.I. Studies of the early lesion of enamel caries with transmitted light, polarized light and radiography. Br. Dent. J. 1956, 101, 289–297. [Google Scholar]
  2. Darling, A.I. Studies of the early lesion of enamel caries: Its nature, mode of spread, and points of entry. Br. Dent. J. 1958, 105, 119–135. [Google Scholar]
  3. Baumgartner, A.; Dichtl, S.; Hitzenberger, C.K.; Sattmann, H.; Robl, B.; Moritz, A.; Fercher, A.F.; Sperr, W. Polarization-Sensitive Optical Coherence Tomography of Dental Structures. Caries Res. 2000, 34, 59–69. [Google Scholar] [CrossRef] [PubMed]
  4. Everett, M.J.; Colston, B.W., Jr.; Sathyam, U.S.; Da Silva, L.B.; Fried, D.; Featherstone, J.D.B. Noninvasive Diagnosis of Early Caries with Polarization-Sensitive Optical Coherence Tomography (PS-OCT). In Proceedings of the BIOS ’99 International Biomedical Optics Symposium, San Jose, CA, USA, 23–29 January 1999; Lasers in Dentistry V. Featherstone, J.D.B., Rechmann, P., Fried, D., Eds.; International Society for Optics and Photonics: Bellingham, WA, USA, 1999; Volume 3593, p. 177. [Google Scholar] [CrossRef]
  5. Fried, D.; Xie, J.; Shafi, S.; Featherstone, J.D.B.; Breunig, T.M.; Le, C. Imaging caries lesions and lesion progression with polarization sensitive optical coherence tomography. J. Biomed. Opt. 2002, 7, 618. [Google Scholar] [CrossRef]
  6. Jones, R.S.; Darling, C.L.; Featherstone, J.D.; Fried, D. Imaging artificial caries on the occlusal surfaces with polarization-sensitive optical coherence tomography. Caries Res. 2006, 40, 81–89. [Google Scholar] [CrossRef]
  7. Kang, H.; Darling, C.L.; Fried, D. Nondestructive monitoring of the repair of enamel artificial lesions by an acidic remineralization model using polarization-sensitive optical coherence tomography. Dent. Mater. 2012, 28, 488–494. [Google Scholar] [CrossRef] [Green Version]
  8. Lee, R.C.; Kang, H.; Darling, C.L.; Fried, D. Automated assessment of the remineralization of artificial enamel lesions with polarization-sensitive optical coherence tomography. Biomed. Opt. Express 2014, 5, 2950. [Google Scholar] [CrossRef] [Green Version]
  9. Chan, K.H.; Chan, A.C.; Fried, W.A.; Simon, J.C.; Darling, C.L.; Fried, D. Use of 2D images of depth and integrated reflectivity to represent the severity of demineralization in cross-polarization optical coherence tomography. J. Biophotonics 2015, 8, 36–45. [Google Scholar] [CrossRef] [Green Version]
  10. Golde, J.; Tetschke, F.; Walther, J.; Rosenauer, T.; Hempel, F.; Hannig, C.; Koch, E. Detection of carious lesions utilizing depolarization imaging by polarization sensitive optical coherence tomography. J. Biomed. Opt. 2018, 23, 1. [Google Scholar] [CrossRef] [Green Version]
  11. Golde, J.; Tetschke, F.; Walther, J.; Rosenauer, T.; Hempel, F.; Hannig, C.; Koch, E.; Kirsten, L. Cross-sectional and en-face depolarization imaging for the assessment of dental lesions. Curr. Dir. Biomed. Eng. 2018, 4, 301–304. [Google Scholar] [CrossRef]
  12. Makita, S.; Hong, Y.J.; Miura, M.; Yasuno, Y. Degree of polarization uniformity with high noise immunity using polarization-sensitive optical coherence tomography. Opt. Lett. 2014, 39, 6783. [Google Scholar] [CrossRef] [PubMed]
  13. Golde, J.; Tetschke, F.; Vosahlo, R.; Walther, J.; Hannig, C.; Koch, E.; Kirsten, L. Assessment of Occlusal Enamel Alterations Utilizing Depolarization Imaging Based on PS-OCT. In Proceedings of the SPIE 11078, Optical Coherence Imaging Techniques and Imaging in Scattering Media III, Munich, Germany, 23–27 June 2019; p. 24. [Google Scholar] [CrossRef]
  14. Xuelian, H.; Qiang, G.; Biao, R.; Yuqing, L.; Xuedong, Z. Models in Caries Research. In Dental Caries: Principles and Management; Springer: Berlin/Heidelberg, Germany, 2016; pp. 157–173. [Google Scholar] [CrossRef]
  15. De Rooij, J.F.; Arends, J.; Kolar, Z. Diffusion of monofluorophosphate in whole bovine Enamel at pH 7. Caries Res. 1981, 15, 363–368. [Google Scholar] [CrossRef] [PubMed]
  16. Featherstone, J.D.; Mellberg, J.R. Relative rates of progress of artificial carious lesions in bovine, ovine and human enamel. Caries Res. 1981, 15, 109–114. [Google Scholar] [CrossRef] [PubMed]
  17. Jung, D.J.; Al-Ahmad, A.; Follo, M.; Spitzmüller, B.; Hoth-Hannig, W.; Hannig, M.; Hannig, C. Visualization of initial bacterial colonization on dentine and enamel in situ. J. Microbiol. Methods 2010, 81, 166–174. [Google Scholar] [CrossRef]
  18. Deimling, D.; Breschi, L.; Hoth-Hannig, W.; Ruggeri, A.; Hannig, C.; Nekrashevych, Y.; Prati, C.; Hannig, M. Electron microscopic detection of salivary α-amylase in the pellicle formed in situ. Eur. J. Oral Sci. 2004, 112, 503–509. [Google Scholar] [CrossRef]
  19. Deimling, D.; Hannig, C.; Hoth-Hannig, W.; Schmitz, P.; Schulte-Mönting, J.; Hannig, M. Non-destructive visualisation of protective proteins in the in situ pellicle. Clin. Oral Investig. 2007, 11, 211–216. [Google Scholar] [CrossRef]
  20. Yu, O.Y.; Mei, M.L.; Zhao, I.S.; Lo, E.C.M.; Chu, C.H. Effects of fluoride on two chemical models of enamel demineralization. Materials 2017, 10, 1245. [Google Scholar] [CrossRef] [Green Version]
  21. Schmidlin, P.; Zobrist, K.; Attin, T.; Wegehaupt, F. In vitro re-hardening of artificial enamel caries lesions using enamel matrix proteins or self-assembling peptides. J. Appl. Oral Sci. 2016, 24, 31–36. [Google Scholar] [CrossRef] [Green Version]
  22. Schwendicke, F.; Eggers, K.; Meyer-Lueckel, H.; Dörfer, C.; Kovalev, A.; Gorb, S.; Paris, S. In vitro induction of residual caries lesions in dentin: Comparative mineral loss and nano-hardness analysis. Caries Res. 2015, 49, 259–265. [Google Scholar] [CrossRef]
  23. Maia, A.M.A.; de Freitas, A.Z.; de Campello, S.L.; Gomes, A.S.L.; Karlsson, L. Evaluation of dental enamel caries assessment using Quantitative Light Induced Fluorescence and Optical Coherence Tomography. J. Biophotonics 2016, 9, 596–602. [Google Scholar] [CrossRef]
  24. Oliveira, M.R.C.; Oliveira, P.H.C.; Oliveira, L.H.C.; Sfalcin, R.A.; Prates, R.A.; Navarro, R.S.; Cesar, P.F.; Deana, A.M.; Chavantes, M.C.; Bussadori, S.K.; et al. Influence of Ultrapulsed CO2 Laser, before Application of Different Types of Fluoride, on the Increase of Microhardness of Enamel in Vitro. Biomed Res. Int. 2018, 2018, 1–7. [Google Scholar] [CrossRef] [PubMed] [Green Version]
  25. Buskes, J.A.; Christoffersen, J.; Arends, J. Lesion formation and lesion remineralization in enamel under constant composition conditions: A new technique with applications. Caries Res. 1985, 19, 490–496. [Google Scholar] [CrossRef] [PubMed]
  26. De Boer, J.F.; Hitzenberger, C.K.; Yasuno, Y. Polarization sensitive optical coherence tomography—A review [Invited]. Biomed. Opt. Express 2017, 8, 1838. [Google Scholar] [CrossRef] [PubMed] [Green Version]
  27. Meng, Z.; Yao, X.S.; Yao, H.; Liang, Y.; Liu, T.; Li, Y.; Wang, G.; Lan, S. Measurement of the refractive index of human teeth by optical coherence tomography. J. Biomed. Opt. 2009, 14, 034010. [Google Scholar] [CrossRef] [PubMed]
  28. Nazari, A.; Sadr, A.; Campillo-Funollet, M.; Nakashima, S.; Shimada, Y.; Tagami, J.; Sumi, Y. Effect of hydration on assessment of early enamel lesion using swept-source optical coherence tomography. J. Biophotonics 2013, 6, 171–177. [Google Scholar] [CrossRef]
  29. Schindelin, J.; Arganda-Carreras, I.; Frise, E.; Kaynig, V.; Longair, M.; Pietzsch, T.; Preibisch, S.; Rueden, C.; Saalfeld, S.; Schmid, B.; et al. Fiji: An open-source platform for biological-image analysis. Nat. Methods 2012, 9, 676–682. [Google Scholar] [CrossRef] [Green Version]
  30. Silverstone, L.M.; Hicks, M.J.; Featherstone, M.J. Dynamic factors affecting lesion initiation and progression in human dental enamel. II. Surface morphology of sound enamel and carieslike lesions of enamel. Quintessence Int. 1988, 19. [Google Scholar]
  31. Robinson, C.; Shore, R.C.; Brookes, S.J.; Strafford, S.; Wood, S.R.; Kirkham, J. The chemistry of enamel caries. Crit. Rev. Oral Biol. Med. 2000, 11, 481–495. [Google Scholar] [CrossRef]
  32. Turani, Z.; Fatemizadeh, E.; Blumetti, T.; Daveluy, S.; Moraes, A.F.; Chen, W.; Mehregan, D.; Andersen, P.E.; Nasiriavanaki, M. Optical radiomic signatures derived from optical coherence tomography images improve identification of melanoma. Cancer Res. 2019, 79, 2021–2030. [Google Scholar] [CrossRef] [Green Version]
  33. Meurman, J.H.; Frank, R.M. Scanning electron microscopic study of the effect of salivary pellicle on enamel erosion. Caries Res. 1991, 25, 1–6. [Google Scholar] [CrossRef]
  34. Wang, Z.; Zheng, W.; Hsu, S.C.Y.; Huang, Z. Optical diagnosis and characterization of dental caries with polarization-resolved hyperspectral stimulated Raman scattering microscopy. Biomed. Opt. Express 2016, 7, 1284. [Google Scholar] [CrossRef] [PubMed] [Green Version]
  35. Lippok, N.; Braaf, B.; Villiger, M.; Oh, W.Y.; Vakoc, B.J.; Bouma, B.E. Quantitative depolarization measurements for fiber-based polarization-sensitive optical frequency domain imaging of the retinal pigment epithelium. J. Biophotonics 2019, 12, e201800156. [Google Scholar] [CrossRef] [PubMed]
  36. Tetschke, F.; Kirsten, L.; Golde, J.; Walther, J.; Galli, R.; Koch, E.; Hannig, C. Application of optical and spectroscopic technologies for the characterization of carious lesions in vitro. Biomed. Tech. 2018, 63, 519–527. [Google Scholar] [CrossRef] [PubMed]
  37. Gomez, J. Detection and diagnosis of the early caries lesion. BMC Oral Health 2015, 15. [Google Scholar] [CrossRef] [Green Version]
Figure 1. Workflow of the preparation and artificial demineralization of bovine enamel slabs, polarization-sensitive optical coherence tomography (PSOCT) imaging, cross-sectioning and polarized light microscopy (PLM) measurements, and data analysis.
Applsci 10 02971 g001
Figure 2. Overview of the results: Photographs of the demineralized enamel slabs, PLM images of the thin cross sections with two different magnifications, degree of polarization (DOP) representations of the PSOCT measurements as en-face projections and B-scans, including samples with a demineralization time of 0 (A), 15 (B), 32 (C), and 49 (D) days. EDJ: Enamel dentin junction. Scale bars PLM: 400 µm (10×), 80 µm (40×); Scale bar PSOCT: 400 µm.
Applsci 10 02971 g002
Figure 3. PLM image (40× magnification) of an enamel slab at 25 days of demineralization with characteristic zones of lesion formation. Scale bar: 80 µm.
Applsci 10 02971 g003
Figure 4. (A) Measured lesion depth by PLM over the duration of acid exposition, i.e., stage of demineralization. (B) Scatter plot of the measured lesion depth by PLM and mean DOP at the central region of interest (ROI) of the slab. Linear regression (red line) shows a coefficient of determination of R 2 = 0.7118 .
Applsci 10 02971 g004

