Article

An FTIR Microspectroscopy Ratiometric Approach for Monitoring X-ray Irradiation Effects on SH-SY5Y Human Neuroblastoma Cells

1
Dipartimento di Medicina Sperimentale, Università della Campania “Luigi Vanvitelli”, 80138 Napoli, Italy
2
Istituto Nazionale di Fisica Nucleare - sezione di Napoli, 80100 Napoli, Italy
3
Dipartimento di Fisica “E. Pancini”, Università degli Studi di Napoli “Federico II”, 80100 Napoli, Italy
*
Author to whom correspondence should be addressed.
Appl. Sci. 2020, 10(8), 2974; https://doi.org/10.3390/app10082974
Submission received: 11 March 2020 / Revised: 18 April 2020 / Accepted: 22 April 2020 / Published: 24 April 2020
(This article belongs to the Special Issue Biological and Medical Applications of Vibrational Spectroscopy)

Abstract

:
The ability of Fourier transform infrared (FTIR) spectroscopy in analyzing cells at a molecular level was exploited for investigating the biochemical changes induced in protein, nucleic acid, lipid, and carbohydrate content of cells after irradiation by graded X-ray doses. Infrared spectra from in vitro SH-SY5Y neuroblastoma cells following exposure to X-rays (0, 2, 4, 6, 8, 10 Gy) were analyzed using a ratiometric approach by evaluating the ratios between the absorbance of significant peaks. The spectroscopic investigation was performed on cells fixed immediately (t0 cells) and 24 h (t24 cells) after irradiation to study both the initial radiation-induced damage and the effect of the ensuing cellular repair processes. The analysis of infrared spectra allowed us to detect changes in proteins, lipids, and nucleic acids attributable to X-ray exposure. The ratiometric analysis was able to quantify changes for the protein, lipid, and DNA components and to suggest the occurrence of apoptosis processes. The ratiometric study of Amide I band indicated also that the secondary structure of proteins was significantly modified. The comparison between the results from t0 and t24 cells indicated the occurrence of cellular recovery processes. The adopted approach can provide a very direct way to monitor changes for specific cellular components and can represent a valuable tool for developing innovative strategies to monitor cancer radiotherapy outcome.

1. Introduction

Radiation therapy (RT) plays a pivotal role in cancer treatment. Cancer resilience and (hyper)sensitivity of normal tissue to ionizing radiation may lead to local control failure and preclude personalized dose prescriptions (e.g., escalation regimes). Advancements of RT strategies can be obtained by taking into account the large difference in radiosensitivities displayed by both tumor and healthy cells among patients. RT tailoring requires rapid and accurate predictions of cellular radioresponse [1]. For this purpose, many predictive assays have been investigated thus far, but none of them are suitable for routine clinical implementation [2]. Moreover, these biochemical assays used for detecting radiation effects on cellular components can influence the biological samples causing changes in their structure due to chemical substances and elaborated preparation procedures. As a consequence, advances to personalized radiation therapy may benefit from the use of new, non-invasive, and fast optical methods able to examine radiation response in vitro or in vivo across a wide variety of biomolecules. Vibrational techniques such as Raman microspectroscopy [3,4,5] and Fourier transform infrared microspectroscopy (μ-FTIR) [6,7,8] can rapidly and non-invasively investigate biochemical components of cells and tissues with minimal sample preparation. These techniques are considered a valuable tool for the analysis of complex biological processes, such as proliferation and cell death process, attracting a growing interest in the field of radiation-induced cyto- and genotoxicity.
In particular, Gault and Lefaix [8] used FTIR spectroscopy to characterize radiation-induced apoptosis in human lymphocytes. The differences between the spectra for apoptotic and control lymphocytes show that the DNA content in the apoptotic cells decreases, while an increase of the bands of amide I and II of protein is visible. These results are in agreement with one of the possible pathways of radiation-induced apoptosis, which is characterized by a slow induction that requires active protein synthesis triggered by the detection of several DNA lesions. These authors showed the ability of the spectroscopy-based technique to distinguish between normal and apoptotic cells at the molecular level and to establish also a temporal scale of the phenomenon [9,10]. As previously demonstrated in radiation-induced apoptosis studies, these results show that FTIR, in correlation with established radiobiology techniques, might be useful for assessing early radiation- and oxidative-induced damage to nucleic acids and proteins in single human cells [11].
Meade et al. 2010 [12] performed a chemometric analysis of the variation of IR spectra of the human keratinocytes cell line (HaCaT) exposed to different γ-radiation doses. They also investigated the effects at different times after irradiation. The observed changes in FTIR spectra features signify a modification of metabolic activity concerning glucose synthesis for energy production in molecular transduction responses to γ-rays exposure. The absorbance differences in protein amide bands indicate the occurrence of dose-dependent secondary structural changes to protein, already observed by Gault et al. [9,10,11]. Such changes to protein structure have been proven to result from chain cleavage, formation of protein–protein crosslinks and amino acid degradation after γ-rays irradiation. In addition, spectral features evidence also a degradation of the structure and function of bio-membranes within the cell.
More recently, Gianoncelli et al. 2015 [13] used infrared spectroscopy to evaluate the effect of X-rays-cells interaction from a different perspective. They attempted to investigate the radiation damage of biological samples that represent a limiting factor when high-resolution X-ray microscopy is performed.
Many different approaches are nowadays available for infrared spectra data pre-processing and analysis as indicated by Baker et al. [6]. Some of the most popular pre-processing procedures are rubber band baseline correction and normalization to the Amide I or Amide II peak [6].
As far as concerns data analysis, many different univariate and multivariate approaches can be adopted [14,15,16]. In particular, multivariate analysis of infrared spectra collected from human cells exposed to ionizing radiation can allow the identification of the changes at protein, lipid, and amino and nucleic acid level and their dose-dependent behavior [12,17].
As an alternative to these multivariate approaches, some authors suggest that a ratiometric approach can be especially advantageous for highlighting and quantifying biochemical changes in µ-FTIR spectra related to samples in different experimental conditions [18,19,20,21]. For example, the protein/lipid ratio can be used to monitor sepsi infection in mice [22] and to differentiate cells in various growth phases [23]. Other properly chosen ratios have been also adopted for discriminating normal, borderline, and malignant ovarian tissues [24]; for comparing red blood cells from gastric cancer tissues [25]; for the early diagnosis of oral cancer [26]; and for monitoring breast cancer progression [27]. Hence, a well-done ratio analysis can indicate valuable spectral biomarkers and can provide a quantitative tool also in many biomedical applications.
In the present work, we chose a ratiometric approach for analyzing μ-FTIR spectra from SH-SY5Y neuroblastoma cells after the exposure to different doses of X-ray (0, 2, 4, 6, 8, 10 Gy). This approach can offer a very direct way to monitor changes for specific cellular components. In particular, the spectroscopic investigation has been carried out on cells fixed immediately (t0 cells) and 24 h after irradiation (t24 cells), in order to study both the early effects of the irradiation and those that remain after the cellular repair processes have taken place. The SH-SY5Y cell line is associated with the tumor pathology of greater incidence in infants, and it is the third most common in children, after leukemia and brain cancer [28]. In addition, it is of considerable importance in studies aiming to elaborate new approaches for treating and/or preventing disorders of the central nervous system [29,30,31,32]. The reported ratiometric analysis of infrared spectra allowed us to detect changes in proteins, lipids, and nucleic acids contributions due to X-ray radiation exposure, as well as to compare the difference arising between t0 and t24 cells.

2. Materials and Methods

2.1. Cell Line

The cells used in this study are from the SH-SY5Y neuroblastoma cell line (Figure S1). SH-SY5Y is a thrice-cloned (SK-N-SH -> SH-SY -> SH-SY5 -> SH-SY5Y) subline of the neuroblastoma cell line SK-N-SH which was established in 1970 from a metastatic bone tumor (ATCC, Manass, VA, USA). These cells are often used as in vitro models of neuronal function and differentiation (Koriyama et al. 2015). Cells were grown in DMEM medium with the addition of 20% fetal bovine serum, 1% of penicillin/streptomycin, and 1% of L-glutamine and incubated at 37 °C, 5% CO2.

2.2. Cell Sample Preparation and Treatments

The cells were seeded on MirrIR slides (25 × 25 mm2) (Kevley Technologies, Chesterland, OH, USA), a specific reflection FT-IR spectroscopy microscope slide, nested in Petri dish capsules. The slides were seeded at a density of about 104 cells/cm2 for a total of approximately 5 × 10 6 cells/Petri (Figure S2). Such a value for cell density insured both an inter-cell space for the measurement of the background signal without influencing cell survival, as well as the presence of clusters of cells indispensable to acquire a sufficiently intense signal.
X-ray doses were delivered using a STABILIPAN radiogen machine (Siemens, Munich, Germany) equipped with a Thomson tube TR 300F (250 kVp, 1 mm thick Cu foil filter, dose rate 0.95 Gy/min). Cellular samples derived from one single frozen vial, in order to avoid variation not deriving from external factors, were exposed to various doses of X-rays. In particular, cells exposed to 2 Gy, 4 Gy, 6 Gy, 8 Gy, and 10 Gy were investigated together with unexposed cells (0 Gy) used as a control. Incremental doses of 2 Gy have been chosen, as they are equal to the typical fractions administered daily in radiotherapy treatments. The use of the other doses would allow examining dose-dependent responses. Indeed, these doses are typically used to construct a clonogenic dose–response curve [33]. Right after the exposure, some samples were fixed using paraformaldehyde 3.7% in Phosphate Buffer Saline (PBS) solution for 20 min at room temperature. After this, they were washed in distilled water in order to eliminate the residue PBS. Another set of samples, maintained in the culture medium, was re-incubated after irradiation and allowed to recover for 24 h after exposure before the fixing procedure. Three replicas were prepared for all types of samples. The samples for µ-FTIR were then dried at room temperature and kept in a desiccator until analysis to minimize humidity of the samples. In fact, water molecules are characterized by a strong IR signal. Many authors agree that fixed cells rather than in vivo can be investigated by FTIR spectroscopy [14,27,34]. It is much more suitable to work with this kind of samples since the fixing procedure preserves the biochemical properties of the cells after the irradiation and during the measurements.

2.3. Spectra Acquisition

IR absorption spectra of the cell samples were obtained using a Spectrum One FTIR (PerkinElmer, Shelton, CT, USA) spectrometer equipped with a Perkin Elmer Multiscope system infrared microscope and an MCT (mercury–cadmium–telluride) FPA (focal-plane-array) detector. The measurements were performed at room temperature on cells grown on 25 × 25 mm2 MirrIR slides in transreflection mode. For each experimental condition, three slides were prepared. Spectra were acquired within an aperture of 100 × 100 μm2. Different regions were investigated on every slide, and three spectra were acquired for each position. The background signal was acquired in a region of the slide free of cells. The signal was collected in the spectral region between 3600 and 900 cm−1 using 64 scans with a spectral resolution of 4 cm−1 and a 5 s acquisition time for each spectrum at room temperature.

2.4. Data Analysis

The spectra were preliminarily processed before proceeding with the analysis. Subtraction of background spectrum, acquired in a free-cell zone of the slide was performed. A baseline and excess noise corrections were performed on the whole data set by means of a numerical procedure based on wavelet algorithms (“MATLAB Wavelet Toolbox”, MathWorks Inc., Natick, MA, USA) [35,36,37]. The FTIR signal was represented using the sum of elementary functions (wavelets) at different frequency scales in a hierarchical representation known as the Discrete Wavelet Transform (DWT). Starting from the decomposed parts, the signal can be reconstructed by an inverted process, knows as Inverse Discrete Wavelet Transform (IDWT); removing the last approximation component from the reconstruction process, to eliminate the smoother part of the signal from the spectra. Similarly, by removing the fast frequency components, it is possible to eliminate non-correlated noise signals. In our case, bi-orthogonal wavelets based on the B-spline function were employed for a ten-level decomposition of the signal. The signal was recalculated from detail components up to the nine levels. Average spectra with standard deviation were obtained for all sample types. All the spectra were normalized to have a total area equal to one.
The spectra were analyzed by using convoluted Lorentzian shaped vibrational modes. After a manual selection for the starting conditions of the procedure, a best-fit routine from the Origin software (Version 9.0, OriginLab Corporation, Northampton, MA, USA) was used to determine the optimized intensity, position, and width of the peaks. The χ2 parameter was used for estimating the convolution procedure performance (see [32]). The deconvolution procedure was mainly used for monitoring the changes in the peak position due to X-ray exposure.
The Amide I band was further examined since changes in protein configuration can induce meaningful variations in its characteristics [38,39,40]. To investigate protein secondary structure, Gauss-cross-Lorentzian shaped components were used for deconvoluting the Amide I band. The inflection points were localized in the second-derivative spectra, using the Savitsky–Golay algorithm (five-data point window) (“GRAMS/AI”, Thermo Fischer Scientific, Waltham, MA, USA). The area of each absorption band was considered to be proportional to the relative amount of the structure in infrared spectra [38,41,42].
Further quantitative information about the changes occurring in the infrared spectra related to different experimental conditions was obtained by evaluating the ratios between the absorbance of selected peaks. The list of these ratios, related to protein content, rearrangement, and phosphorylation; DNA content and modification; and lipid content and saturation, is reported in Table 1. The ratio values obtained from the spectra acquired from different samples (different dose, different fixation time) were compared using an un-paired t-test with a 0.05% significance level.

3. Results and Discussion

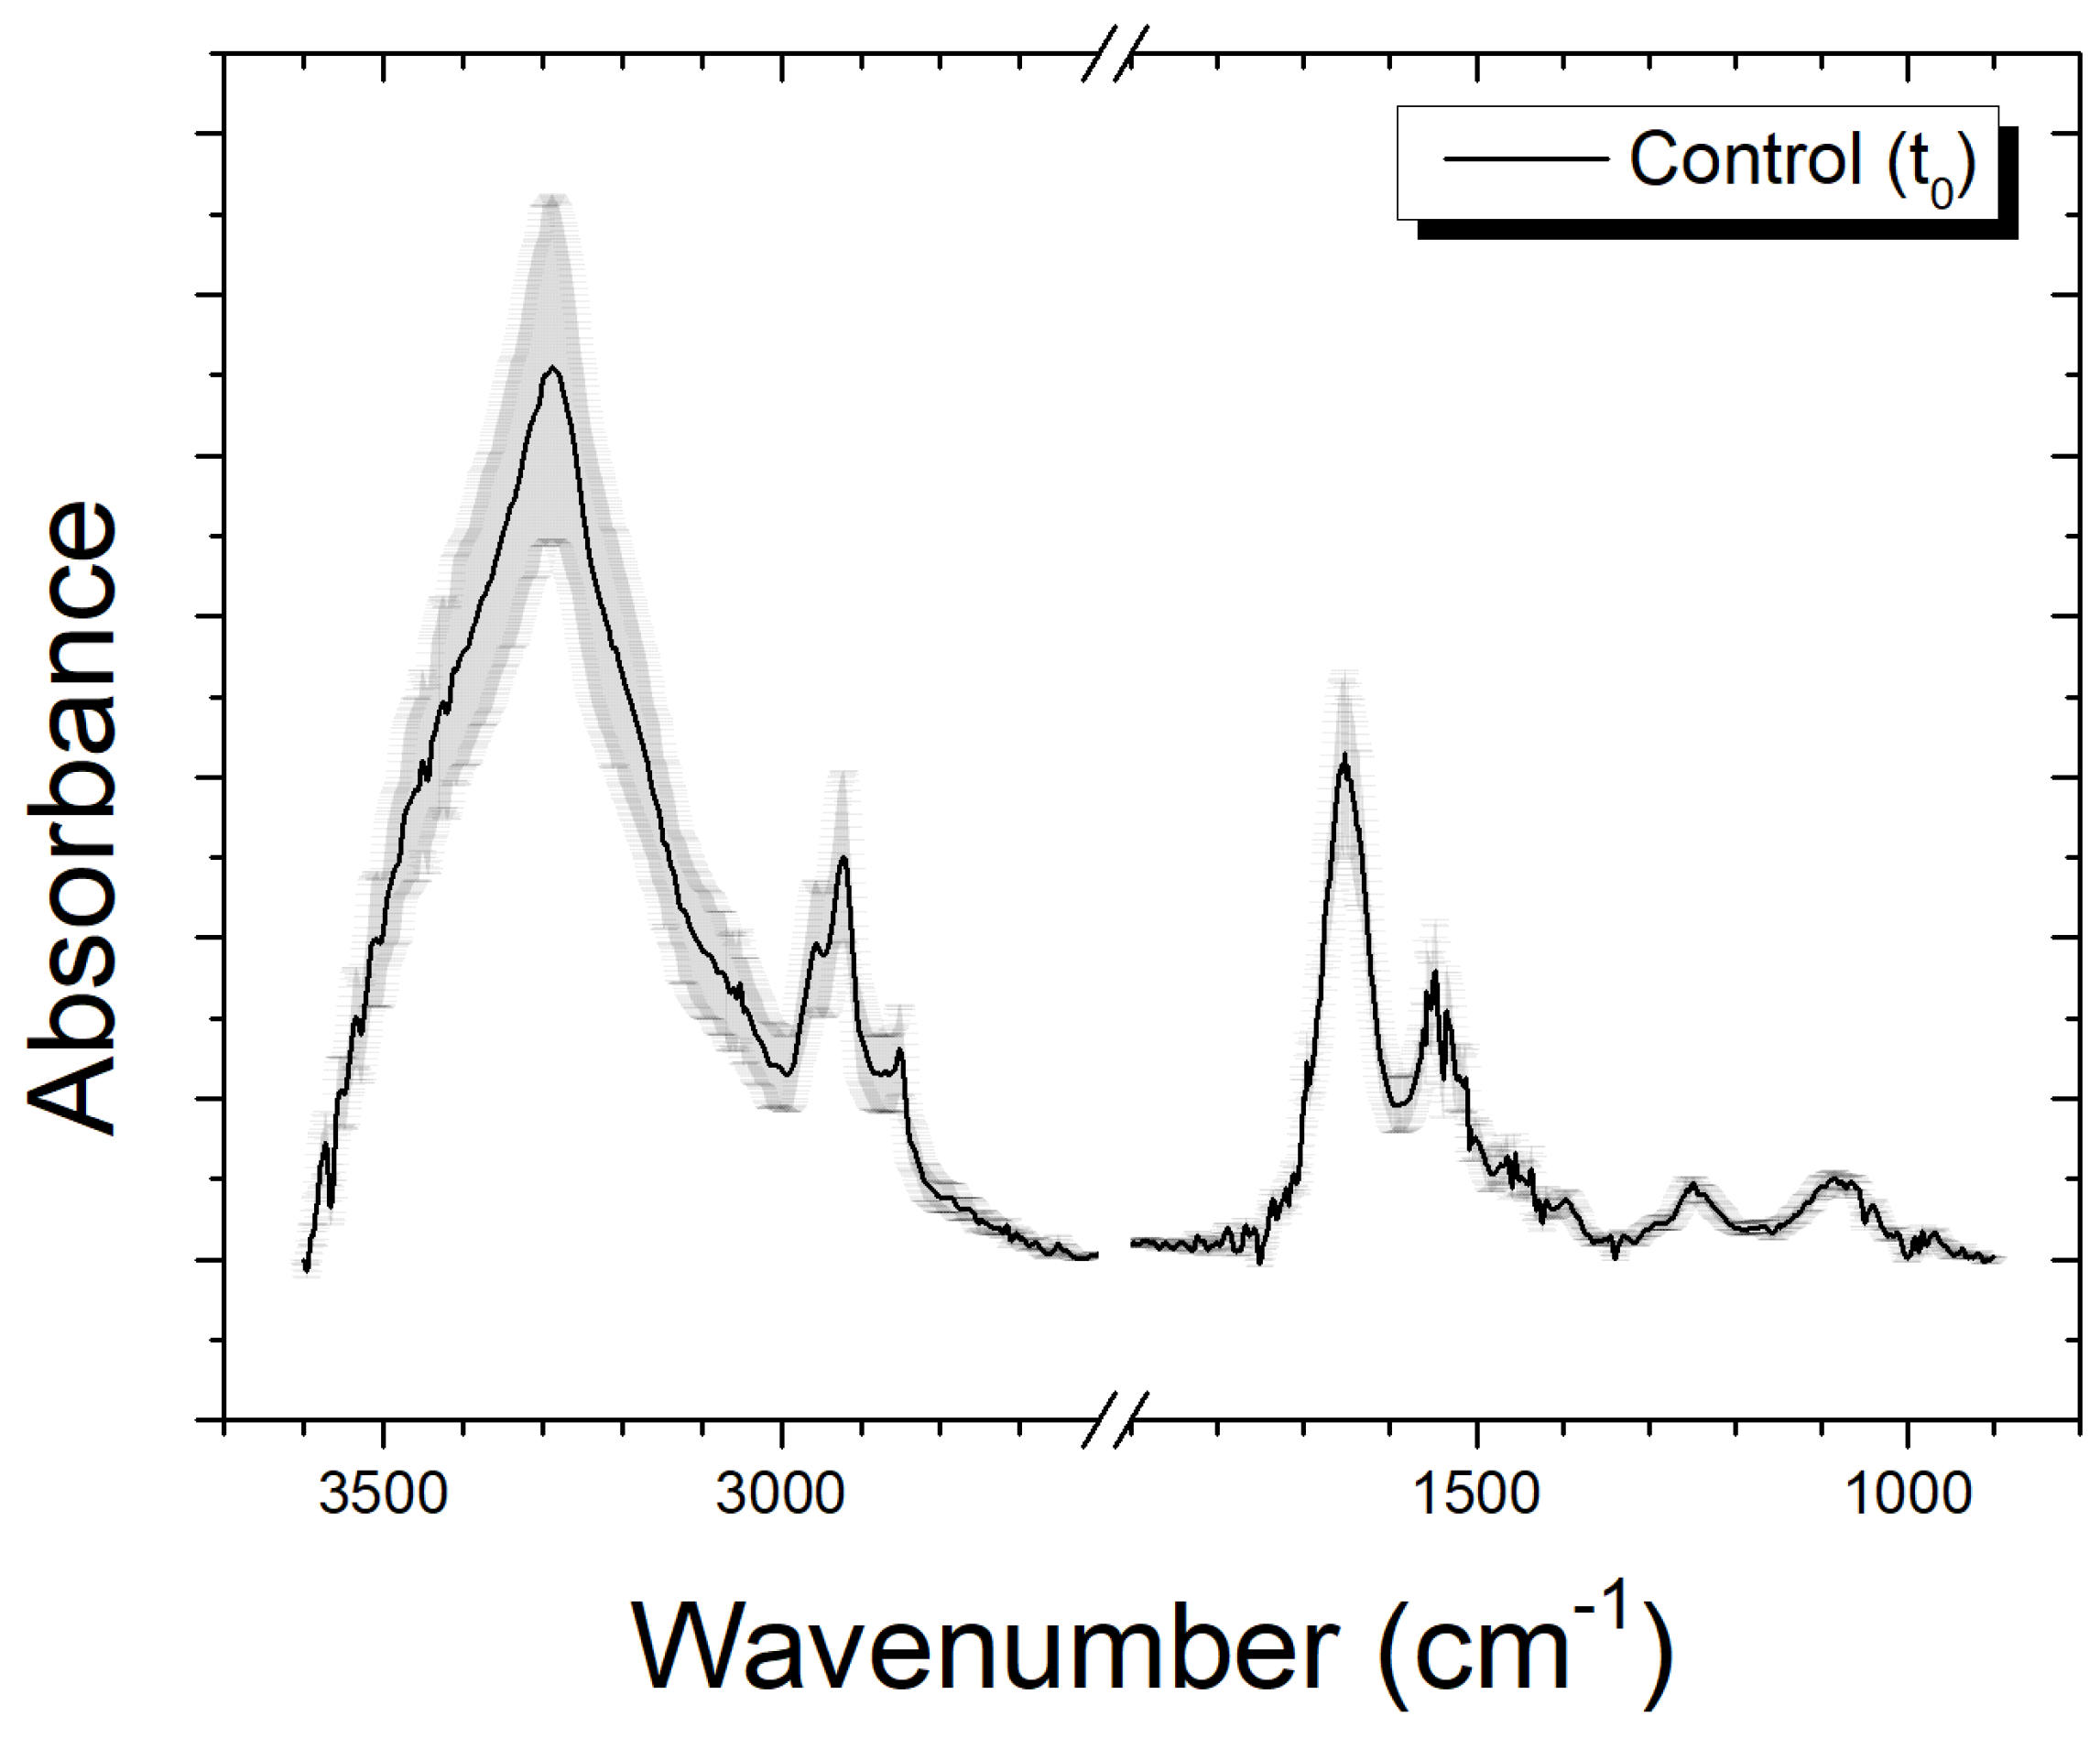
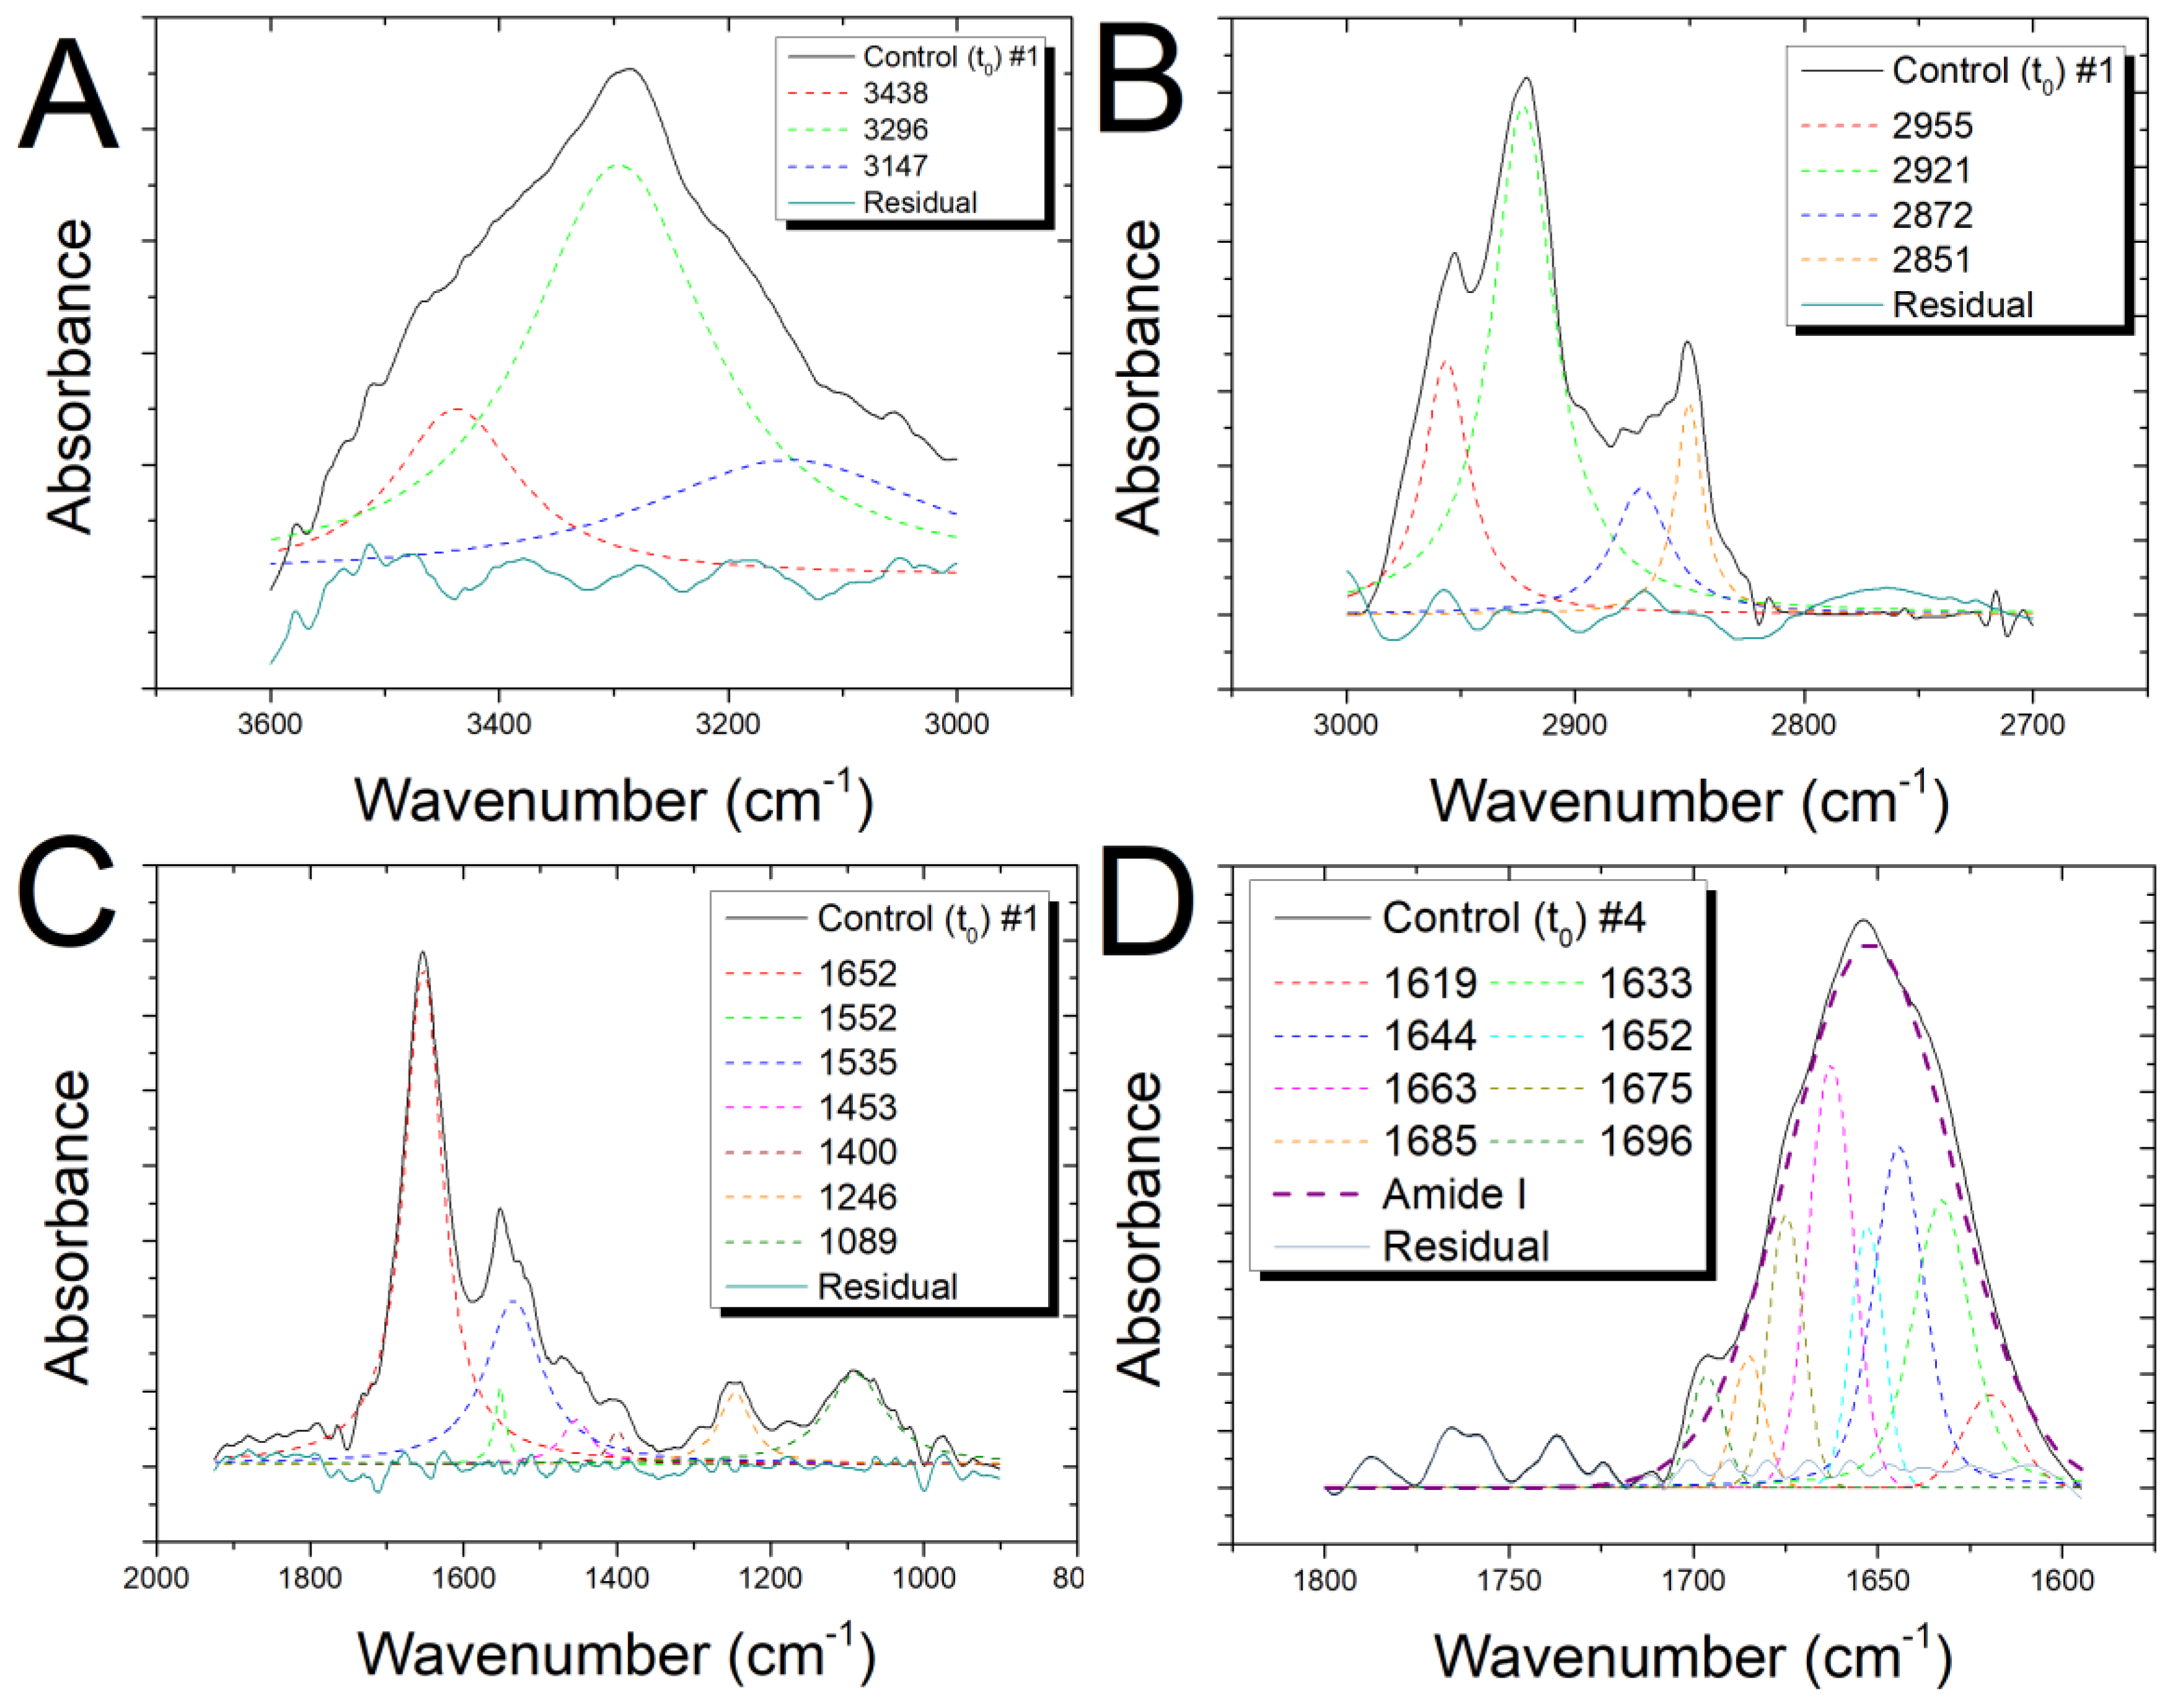
3.1. Features of Infrared Spectra from Control Cells

In FTIR spectra of SH-SY5Y neuroblastoma cells, several bands related to the vibrational modes of the biologic molecules of cells constituents (lipids, proteins, DNA, etc.) are present. In Figure 1, the average spectrum of an unexposed sample is reported, obtained for the 3600–900 cm−1 spectral region. The spectrum appears to be divided into two principal zones with different visible peaks. The range from 3600 to 2600 cm−1 (Figure 2A,B) is generally indicated as high wavenumber region (HWR) and presents bands that are due to the contribution of proteins, lipids, and carbohydrates. In particular, the bands in the range of 3200–3500 cm−1 are assigned to the amide A (–N–H) stretching motion of peptide backbones of proteins amino acids and O–H stretching of carbohydrate polysaccharides, while the band at ≈3150 cm−1 is mainly related to –NH3+ asymmetric stretching of free amino acids. The two peaks at ≈2960 cm−1 and ≈2870 cm−1 are attributed, respectively, to the asymmetric and symmetric stretching of the methyl groups (–CH3) given by cellular proteins and lipids contribution. The structures at ≈2920 cm−1 and ≈2850 cm−1 are, respectively, due to the asymmetric and symmetric stretching of the methylene groups of membrane lipids (–CH2).
In the so-called fingerprint region (1800–900 cm−1) (Figure 2C), different peaks that are representative of proteins and nucleic acids are clearly visible. The two peaks at ≈1650 cm−1 and ≈1540 cm−1 are mainly assigned to the amide I (C=O and C–N) and amide II (N–H and C–N). The band at ≈1450 cm−1 is related to symmetric and asymmetric bending of the methylene and methyl groups (–CH2 and –CH3) and to –CH2 scissoring of proteins and lipids, and the peak at ≈1400 is due to COO group asymmetric stretching of proteins. The asymmetric and symmetric –PO2 stretching vibrations of the phosphodiester nucleic acid backbone are associated with the two bands at ≈1240 cm−1 and ≈1085 cm−1, respectively, with a contribution from C–O–P stretching of protein and lipids.
The Amide I band (Figure 2D) can be seen as a convolution of the contributions arising from the various secondary structures of proteins; the bands between 1620–1640 cm−1 and ≈1690 cm−1 can presumably be assigned to β-sheet structures with the ≈1620 and 1690 cm−1 band characteristic of the anti-parallel β-sheet structures. The band at ≈ 1660 cm−1 is mainly attributed to α-helix secondary structures, while the random structures and β-turns contribute to the bands at ≈1650 and in the 1670–1685 cm−1 range, respectively.
In Figure 2A–D, the deconvolution for the spectra in the regions 3600–3000 cm−1, 3000–2700 cm−1, 2000–600 cm−1, and 1800–1600 cm−1 are, respectively, shown. In Table S1 (Supplementary Material), the assignments for all the resolved peaks are shown [10,12,13,39,47]. In Tables S2 and S3 (Supplementary Material), the assignments for the subcomponents of the Amide I region are shown [37,38,39].

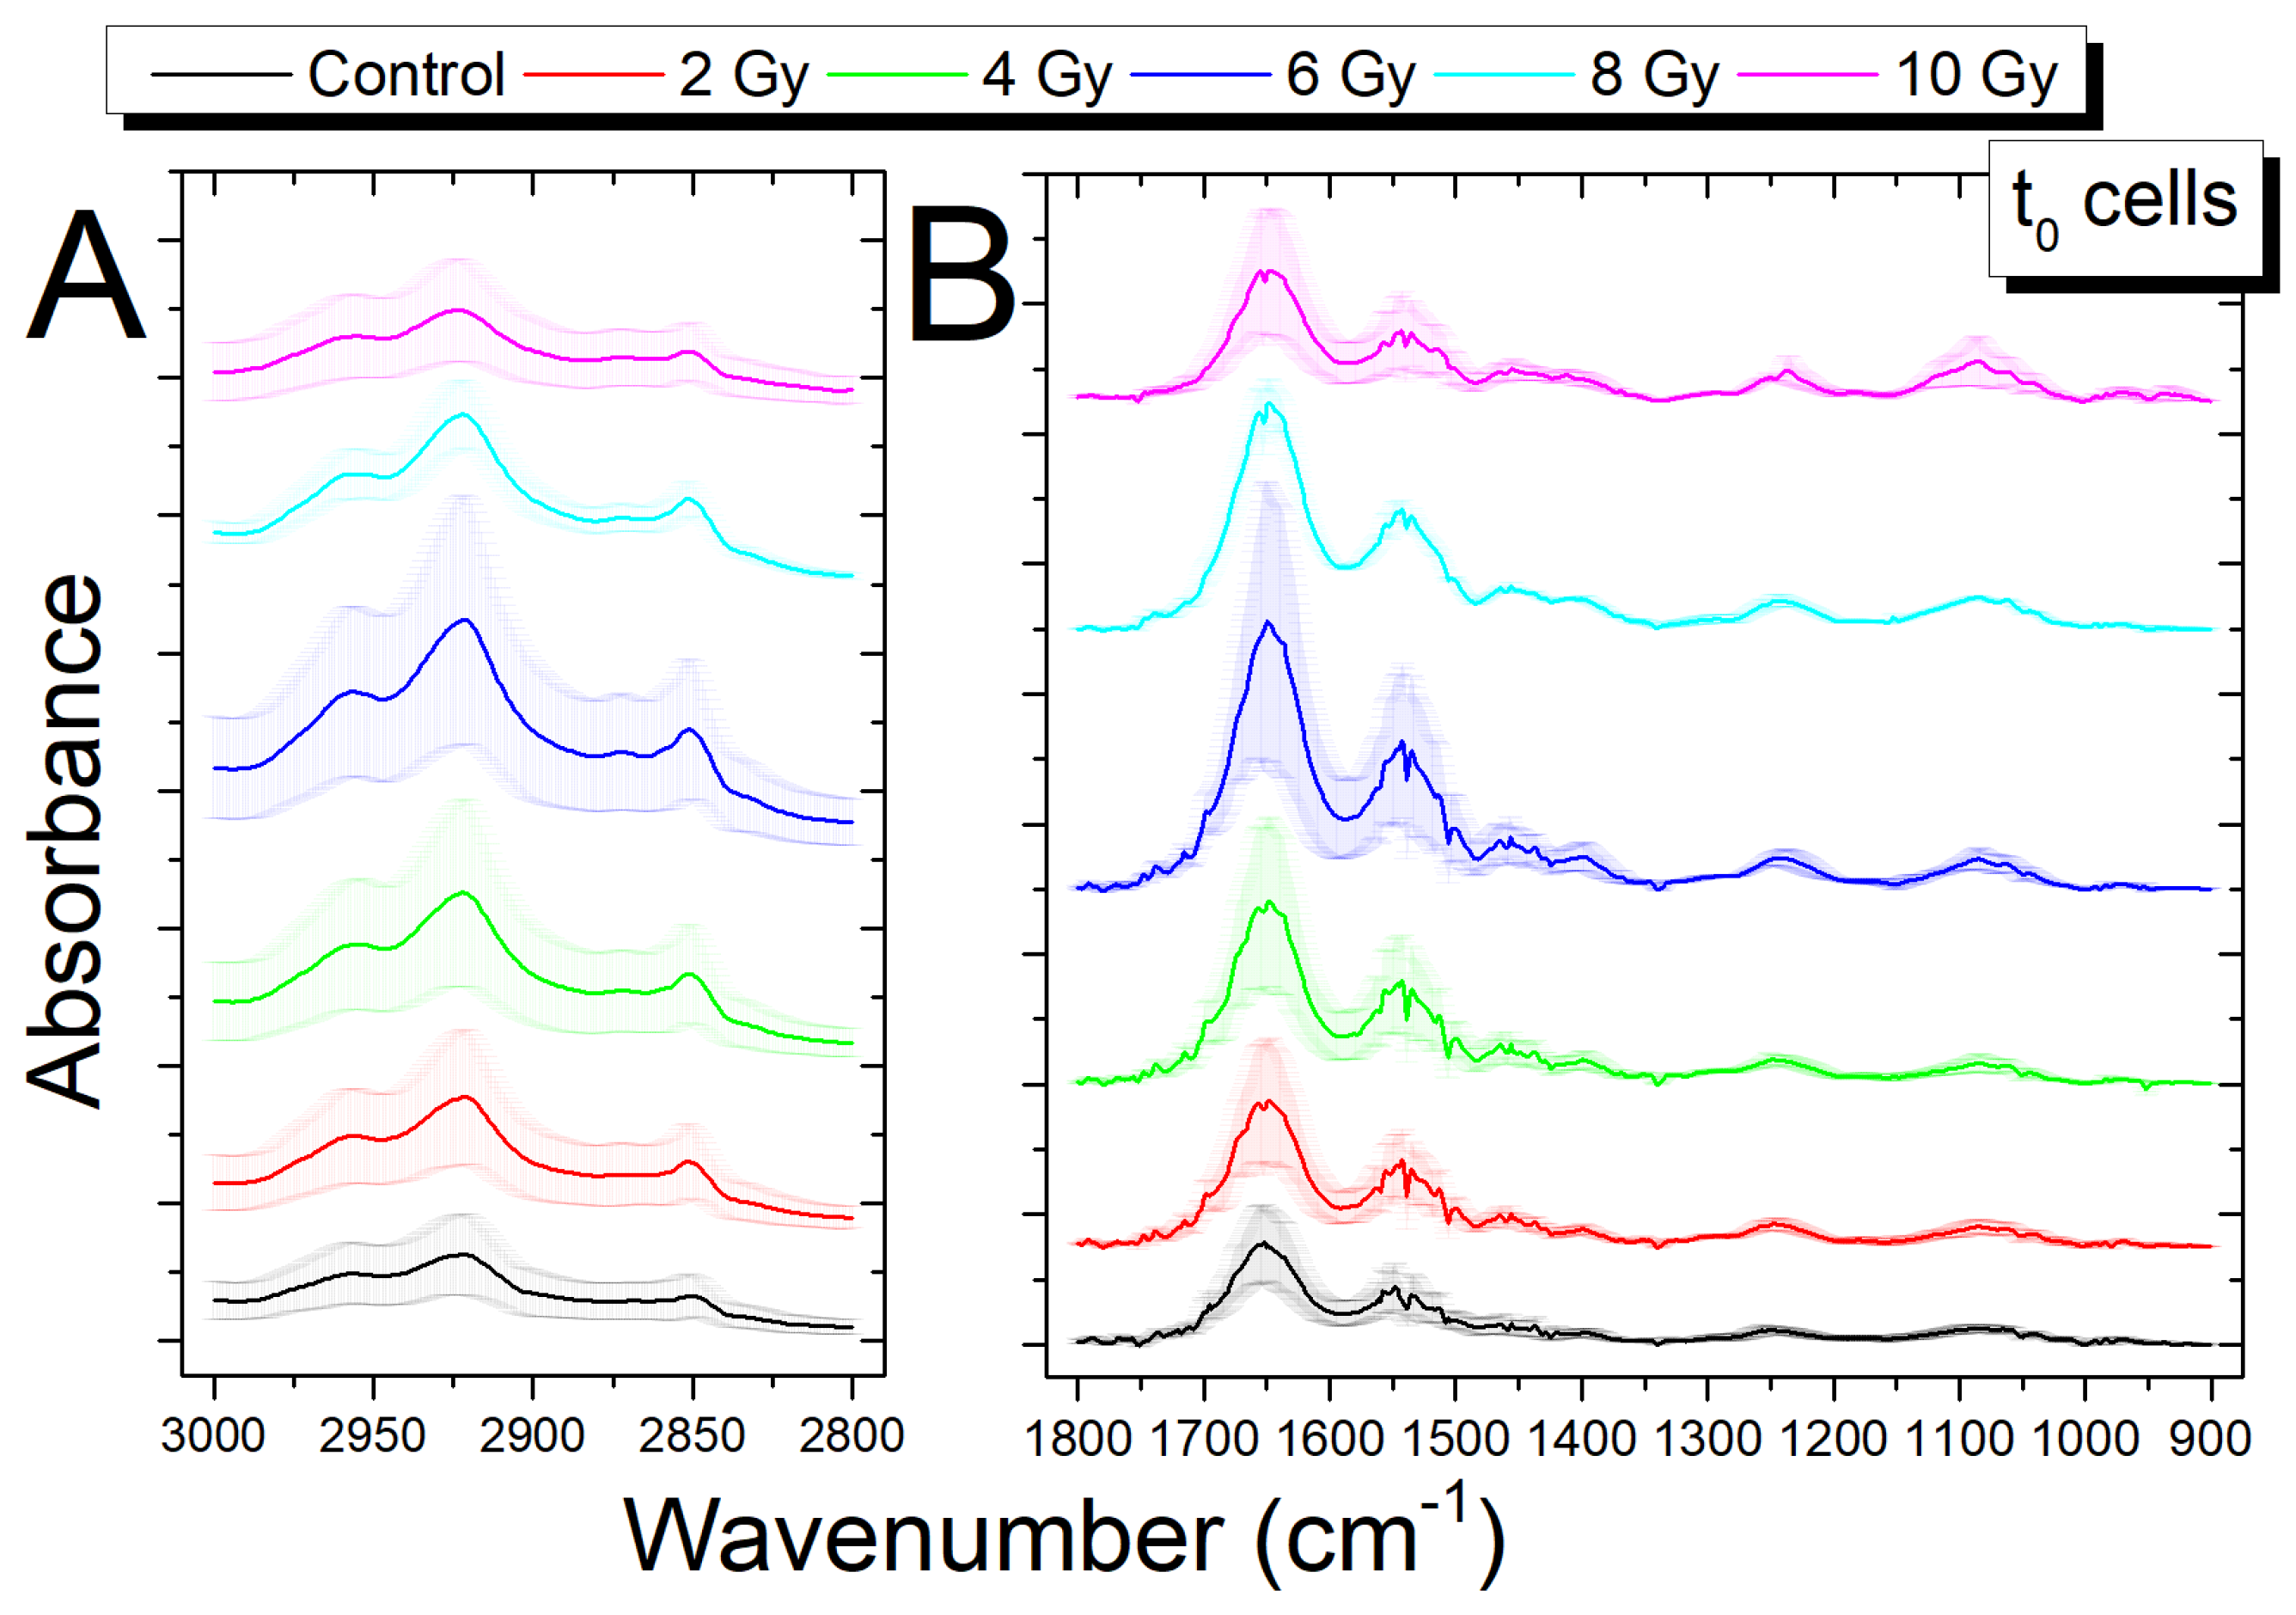
3.2. Analysis of Infrared Spectra from Cells Fixed Immediately after Irradiation (t0 Cells)

The average spectra for samples that were exposed to increasing doses of X-rays (0, 2, 4, 6, 8, and 10 Gy dose, respectively), fixed immediately after irradiation (t0 cells), are reported in Figure 3A for the HWR region and Figure 3B for the fingerprint region, respectively. For both regions, some wavenumber shifts and some differences in peak absorbance are observed in the irradiated sample spectra. In Table 2, the position of peaks for samples exposed to different doses are reported. The shifts, in terms of wavenumber, of peak positions with respect to those found for the control samples are also reported; shifts higher than the spectral resolution of our experimental apparatus are reported in bold character.
For the HWR region, only the peaks at 2870 cm−1, linked to membrane lipids and proteins (assigned to CH3 symmetric stretching) show a shift beyond spectral resolution, at every dose except for the 4 Gy sample. It must be noted that changes in lipid-related peaks are usually associated with membrane fluidity modifications [43].
In the fingerprint region, shifts are visible for different peaks, mainly in correspondence of higher dose values; that is the case for those at 1553 and 1527 cm−1, both linked to the Amide II proteins band, for the 8 and 10 Gy dose, respectively. The band corresponding to protein COO symmetric stretching (1396 cm−1) also shows a significant shift at the 8 and 10 Gy dose. The two bands (located at 1246 and 1082 cm−1), mainly associated with PO2 DNA stretching, show shifts at 8 and 10 Gy and only at 10 Gy, respectively. These wavenumber shifts evidence changes in the lipid, protein, and DNA features of neuroblastoma cells. In particular, the shift of the PO2 DNA stretching mode towards higher wavenumber values can be related to changes in the DNA conformation, from the B–DNA form to the A–DNA form. [44]. Moreover, the above-mentioned shifts of Amide II mode can be related to changes in the contributions of the enzymes involved in DNA repair ([48,49] and references therein).
Exposure to X-rays also induced changes in the absorbance of some peaks. In particular, differences can be seen for the CH3 lipid band at 2870 cm−1 in the HWR region (Figure 3A), in the 1700–1500 cm−1 protein band, and in the DNA bands at 1246 and 1082 cm−1 in the fingerprint region (Figure 3B) for the spectra irradiated with the largest doses (6, 8, 10 Gy). These variations will be discussed using a ratiometric method [18,20,47] in the following Section 3.4.

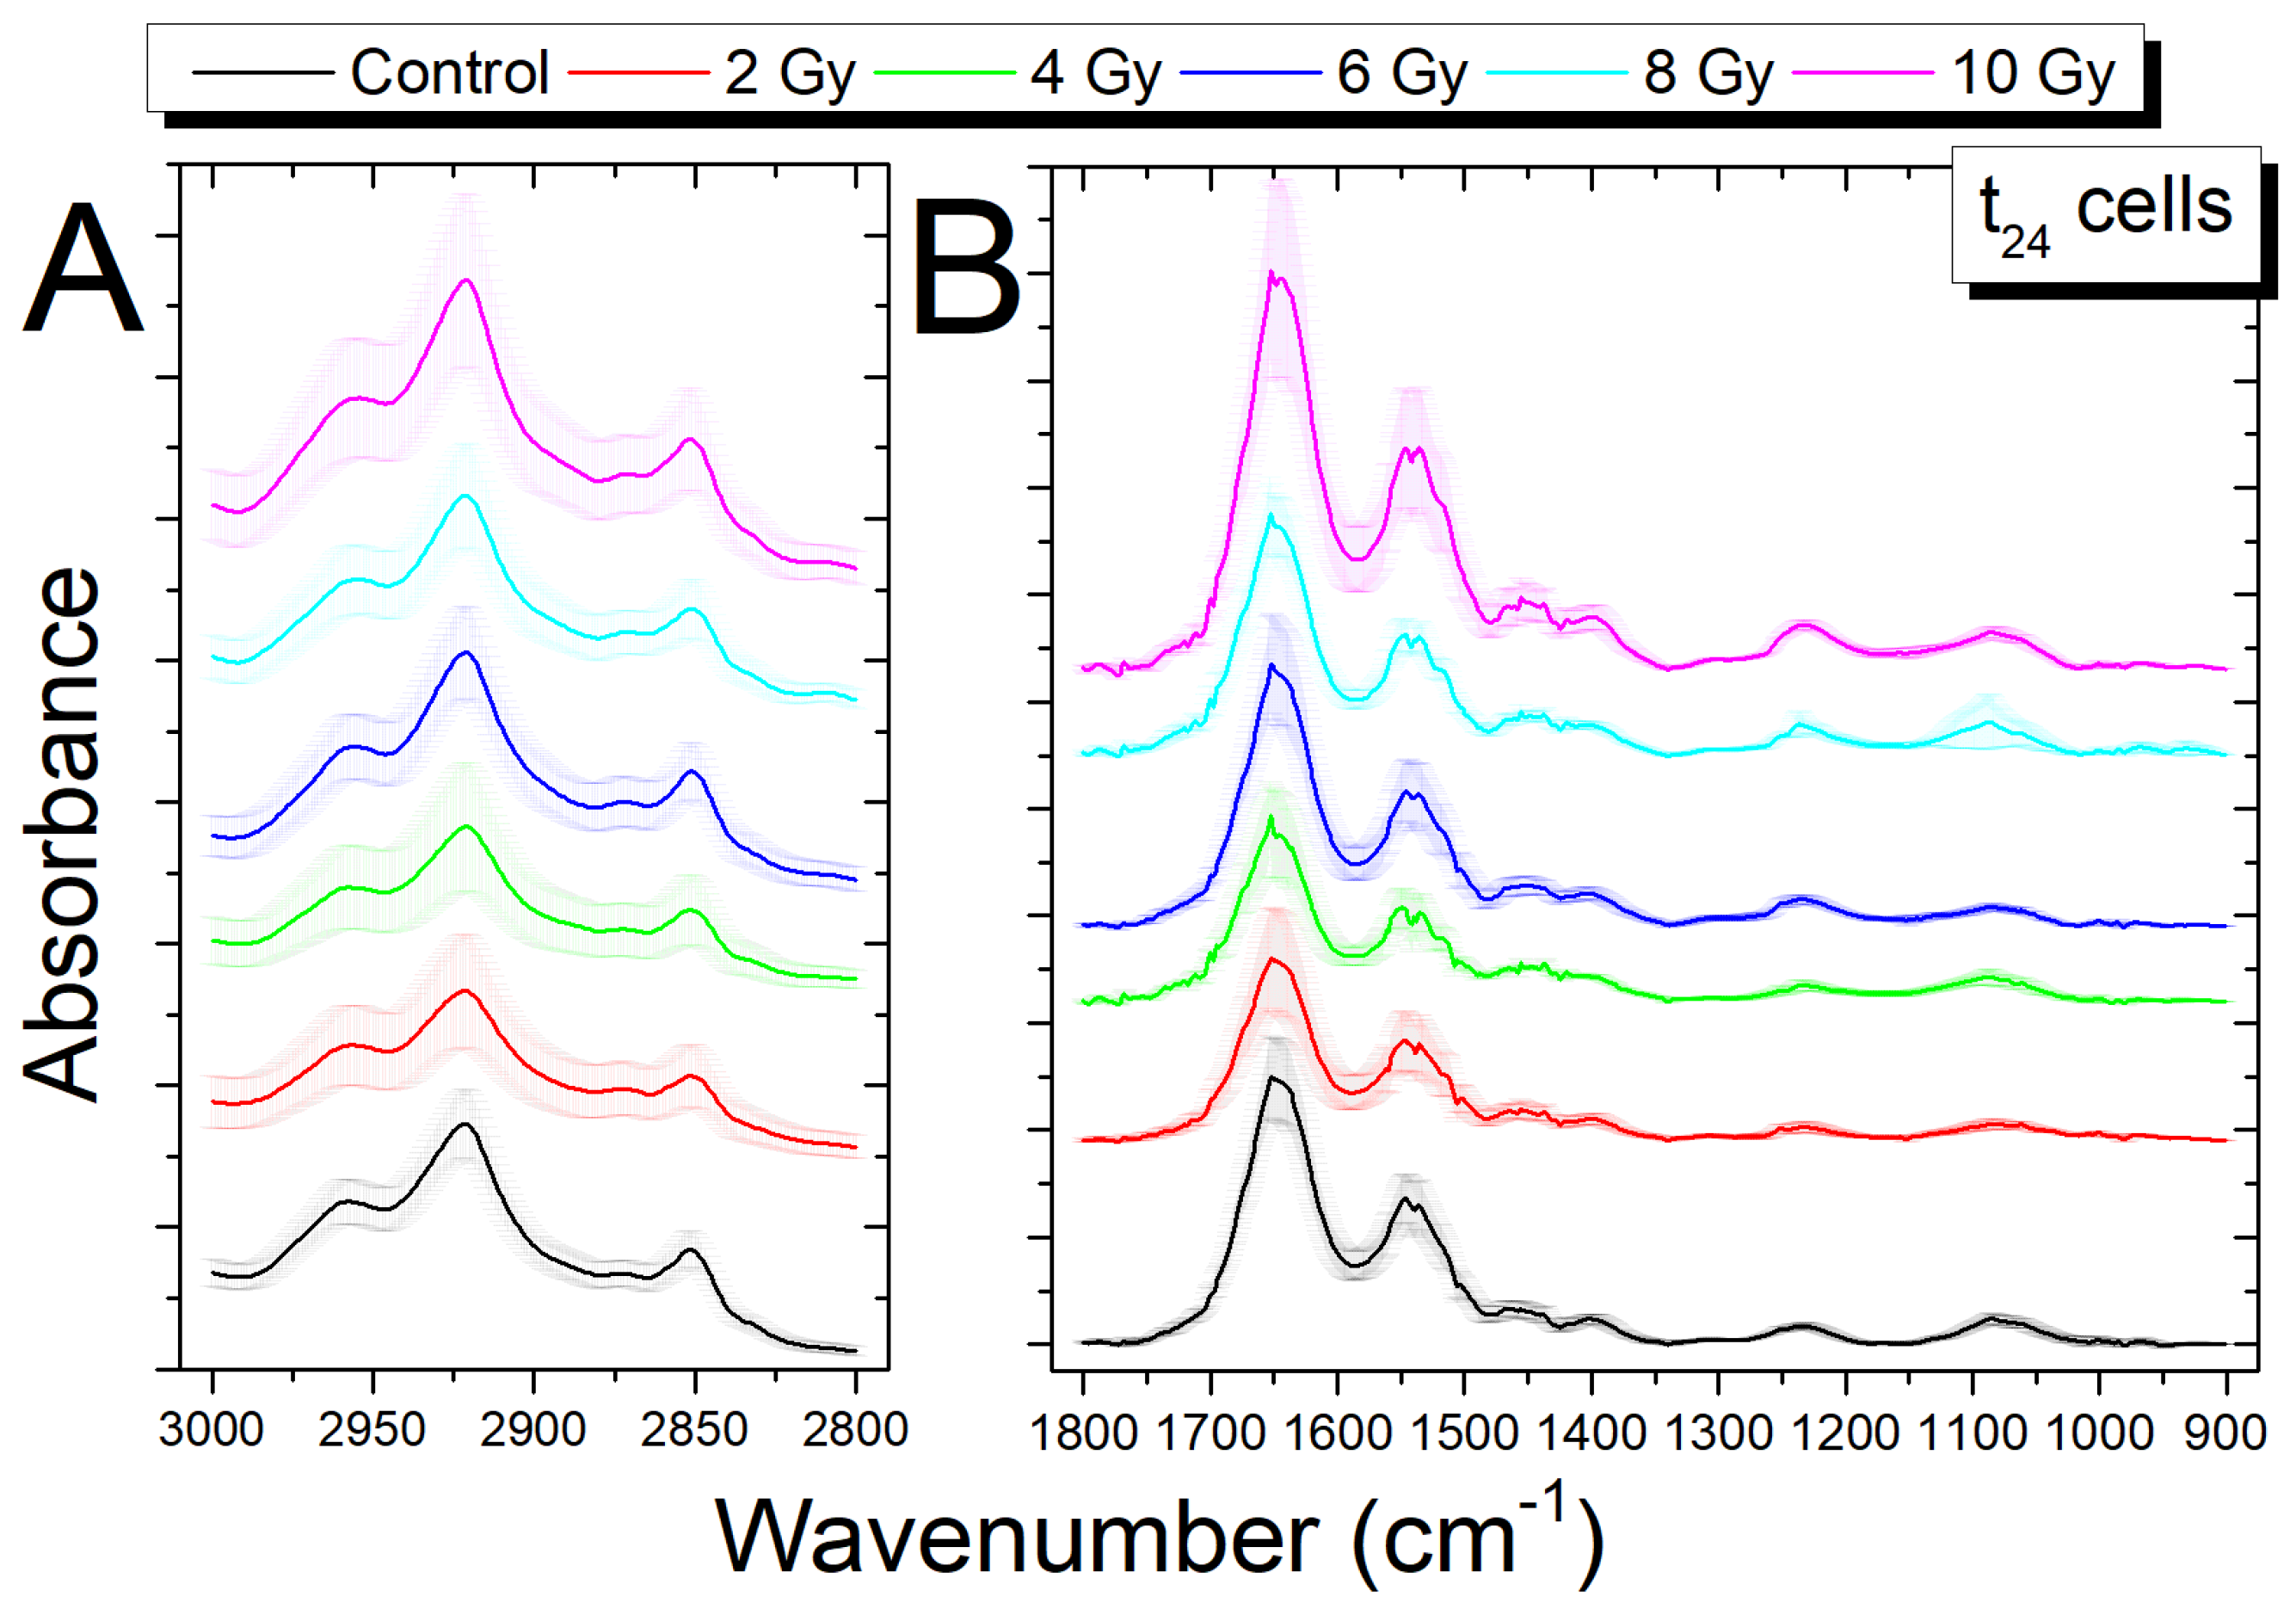
3.3. Analysis of Infrared Spectra from Cells Fixed 24 h after Irradiation (t24 Cells)

The average spectra for samples that were exposed to increasing doses of X-rays, fixed 24 h after irradiation (t24 cells), are reported in Figure 4A for the HWR region and in Figure 4B for the fingerprint region, respectively. As in the previous case, they present some wavenumber shifts and some differences in peak absorbance.
In Table 3, the position of peaks for samples exposed to different doses are reported. The shifts, in terms of wavenumber, of peak positions with respect to that found for the unirradiated t24 samples are also reported; shifts higher than the spectral resolution available in our experiments are reported in bold characters.
Differently from the t0 cells, in the HWR region, there are no significant shifts, while in the fingerprint region, shifts are visible for different peaks. The Amide II band peak (1547 cm−1) shows variations only at 4 Gy, while the peak at 1522 cm−1 changes at all the doses except for 10 Gy; the band at 1452 cm−1, linked to protein and lipid molecule vibrations, shows a shift at 8 Gy dose. The band at 1235, linked mainly to PO2 DNA stretching, still shows shifts at 4, 8, and 10 Gy; conversely, the band at 1078 cm−1, similarly linked to PO2 DNA stretching, shows shifts for all the doses. As said before, these shifts can be due to changes in the DNA conformation. The difference of the shifts with respect to the t0 cells, in which significant shifts are observed only for high doses (8–10 Gy), may offer an indication of the evolution, in time, of the damage depending on the type of considered biomolecule, as reported by other researchers [44,48,49].
For t24 cells, changes in absorbance of some peaks appears to be less visible for both the HWR and the fingerprint region in comparison with the t0 cells changes (see Figure 4A,B). These present variations, however, will be discussed using the above-described ratiometric approach [18,20,47] in the following section.

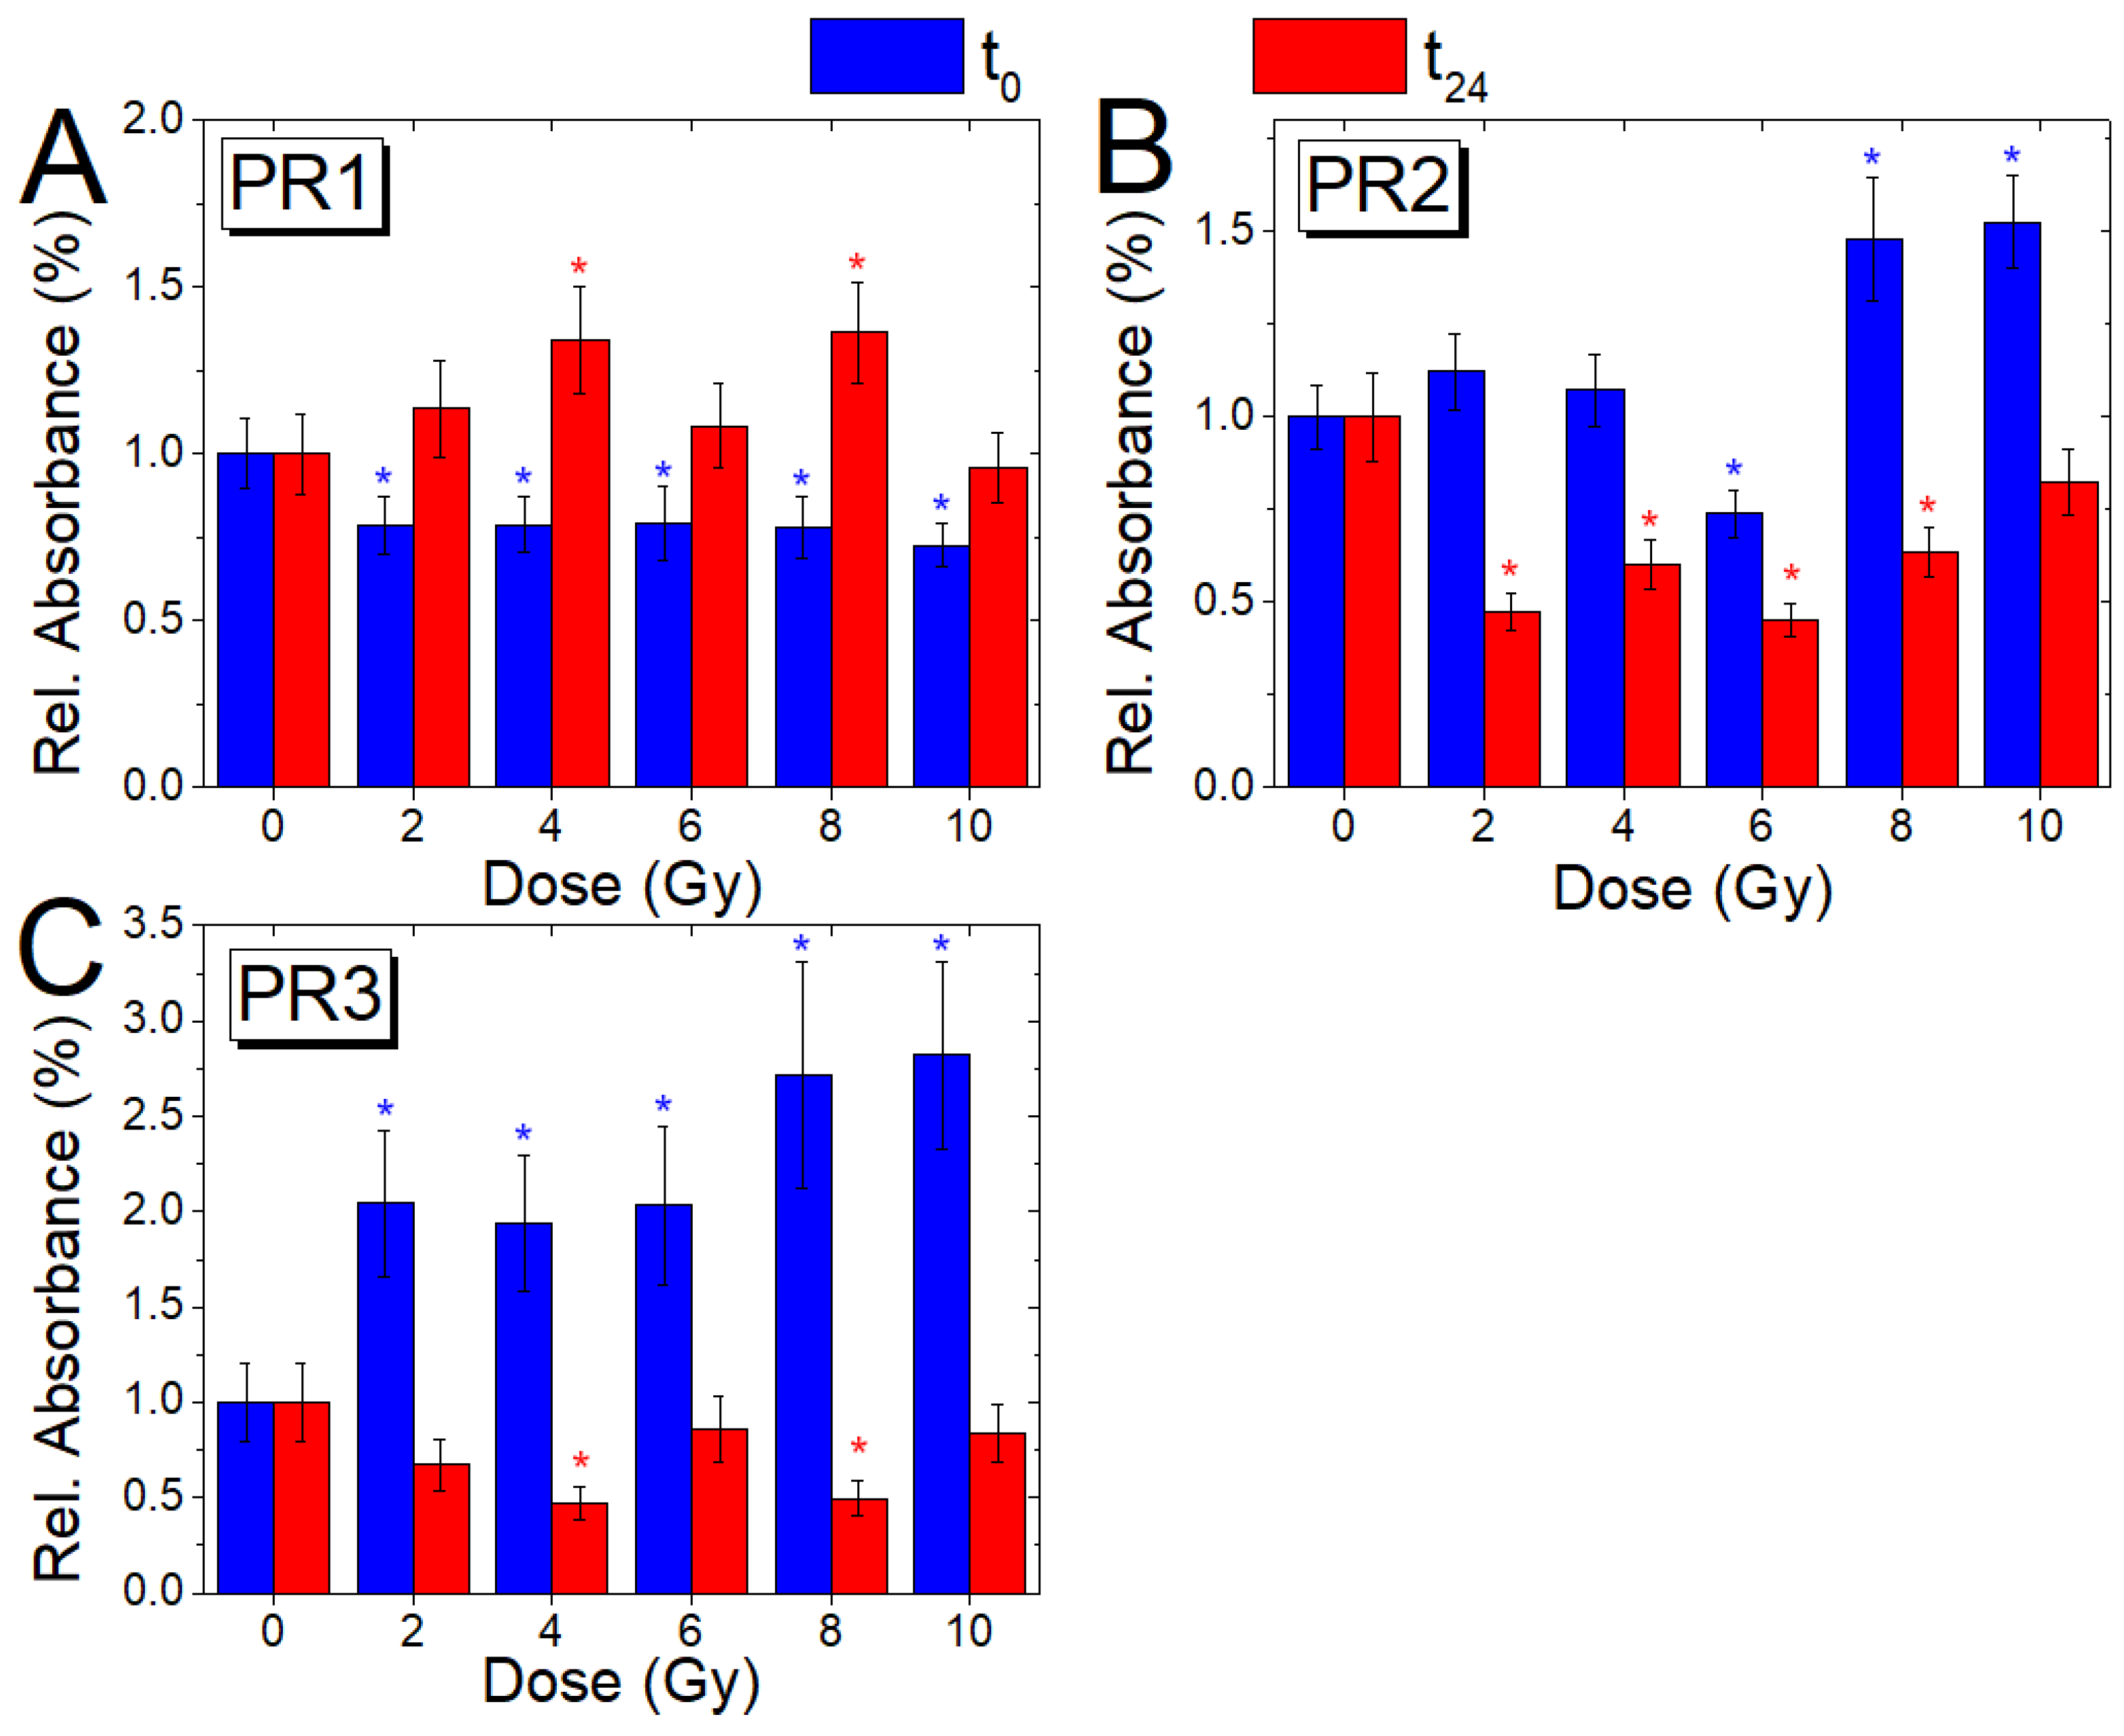
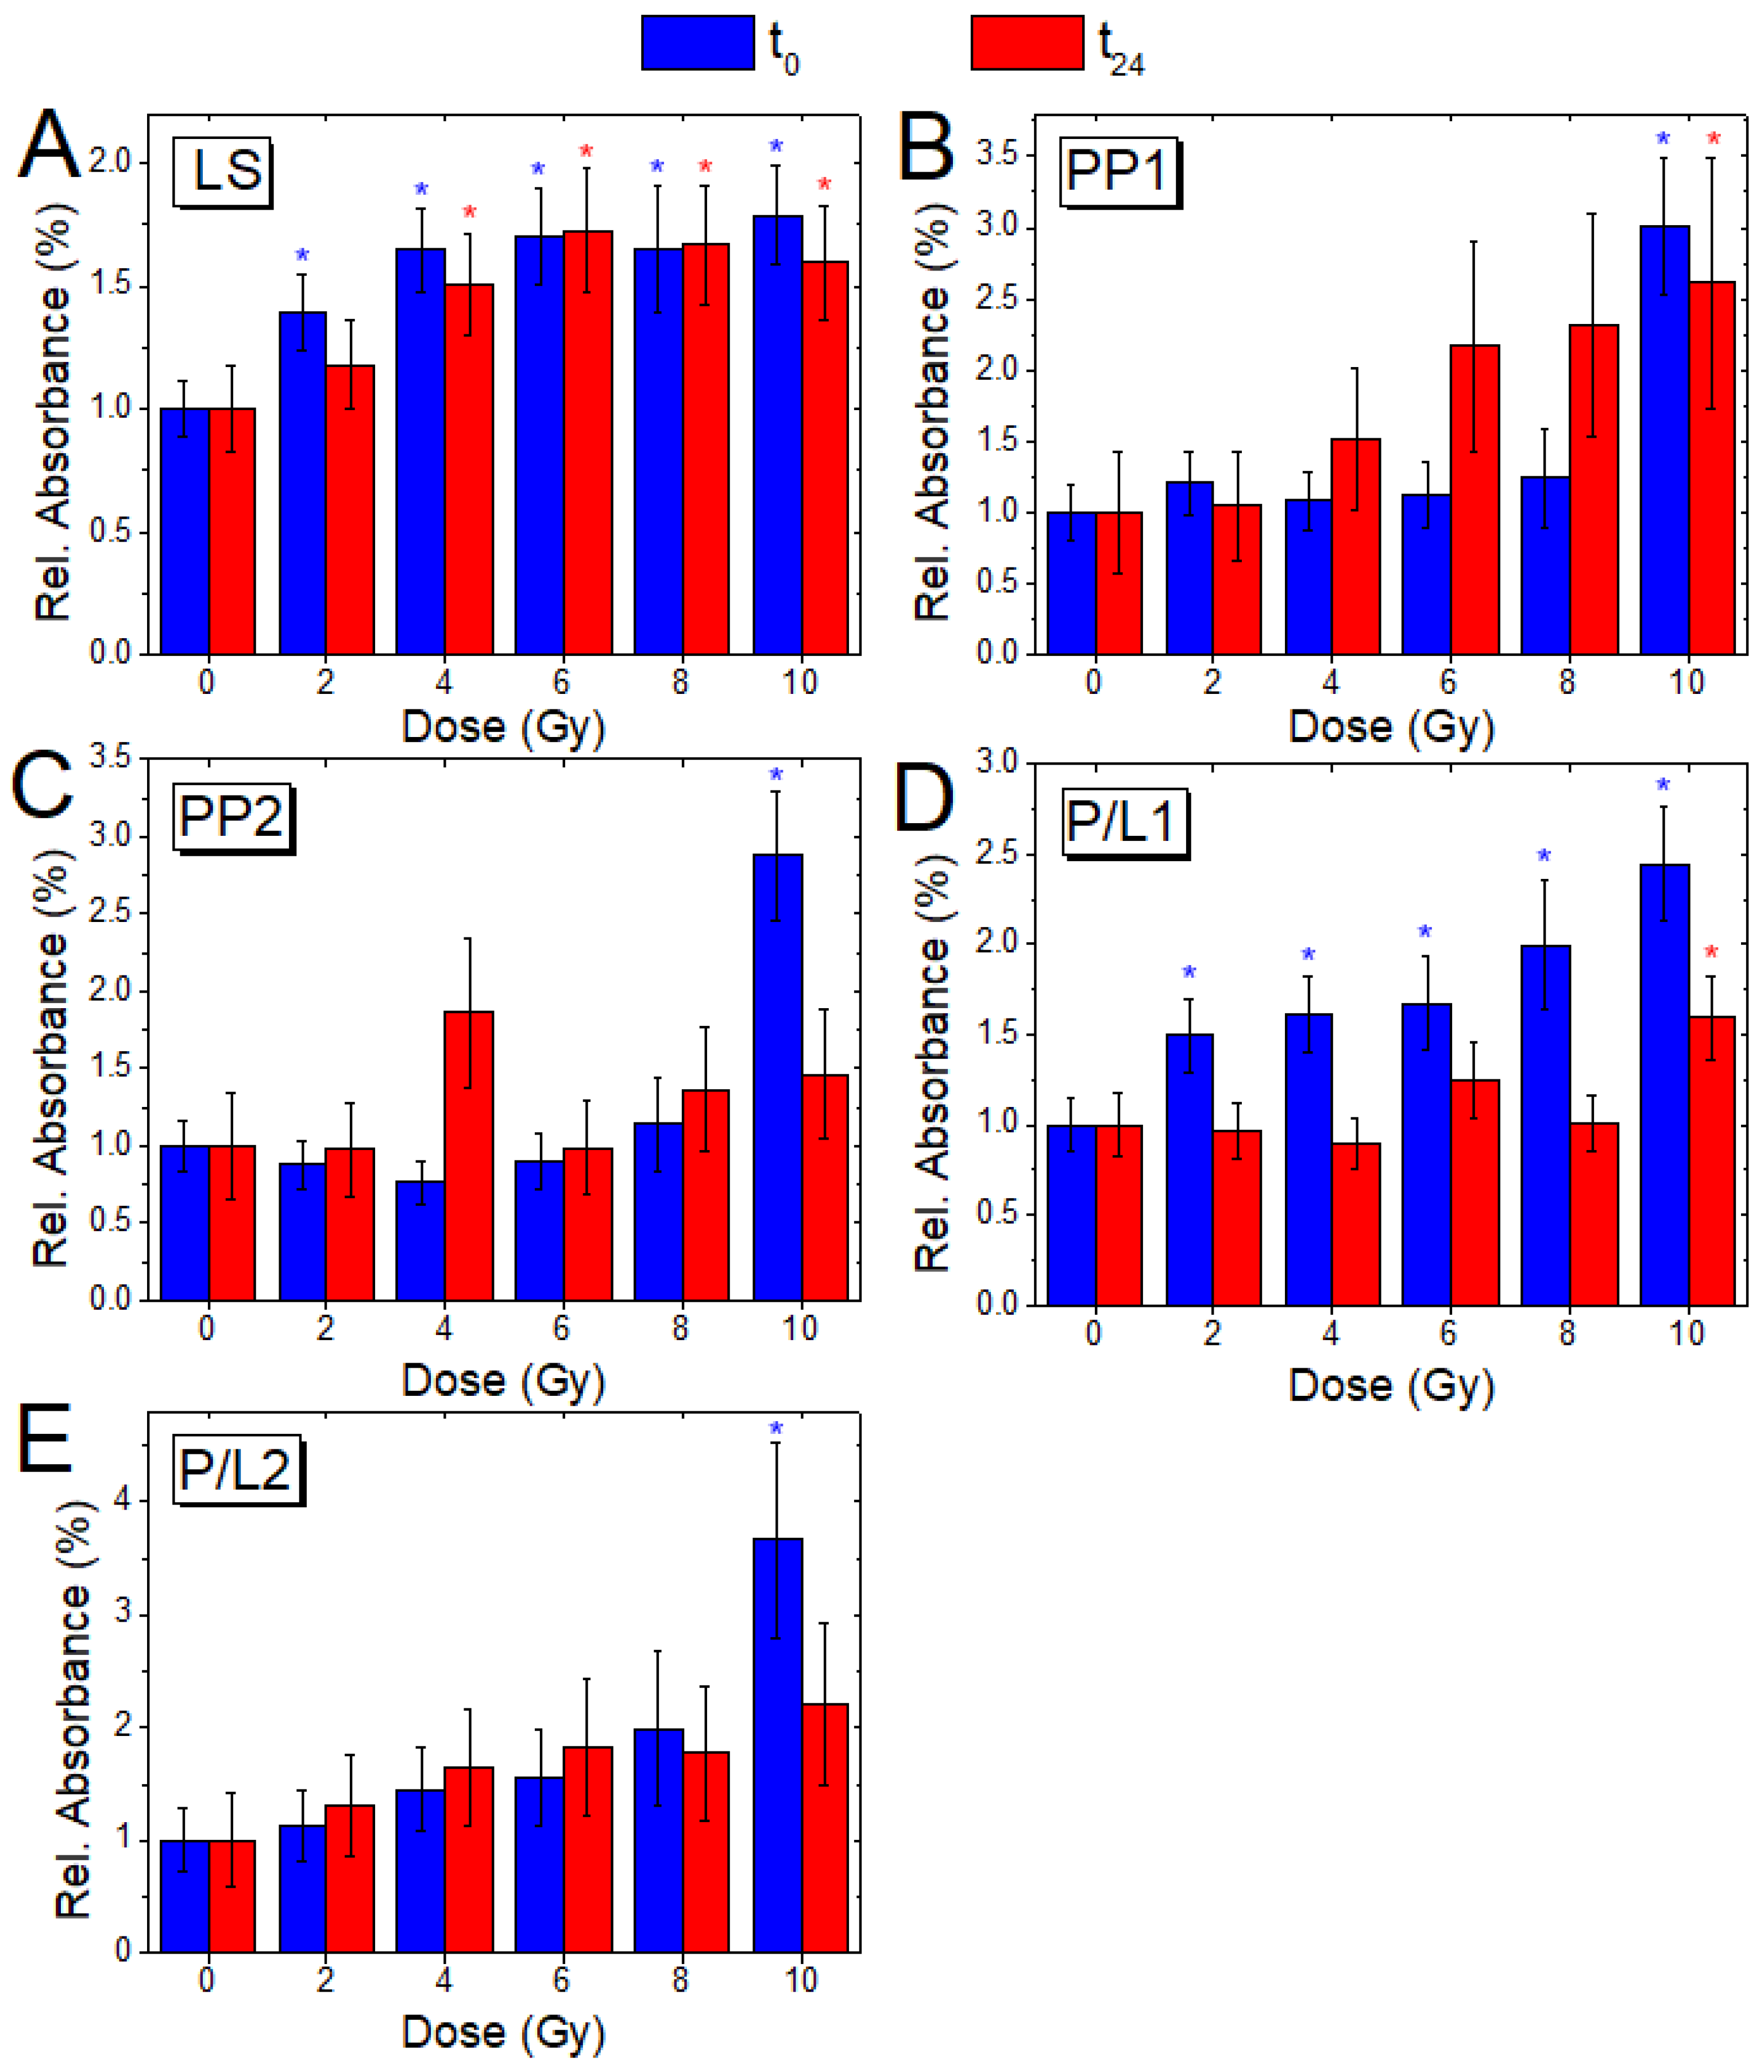
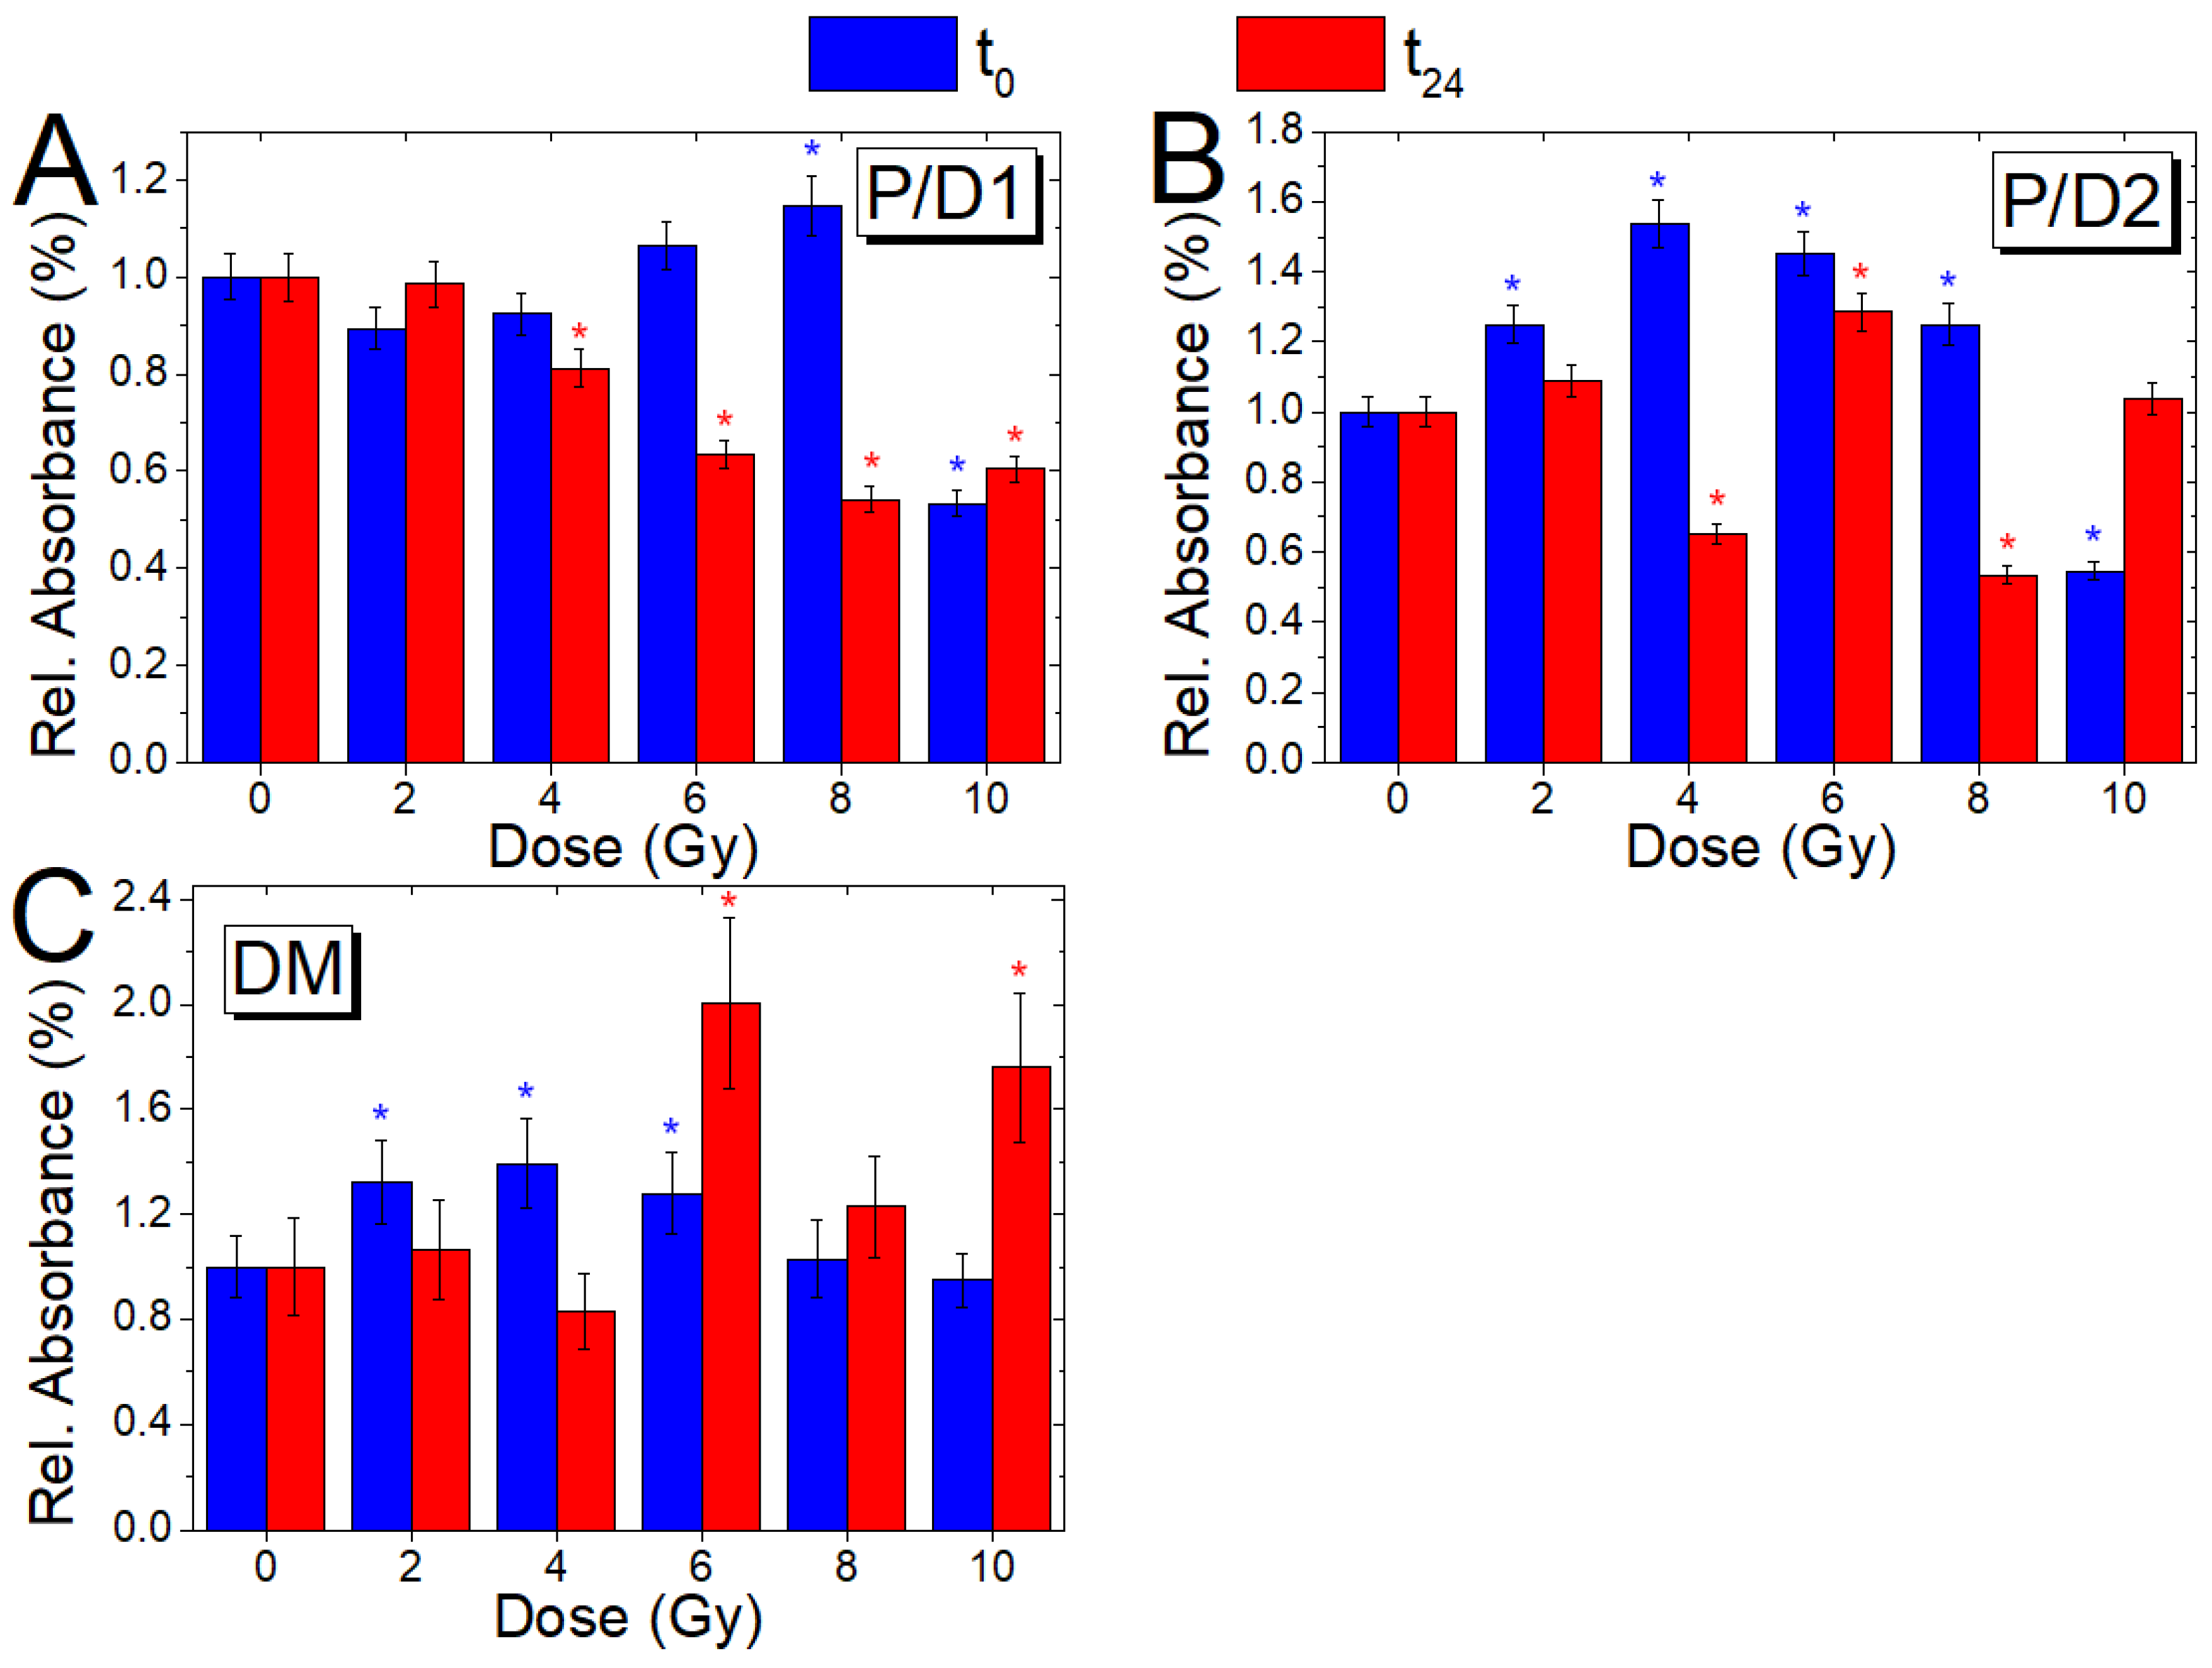
3.4. Analysis of Relative Absorbance Ratios (t0 and t24 Cells)

The intensity of an infrared band is proportional to the concentration of the species that are associated with the band. However, the use of band absorbance values themselves for quantitative analysis can cause experimental artifacts such as variations in sample thickness. For this reason, it is preferable to use their ratios [18,19,20]. In Table 1, the ratios between the absorbance of selected bands used in this work are reported, with an indication of the biological processes to which they are related.
In Figure 5A–C the ratio values PR1, PR2, and PR3 are reported, for the different doses and times of fixation; all these ratios are mainly related to protein rearrangement (see Table 1). In detail, PR1 is evaluated as the ratio between the absorbance value of the Amide I bands and the α−helix subcomponent of Amide II bands; PR2 is estimated as the ratio between the absorbance value of the Amide I band and the absorbance of the β−sheet subcomponent of Amide II band, and PR3 is given by the ratio of between the absorbance value of the α−helix subcomponent and the absorbance of the β−sheet subcomponent of Amide II band.
The ratio between the absorbance of Amide I and Amide II bands (PR1) shows a significant decrease (p ≤ 0.05) at all doses for t0 cells, while for the t24 cells, values higher than for the 0 Gy sample are shown for all doses, except the 10 Gy one. PR2 shows a decrease for the t0 cells, compared to the control, at 6 Gy (p ≤ 0.05) and a significant increase at 8 and 10 Gy (p ≤ 0.05), while the PR3 ratio shows increasing values for all doses (p ≤ 0.05). Conversely, for t24 cells, values lower than those of the unirradiated sample are visible for all doses for both ratios. The changes occurring in PR1, PR2, and PR3 values are due to changes in the secondary structure of proteins and can be also correlated with the above-mentioned changes in the contribution of enzymes (that are mainly proteins) involved in DNA repair processes. Further information about the changes in the secondary structure of the protein component of cells will be reported in the following Section 3.5.
In Figure 6A–E, the ratio values LS, PP1, PP2, P/L1, and P/L2 are reported, respectively, for the different doses and times of fixation. In particular, the LS ratio gives an indication about lipid saturation; PP1 and PP2 ratios are related to protein phosphorylation, while P/L1 and P/L2 ratios report on the relative protein and lipid content (see Table 1).
The ratio between the absorbance bands of CH3 and CH2 asymmetric stretching (LS - Figure 6A) evidences a significantly increasing trend with dose, for both t0 (for all doses, p ≤ 0.05) and t24 cells (for doses higher than 4 Gy, p ≤ 0.05) indicating an increasing lipid saturation effect [20,50]. These modifications can suggest a cell apoptosis process that has been observed to occur together with several membrane changes, such as phosphatidylserine exposure, membrane blebbing, and vesicle formation [46]. Moreover, some researchers noticed an increase in saturated fatty acids containing phospholipids during apoptosis in neuronal cells [45]. Phospholipids are the most important structural components of membranes delimiting many intracellular organelles (e.g., lysosomes, endoplasmic reticulum, and nuclei) and a salient change in their composition could cause deformation and porosity of such membranes. As a consequence, during apoptosis, a characteristic cleavage and laddering of chromosomal DNA occur caused by a deoxyribonuclease flow entering into the nucleus. Singh et al. [51] also suggested that the occurrence of a significant increase in saturated fatty acids only in the apoptotic cells can produce an increase by 10%–20% in saturated fatty acids in a mixed population of apoptotic and non-apoptotic cells. This indication of a possible occurrence of apoptosis is also in agreement with the results of a Raman micro-spectroscopy investigation already reported ([52] and references therein).
The ratios PP1 (Figure 6B) and PP2 (Figure 6C), which are both linked to protein phosphorylation [53], show significant (p ≤ 0.05) modifications only at 10 Gy for t0 cells. For t24 cells, the ratio PP1 shows an increasing behavior also at 6, 8, and 10 Gy doses which became significant (p < 0.05) at 10 Gy while the ratio PP2 does not show a significant trend in the occurring modifications. These modifications confirm the occurrence of changes in the DNA conformation, from the B–DNA form to the A–DNA form already noticed in Section 3.2 and Section 3.3 [44,45].
The ratios P/L1 (Figure 6D) and P/L2 (Figure 6E), both linked to cell protein/lipid content, show an increasing trend with the dose for t0 cells, which is significant (p < 0.05) at all doses and at 10 Gy dose, respectively; on the contrary, t24 samples show a significant shift to a higher value (p ≤ 0.05) only for the P/L2 ratio at 10 Gy. The analysis of the P/L1 and P/L2 changes indicates modifications in membrane fluidity and their protein content [43].
In Figure 7A–C, ratio values for P/D1, P/D2, and DM are reported, respectively, for the different doses and times of fixation. In this case, the P/D1 and P/D2 ratios are related to the relative protein and DNA content, while the DM ratio indicates DNA modifications (see Table 1).
The ratio P/D1 (Figure 7A), linked to the ratio between protein and DNA content of the cell, for the t0 sample shows an increasing behavior with the dose, which becomes significant at 8 Gy (p ≤ 0.05), and then a marked decrease (p ≤ 0.05) for the value at 10 Gy in respect to the unirradiated sample. Similarly, the ratio P/D2 (Figure 7B), which is associated with similar biological changes, shows an increasing trend (p ≤ 0.05) with the dose up to 8 Gy and then a decrease up to values lower than the control at 10 Gy (p ≤ 0.05). The values for t24 cells, instead, show a descending trend for doses higher than 4 Gy (p ≤ 0.05) for the P/D1 ratio and an undefined trend with values significantly (p ≤ 0.05) above (6 Gy) and below (4, 8 Gy) compared to the non-irradiated sample for P/D2. The ratio DM (Figure 7C), linked to DNA structure modifications, shows values significantly (p ≤ 0.05) higher than the control at low doses (2–6 Gy) for the t0 cells and at 6 and 10 Gy for the t24 cells.
The modifications evidenced by P/D1, P/D2, and DM are in agreement with the results obtained in other cell systems exposed to ionizing radiation that indicate the occurrence of damage in the primary, secondary, and tertiary structure of nucleic acid [54].

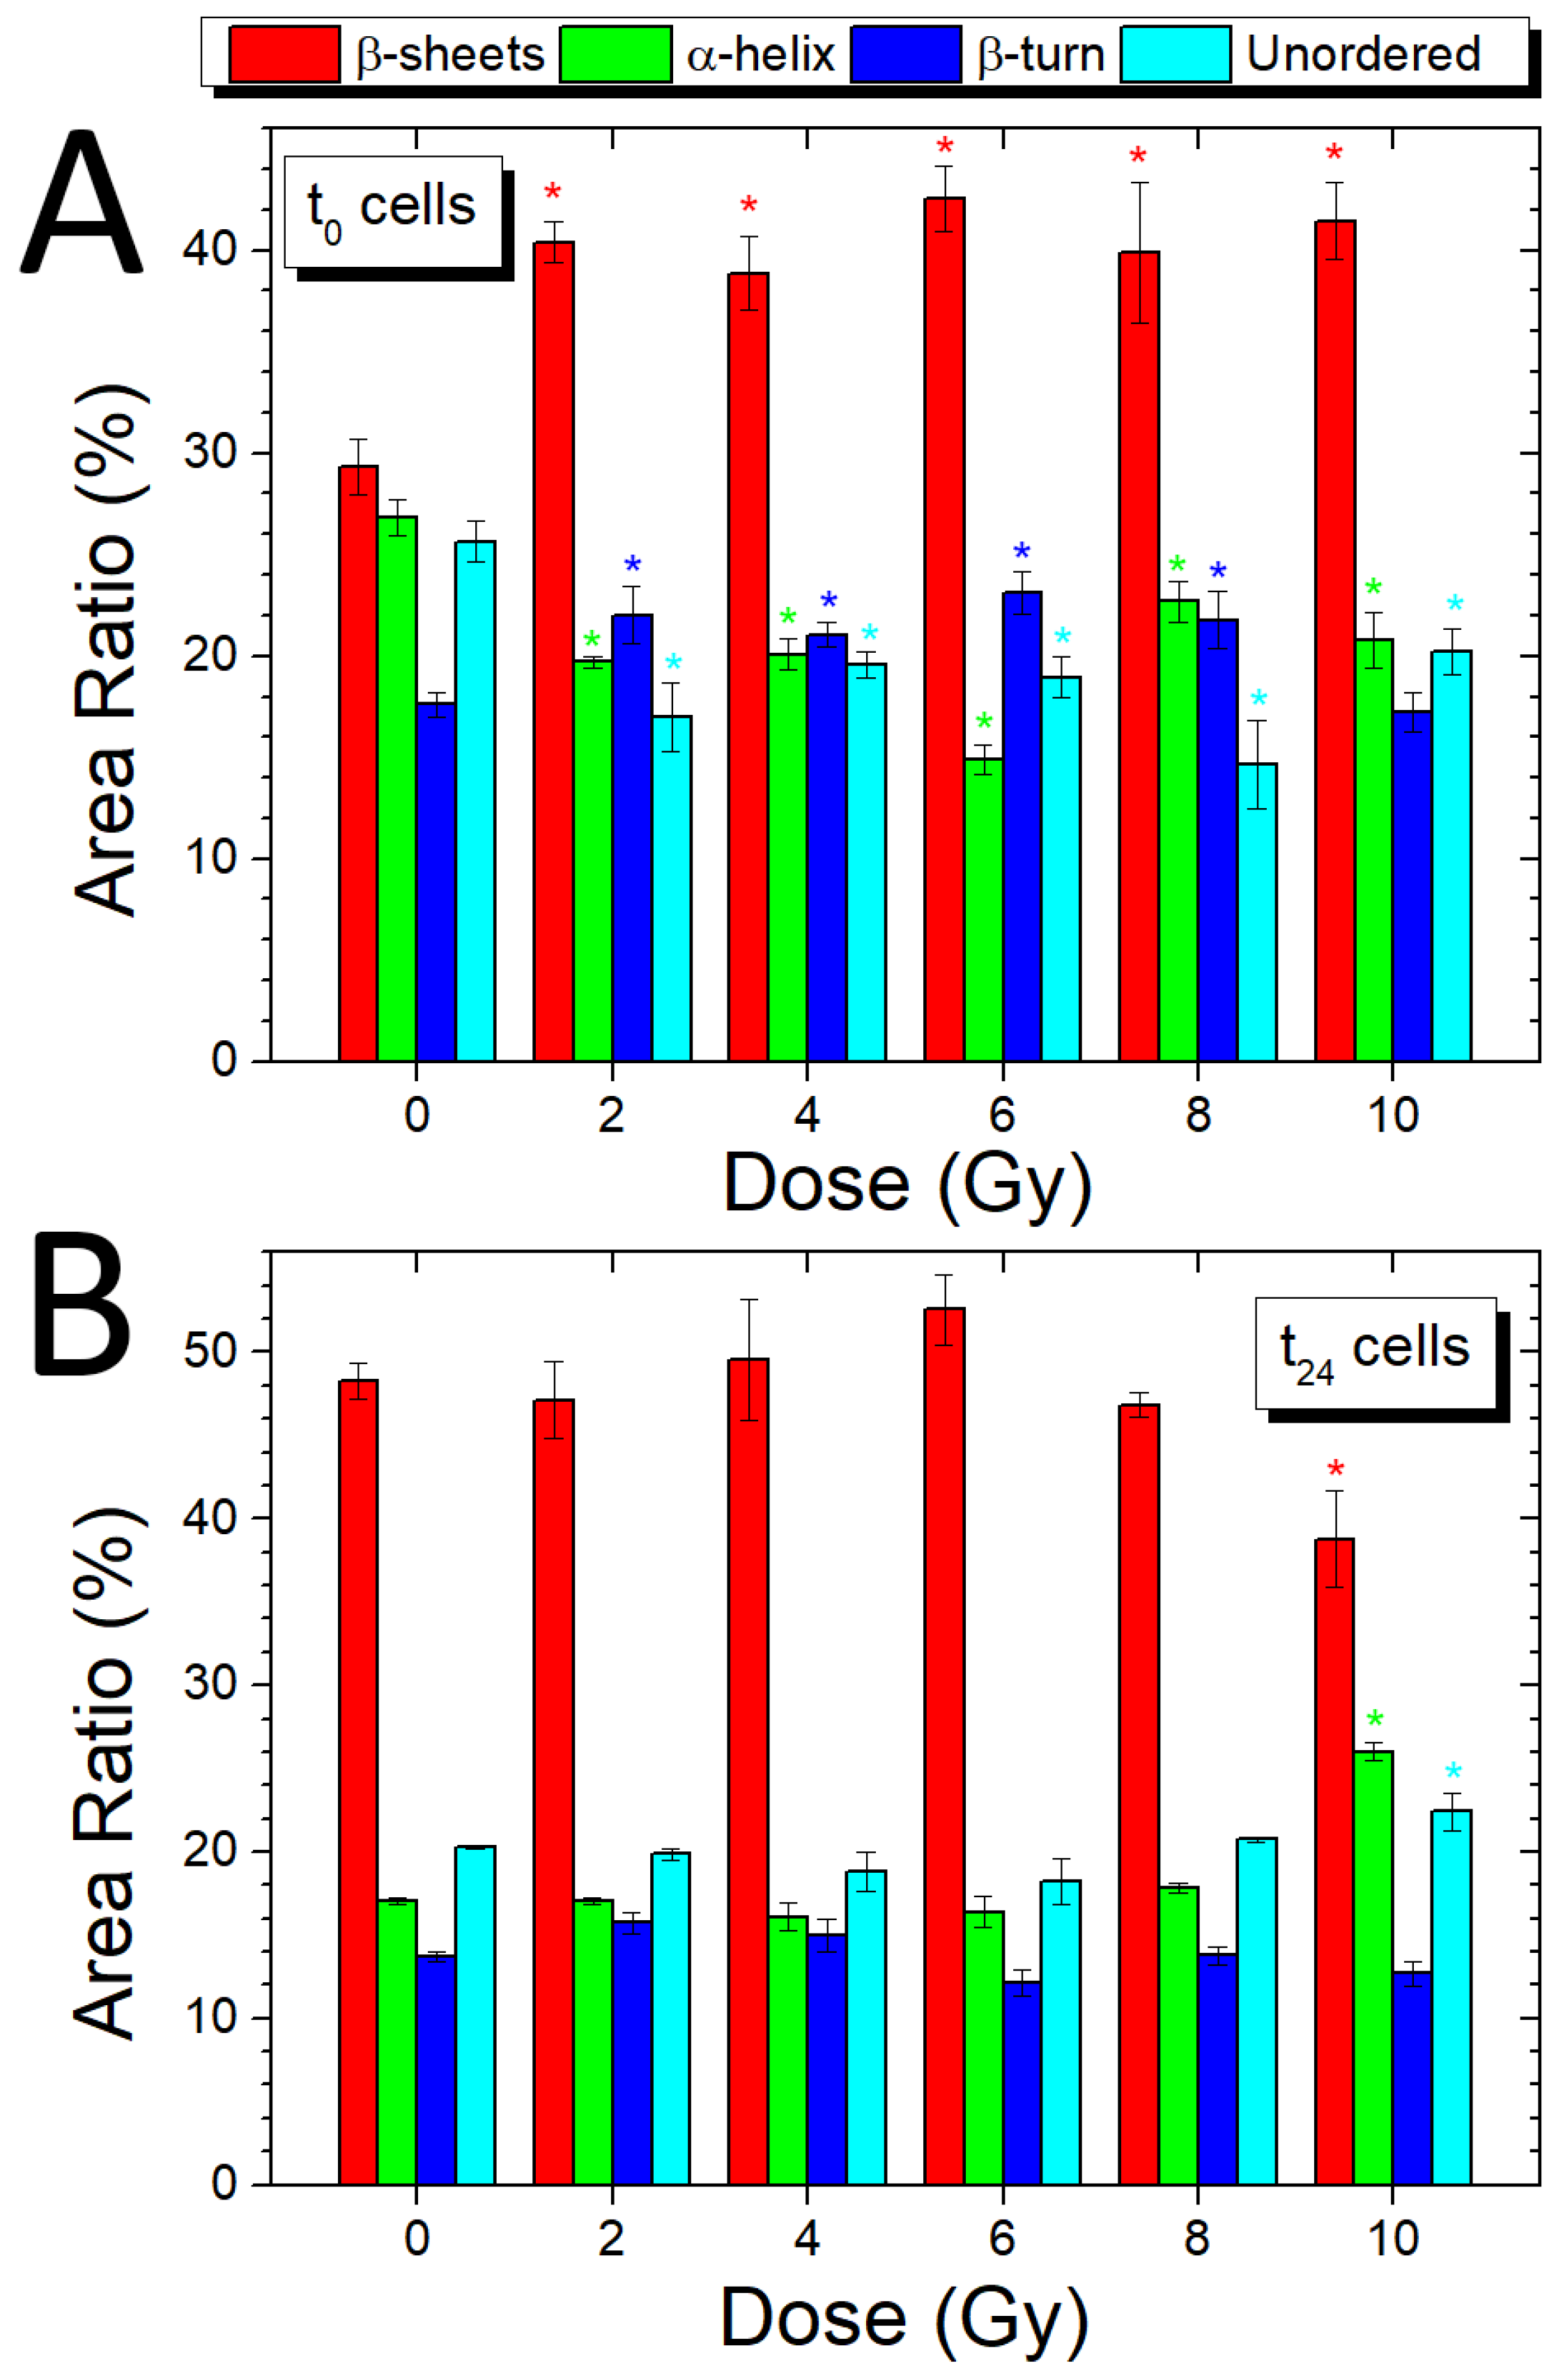
3.5. Analysis of Amide I Band (t0 and t24 Cells)

The analysis of the different peaks constituting the Amide I band can offer precise information on the secondary structure of proteins and their conformational changes as a result of different doses of ionizing radiation. In the present case, the Amide I band of control samples and irradiated samples was analyzed using eight subcomponents related to parallel β-sheet (1626, 1635 cm−1), anti-parallel β-sheet (1617, 1697 cm−1), α-helix (1661 cm−1), and β-turn (1674 cm−1); unordered structures are attributed to the band at 1646 cm−1. In Figure 8A,B, the ratios between the secondary structures peak area, grouped according to the different structures, and the area of the entire Amide I peak, as a percentage, are reported for both t0 and t24 cells, respectively. In particular, the β-sheet bar is related to the contributions of different β-sheet subcomponents that are reported in Tables S2 and S3 (Supplementary Material) in terms of percentage of the areas together with the other subcomponent bands for t0 and t24 samples. As already indicated by the PR1, PR2, and PR3 analysis reported in Section 3.4, the exposure to X-rays induces several modifications in protein secondary structure. More specifically, a significant increase (p ≤ 0.05) for the β-sheet structure is visible for all the t0 irradiated samples combined with a decrease in the signal coming from the α-helix structure; for both, the structure the maximum/minimum, respectively, occurs at 6 Gy. Moreover, for the t0 cells, the β-turn structure shows modification at 2, 4, 6, and 8 Gy, with values higher than the control sample while the unordered component has lower values than the control for all doses. The ratios for t24 cells show a stable course for all the sub-structures with significant variations (p ≤ 0.05) only at the maximum dose of 10 Gy; in fact, a shift towards lower values of the β-sheet structure band is accompanied by an increase in the percentage linked to the α-helix band and of the unordered structure.

4. Conclusions

FTIR analyses have been performed on SH-SY5Y neuroblastoma cells to examine the compositional, structural, and functional changes that take place in cell structure as a result of exposure to X-ray radiation. The infrared spectra that were obtained from unexposed and exposed cells show significant differences. In particular, changes in the peak position and intensity were observed for CH3 symmetric stretching, indicating the occurrence of modifications of membrane fluidity. The reported shifts of the PO2- DNA stretching mode towards higher wavenumber values can be associated with changes in the DNA conformation. Moreover, the shifts of Amide II mode can be related to changes in the contributions of the enzymes involved in DNA repair. These changes are especially evident for the largest X-ray doses in the spectra from cells fixed immediately after the irradiation. The proposed approach by using the ratios between the absorbance of significant peaks was also able to quantify changes for the protein, lipid, and DNA components. In particular, the changes in the protein rearrangement-related ratios (PR1, PR2, and PR3) are ascribed to changes in the secondary structure of proteins and can be also correlated with the changes in the contribution of enzymes involved in DNA repair processes mentioned above. The ratiometric study of the Amide I band confirmed that the secondary structure of proteins was significantly modified by X-ray exposure. In addition, the changes for ratio between the absorbance bands of CH3 and CH2 asymmetric stretching (LS) suggested the occurrence of a cell apoptosis process. Moreover, the ratios between protein and lipid contents (P/L1 and P/PL2) showed significant differences that can be related to changes in membrane configuration. The comparison between the ratio values for t0 and t24 also showed the occurrence of cellular recovery processes.
The present results confirm once more that μ-FTIR is a powerful tool for detecting and studying X-ray-induced effects in human cells. Its sensitivity makes this spectroscopy technique one the most accurate tools for the simultaneous detection of various functional groups. In doing so, μ-FTIR enables the evaluation of global changes more than the quantification of a single biomarker as usually done by conventional biochemical assays. Then our results can be useful for developing novel methodologies to monitor cancer radiotherapy outcomes to decrease the overall radiation dose, thus, minimizing damage to the nearby healthy cells, which is very important for early and late-occurring adverse effects.

Supplementary Materials

The following are available online at https://www.mdpi.com/2076-3417/10/8/2974/s1, Table S1: FT-IR peaks observed in the spectrum of control cells, with assignments in accordance with the data reported in the literature [10,12,13,39,44] abbreviation: as = asymmetric, s = symmetric, ν = stretching, δ = bending, sc = scissoring, vbr = vibration, a. a. = free amino acids. The indicated position of every peak is the center of the relative Lorentzian function obtained from the deconvolution fit, Table S2: Amide I deconvolution results for control and irradiated sample fixed immediately after irradiation, with assignments in accordance with the data reported in the literature [37,38,39]; the ratio between the secondary structures peaks area and the area of the entire Amide I peak, as a percentage, are reported in the table, Table S3: Amide I deconvolution results for control and irradiated sample fixed 24 h after irradiation, with assignments in accordance with the data reported in the literature [37,38,39]; the ratio between the secondary structures peaks area and the area of the entire Amide I peak, as a percentage, are reported in the table, Figure S1: SH-SY5Y cells at different culture density (ATCC, American type culture collection), Figure S2: Micrograph at 10× magnification of SH-SY5Y cells control sample adherent to the MirrIR slide. A cells cluster is visible in the brighter area that is manually selected for collecting the signal for Fourier transform infrared (FTIR) spectroscopy.

Author Contributions

Conceptualization, V.R. and M.L.; methodology, M.P. and L.M.; software, V.R. and M.P.; formal analysis, V.R. and M.L.; investigation, V.R., M.P. and M.L.; data curation, V.R. and M.P.; writing—original draft preparation, V.R.; writing—review and editing, M.P. and M.L. All authors have read and agreed to the published version of the manuscript.

Funding

This research received no external funding.

Acknowledgments

The authors are pleased to thank I. Delfino for fruitful discussions.

Conflicts of Interest

The authors declare no conflict of interest.

References

  1. Coates, A.S.; Winer, E.P.; Goldhirsch, A.; Gelber, R.D.; Gnant, M.; Piccart-Gebhart, M. Panel Members. Tailoring therapies improving the management of early breast cancer: St Gallen International Expert Consensus on the primary therapy of early breast Cancer 2015. Ann. Oncol. 2015, 26, 1533–1546. [Google Scholar] [CrossRef] [PubMed]
  2. Story, M.D.; Durante, M. Radiogenomics. Med. Phys. 2018, 4, e1111–e1122. [Google Scholar] [CrossRef] [PubMed]
  3. Kong, K.; Kendall, C.; Stone, N.; Notingher, I. Raman spectroscopy for medical diagnostics: From in vitro biofluid assays to in-vivo cancer detection. Adv. Drug Deliv. Rev. 2015, 89, 121–134. [Google Scholar] [CrossRef] [PubMed] [Green Version]
  4. Butler, H.J.; Ashton, L.; Bird, B.; Cinque, G.; Curtis, K.; Dorney, J.; Esmonde-White, K.; Fullwood, N.J.; Gardner, B.; Martin-Hirsch, P.L.; et al. Using Raman spectroscopy to characterize biological materials. Nat. Protoc. 2016, 11, 664–687. [Google Scholar] [CrossRef] [PubMed] [Green Version]
  5. Pence, I.; Mahadevan-Jansen, A. Clinical instrumentation and applications of Raman spectroscopy. Chem. Soc. Rev. 2016, 45, 1958–1979. [Google Scholar] [CrossRef] [PubMed] [Green Version]
  6. Baker, M.J.; Trevisan, J.; Bassan, P.; Bhargava, R.; Butler, H.J.; Dorling, K.M.; Fielden, P.R.; Fogarty, S.W.; Fullwood, N.J.; Heys, K.A.; et al. Using Fourier transform IR spectroscopy to analyze biological material. Nat. Protoc. 2014, 9, 1771–1791. [Google Scholar] [CrossRef] [Green Version]
  7. Lovergne, L.; Bouzy, P.; Untereiner, V.; Garnotel, R.; Baker, M.J.; Thiefin, G.; Sockalingum, G.D. Biofluid infrared spectro-diagnostics: Pre-analytical considerations for clinical applications. Faraday Discuss 2016, 187, 521–537. [Google Scholar] [CrossRef] [Green Version]
  8. Sakudo, A. Near-infrared spectroscopy for medical applications: Current status and future perspectives. Clin. Chim. Acta 2016, 455, 181–188. [Google Scholar] [CrossRef]
  9. Gault, N.; Lefaix, J.L. Infrared microspectroscopic characteristics of radiation-induced apoptosis in human lymphocytes. Radiat. Res. 2003, 160, 238–250. [Google Scholar] [CrossRef]
  10. Gasparri, F.; Muzio, M. Monitoring of apoptosis of HL60 cells by Fourier-transform infrared spectroscopy. Biochem. J. 2003, 369, 239–248. [Google Scholar] [CrossRef] [Green Version]
  11. Gault, N.; Rigaud, O.; Poncy, J.L.; Lefaix, J.L. Infrared microspectroscopy study of γ-irradiated and H2O2-treated human cells. Int. J. Radiat. Biol. 2005, 81, 767–779. [Google Scholar] [CrossRef] [PubMed]
  12. Meade, A.; Clarke, C.; Byrne, H.; Lyng, F. Fourier transform infrared microspectroscopy and multivariate methods for radiobiological dosimetry. Radiat. Res. 2010, 173, 225–237. [Google Scholar] [CrossRef] [PubMed]
  13. Gianoncelli, A.; Vaccari, L.; Kourousias, G.; Cassese, D.; Bedolla, D.E.; Kenig, S.; Storici, P.; Lazzarino, M.; Kiskinova, M. Soft X-ray microscopy radiation damage on fixed cells investigated with synchrotron radiation FTIR microscopy. Sci. Rep. 2015, 5, 10250. [Google Scholar] [CrossRef] [PubMed] [Green Version]
  14. Larrechi, M.; Callao, M. Strategy for Introducing NIR Spectroscopy and Multivariate Calibration Techniques in Industry. Trends Anal. Chem. 2003, 22, 634–640. [Google Scholar] [CrossRef]
  15. Xiaobo, Z.; Jiewen, Z.; Povey, M.J.; Holmes, M.; Hanpin, M. Variables Selection Methods in Near-Infrared Spectroscopy. Anal. Chim. Acta 2010, 667, 14–32. [Google Scholar] [CrossRef] [PubMed]
  16. Gautam, R.; Vanga, S.; Ariese, F.; Umapathy, S. Review of multidimensional data processing approaches for Raman and infrared spectroscopy. EPJ Technol. Instrum. 2015, 2, 8. [Google Scholar] [CrossRef] [Green Version]
  17. Lipiec, E.; Birarda, G.; Kowalska, J.; Lekki, J.; Vaccari, L.; Wiecheć, A.; Wood, B.R.; Kwiatek, W.M. A new approach to studying the effects of ionising radiation on single cells using FTIR synchrotron microspectroscopy. Radiat. Phys. Chem. 2013, 93, 135–141. [Google Scholar] [CrossRef]
  18. Gautam, R.; Chandrasekar, B.; Deobagkar-Lele, M.; Rakshit, S.; Umapathy, S.; Nandi, D. Identification of early biomarkers during acetaminophen-induced hepatotoxicity by Fourier transform infrared microspectroscopy. PLoS ONE 2012, 7, e45521. [Google Scholar] [CrossRef] [Green Version]
  19. Li, J.Y.; Ying, G.G.; Jones, K.C.; Martin, F.L. Real-world carbon nanoparticle exposures induce brain and gonadal alterations in zebrafish (Danio rerio) as determined by biospectroscopy techniques. Analyst 2015, 140, 2687–2695. [Google Scholar] [CrossRef] [Green Version]
  20. Kumar, S.; Verma, T.; Mukherjee, R.; Ariese, F.; Somasundaram, K.; Umapathy, S. Raman and infrared microspectroscopy: Towards quantitative evaluation for clinical research by ratiometric analysis. Chem. Soc. Rev. 2016, 45, 1879–1900. [Google Scholar] [CrossRef]
  21. Bel’skaya, L.V. Use of IR spectroscopy in cancer diagnosis. A review. J. Appl. Spectrosc. 2019, 86, 187–205. [Google Scholar] [CrossRef]
  22. Gautam, R.; Deobagkar-Lele, M.; Majumdar, S.; Chandrasekar, B.; Victor, E.; Ahmed, S.M.; Wadhwa, N.; Verma, T.; Kumar, S.; Sundaresan, N.R.; et al. Molecular profiling of sepsis in mice using Fourier Transform Infrared Microspectroscopy. J. Biophotonics 2016, 9, 67–82. [Google Scholar] [CrossRef] [PubMed]
  23. Mourant, J.R.; Yamada, Y.; Carpenter, S.; Dominique, L.; Freyer, J. FTIR spectroscopy demonstrates biochemical differences in mammalian cell cultures at different growth stages. Biophys. J. 2003, 85, 1938–1947. [Google Scholar] [CrossRef] [Green Version]
  24. Theophilou, G.; Lima, K.L.M.; Martin-Hirsch, P.L.; Stringfellow, H.F.; Martin, F.L. ATR-FTIR spectroscopy coupled with chemometric analysis discriminates normal, borderline and malignant ovarian tissue: Classifying subtypes of human cancer. Analyst 2016, 141, 585–594. [Google Scholar] [CrossRef] [PubMed] [Green Version]
  25. Liu, H.; Su, Q.; Sheng, D.; Zheng, W.; Wang, X. Comparison of red blood cells from gastric cancer patients and healthy persons using FTIR spectroscopy. J. Mol. Struct. 2017, 1130, 33–37. [Google Scholar] [CrossRef]
  26. Adeeba; Siddiqui, A.J.; Sherazi, S.T.H.; Ahmed, S.; Choudhary, M.I.; Atta-ur-Rahman; Musharraf, S.G. A comparative profiling of oral cancer patients and high risk niswar users by using FT-IR and chemometric analysis. Spectrochim. Acta Part A Mol. Biomol. Spectrosc. 2018, 203, 177–184. [Google Scholar] [CrossRef]
  27. Kar, S.; Katti, D.R.; Katti, K.S. Fourier transform infrared spectroscopy based spectral biomarkers of metastasized breast cancer progression. Spectrochim. Acta Part. A Mol. Biomol. Spectrosc. 2019, 208, 85–96. [Google Scholar] [CrossRef]
  28. Maris, J.M.; Hogarty, M.D.; Bagatell, R.; Cohn, S.L. Neuroblastoma. Lancet 2007, 369, 2106–2120. [Google Scholar] [CrossRef]
  29. Encinas, M.; Iglesias, M.; Liu, Y.; Wang, H.; Muhaisen, A.; Gallego Ceña, C.; Comella, J.X. Sequential treatment of SH-SY5Y cells with retinoic acid and brain-derived neurotrophic factor gives rise to fully differentiated, neurotrophic factor-dependent, human neuron-like cells. J. Neurochem. 2000, 75, 991–1003. [Google Scholar] [CrossRef]
  30. Jämsä, A.; Hasslund, K.; Cowburn, R.F.; Bäckström, A.; Vasänge, M. The retinoic acid and brain-derived neurotrophic factor differentiated SH-SY5Y cell line as a model for Alzheimer’s disease-like tau phosphorylation. Biochem. Biophys. Res. Commun. 2004, 319, 993–1000. [Google Scholar] [CrossRef]
  31. Agholme, L.; Lindström, T.; Kågedal, K.; Marcusson, J.; Hallbeck, M. An in vitro model for neuroscience: Differentiation of SH-SY5Y cells into cells with morphological and biochemical characteristics of mature neurons. J. Alzheimers Dis. 2010, 20, 1069–1082. [Google Scholar] [CrossRef] [PubMed] [Green Version]
  32. Koriyama, Y.; Furukawa, A.; Muramatsu, M.; Takino, J.; Takeuchi, M. Glyceraldehyde caused Alzheimer’s disease-like alterations in diagnostic marker levels in SH-SY5Y human neuroblastoma cells. Sci. Rep. 2015, 5, 13313. [Google Scholar] [CrossRef] [PubMed] [Green Version]
  33. Puck, T.T.; Marcus, P.I. Action of x-rays on mammalian cells. J. Exp. Med. 1956, 103, 653–666. [Google Scholar] [CrossRef] [PubMed]
  34. Clemens, G.; Hands, J.R.; Dorling, K.M.; Baker, M.J. Vibrational spectroscopic methods for cytology and cellular research. Analyst 2014, 139, 4411–4444. [Google Scholar] [CrossRef] [PubMed]
  35. Camerlingo, C.; Zenone, F.; Gaeta, G.M.; Riccio, R.; Lepore, M. Wavelet data processing of micro-Raman spectra of biological samples. Meas. Sci. Technol. 2006, 17, 298–303. [Google Scholar] [CrossRef]
  36. Camerlingo, C.; Zenone, F.; Perna, G.; Capozzi, V.; Cirillo, N.; Gaeta, G.M.; Lepore, M. An investigation on micro-Raman spectra and wavelet data analysis for pemphigus vulgaris follow-up monitoring. Sensors 2008, 8, 3656–3664. [Google Scholar] [CrossRef]
  37. Delfino, I.; Perna, G.; Lasalvia, M.; Capozzi, V.; Manti, L.; Camerlingo, C.; Lepore, M. Visible micro-Raman spectroscopy of single human mammary epithelial cells exposed to X-ray radiation. J. Biomed. Opt. 2015, 20, 035003. [Google Scholar] [CrossRef] [Green Version]
  38. Pelton, J.T.; McLean, L.R. Spectroscopic Methods for Analysis of Protein Secondary Structure. Anal. Biochem. 2000, 277, 167–176. [Google Scholar] [CrossRef]
  39. Barth, A. Infrared spectroscopy of proteins. Biochim. Biophys. Acta 2007, 1767, 1073–1101. [Google Scholar] [CrossRef] [Green Version]
  40. Coe, J.V.; Nystrom, S.V.; Chen, Z.; Li, R.; Verreault, D.; Hitchcock, C.L.; Allen, H.C. Extracting Infrared Spectra of Protein Secondary Structures Using a Library of Protein Spectra and the Ramachandran Plot. J. Phys. Chem. B 2015, 119, 13079–13092. [Google Scholar] [CrossRef]
  41. Mei, Y.; Miller, L.; Gao, W.; Gross, R.A. Imaging the distribution and secondary structure of immobilized enzymes using infrared microspectroscopy. Biomacromolecules 2003, 4, 70–74. [Google Scholar] [CrossRef] [PubMed]
  42. Delfino, I.; Portaccio, M.; Della Ventura, B.; Mita, D.G.; Lepore, M. Enzyme distribution and secondary structure of sol-gel immobilized glucose oxidase by micro-attenuated total reflection FT-IR spectroscopy. Mater. Sci. Eng. C 2013, 33, 304–310. [Google Scholar] [CrossRef] [PubMed]
  43. Yoshida, S.; Koike, K. Lipid and Membrane Dynamics in Biological Tissues—Infrared Spectroscopic Studies. Adv. Planar Lipid Bilayers Liposomes 2011, 13, 1–32. [Google Scholar]
  44. Sailer, K.; Viaggi, S.; Nusse, M. Radiation–induced structural modifications in dsDNA analysed by FT–Raman spectroscopy. Int. J. Radiat. Biol. 1996, 69, 601–613. [Google Scholar] [CrossRef] [PubMed]
  45. Gault, N.; Rigaud, O.; Poncy, J.L.; Lefaix, J.L. Biochemical alterations in human cells irradiated with alpha particles delivered by macro- or microbeams. Radiat. Res. 2007, 167, 551–562. [Google Scholar] [CrossRef] [PubMed]
  46. Zelig, U.; Kapelushnik, J.; Moreh, R.; Mordechai, S.; Nathan, I. Diagnosis of cell death by means of Infrared Spectroscopy. Biophys. J. 2009, 97, 2107–2114. [Google Scholar] [CrossRef] [PubMed] [Green Version]
  47. Ricciardi, V.; Portaccio, M.; Piccolella, S.; Manti, L.; Pacifico, S.; Lepore, M. Study of SH-SY5Y cancer cell response to treatment with polyphenol extracts using FT-IR spectroscopy. Biosensors 2017, 7, 57. [Google Scholar] [CrossRef] [Green Version]
  48. Lipiec, E.; Bambery, K.R.; Heraud, P.; Hirshmugl, C.; Lekki, J.; Kwiatek, W.M.; Tobin, M.J.; Vogel, C.; Whelan, D.; Wood, B.R. Synchrotron FTIR shows evidence of DNA damage and lipid accumulation in prostate adenocarcinoma PC-3 cells following proton irradiation. J. Mol. Struct. 2014, 22, 2860. [Google Scholar] [CrossRef]
  49. Lipiec, E.; Wood, B.R.; Kulik, A.; Kwiatek, W.M.; Dietler, G. Nanoscale investigation into the cellular response of glioblastoma cells exposed to protons. Anal. Chem. 2018, 90, 7644–7650. [Google Scholar] [CrossRef]
  50. Barraza-Garza, G.; Castillo-Michel, H.; De La Rosa, L.A.; Martinez-Martinez, A.; Pérez-León, J.A.; Cotte, M.; Alvarez-Parrilla, E. Infrared spectroscopy as a tool to study the antioxidant activity of polyphenolic compounds in isolated rat enterocytes. Oxid Med. Cell Longev. 2016, 9245150. [Google Scholar] [CrossRef] [Green Version]
  51. Singh, J.K.; Dasgupta, A.; Adayen, T.; Shahmehdi, S.A.; Hammond, D.; Banerjee, P. Apoptosis is associated with an increase in saturated fatty acid containing phospholipids in the neuronal cell line, HN2–5. Biochim. Biophys. Acta 1996, 1304, 171–178. [Google Scholar] [CrossRef]
  52. Delfino, I.; Perna, G.; Ricciardi, V.; Lasalvia, M.; Manti, L.; Capozzi, V.; Lepore, M. X-ray irradiation effects on nuclear and membrane regions of single SH-SY5Y human neuroblastoma cells investigated by Raman micro-spectroscopy. J. Pharm. Biomed. Anal. 2019, 164, 557–573. [Google Scholar] [CrossRef] [PubMed]
  53. Vileno, B.; Jeney, S.; Sienkiewicz, A.; Marcoux, P.R.; Miller, L.M.; Forró, L. Evidence of lipid peroxidation and protein phosphorylation in cells upon oxidative stress photo-generated by fullerols. Biophys. Chem. 2010, 152, 164–169. [Google Scholar] [CrossRef] [PubMed] [Green Version]
  54. Dovbeshko, G.; Gridina, N.Y.; Kruglova, E.B.; Pashchuk, O.P. FTIR Spectroscopy studies of nucleic acid damage. Talanta 2000, 53, 233–246. [Google Scholar] [CrossRef]
Figure 1. Average spectrum of an unexposed sample in the range 3600–900 cm−1; the break at 2600–1900 cm−1 hides a region without interesting signals from biological molecules; data are presented as MEAN ± SD.
Applsci 10 02974 g001
Figure 2. Spectra of one unexposed sample (A) in the range 3600–3000 cm−1, (B) 3000–2700 cm−1, (C) 2000–900 cm−1, and (D) 1800–1600 cm−1 with the results of the deconvolution analysis of peaks using Lorentzian curves and fit residual.
Applsci 10 02974 g002
Figure 3. Comparison of average Fourier transform infrared (FTIR) spectra in the region 3000–2700 cm−1 (A) and in the region 1800–900 cm−1 (B) between the control cells (0 Gy) and irradiated cells (2, 4, 6, 8, 10 Gy) fixed immediately after irradiation; the spectra are shifted in absorbance to allow the comparison, data are presented as MEAN ± SD.
Applsci 10 02974 g003
Figure 4. Comparison of average FTIR spectra in the region 3000–2700 cm−1 (A) and in the region 1800–900 cm−1 (B) between the control cells (0 Gy) and irradiated cells (2; 4; 6; 8; 10 Gy) fixed 24 h after irradiation; the spectra are shifted in absorbance to allow the comparison, data are presented as MEAN ± SD.
Applsci 10 02974 g004
Figure 5. Comparison of the absorbance ratios PR1 (A), PR2 (B), and PR3 (C) with dose, for cells fixed immediately (blue) and 24 h after irradiation (red); the ratio variations (Mean ± SD) are reported, as a value normalized with respect to the corresponding ratio value of the non-irradiated samples (0 Gy, t0; 0 Gy, t24); blue and red asterisks indicate when a significant difference in respect to the control value for the t0 and t24 samples, respectively, occurred at p 0.05 .
Applsci 10 02974 g005
Figure 6. Comparison of the absorbance ratios LS (A), PP1 (B), PP2 (C), PL1 (D) and PL2(E) with dose, for cells fixed immediately (blue) and 24 h after irradiation (red); the ratio variations (Mean ± SD) are reported, as a value normalized with respect to the corresponding ratio value of the non-irradiated samples (0 Gy, t0; 0 Gy, t24); blue and red asterisks indicate when a significant difference in respect to the control value for the t0 and t24 samples, respectively, occurred at p 0.05 .
Applsci 10 02974 g006
Figure 7. Comparison of the absorbance ratios P/D1 (A), P/D2 (B), and DM (C) with dose, for cells fixed immediately after (blue) and 24 h after irradiation (red); the ratio variations (Mean ± SD) are reported as a value normalized with respect to the corresponding ratio value of the non-irradiated samples (0 Gy, t0; 0 Gy, t24); blue and red asterisks indicate when a significant difference in respect to the control value for the t0 and t24 samples, respectively, occurred at   p 0.05 .
Applsci 10 02974 g007
Figure 8. Variations of secondary protein structure contributions to Amide I band (1590–1710 cm−1) with dose, for cells fixed immediately (A) and 24 h after irradiation (B); the ratios between the secondary structures peaks area and the area of the entire Amide I peak are reported; asterisks of different colors indicate when a significant difference in respect to the corresponding control value occurred at p   0.05 .
Applsci 10 02974 g008
Table 1. Ax/Ay indicate the ratio between the absorbance of selected band [20,39,43,44,45,46]; abbreviation: as = asymmetric, s = symmetric, ν = stretching, vbr = vibration.
RatioBiomolecular OriginIndication
Ax/Ay
A1652/A1553Amide I/Amide II-αProtein rearrangement (PR1)
A1652/A1527Amide I/Amide II-βProtein rearrangement (PR2)
A1553/A2955Amide II-α/CH3 as. νProtein/Lipid content (P/L1)
A1652/A1246Amide I/PO2 as. νProtein/DNA content (P/D1)
A1652/A1082Amide I/PO2 s. νProtein/DNA content (P/D2)
A1553/A1527Amide II-α/Amide II-βProtein rearrangement (PR3)
A2923/A2955CH2 as. ν/CH3 as. νLipid saturation (LS)
A1396/A2955COO s. ν/CH3 as. νProtein/Lipid content (P/L2)
A1246/A2955PO2as. ν, C–O–P ν/CH3 as. ν Protein phosphorylation (PP1)
A1082/A2955PO2s. ν, C–O–P ν/CH3as. νProtein phosphorylation (PP2)
A1246/A1082PO2 as. Ν, C–O–P ν/ PO2s. ν, C–O–P νDNA modification (DM)
Table 2. Average FTIR peaks position for control and samples treated with different dose of X-rays fixed immediately after irradiation. The shifts in terms of units of wavenumber are indicated in brackets (bold values stand for shifts greater than the spectral resolution of the instrument 4 cm−1). Abbreviations: p = proteins, l = lipids, c = carbohydrates.
t0 cells
0 Gy 2 Gy4 Gy6 Gy8 Gy10 Gy
Peak
(cm−1)
Peak
(cm−1)
Peak
(cm−1)
Peak
(cm−1)
Peak
(cm−1)
Peak
(cm−1)
2955p, l2956 (+1)2957 (+2)2957 (+2)2958 (+3)2959 (+4)
2922l29222922292229222923 (+1)
2870p, l2877 (+7)2874 (+4)2885 (+15)2888 (+18)2888 (+18)
2851l2851285128512852 (+1)2852 (+1)
1652p1651 (−1)1651 (−1)1649 (−3)1648 (−4)1649 (−3)
1553p1550 (−3)1551 (−2)1550 (−3)1547 (−6)1544 (−9)
1527p1523 (−4)1525 (−2)1528 (+1)1522 (−5)1515 (−12)
1455p, l145514551452 (−3)1451 (−4)1452 (−3)
1396p1398 (+2)1397 (+1)1399 (+3)1402 (+6)1407 (+11)
1246DNA, c1248 (+2)1247 (+1)1243 (−3)1240 (−6)1241 (−5)
1082DNA1081 (−1)10821084 (+2)1083 (+1)1088 (+6)
Table 3. Average FTIR peak positions for control and samples treated with different doses of X-rays fixed 24 h after irradiation. The shifts in terms of units of wavenumber are indicated in brackets for the 0 Gy spectrum stands for shifts with respect to the values found for the control spectrum (t0); bold values stand for shifts greater than the spectral resolution of the instrument 4 cm−1. Abbreviations: p = proteins, l = lipids, c = carbohydrates.
t24 cells
0 Gy 2 Gy4 Gy6 Gy8 Gy10 Gy
Peak
(cm−1)
Peak
(cm−1)
Peak
(cm−1)
Peak
(cm−1)
Peak
(cm−1)
Peak
(cm−1)
2955p, l2959 (+4)2958 (+3)2959 (+4)2958 (+3)2958 (+3)
2921l292129212922 (+1)2922 (+1)2922 (+1)
2886p, l2883 (−3)2883 (−3)2890 (+4)2890 (+4)2890 (+4)
2852l2851 (−1)2851 (−1)2851 (−1)28522852
1646p1648 (+2)1649 (+3)1647 (+1)1648 (+2)1645 (−1)
1547p1549 (+2)1553 (+6)1546 (−1)1550 (+3)1546 (−1)
1522p1528 (+6)1529 (+7)1529 (+7)1527 (+5)1520 (−2)
1452p, l1450 (−2)1448 (−4)1448 (−4)1447 (−5)1448 (−4)
1398p13981399 (+1)1400 (+2)1400 (+2)1398
1235DNA, c1233 (−2)1225 (−10)1232 (−3)1230 (−5)1229 (−6)
1078DNA1071 (−7)1090 (+12)1085 (+7)1090 (+12)1087 (+9)

