Abstract
Purpose: To develop and test an innovative semi-automatic method for quantifying the three-dimensional morphology of the peripapillary retinal pigment epithelium-basement membrane (ppRPE/BM) layer, with application to lumbar puncture (LP) patients. Methods: Nineteen patients undergoing LP were recruited. The optic nerve head images of both eyes were acquired in 12 radial directions using optical coherence tomography (OCT) before and after LP. For each OCT image, the ppRPE/BM layer was automatically segmented with manual corrections by independent graders when necessary. The linear regression model of the ppRPE/BM layer was fitted using the least squares approach, and the ppRPE/BM layer angle was measured as the slope of the linear regression line. The Bland–Altman plots and intraclass correlations (ICC) were used to assess the inter-observer reliabilities in measuring the ppRPE/BM layer angle. The repeated measures ANOVA analysis was applied to determine whether the ppRPE/BM layer angle changes following LP varied across the radial directions. Results: The percentages of scans that required manual corrections were 24% and 32% in the right eyes and left eyes, respectively. The Bland–Altman plots and ICC demonstrated excellent inter-observer reliability. The ppRPE/BM layer angle varied significantly across the 12 radial OCT scanning directions both before and after LP. However, the LP-induced changes in the ppRPE/BM layer angle across different radial directions were not statistically significant (p-value > 0.01). Conclusions: The three-dimensional quantifications of the ppRPE/BM layer angles, enabled by the semi-automatic method, provided enhanced information of the optic nerve head structure. For LP patients, the ppRPE/BM layer angle changes following the LP did not vary significantly across various radial directions, indicating that it could be evaluated in any radial direction.
1. Introduction
Intracranial pressure (ICP) is critical in the management of several conditions, such as traumatic brain injury or intracranial hypertension. Abnormal ICP is also associated with various ocular diseases (e.g., papilledema, glaucoma) [1,2]. Current techniques of ICP measurement, such as lumbar puncture, are invasive, need technical expertise, and can lead to medical complications [3]. The optic nerve head (ONH) lies at the interface of intraocular pressure (IOP) and ICP compartments, and hence, can be leveraged for non-invasive estimation of ICP. Optical coherence tomography (OCT) is commonly used in ophthalmology clinics to inspect the ONH structure noninvasively [4]. Morphological quantifications from the OCT scans (e.g., retinal thickness and lamina cribrosa depth) facilitate the diagnosis and treatment planning of many blinding diseases [5,6,7,8]. The shape of peripapillary retinal pigment epithelium-basement membrane (ppRPE/BM) layer has attracted much attention due to its relationship with ICP fluctuations [9]. Specifically, Sibony et al. used a manual segmentation method for selected patients with symmetrical temporal-nasal scans, and observed that the ppRPE/BM layer exhibited a deeper V-shape following the ICP-lowering intervention [10]. Gampa et al. adopted the same labor-intensive segmentation approach and detected the alternations of ppRPE/BM layer within 1 h after lumbar puncture (LP) to lower the ICP. There are several limitations to the methods used by these groups. The principal component analysis (PCA) method was generally used in the aforementioned shape analysis [9,11]. However, the principal components depend on the choice of dataset [12,13], and the shape analysis results highly depend on the choice of OCT scan direction. Moreover, only one OCT scan per patient was used for the ppRPE/BM layer shape analysis (mostly the temporal-nasal scan) [9,10,11,14] due to the labor intensive methods for manual segmentations. However, one recent study showed that the ppRPE/BM layer shapes were different across various radial directions [15]. A three-dimensional (3D) characterizations of the ppRPE/BM layer is needed for better mechanistic understanding of ONH morphology following ICP changes [16].
In this work, we developed a semi-automatic method to quantitatively characterize the 3D morphology of the ppRPE/BM layer in patients undergoing LP. Following the segmentation of the ppRPE/BM layers, linear regression models were fitted using the least squares approach. The ppRPE/BM layer angle was measured as the slope of the linear regression line. To compensate for image tilting, we obtained the average of ppRPE/BM layer angles from the right and left zone in each radial OCT scan. The scan angles obtained from two independent graders or using our semi-automatic method were compared, and the inter-observer agreement and reliability were evaluated. We tested our method using OCT images of nineteen patients undergoing medically necessary LP. Statistical analysis was performed to evaluate the LP-induced cross-sectional ppRPE/BM layer angle change. To the best of our knowledge, this is the first semi-automatic method that could efficiently quantify the 3D ppRPE/BM layer by integrating all radial OCT scans.
2. Methods
2.1. Subjects
Nineteen neurological patients scheduled for a medically necessary LP were enrolled. These patients were being evaluated for multiple sclerosis (8), idiopathic intracranial hypertension (5), dementia (4), neuropathy (1), and headache (1). All lumbar punctures were performed by a single neurologist using a standard protocol in the lateral decubitus position. All patients underwent ophthalmoscopy before and after lumbar puncture. There were no patients with myopic crescent and 1 had peripapillary atrophy.
This study was approved by the University of Nebraska Medical Center Institution Review Board and written informed consent was obtained from all participants prior to the enrollment. This research involving human subjects followed the Declaration of Helsinki.
2.2. Image Acquisition and Processing
The OCT imaging was performed for both eyes immediately before and 30 min after LP, using Cirrus HD-OCT (Carl Zeiss Meditec Inc, USA). The radial scan protocol consisted of 12 cross-sectional scans (also referred to as B-scan) centered on the ONH (Figure 1A). For image radial position consistency, the B-scans acquired before LP were used as the reference for the B-scans acquisitions after LP. Each B-scan was exported from the OCT machine in TIFF format with a size of 938 × 625 pixels (3 × 2 mm) and an aspect ratio of 0.5 (Figure 1B). All B-scans analyzed in this study had an image quality of 7 or higher. All B-scans were then converted to their anatomically correct size of 1876 × 625 (6 × 2 mm) by stretching the image horizontally with a factor of 2 (Figure 1C). The pixel size in the scan with an aspect ratio of 1 was 3.2 µm.
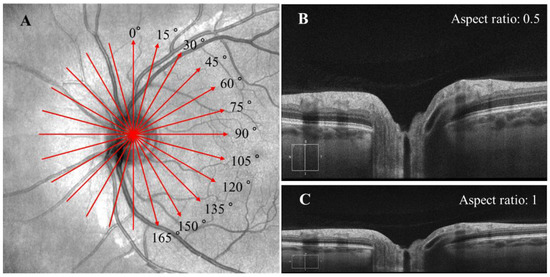
Figure 1.
(A) The radial scan protocol consisted of 12 radial B-scans. Each red arrow line indicates one radial scan, with the arrow indicating the scanning direction was from the left to right in each B-scan. (B) The original B-scan with a size of 938 × 625 pixel (3 × 2 mm) and an aspect ratio of 0.5. (C) Each B-scan was converted to its anatomically correct size of 1876 × 625 pixel (6 × 2 mm) with an aspect ratio of 1.
2.3. The ppRPE/BM Layer Segmentation
The ppRPE/BM layer in the OCT images was automatically segmented using OCTSEG (Version 0.4, Pattern Recognition Lab, Friedrich-Alexander University) [17]. This open-source segmentation tool has been applied to segment the continuous retinal layers [18,19,20]. However, it was difficult to segment the discontinuous retina layer in the ONH region. Hence, we divided the B-scans into three zones: left, mid, and right with size of 450 × 625 pixel, 976 × 625 pixel, and 450 × 625 pixel, respectively (Figure 2 Top). Both the left and right zones with continuous retina layers were used for the ppRPE/BM layer segmentation. The automatic segmentation results were reviewed by two trained graders independently. If the ppRPE/BM layer was not correctly segmented, manual correction was applied by experienced graders to repaint the segmented layer.
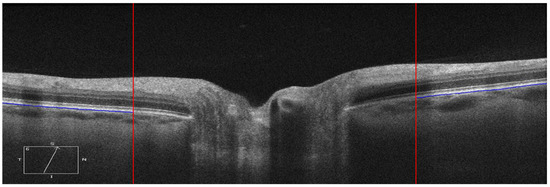
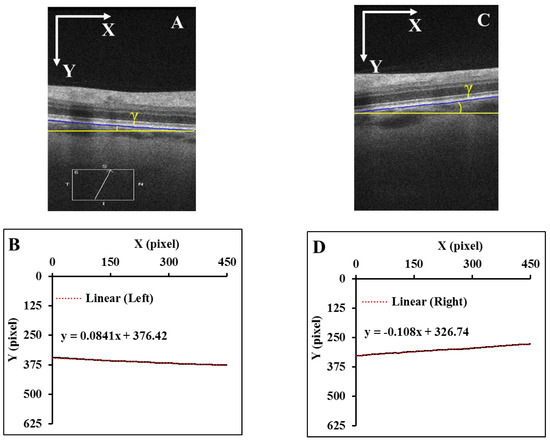
Figure 2.
Each B-scan was divided into three zones as marked by two red vertical lines and only the left and right zones were segmented (Top). The segmented ppRPE/BM layers were highlighted in blue color with an angle γ relative to the X-axis. (A,C). The corresponding linear regression models of the segmented ppRPE/BM layers in the left and right zones (B,D).
2.4. Linear Regression of the ppRPE/BM Layer
The segmented ppRPE/BM layer in OCT scans showed a nearly straight line [11]. The coordinates (x, y) of each pixel on the ppRPE/BM layer were the output from the OCTSEG, with the origin located at the upper left corner of the scan, which were then fitted using a linear regression model (Figure 2B,D) as:
where β is the linear regression coefficient, and b is the intercept.
The distance (D) from each pixel on the ppRPE/BM layer to the regression line was calculated as:
The maximum distance () in each B-scan was recorded. A small means that all pixels on the ppRPE/BM layer are close to the regression line, indicating the ppRPE/BM layer is straight. While a large indicates the ppRPE/BM layer may not be treated as a straight line, and the corresponding eye would be excluded from this study when is larger than 10 pixels (32 µm).
2.5. Measurement of the ppRPE/BM Layer Angle
The ppRPE/BM layer angle (γ) relative to the horizon (X-axis) was calculated based on the slope of the regression model (Figure 2B,D) as:
It should be noticed that the origin of the coordinates is always set at the upper left corner of the scan with X-axis pointing to the right and Y-axis pointing to the inferior. This means that X-axis direction in the left zone is from the periphery to the ONH center, while it is from the ONH center to the periphery in the right zone. The coordinates setting led to a negative slope in the right zone (Figure 2D). To maintain the angle consistency, the angle γ at the right zone was multiplied by −1. In Figure 2B, the slope of the regression line is β = 0.0841, which led to an angle of 4.11°, while in Figure 2D, with β = −0.108, we got the angle of 6.17°.
2.6. Image tilt Correction
A misalignment between the OCT scan beam and the axis of the optic nerve during B-scan acquisition can result in significant image tilting [11]. Thus, the angle γ change could be significantly different between the left and right zone of the same B-scan, or even opposite after LP. For example, in Figure 3, the LP induced γ increased from −1.31° to 2.34° in the left zone, while it decreased from 2.44° to 0.77° in the right zone.
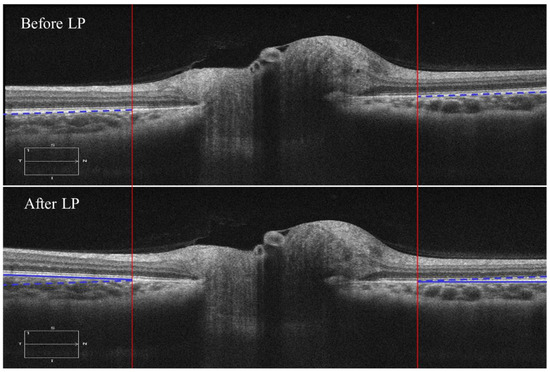
Figure 3.
B-scans before and after LP in the temporal-nasal direction from the same individual. The blue dashed line marks the ppRPE/BM layer before LP, and the blue solid line marked the ppRPE/BM layer after LP. To visualize the angle γ change difference, the blue dashed line in the B-scan before LP was shifted vertically to the B-scan after LP.
This tilting artifact can be eliminated by averaging the ppRPE/BM layer angles of the left and right zones from the same cross-sectional B-scan. This averaged ppRPE/BM layer angle was referred to as the cross-sectional ppRPE/BM layer angle and denoted as Γ. A positive Γ indicates a V-shaped ppRPE/BM layer. The angle Γ in Figure 3 was 0.57° before LP, and increased to 1.56° after LP. In addition, this averaging method could also eliminate the artifact induced by the tilting of B-scan relative to the scanning window. Figure 4 illustrates one example in which the OCT scan had a tilt angle of 1.88° against the scanning window. The γ was measured as 4.78° in the left zone and −0.38° in the right zone. The angle Γ was calculated as 2.20°. After we readjusted the scan to its correct position by rotating an angle of 1.88° clockwise, the γ became 6.19° in the left zone and −1.98° in the right zone. The corresponding Γ was calculated as 2.11°, which was only 0.09° less than the one without tilt correction.
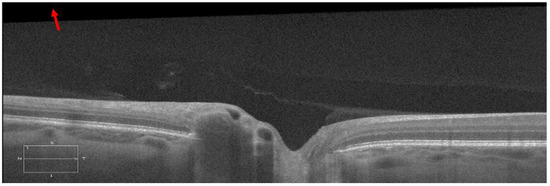
Figure 4.
A representative B-scan with tilt artifact against the scanning window, which is marked with a red arrow (the contrast sensitivity was adjusted to better visualize the tilt artifact).
2.7. Data Analyses
For each eye, we calculated Γ before and after LP, as well as the LP induced change of Γ (denoted as ΔΓ) in all 12 radial directions. The inter-observer agreement of the Γ measurements in the manually corrected scans was analyzed using Bland-Altman method [21]. The inter-observer reliability was assessed using the intraclass correlation coefficient (ICC) by comparing the measurement results of the two graders [22]. The ICC was calculated using a two-way random model with absolute agreement.
The standard deviations of Γ before LP, Γ after LP, and ΔΓ across the 12 radial directions were also calculated for each eye. The results of 16 right and 14 left eyes were represented using a boxplot. The paired t-test was applied to evaluate whether there was a significant difference in the standard deviation among Γ before LP, Γ after LP, and ΔΓ. The repeated measures ANOVA analysis was applied to detect whether the ΔΓ following LP varied significantly across the 12 radial directions. In addition, for each eye, a paired t-test was also applied to determine whether the ΔΓ was significantly different from 0° following LP.
The statistical analysis was performed using SPSS version 25.0 for Windows (IBM Corp, Armonk, NY, USA). p-value < 0.01 was considered statistically significant.
3. Results
3.1. Patient Characteristics
Thirty-six eyes from nineteen subjects (12 females and 7 males) with age ranging from 19 to 71 years were imaged. Two eyes from two subjects with poor vision were excluded due to the failure of image acquisition from poor fixation. Among the thirty-six eyes, thirty eyes (16 right eyes and 14 left eyes) were analyzed. Six eyes were excluded because of an indistinguishable ppRPE/BM layer (4) and non-straight ppRPE/BM layer (2).
3.2. Image Segmentation Characteristics
For each eye, we acquired 12 radial OCT scans both before and after LP, resulting in total 24 OCT scans. After splitting each OCT scan for automatic segmentation as shown in Figure 2, the number of the scans was doubled to 48 scan segments for each eye. For the 16 right eyes, 768 OCT scans were applied to the automatic segmentation, from which 185 (24%) OCT scans were found to have segmentation errors identified by at least one grader and underwent manual corrections. For the 14 left eyes, 672 OCT scans were automatically segmented, where 217 (32%) OCT scans required manual corrections.
For the right eyes, the in each OCT scan is depicted in Figure 5. It was observed that the peak in all scans was 9.4 pixels (30 µm), while it was less than 5 pixels (16 µm) in 96% of scans. For the left eyes (Supplementary Figure S1), the peak in all scans was 8.6 pixels (27 µm), while it was less than 5 pixels (16 µm) in 96% of scans.
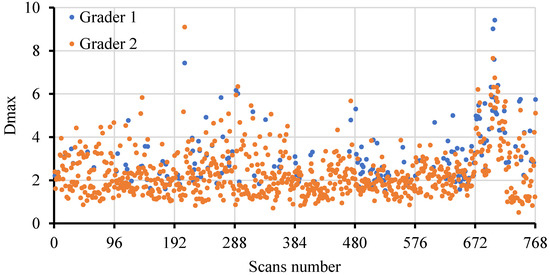
Figure 5.
The peak distribution in the 768 scans from the 16 right eyes conducted by two graders.
3.3. Inter-Observer Reliabilities
The Bland–Altman analysis revealed a good agreement of the Γ measurement between the two graders (Figure 6). Specifically, for the right eyes, the mean inter-observer difference between the two graders was 0.005°, and the 95% limits of agreement were between −0.16° and 0.17°. For the left eyes, the mean inter-observer difference between the two graders was 0.05°, and the 95% limits of agreement were between −0.17° and 0.27°. The ICCs for the right eyes and left eyes were 0.999 (p < 0.001) and 0.998 (p < 0.001), respectively.
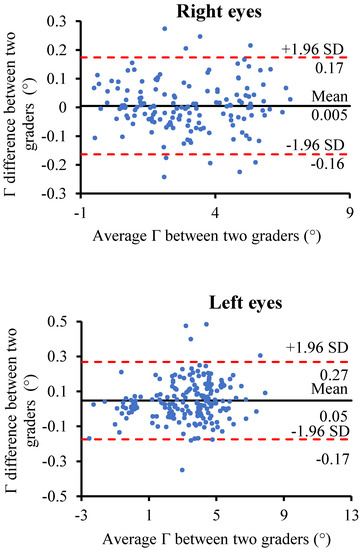
Figure 6.
Bland–Altman plot of the inter-observer agreement of the Γ measurements between the two graders for the right eyes and left eyes. The solid black line represents the mean of the Γ measurements difference between the two graders; the two dashed red lines represent the mean of the difference ± 1.96×standard deviation of the Γ measurements difference.
3.4. The Average ppRPE/BM Cross-Sectional Angle (Γ) across all Radial Directions
Figure 7 depicts the representative distribution of Γ across the 12 radial directions before and after LP in the right eye and left eye, respectively. It is clear that the averaged ppRPE/BM layer angle Γ varied considerably across the radial directions. Specifically, the distribution pattern of the Γ showed a sine-like curve for the right eye, while a cosine-like curve for the left eye. The distribution pattern of Γ before and after LP were almost identical, indicating that LP-induced ΔΓ is independent of the radial scan directions. Moreover, such distribution patterns were observed in 29 out of 30 eyes.
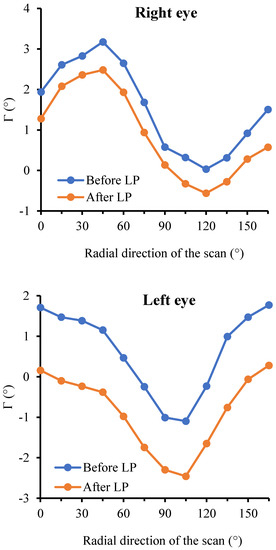
Figure 7.
The representative distribution of Γ across the 12 radial scans before and after LP in both eyes of one patient.
For the 16 right eyes, the standard deviations of Γ ranged from 0.20° to 1.19° before LP, and they ranged from 0.19° to 1.18° after LP (Figure 8). For the 14 left eyes, the standard deviations of Γ ranged from 0.26° to 1.34° before LP, and they ranged from 0.28° to 1.31° after LP. The standard deviations of ΔΓ ranged from 0.07° to 0.20° in the 16 right eyes, and they ranged from 0.05° to 0.29° in the 14 left eyes. The standard deviations of ΔΓ were significantly smaller than those of Γ before or after LP. The standard deviations of Γ before LP were found not significantly different from those after LP in all eyes. Furthermore, the repeated measures ANOVA analysis revealed that the ppRPE/BM layer angle change (ΔΓ) did not vary significantly across the radial directions (p-value > 0.01) in both right eyes and left eyes. In addition, no significant difference was found between right eyes and left eyes with respect to the standard deviations of Γ before LP, Γ after LP, or ΔΓ.
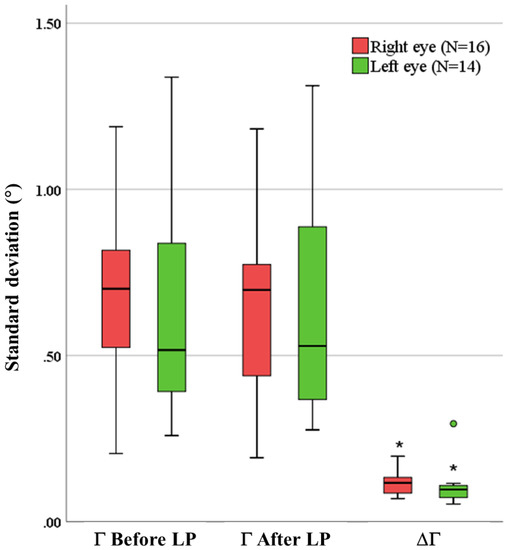
Figure 8.
The standard deviations of Γ before LP, Γ after LP, and ΔΓ. The solid dark line indicates the median, and the circle indicates the outlier. (* indicates the standard deviations of ΔΓ were significantly different from that in Γ before and after LP).
The mean ΔΓ across the 12 radial directions in the 16 right eyes and 14 left eyes are further depicted in Figure 9. Among them, 7 right eyes and 6 left eyes were found to have a positive ΔΓ after LP. It was also observed that the ΔΓ after LP could be dramatically different or even opposite between the right eye and left eye of the same individual. In addition, the paired tests revealed that 15 right eyes (94%) and 14 left eyes (100%) had significant ppRPE/BM layer angle changes following LP (p < 0.01). Only the right eye of patient 15 did not show significant changes of Γ following the LP.
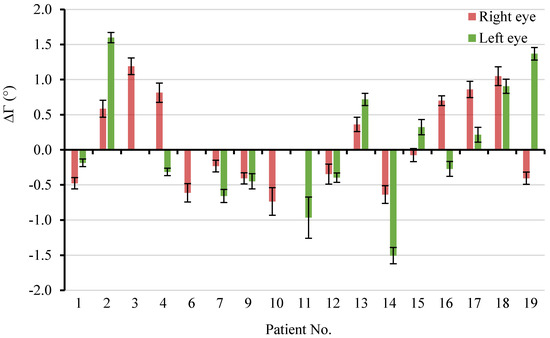
Figure 9.
The mean ΔΓ across the 12 radial directions in the 16 right eyes and 14 left eyes. Error bar: ± standard deviation.
4. Discussions
In this study, we developed a semi-automatic imaging analysis to quantify the 3D structure of the ppRPE/BM layer and used it to study morphological changes in patients following LP. We measured the angle of the ppRPE/BM layer in the OCT scans across all 12 radial directions. We found that the ppRPE/BM layer angle varied along different scanning directions, both before and after LP, while the LP-induced change in the ppRPE/BM layer angle was minimal along different scanning directions. We validated our method using 2 independent graders to review and manually segment each OCT scan when necessary. The averaged ppRPE/BM layer angle at each B-scan was proposed to eliminate tilting artifacts, which are inherent to OCT imaging acquisition. We propose that the mean ppRPE/BM layer angle change could serve as a biomarker to study the morphological changes of the ppRPE/BM layer in different clinical scenarios.
Our unique segmentation method along with a regression model enabled us to quantify the morphology of the ppRPE/BM layer in 3D efficiently. The ppRPE/BM layer was segmented using OCTSEG software, with manual corrections if necessary [17]. The coordinate information of the segmented ppRPE/BM layer was used to calculate the ppRPE/BM layer angle using the linear regression model. The distance from the ppRPE/BM layer to its linear regression line was used to quantify the straightness of the ppRPE/BM layer. A threshold of 10 pixels (32 µm) was used as the upper limit of “straightness”. A good agreement was observed between the two graders (Figure 6) with ICCs close to one, indicating that the proposed method in quantifying the ppRPE/BM layer angle is robust. Only two eyes were excluded based on this criterion (supplementary material Figure S2). The ppRPE/BM layer angle γ at each radial scan segment was calculated using the slope of the linear regression line.
The averaged ppRPE/BM layer angle Γ at each scan was proposed to eliminate the potential imaging artifacts. The magnitude of Γ varied significantly across different radial directions both before and after the LP (Figure 7). This is consistent with the observation by Malhotra et al., who found that the ppRPE/BM shape before LP was different along different radial directions [15]. However, the ppRPE/BM layer angle changes following the LP did not vary significantly along different radial directions. This implied that exclusion of occasional radial OCT scans (e.g., scans with undistinguishable ppRPE/BM layers) would not significantly affect the mean of the ppRPE/BM layer angle change in that eye.
Furthermore, the mean of the ppRPE/BM layer angle changes across all radial directions could serve as a biomarker to represent the 3D changes to the ppRPE/BM layer. This biomarker could integrate the ppRPE/BM layer angle change in 3D with less bias as compared to prior 2D quantifications in one designated scan direction. The paired t-test revealed the Γ after LP was significantly different from that before LP in all eyes except for one eye. The results also demonstrated the capacity of our method in detecting the changes of the ppRPE/BM layer angle following LP (Figure 9).
Previous studies have shown the ppRPE/BM layer became more V-shaped in patients with intracranial hypertension and papilledema within 1 week following LP [10]. In this study, the mean of the ppRPE/BM layer angle changes across the 12 radial directions was calculated for each eye (Figure 9). The positive mean angle indicated a more V-shaped ppRPE/BM layer, which was only observed in 7 (44%) right eyes and 6 (43%) left eyes within 30 min following LP. There are several reasons why a positive mean angle change was not seen in all our subjects. First, this positive angle change may be related to the chronicity of ICP increase and papilledema. Gampa et al. reported that the deflections of the ppRPE/BM away from the vitreous were only seen in participants with high ICP and papilledema following the LP [9]. Second, we only obtained OCT images once after LP at 30 min. It is unclear if there would have been further changes at a later time period. Third, it could be attributed to the different gaze positions between the two OCT imaging acquisitions before and after LP. Demer et al. found that the adduction of the eye could induce significant posterior displacement of the ppRPE/BM layer and ONH tilt [23,24]. In our study group, it is possible that patients had an adducted eye position before LP, and a primary position (central gaze) after LP, which would then lead to a larger ppRPE/BM layer angle before LP, and further, a negative ppRPE/BM layer angle change following the LP. Future study on the ppRPE/BM layer angle with various gaze positions would provide more information on this issue.
The major limitation of our study is the small number of patients recruited in this study. This was a pilot/exploratory study of ONH morphological changes following LP designed to obtain pilot data. In addition, only straight ppRPE/BM layer could be adopted for this method. In patients with severe papilledema or staphylomas, the ppRPE/BM layer might be curved at certain radial directions, precluding application of our method. Regardless of these limitations, the mean ppRPE/BM layer angle change through the semi-automatic method developed in this study is highly relevant in studying the morphological changes of ONH following changes in ICP and IOP in normal subjects as well as in disease conditions such as glaucoma, intracranial hypertension, acute mountain sickness in mountaineers [25], as well as evaluation of space associated neuro-ocular syndrome (SANS) in astronauts following a long-duration space flight [16].
Supplementary Materials
The following are available online at https://www.mdpi.com/2076-3417/10/5/1559/s1, Figure S1: The Dmax in the 672 scans from 14 left eyes, evaluated by two graders, Figure S2: Two excluded eyes due to non-straight ppRPE/BM layer with Dmax larger than 10 pixels.
Author Contributions
Conceptualization and methodology, J.T. and L.G.; software, J.T.; image acquisition, S.K. and D.G.; writing—original draft preparation, J.T.; writing—revision, P.D., J.T., S.K., D.G., and L.G.; supervision, L.G.; funding acquisition, S.K. and D.G. All authors have read and agreed to the published version of the manuscript.
Funding
This study was supported by the Department of Neurological Sciences, Nebraska University Collaboration grant, Fremont Area Alzheimer’s Committee grant, Nebraska Tobacco Settlement Biomedical Research Development Fund (NTSBRDF), and the National Institute of General Medical Sciences, 1 U54 GM115458, which funds the Great Plains IDeA-CTR Network. The content is solely the responsibility of the authors and does not necessarily represent the official views of any funding agent.
Conflicts of Interest
The authors declare no conflict of interest.
References
- Tso, M.; Hayreh, S.S. Optic disc edema in raised intracranial pressure. III. A pathologic study of experimental papilledema. Arch. Ophthalmol. 1977, 95, 1448–1457. [Google Scholar] [CrossRef] [PubMed]
- Berdahl, J.; Fautsch, M.P.; Stinnett, S.S.; Allingham, R.R. Intracranial pressure in primary open angle glaucoma, normal tension glaucoma, and ocular hypertension: A case-control study. Investig. Ophthalmol. Vis. Sci. 2008, 49, 5412–5418. [Google Scholar] [CrossRef] [PubMed]
- Zhang, X.; Iskandar, B.J.; Wang, F.; Shokoueinejad, M.; Koueik, J.; Webster, J.G.; Medow, J.E. Invasive and noninvasive means of measuring intracranial pressure: A review. Physiol. Meas. 2017, 38, R143–R182. [Google Scholar] [CrossRef] [PubMed]
- Drexler, W.; Morgner, U.; Ghanta, R.K.; Kärtner, F.X.; Schuman, J.S.; Fujimoto, J.G. Ultrahigh-resolution ophthalmic optical coherence tomography. Nat. Med. 2001, 7, 502–507. [Google Scholar] [CrossRef] [PubMed]
- Chen, T.C. Spectral Domain Optical Coherence Tomography in Glaucoma: Qualitative and Quantitative Analysis of the Optic Nerve Head and Retinal Nerve Fiber Layer (An AOS Thesis). Trans. Am. Ophthalmol. Soc. 2009, 107, 254–281. [Google Scholar] [PubMed]
- Browning, D.J.; Glassman, A.R.; Aiello, L.P.; Bressler, N.M.; Bressler, S.B.; Danis, R.P.; Davis, M.D.; Ferris, F.L.; Huang, S.S.; Kaiser, P.; et al. Optical Coherence Tomography Measurements and Analysis Methods in Optical Coherence Tomography Studies of Diabetic Macular Edema. Ophthalmology 2008, 115, 1366–1371.e1. [Google Scholar] [CrossRef]
- Park, H.-Y.L.; Jeon, S.H.; Park, C.K. Enhanced Depth Imaging Detects Lamina Cribrosa Thickness Differences in Normal Tension Glaucoma and Primary Open-Angle Glaucoma. Ophthalmology 2012, 119, 10–20. [Google Scholar] [CrossRef]
- Sigal, I.A.; Wang, B.; Strouthidis, N.G.; Akagi, T.; Girard, M. Recent advances in OCT imaging of the lamina cribrosa. Br. J. Ophthalmol. 2014, 98, ii34–ii39. [Google Scholar] [CrossRef]
- Gampa, A.; Vangipuram, G.; Shirazi, Z.; Moss, H.E. Quantitative association between peripapillary Bruch’s membrane shape and intracranial pressure. Investig. Ophthalmol. Vis. Sci. 2017, 58, 2739–2745. [Google Scholar] [CrossRef]
- Sibony, P.A.; Kupersmith, M.J.; Honkanen, R.; Rohlf, F.; Torab-Parhiz, A. Effects of Lowering Cerebrospinal Fluid Pressure on the Shape of the Peripapillary Retina in Intracranial Hypertension. Investig. Ophthalmol. Vis. Sci. 2014, 55, 8223–8231. [Google Scholar] [CrossRef]
- Sibony, P.; Kupersmith, M.J.; Rohlf, F.J. Shape analysis of the peripapillary RPE layer in papilledema and ischemic optic neuropathy. Investig. Ophthalmol. Vis. Sci. 2011, 52, 7987–7995. [Google Scholar] [CrossRef] [PubMed]
- Fredembach, C.; Schröder, M.; Süsstrunk, S. Eigenregions for image classification. IEEE Trans. Pattern Anal. Mach. Intell. 2004, 26, 1645–1649. [Google Scholar] [CrossRef] [PubMed]
- Jolliffe, I.T.; Cadima, J. Principal Component analysis: A review and recent developments. Philos. Trans. R. Soc. A Math. Phys. Eng. Sci. 2016, 374, 20150202. [Google Scholar] [CrossRef] [PubMed]
- Kupersmith, M.J.; Sibony, P.; Mandel, G.; Durbin, M.; Kardon, R. Optical coherence tomography of the swollen optic nerve head: Deformation of the peripapillary retinal pigment epithelium layer in papilledema. Investig. Ophthalmol. Vis. Sci. 2011, 52, 6558–6564. [Google Scholar] [CrossRef]
- Malhotra, K.; Patel, M.D.; Shirazi, Z.; Moss, H.E. Association Between Peripapillary Bruch’s Membrane Shape and Intracranial Pressure: Effect of Image Acquisition Pattern and Image Analysis Method. Front. Neurol. 2018, 9, 1137. [Google Scholar] [CrossRef]
- Patel, N.B.; Pass, A.; Mason, S.; Gibson, C.R.; Otto, C. Optical Coherence Tomography Analysis of the Optic Nerve Head and Surrounding Structures in Long-Duration International Space Station Astronauts. JAMA Ophthalmol. 2018, 136, 193–200. [Google Scholar] [CrossRef]
- Mayer, M.A.; Hornegger, J.; Mardin, C.Y.; Tornow, R.P. Retinal Nerve Fiber Layer Segmentation on FD-OCT Scans of Normal Subjects and Glaucoma Patients. Biomed. Opt. Express 2010, 1, 1358–1383. [Google Scholar] [CrossRef]
- Bhaduri, B.; Shelton, R.L.; Nolan, R.M.; Hendren, L.; Almasov, A.; Labriola, L.T.; Boppart, S.A. Ratiometric analysis of optical coherence tomography–measured in vivo retinal layer thicknesses for the detection of early diabetic retinopathy. J. Biophotonics 2017, 10, 1430–1441. [Google Scholar] [CrossRef]
- Girish, G.N.; Kothari, A.R.; Rajan, J. Marker controlled watershed transform for intra-retinal cysts segmentation from optical coherence tomography b-scans. Pattern Recognit. Lett. 2017, 100. [Google Scholar] [CrossRef]
- Boretsky, A.; Gupta, P.; Tirgan, N.; Liu, R.; Godley, B.F.; Zhang, W.; Tilton, R.G.; Motamedi, M. Nicotine accelerates diabetes-induced retinal changes. Curr. Eye Res. 2014, 40, 368–377. [Google Scholar] [CrossRef]
- Bland, J.M.; Altman, U. Statistical methods for assessing agreement between two methods of clinical measurement. Lancet 1986, 327, 307–310. [Google Scholar] [CrossRef]
- Shrout, P.E.; Fleiss, J.L. Intraclass correlations: Uses in assessing rater reliability. Psychol. Bull. 1979, 86, 420. [Google Scholar] [CrossRef] [PubMed]
- Chang, M.Y.; Shin, A.; Park, J.; Nagiel, A.; Lalane, R.A.; Schwartz, S.D.; Demer, J.L. Deformation of Optic Nerve Head and Peripapillary Tissues by Horizontal Duction. Am. J. Ophthalmol. 2016, 174, 85–94. [Google Scholar] [CrossRef] [PubMed]
- Suh, S.Y.; Le, A.; Shin, A.; Park, J.; Demer, J.L. Progressive Deformation of the Optic Nerve Head and Peripapillary Structures by Graded Horizontal Duction. Investig. Ophthalmol. Vis. Sci. 2017, 58, 5015–5021. [Google Scholar]
- Sutherland, A.I.; Morris, D.S.; Owen, C.G.; Bron, A.J.; Roach, R. Optic nerve sheath diameter, intracranial pressure and acute mountain sickness on Mount Everest: A longitudinal cohort study. Br. J. Sports Med. 2008, 42, 183–188. [Google Scholar] [CrossRef]
© 2020 by the authors. Licensee MDPI, Basel, Switzerland. This article is an open access article distributed under the terms and conditions of the Creative Commons Attribution (CC BY) license (http://creativecommons.org/licenses/by/4.0/).