Article

An Investigation of Early Detection of Driver Drowsiness Using Ensemble Machine Learning Based on Hybrid Sensing †

1
Institute of Industrial Science, The University of Tokyo, Tokyo 153-8505, Japan
2
Nissan Motor, Co., Ltd., Kanagawa 243-0192, Japan
3
Department of Human and Engineered Environment Studies, Graduate School of Frontier Sciences, The University of Tokyo, Chiba 277-8563, Japan
*
Author to whom correspondence should be addressed.
This paper is an extended version of paper published in the 2018 IEEE International Conference on Intelligent Transportation Systems, held in Maui, Hawaii, HI, USA, 4–7 November 2018.
Appl. Sci. 2020, 10(8), 2890; https://doi.org/10.3390/app10082890
Submission received: 17 March 2020 / Revised: 10 April 2020 / Accepted: 17 April 2020 / Published: 22 April 2020
(This article belongs to the Special Issue Intelligent Transportation Systems)

Abstract

:
Drowsy driving is one of the main causes of traffic accidents. To reduce such accidents, early detection of drowsy driving is needed. In previous studies, it was shown that driver drowsiness affected driving performance, behavioral indices, and physiological indices. The purpose of this study is to investigate the feasibility of classification of the alert states of drivers, particularly the slightly drowsy state, based on hybrid sensing of vehicle-based, behavioral, and physiological indicators with consideration for the implementation of these identifications into a detection system. First, we measured the drowsiness level, driving performance, physiological signals (from electroencephalogram and electrocardiogram results), and behavioral indices of a driver using a driving simulator and driver monitoring system. Next, driver alert and drowsy states were identified by machine learning algorithms, and a dataset was constructed from the extracted indices over a period of 10 s. Finally, ensemble algorithms were used for classification. The results showed that the ensemble algorithm can obtain 82.4% classification accuracy using hybrid methods to identify the alert and slightly drowsy states, and 95.4% accuracy classifying the alert and moderately drowsy states. Additionally, the results show that the random forest algorithm can obtain 78.7% accuracy when classifying the alert vs. slightly drowsy states if physiological indicators are excluded and can obtain 89.8% accuracy when classifying the alert vs. moderately drowsy states. These results represent the feasibility of highly accurate early detection of driver drowsiness and the feasibility of implementing a driver drowsiness detection system based on hybrid sensing using non-contact sensors.

1. Introduction

Drowsy driving is one of the main causes of traffic accidents [1]. Since drivers cannot react to dangerous situations when drowsy, major accidents can occur. To prevent accidents due to drowsy driving, it is necessary to detect driver drowsiness early and accurately. Previous studies showed that the drowsiness level of a driver is related to their facial expression, driving behaviors, and physiological responses [2,3,4,5,6,7,8,9,10,11,12]. There is a strong correlation between real drowsiness and subjective evaluation based on facial expressions [2,3]. Therefore, monitoring a driver’s facial expressions is a widely accepted method for detecting driver drowsiness. Monitoring head position, eye blinks, and body movement has also been used to detect driver drowsiness [4,5,6]. In addition, physiological measurements are widely utilized to detect driver drowsiness because it directly reflects the internal physiological states of drivers. An electroencephalogram (EEG) is utilized to investigate the brain activity related to arousal level [7,8]; therefore, EEG-based methods to detect driver drowsiness have been proposed [9,10]. Since an electrocardiogram (ECG) is easier to measure than EEG and measures autonomic nervous system activity, ECG-based methods have been proposed [11], along with hybrid methods of both EEG and ECG measures [12]. In addition, previous studies showed that drowsiness level affects driving performance [13,14,15]. The movement of the steering wheel is mainly utilized to evaluate driving performance and detect driver drowsiness [13]. As the drowsiness level of the driver increases, performance related to lane keeping decreases. As an example, the standard deviation of lateral position (SDLP), which is widely utilized as the evaluation index of steering control, increases [14]. Performance related to preceding-car following such as Time Headway (THW), which is defined as the time between successive vehicles that pass a certain point in the path of traffic flow, decreases [15]. To determine the drowsiness level of a driver based on these known indices, machine learning algorithms have been widely used. In previous studies, machine learning algorithms were tested to classify the drowsy and alert states of drivers based on datasets containing behavioral measures [16], physiological measures [17,18], and more [19].
As mentioned above, the drowsiness level of a driver has a relationship with the driver’s behavioral features, physiological responses, and driving performance. Many methods for driver drowsiness detection utilizing these features have been proposed. However, the proposals of previous studies were limited in their ability to perform early detection of driver drowsiness, because the slightly drowsy state was not focused on and methods for optimal accuracy, such as data measured over a short period of time and hybrid measures (vehicle-based measures, behavioral measures, and physiological measures), were not utilized. In our research, we hypothesized that the early stages of driver drowsiness are accompanied by changes in driving performance, behavioral features, and physiological indices. This hypothesis was tested in our previous study [20]; we investigated the relationship between the drowsiness levels of driver, driving performance indices, behavioral indices, and physiological indices using a driving simulator (DS), driver monitoring system, and physiological measurement system. Additionally, to future validate the feasibility of the early detection of driver drowsiness, we attempted to distinguish between the alert state and slightly drowsy state of a driver with machine learning algorithms based on hybrid measures consisting of vehicle-based, behavioral, and physiological measures. General machine learning algorithms, namely logistic regression (LR), support vector machines (SVM), the k-nearest neighbor classifier (kNN), and random forest (RF), were used for classification in the previous study [20]. The LR is a widely used algorithm for classification. It is useful for solving linear classification problems and binary classification problems [21]. The SVM is also widely used for classification as a supervised learning method. It aims to maximize a value known as the margin, which is defined as the distance between the decision boundary and the closest training sample to the decision boundary. The SVM can efficiently perform not only linear classification, but also non-linear classification by utilizing a kernel trick [22]. The kNN is also commonly utilized method. It classifies the data samples based on a majority vote of their k-nearest neighbors [23]. In addition, decision tree (DT) classification is also widely used in data mining [24]. This makes a model that consists of a number of classification trees, which predict the value of a target variable based on several input variables. RF is an ensemble of the decision tree models. It has generalization properties and runs efficiently on large databases. Furthermore, it calculates the importance of features [25]. The results of the previous study showed that the RF algorithm can obtain approximately 80% accuracy when classifying the alert and slightly drowsy states. This demonstrated the feasibility of early detection of driver drowsiness; however, it was considered that improving the accuracy of drowsiness detection is necessary for its actual implementation into vehicles. In particular, the optimization of the machine learning algorithm and investigation of other algorithms was insufficient. Moreover, consideration for the difficulty of sensing each measure was also needed to facilitate the implementation of the algorithm. Therefore, in this paper we investigated the accuracy of drowsiness detection, along with the optimization of algorithms and utilization of ensemble machine learning. To discuss the implementation of the classification system, we also evaluated the performance of classification not only using full hybrid measures (vehicle-based, behavioral, and physiological measures) but also using hybrid measures without physiological measures, as these are considered more difficult to implement than other measures.

2. Materials and Methods

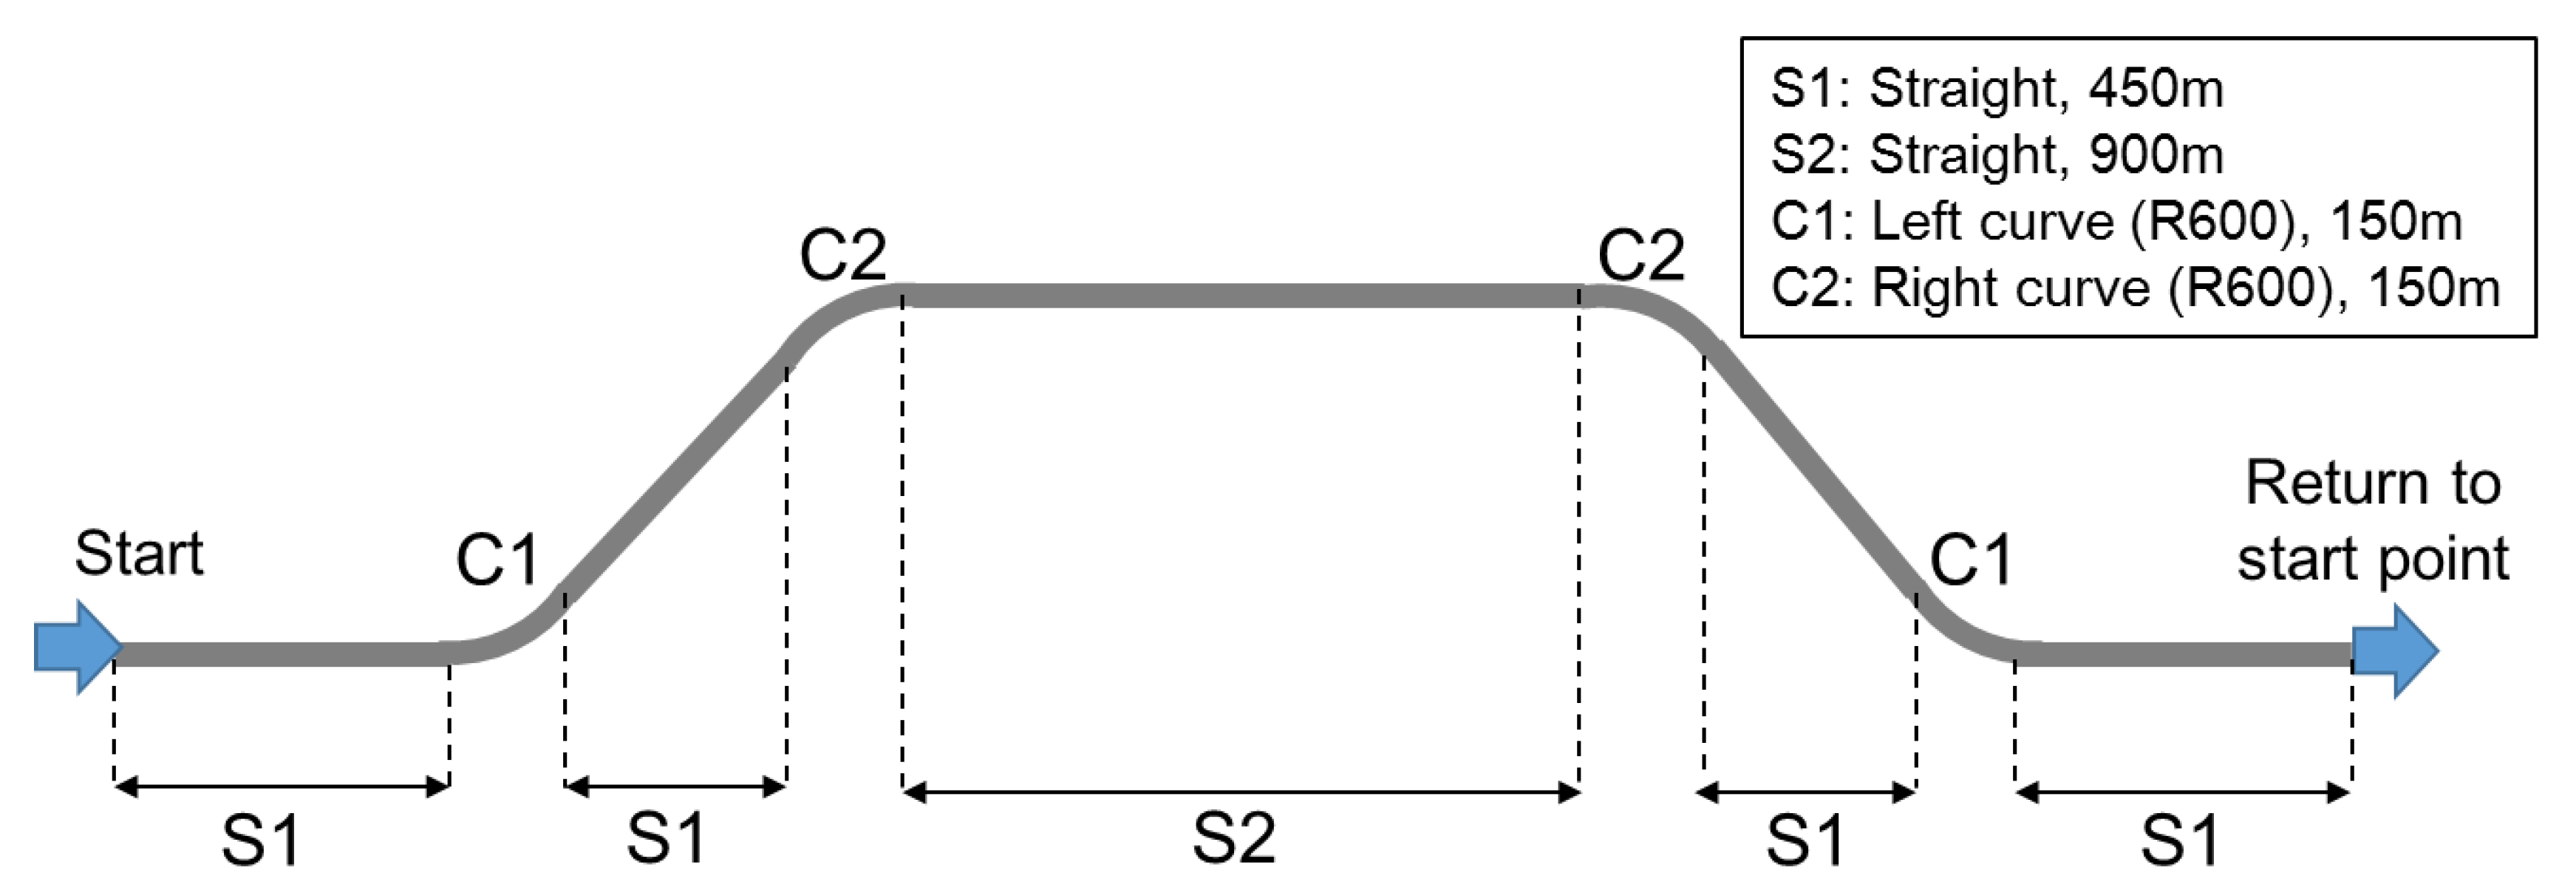
2.1. Participants and Driving Task

A total of sixteen males (ages of 24.2 ± 1.8 years, heights of 171.8 ± 8.3 cm, weights of 61.5 ± 8.4 kg, and right-handed) participated in our experiments. A driving simulator (DS) was used for the driving tasks. The DS consists of a steering wheel, pedals, and a display that presents the driving environment. A driving course was constructed using a virtual reality software package (UC-win/Road 6, Forum 8). To get the data of drowsy driving in the experiment, the driving course was configured to simulate driving on a monotonous highway for a long time. In addition, to evaluate the driving performance related to steering and acceleration, we set a task in which the participant follows a preceding car moving at approximately 100 km/h along the middle lane of a three-lane highway with a road width of 3.5 m containing straight and curved (R = 600 m with clothoid curve) sections. A section of the driving course is shown in Figure 1, and this section was infinitely repeated over the whole course. Participants were asked to drive the course for 30 min. Additionally, poles were installed every 50 m along the left side of the driving course and participants were also asked to maintain a distance of approximately 100 m from the preceding car by referencing the poles.

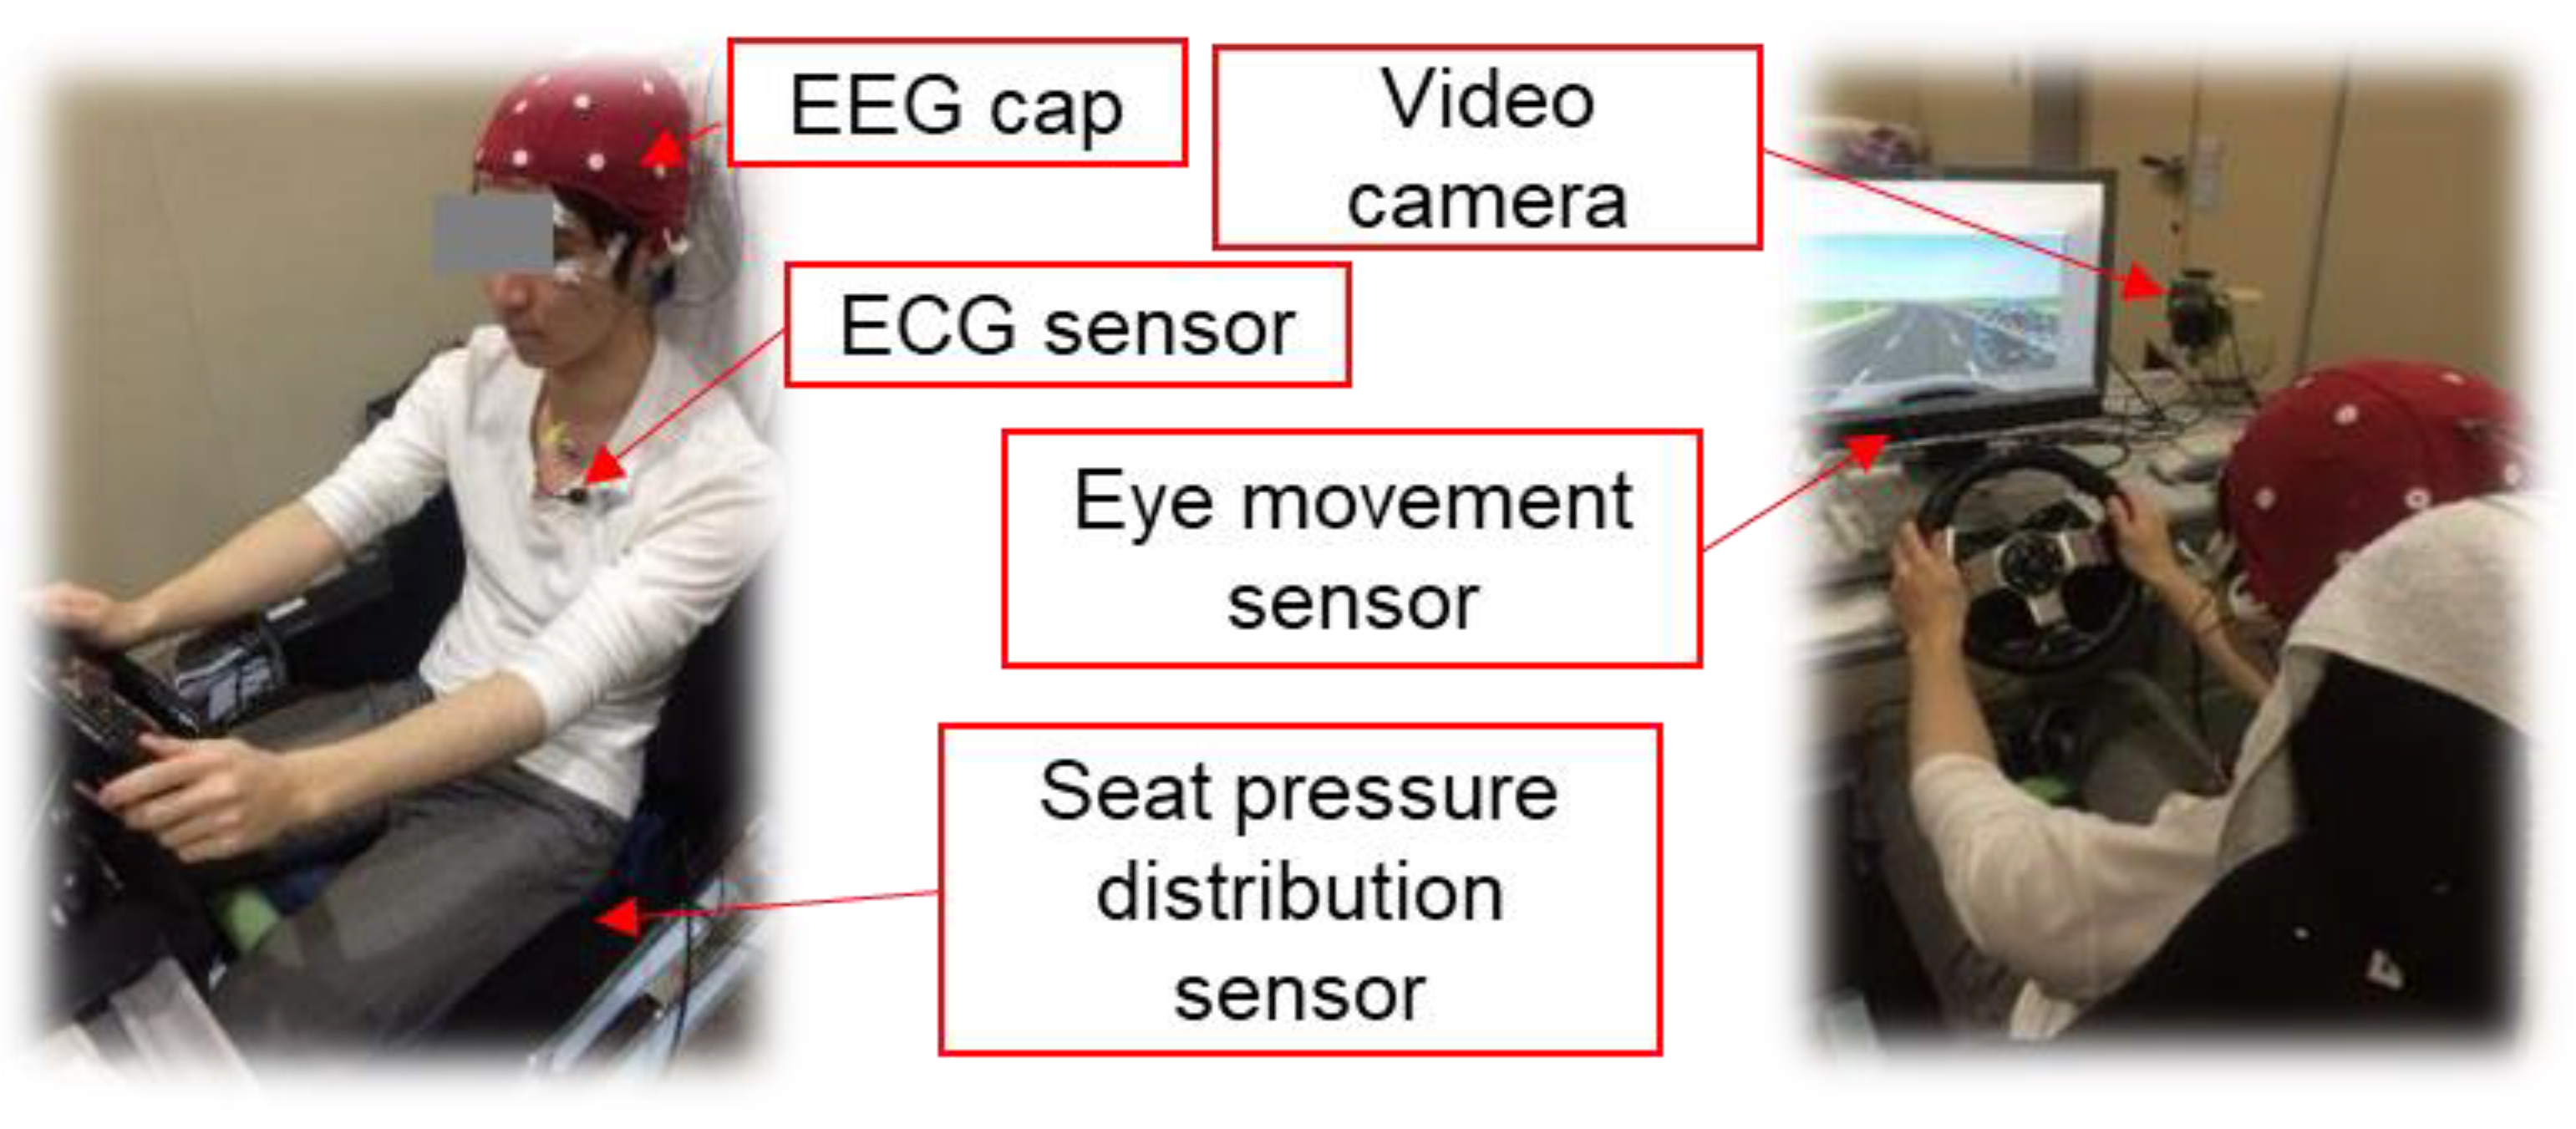
2.2. Measurements and Data Processing

2.2.1. Facial Expression

The video camera in front of driver was set to record parts of the participant’s face. The subjective evaluation of their drowsiness levels was then processed offline by two evaluators in intervals of 10 s in accordance with predetermined criteria. The evaluation of drowsiness levels based on the features of facial expressions has been defined in several different methods [2,3]. In this study, the scale for drowsiness levels was based on the Zilberg’s criteria [3], which uses whole integer numbers ranging from 0 (alert state) to 4 (extremely drowsy state). The details of the states, values and indicators in images are listed in Table 1.

2.2.2. Driving Performance

To assess driving performance related to longitudinal and lateral control, the following parameters were calculated from a 10-s segment of DS recording data at a sampling rate of 60 Hz. Vehicle velocity, longitudinal acceleration, offset from lane center (lateral position), steering wheel acceleration (SWA), standard deviation of lateral position (SDLP), time headway (THW), and time to lane crossing (TLC) were recorded. SWA, which is utilized as the evaluation index of steering smoothness [26], was calculated from steering angle data. SDLP, which is used as the evaluation index of steering control [27], was calculated from lateral position data. THW is defined as the difference between the time when the preceding vehicle arrives at a point on the road and the time when the test vehicle arrives at the same point. TLC is defined as the time required to reach the edge of the lane, assuming that the vehicle velocity and steering angle are constant at a certain point while driving on a road [28].

2.2.3. Behavioral Features

Visual behaviors were measured by an eye mark camera (Smart eye, Toyo Technica, Japan) with a sampling rate of 60.1 Hz. The number of eye blinks and the percentage closure of eyes (PERCLOS) over 10 s were calculated from the recorded data. The seat pressure distribution was measured by a pressure sensor (SR Softvision, Sumitomo Riko, Japan) with a sampling rate of 5 Hz. Movement of the centroid, the mean values of X (lateral direction of driver) and Y (longitudinal direction of driver), and the coordinates of the centroid during a 10-s interval were also calculated from the data. A positive x and y coordinate indicates the left and forward direction of the driver, respectively.

2.2.4. Physiological Signals

EEG

To investigate the activity of the central nervous system, signals were measured by an EEG measuring device (EEG-1200, Nihonkohden, Japan) at a sampling rate of 500 Hz. The EEG cap was positioned on the head of the participants, and the EEG signals of 16 channels based on international 10–20 systems (Fp1, Fp2, F3, F4, C3, C4, P3, P4, O1, O2, F7, F8, T3, T4, T5, and T6) were recorded. The raw signals were filtered by a band-pass filter with cutoff frequencies of 1–40 Hz. Artifacts such as electromyography, electrooculography and signal due to body movement and heartbeat were eliminated by filtering using a band-pass filter with cutoff frequencies of 1–40 Hz, and by utilizing a MATLAB program (EEGLAB toolbox) based on independent component analysis. The 10-s segments were then processed by the fast Fourier transform analysis with the Hanning window [29]. Finally, the power spectral density (PSD) and the content of each frequency band (delta wave (1–4 Hz), theta wave (4–8 Hz), alpha wave (8–13 Hz), and beta wave (13–30 Hz)) of 16 channels was calculated. In the previous study [20], we calculated the mean value of the content in each part of the brain (frontal lobe: Fp1, Fp2, F3, and F4, Parietal lobe: P3 and P4, Occipital lobe: O1, O2, and Temporal lobe: T3 and T4), and these integrated parameters for each part of the brain were included in the dataset (4 bands × 4 parts = 16 parameters); however, in this study, the parameters for each band of the 16 channels (4 bands × 16 channels = 64 parameters) were used instead.

ECG

To investigate the activity of the autonomic nervous system, ECG signals were measured by an ECG measuring device (WEB-7000, Nihonkohden, Japan) at a sampling rate of 1000 Hz. Electrodes were attached to the bodies of participants with precordial leads. The peaks of R-waves were detected, and the R-R interval (RRI—the time interval of two successive peaks of R-wave) was calculated from the raw signals by utilizing a MATLAB program (Signal processing toolbox). The 10-s segments of RRI data were utilized to calculate mean RRI values and coefficients of variation of RRI (CVRR). Additionally, the RRI data were processed by the fast Fourier transform analysis with the Hanning window. The PSD of each frequency band was also calculated: low frequency (LF)—0.04–0.15 Hz and high frequency (HF)—0.15–0.45 Hz.

2.3. Experimental Protocol

The experiment was conducted with approval of the ethics committee of the University of Tokyo (named the Office for Life Science Research Ethics and Safety). The experimental procedures were sufficiently explained to the participants, and the participants gave written informed consent prior to the experiment. To stabilize their physiological states, participants were asked to be seated in a waiting room where the indoor temperature was set as 26 °C, which is a temperature known to be thermally neutral [30], for 30 min. The sensors for measuring EEG and ECG signals were then attached to the participants. Pre-driving was conducted for approximately five minutes prior to the main driving session to accustom participants to the operation of the DS. The main driving session was then performed for 30 min. A view of the experimental scene is shown in Figure 2.

2.4. Data Analysis

2.4.1. Data Processing

A diagram of the data processing is shown in Figure 3. Preprocessing of the raw data, such as filtering and artifact elimination, was conducted. The preprocessed data was segmented into 10-s sections to investigate the feasibility of detecting driver drowsiness over a short timeframe using hybrid measures. The values of drowsiness levels based on subjective evaluation of 80 features were extracted from the recorded video and measured data. The details of the extracted features are listed in Table 2.

2.4.2. Classification of the Drowsy State Using Machine Learning Algorithms

To distinguish the drowsy state with high accuracy, two ensemble machine learning algorithms were adopted in this study. The first algorithm is a majority voting classifier using LR, SVM, and kNN. The second algorithm is an RF algorithm. A majority voting classifier (MVC) is an example of a general ensemble algorithm. It is an algorithm that reflects the result of a majority vote based on the results of three or more classifications. RF is an ensemble of decision tree models. An RF algorithm can calculate the importance of features and run efficiently on large databases. In addition, the classification using a decision tree algorithm was performed to compare with these two ensemble machine learning algorithms. The datasets that were used for the above algorithms consisted of target data and predictor data. The target data consisted of the drowsiness levels categorized as a whole number from 0 (alert state) to 4 (extremely drowsy state) based on facial expression, as listed in Table 1. The predictor data consisted of all the extracted features identified by hybrid measures and listed in Table 2. To select the proper features that facilitate high-performance classification, sequential backward selection was performed for the MVC (LR, SVM, and kNN) algorithms. Lasso method [31] was used for performing regularization. For the RF algorithm, the numbers of features and estimators that were used for classification were optimized to improve the classification performance. To validate the classification performance indices, k-fold cross-validation was performed with k set to 5. As shown in Figure 4, the dataset was randomly partitioned into five equally sized subsets. Among the subsets, a single subset was used as the validation data for testing the model, and the remaining four subsets were used as training data. After that, the cross-validation process was repeated five times, with each of the five subsets used once as the validation data. The average of the five results were calculated as an evaluation index (e).
Finally, the performance of the algorithms was evaluated. In detail, the performance values of the two classifiers were calculated using detection accuracy (Acc.), precision (Pre.), recall (Rec.) and F1, which were defined in the following formulas (1)–(4).
A c c . = T P + T N F P + F N + T P + T N
P r e . = T P F P + T P
  R e c . = T P F N + T P
  F 1 = 2 × P r e . × R e c . P r e . + R e c .
(TP, TN, FP, and FN in the above formulas (1–4) indicate true positives, true negatives, false positives, and false negatives, respectively.)
In addition, to discuss the priority order of the features, feature importance was calculated by utilizing a machine learning library of Python program (Scikit-learn library) in the case of RF. The importance of a feature is calculated as the total reduction in the mean decrease in impurity (Gini importance index [25]) brought by that feature.
In order to consider the implementation of this data into a driving detection system, we investigated how using physiological measures affects the performance of the system. This entailed an investigation of the performance of the classification not only when all of the hybrid measures (a total of 80 features, as listed in Table 2) were used, but also when hybrid measures without physiological measures (12 features excluding features based on EEG and ECG measures) were used.

3. Results

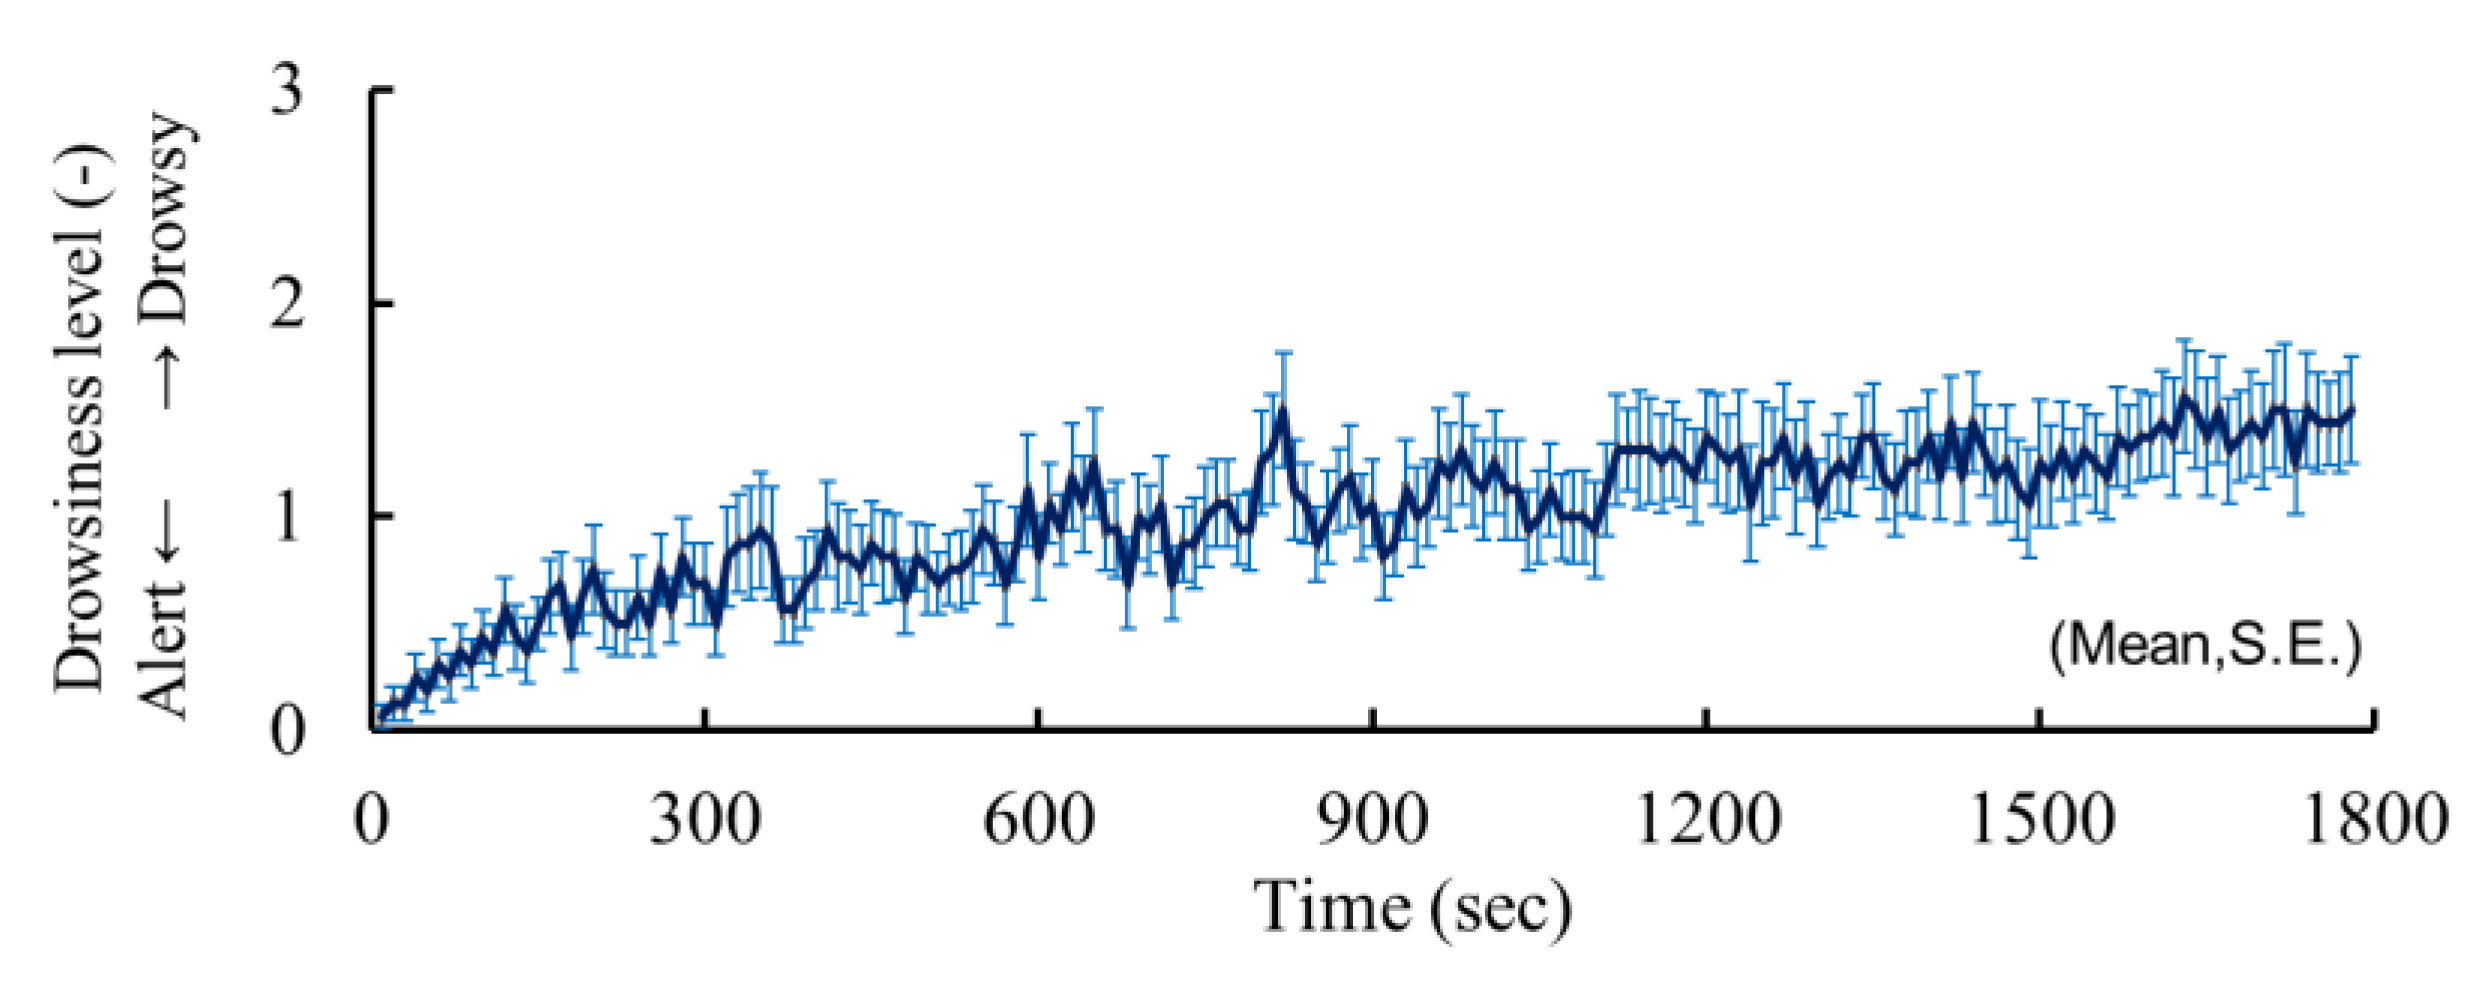
3.1. Changes in Drowsiness Level and the Constitution of the Dataset

The changes in drowsiness level were investigated to confirm the validation of our experimental setting. The trends of the changes in drowsiness levels of 16 participants were illustrated as a line graph and error bar using mean and standard error of the mean (SEM) as shown in Figure 5. The drowsiness level of drivers increased over time in this experiment; thus, it was confirmed that the experimental setting was effective to increase the drowsiness level of participants. A dataset containing a total of 2847 rows was obtained from 30 min of driving by 16 participants after removing rows with missing values due to bad conditions of measurement. The dataset consists of 986, 1038, 654, 149 and 20 rows with drowsiness values of 0 (alert state), 1 (slightly drowsy state), 2 (moderately drowsy state), 3 (significantly drowsy state) and 4 (extremely drowsy state), respectively. The dataset of 2024 rows (alert vs. slightly drowsy) and 1789 rows (alert vs. moderately drowsy or more) was used for the k-fold cross-validation in which k was set to 5.

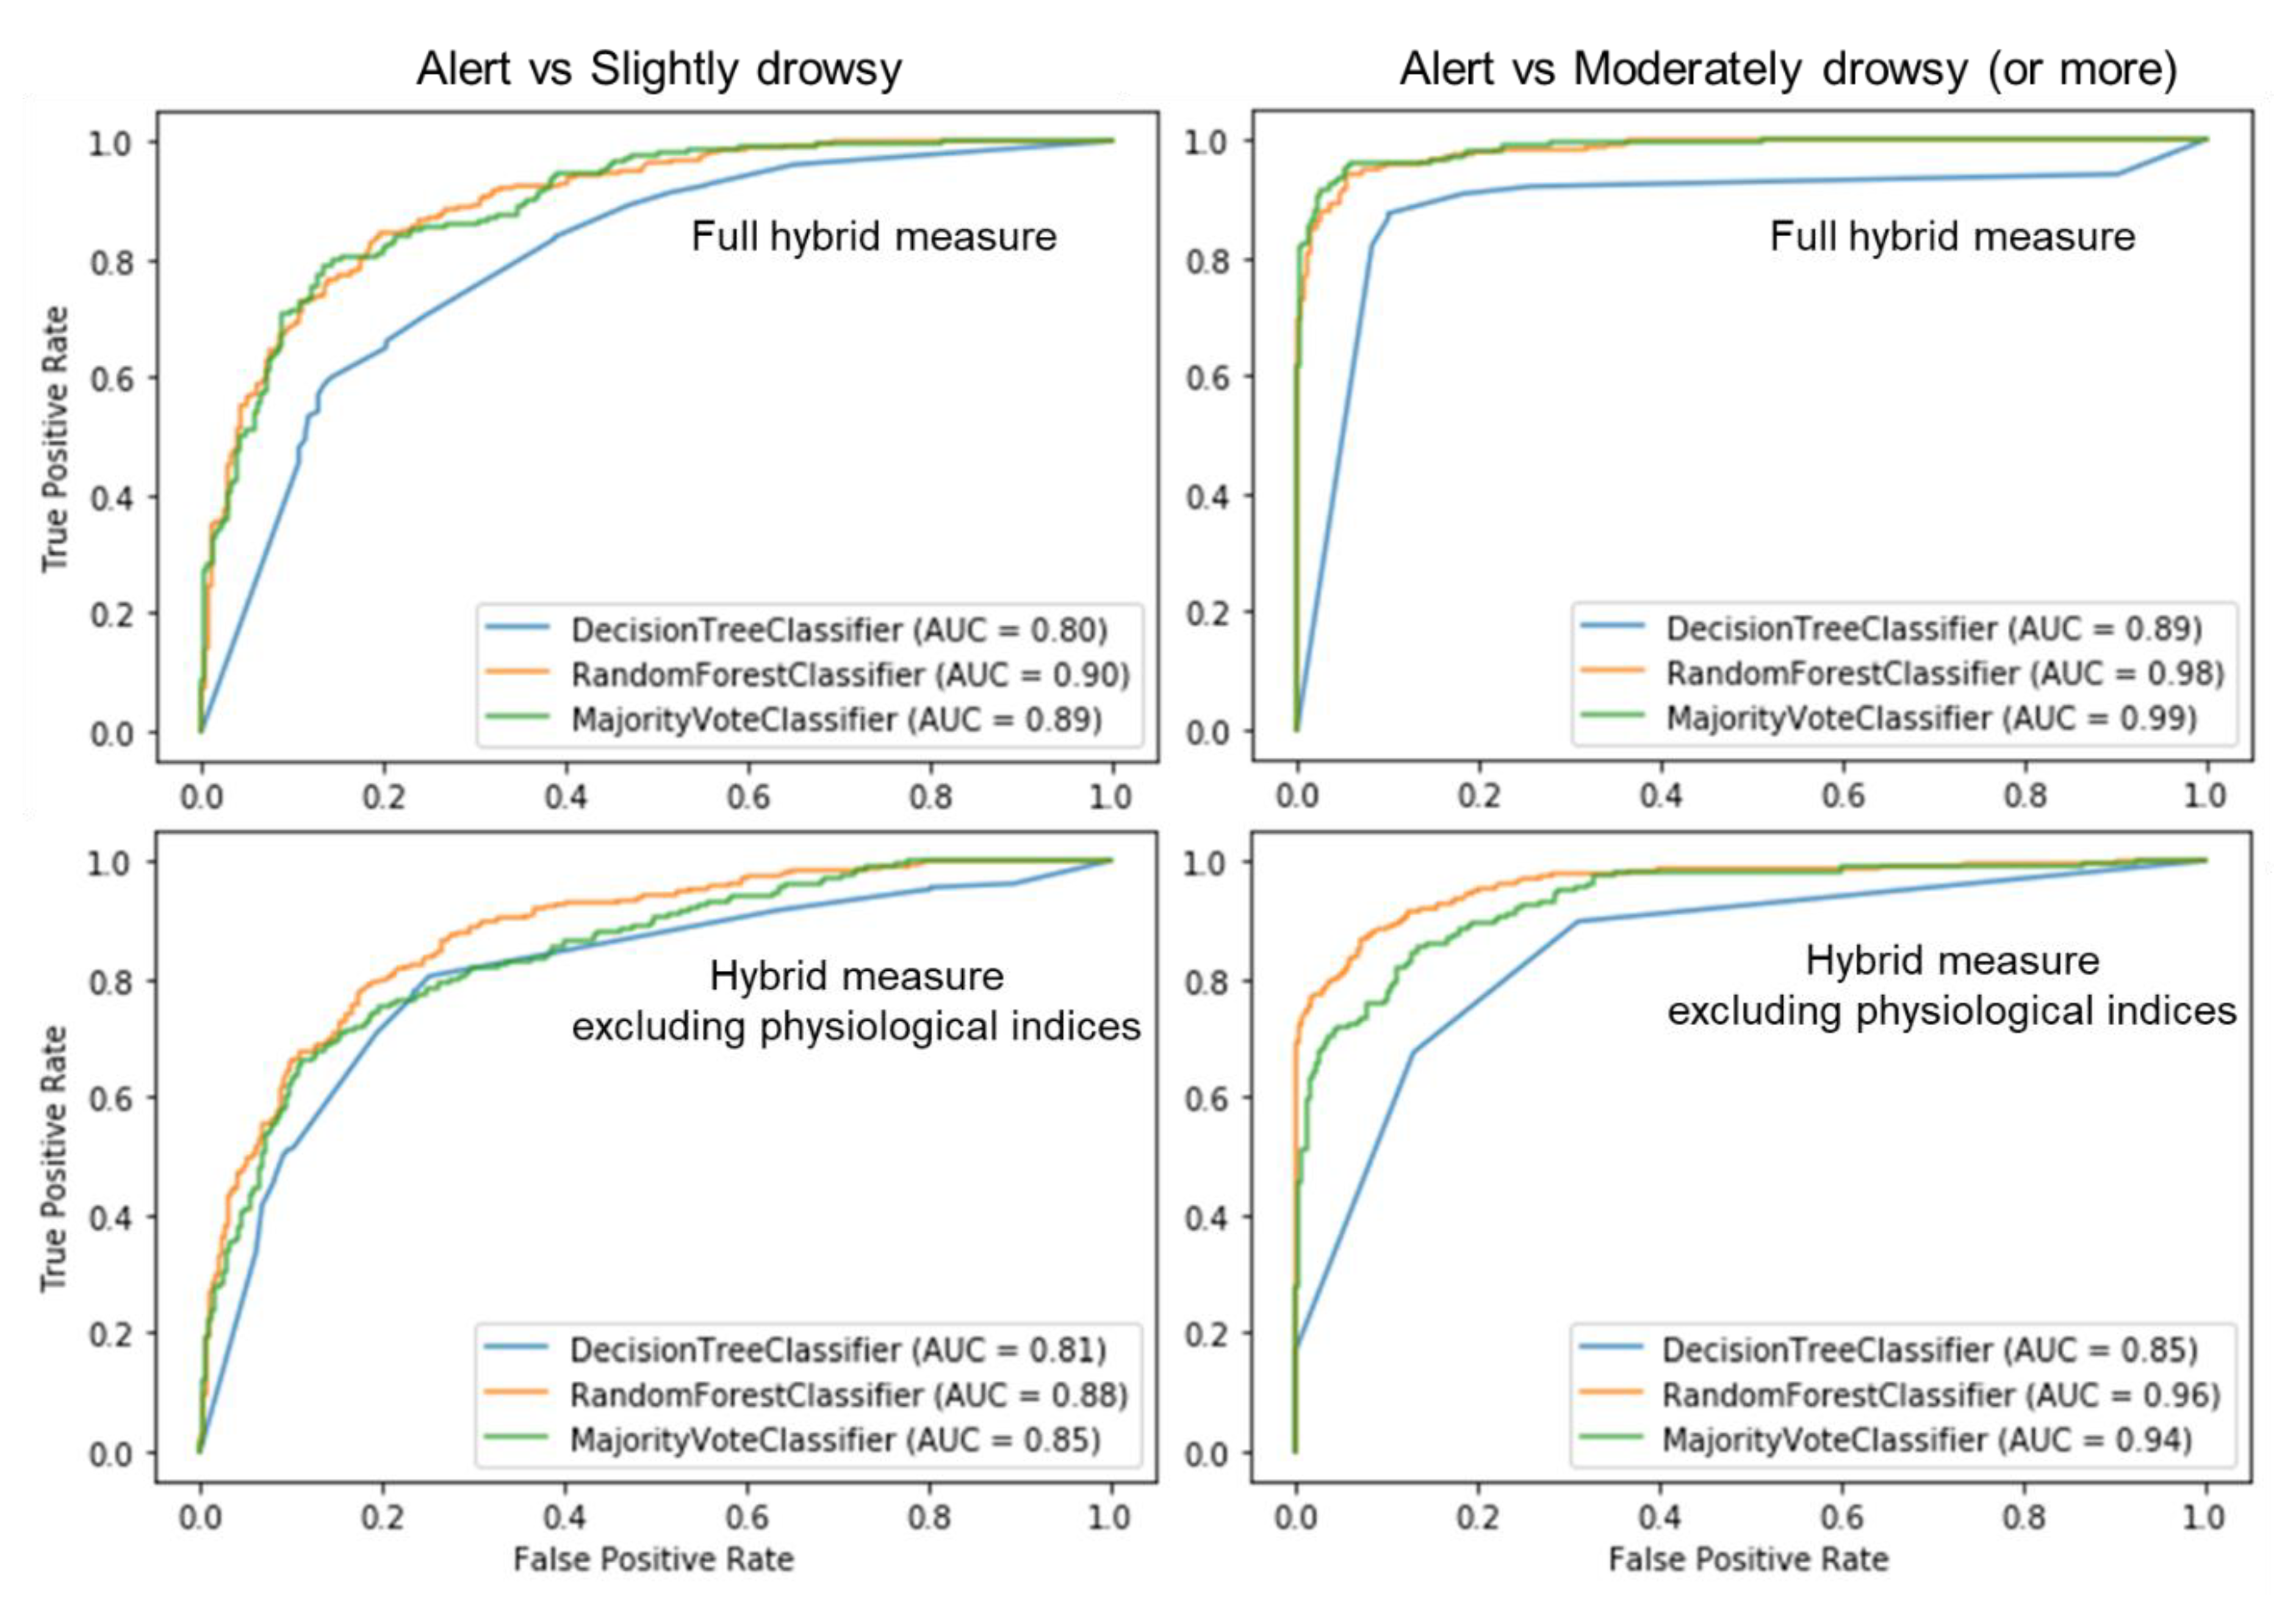
3.2. Performance of Drowsy State Classification Using Ensemble Machine Learning Algorithms

The performance values of the classification of alert and drowsy state (alert vs. slightly drowsy, alert vs. moderately drowsy or more) in the case of using full hybrid measures are listed in Table 3. Two ensemble algorithms (MVC, RF) achieved higher values of all performance compared to the DT algorithm. The RF algorithm achieved especially higher values of detection accuracy, precision, and F1 compared to the MVC algorithm when classifying the alert and the slightly drowsy state; its detection accuracy was 82.4%. The MVC algorithm achieved higher values of detection accuracy, precision, and F1 compared to the RF algorithm when classifying the alert and the moderately (or more than moderately) drowsy states; its detection accuracy was 95.4%.
The algorithms’ performance values in the case of excluding physiological indices are listed in Table 4. The RF algorithm achieved higher values of detection accuracy, precision, recall and F1 compared to the MVC algorithm in all cases. The RF algorithm achieved values of 78.7% and 89.8% detection accuracy in the case of classifying the alert vs. slightly drowsy, and the alert vs. moderately drowsy states, respectively. When physiological measures were excluded, detection accuracy decreased by 3.7%~9.0% compared to the case in which all measures were used.
The curves of receiver operating characteristic (ROC) and the value of the area under curve (AUC) for each condition are shown in Figure 6. The ROC curve is created by plotting the true positive rate against the false positive rate at various threshold settings [32]. The ROC of two ensemble algorithms (RF, MVC) show points in the upper-left corner compared to that of the DT algorithm in all cases. In addition, the ROC of the RF algorithm show points in the upper-left corner compared to that of the MVC algorithm in the case of excluding the physiological indices.
The details of the selected features and the priority of the features used by the RF algorithms are listed in Table 5. When full hybrid measures were used, as shown in Table 5, PERCLOS was selected as the most important feature. RRI and THW was then selected as the second and the third important feature, respectively. On the other hand, when physiological indices were excluded, PERCLOS was still selected as the most important feature (Table 5). The y and x coordinate of the centroid was then selected as the second and the third important feature, respectively.

4. Discussion

In this study, we investigated the accuracy of drowsiness detection with the optimization of algorithms and utilization of ensemble machine learning to improve classification of the alert and drowsy states of drivers. We focused on early state detection by performing detection of the slightly drowsy state based on ensemble machine learning algorithms and hybrid measures applied to datasets containing 10-s segments of data.
In the DS experiment, we validated that driver drowsiness level would increase in the scenario of driving on a monotonous highway.
The RF algorithm was the best classifier in this study; it achieved 82.4% accuracy when classifying the alert and the slightly drowsy state. The accuracy rates of the RF algorithm were slightly improved compared with our previous results; this improvement is attributed to the optimization of the number of features and estimators [20]. The accuracy rates of the RF algorithm were higher than that of the MVC algorithm, excluding the conditions of full hybrid measures and alert vs. moderately drowsy. PERCLOS and RRI, indices based on behavioral and physiological measures, were selected as the most important features when using the RF algorithm. Features from EEG measures were also selected as an important feature, as listed in Table 5. This suggests that the behavioral and physiological response was more directly affected by changes in the drowsiness level of driver in the early stage than driving performance. This demonstrates the validity of behavioral and physiological measures for early detection of driver drowsiness. In their previous study, Awais et al. [12] showed that 80.9% detection accuracy can be achieved using hybrid features consisting of EEG- and ECG-based data when classifying the alert and drowsy state, but not the slightly drowsy state. Li and Chung [33] showed that 96.2% detection accuracy can be achieved using hybrid features consisting of EEG and head-movement. However, head-movement did not occur in the slightly drowsy state based on Zilberg’s criteria (it could occur in the significantly drowsy state based on the same criteria). In the present study, as shown in Figure 7, up to 78.7% detection accuracy was obtained by utilizing the hybrid measures excluding physiological indices in the case of classifying the alert and the slightly drowsy states. Previous studies focused on EEG-based data that require direct contact with the driver for measurement. It was generally agreed that the implementation of a direct-contact physiological measurement system in the vehicle was more difficult than other measurement systems using non-contact sensors. Although the performance values in past studies were low for the experiments that did not use contact sensors compared to the ones that performed classification using full hybrid measures with contact sensors, this study demonstrates the feasibility of early detection of driver drowsiness using non-contact sensors.
In the case of classifying the alert and moderately (or more than moderately) drowsy states, the accuracy rate was approximately 10% higher than that in the case of classifying the alert and the slightly drowsy. Detection accuracy of 89.8% was obtained by utilizing the hybrid measures excluding physiological indices, as shown in Figure 7. This indicates that a system could be implemented to improve driver safety without disturbing comfort by installing an alarm system that operates separately in cases of the driver being in a slightly drowsy or moderately drowsy state.
There were several limitations in the present study. The number of participants was insufficient, and all participants in the experiment were males in their 20s. Previous studies showed that the participant’s age and gender affects driving behavior [34,35]; therefore, further studies to increase the number of participants, and to clarify the effects of age and gender on driving performance during drowsy driving, should be conducted in order to further improve the reliability of the classification algorithm. Furthermore, vibration, changes in gravity, sound, etc., in an experiment using a driving simulator are different from real vehicle driving. Since these factors directly affect the indices of physiological measures such as seat pressure, further investigation is needed to improve the applicability of the classification algorithm and accomplish the detection of drowsy drivers in real vehicle driving. As for analysis of drowsiness level based on facial expression, our method based on Zilberg’s criteria [3] has a limitation caused by the subjective evaluation of drowsiness level. To improve the objectivity of the evaluation of the drowsiness level, further investigation that applies the selection method of the drowsiness level such as the Fuzzy Analytic Hierarchy Process [36] is required. In addition, to improve the performance, further investigations of machine methods are needed, and these points are our future works.

5. Conclusions

Focused on the early detection of driver drowsiness, we attempted to classify alert and slightly drowsy states with machine learning algorithms based on hybrid measures of driving performance, behavioral features, and physiological indices. A dataset containing 10-s segments of data was created from the hybrid measures recorded during a DS experiment. The classification of alert and slightly drowsy states was performed with several machine learning algorithms. The results show that the RF algorithm can obtain 78.7% accuracy when classifying alert vs. slightly drowsy states utilizing hybrid measures and excluding physiological measures. These results demonstrate the feasibility of early detection of a driver’s slightly drowsy state with high accuracy based on hybrid measures using non-contact sensors. In future work, we will further improve the reliability and applicability of the drowsiness detection system through real driving experiments.

Author Contributions

conceptualization, methodology, J.G., A.H. and M.S.; software, J.G.; validation, J.G.; formal analysis, J.G.; investigation, J.G., A.H. and M.S.; resources, J.G., A.H. and M.S.; data curation, J.G.; writing—original draft preparation, J.G.; writing—review and editing, J.G., A.H. and M.S.; visualization, J.G.; supervision, A.H. and M.S.; project administration, A.H. and M.S.; funding acquisition, A.H. and M.S. All authors have read and agreed to the published version of the manuscript.

Funding

This research is supported by Nissan Motor, Co., Ltd.

Conflicts of Interest

The authors declare no conflict of interest.

References

  1. Metropolitan Police Department of Japan. The occurrence Situation of Traffic Accidents during the Year of 2017. 2018, pp. 19–20. (In Japanese). Available online: https://www.npa.go.jp/publications/statistics/koutsuu/H29zennjiko.pdf (accessed on 1 March 2020).
  2. Kitajima, H.; Numata, N.; Yamamoto, K.; Goi, Y. Prediction of automobile driver sleepiness. Trans. Jpn. Soc. Mech. Eng. C 1997, 63, 99–100. [Google Scholar]
  3. Zilberg, E.; Xu, Z.M.; Burton, D.; Karrar, M.; Lal, S. Methodology and initial analysis results for development of non-invasive and hybrid driver drowsiness detection systems. In Proceedings of the IEEE International Conference on Wireless Broadband and Ultra-Wideband Communications, Sydney, NSW, Australia, 27–30 August 2007; p. 16. [Google Scholar]
  4. Subasi, A. Automatic recognition of alertness from EEG by using neural networks and wavelet coefficients. Expert Syst. Appl. 2005, 28, 701–711. [Google Scholar] [CrossRef]
  5. Ji, Q.; Zhu, Z.; Lan, P. Real-time nonintrusive monitoring and prediction of driver fatigue. IEEE Trans. Veh. Technol. 2004, 53, 1052–1068. [Google Scholar] [CrossRef] [Green Version]
  6. Popieul, J.C.; Simon, P.; Loslever, P. Using driver’s head movements evolution as a drowsiness indicator. In Proceedings of the IEEE Proceeding on Intelligent Vehicle Symposium, Columbus, OH, USA, 9–11 June 2003; pp. 616–621. [Google Scholar]
  7. Pritchett, S.; Zilberg, E.; Xu, Z.M.; Karrar, M.; Burton, D.; Lal, S. Comparing accuracy of two algorithms for detecting driver drowsiness–Single source (EEG) and hybrid (EEG and body movement). In Proceedings of the 6th International Conference on Broadband and Biomedical Communications (IB2Com), Melbourne, VIC, Australia, 21–24 November 2011; pp. 179–184. [Google Scholar]
  8. Papadelis, C.; Chen, Z.; Kourtidou-Papadeli, C.; Bamidis, P.D.; Chouvarda, I.; Bekiari, E. Monitoring sleepiness with on-board electrophysiological recordings for preventing sleep deprived traffic accidents. Clin. Neurophysiol. 2007, 9, 1906–1922. [Google Scholar] [CrossRef]
  9. Fu, C.L.; Li, W.K.; Chun, H.C.; Tung, P.S.; Chin, T.L. Generalized EEG-based drowsiness prediction system by using a self-organizing neural fuzzy system. IEEE Transection Circuits Syst. 2012, 59, 2044–2055. [Google Scholar]
  10. Chin, T.L.; Che, J.C.; Bor, S.L.; Shao, H.H.; Chih, F.C.; Wang, I.J. A real–time wireless brain-computer interface system for drowsiness detection. IEEE Transection Biomed. Circuits Syst. 2010, 4, 214–222. [Google Scholar]
  11. Patel, M.; Lal, S.K.L.; Kavanagh, D.; Rossiter, P. Applying neural network analysis on heart rate variability data to assess driver fatigue. Expert Syst. Appl. 2011, 38, 7235–7242. [Google Scholar] [CrossRef]
  12. Awais, M.; Badruddin, N.; Drieberg, M. A Hybrid approach to detect driver drowsiness utilizing physiological signals to improve system performance and wearability. Sensors 2017, 17, 1991. [Google Scholar] [CrossRef] [Green Version]
  13. Otmani, S.; Pebayle, T.; Roge, J.; Muzet, A. Effect of driving duration and partial sleep deprivation on subsequent alertness and performance of car drivers. Physiol. Behav. 2005, 84, 715–724. [Google Scholar] [CrossRef]
  14. Ingre, M.; Akerstedt, T.; Peters, B.; Anund, A.; Kecklund, G. Subjective sleepiness, simulated driving performance and blink duration: Examining individual differences. J. Sleep Res. 2006, 15, 47–53. [Google Scholar] [CrossRef]
  15. Zhang, H.; Wua, C.; Yan, X.; Qiu, T.Z. The effect of fatigue driving on car following behavior. Transp. Res. Part F 2016, 43, 80–89. [Google Scholar] [CrossRef]
  16. Flores, M.; Armingol, J.; de la Escalera, A. Driver drowsiness warning system using visual information for both diurnal and nocturnal illumination conditions. EURASIP J. Adv. Signal Process. 2010, 2010, 438205. [Google Scholar] [CrossRef] [Green Version]
  17. Khushaba, R.N.; Kodagoda, S.; Lal, S.; Dissanayake, G. Driver drowsiness classification using fuzzy wavelet-packet-based feature-extraction algorithm. IEEE Transactions Biomed. Eng. 2010, 58, 121–131. [Google Scholar] [CrossRef] [PubMed] [Green Version]
  18. Correa, A.G.; Orosco, L.; Laciar, E. Automatic detection of drowsiness in EEG records based on multimodal analysis. Med Eng. Phys. 2014, 36, 244–249. [Google Scholar] [CrossRef] [PubMed]
  19. Cheng, B.; Zhang, W.; Lin, Y.; Feng, R.; Zhang, X. Driver drowsiness detection based on multisource information. Hum. Factors Ergon. Manuf. Serv. Ind. 2012, 22, 450–467. [Google Scholar] [CrossRef]
  20. Gwak, J.S.; Shino, M.; Hirao, A. Early detection of driver drowsiness utilizing machine learning based on physiological signals, behavioral measures, and driving performance. In Proceedings of the IEEE International Conference on Intelligent Transportation Systems, Maui, Hawaii, HI, USA, 4–7 November 2018; pp. 1794–1800. [Google Scholar]
  21. Hsieh, F.Y.; Bloch, D.A.; Larsen, M.D. A simple method of sample size calculation for linear and logistic regression. Stat. Med. 1998, 17, 1623–1634. [Google Scholar] [CrossRef] [Green Version]
  22. Garrett, D.; Peterson, D.A.; Anderson, C.W.; Thaut, M.H. Comparison of linear, nonlinear, and feature selection methods for EEG signal classification. IEEE Trans. Neural Syst. Rehabil. Eng. 2003, 11, 141–144. [Google Scholar] [CrossRef]
  23. Soucy, P.; Mineau, G.W. A simple KNN algorithm for text categorization. In Proceedings of the IEEE International Conference on Data Mining, San Jose, CA, USA, 29 November–2 December 2001; pp. 647–648. [Google Scholar]
  24. Brijain, R.P.; Kushik, K.R. A survey on decision tree algorithm for classification. Int. J. Eng. Dev. Res. 2014, 2, 1–5. [Google Scholar]
  25. Breiman, L. Random forests. Mach. Learn. 2001, 45, 5–32. [Google Scholar] [CrossRef] [Green Version]
  26. Cloete, S.R.; Wallis, G. Visuomotor control of steering: The artefact of the matter. Exp. Brain Res. 2011, 208, 475–489. [Google Scholar] [CrossRef] [PubMed]
  27. Loon, R.J.; Brouwer, R.F.T.; Martens, M.H. Drowsy drivers’ under-performance in lateral control: How much is too much? Using an integrated measure of lateral control to quantify safe lateral driving. Accid. Anal. Prev. 2015, 84, 134–143. [Google Scholar] [CrossRef] [PubMed]
  28. Godthelp, H.; Milgram, P.; Blaauw, G.J. The development of a time related measure to describe driving strategy. Hum. Factors 1984, 26, 257–268. [Google Scholar] [CrossRef]
  29. Michel, C.M.; Lehmann, D.; Henggeler, B.; Brandeis, D. Localization of the sources of EEG delta, theta, alpha and beta frequency bands using the FFT dipole approximation. Electroencephalogr Clin. Neurophysiol. 1992, 82, 38–44. [Google Scholar] [CrossRef]
  30. International Organization for Standardization. ISO7730: Ergonomics of the Thermal Environment–Analytical Determination and Interpretation of Thermal Comfort Using Calculation of the PMV and PPD Indices and Local Thermal Comfort Criteria; International Organization for Standardization: Geneva, Switzerland, 2005. [Google Scholar]
  31. Ogutu, J.O.; Schulz-Streeck, T.; Piepho, H. Genomic selection using regularized linear regression models: Ridge regression, lasso, elastic net and their extensions. BMC Proc. 2012, 6, S10. [Google Scholar] [CrossRef] [Green Version]
  32. Hamdia, K.M.; Ghasemi, H.; Bazi, Y.; AlHichri, H.; Alajlan, N.; Rabczuk, T. A novel deep learning based method for the computational material design of flexoelectric nanostructures with topology optimization. Finite Elem. Anal. Des. 2019, 165, 21–30. [Google Scholar] [CrossRef]
  33. Li, G.; Chung, W.Y. A Context-Aware EEG Headset System for Early Detection of Driver Drowsiness. Sensors 2015, 15, 20873–20893. [Google Scholar] [CrossRef]
  34. Rhodes, N.; Pivik, K. Age and gender differences in risky driving: The roles of positive affect and risk perception. J. Accid. Anal. Prev. 2011, 43, 923–931. [Google Scholar] [CrossRef]
  35. Yan, X.; Radwan, E.; Guo, D. Effects of major-road vehicle speed and driver age and gender on left-turn gap acceptance. J. Accid. Anal. Prev. 2007, 39, 843–852. [Google Scholar] [CrossRef]
  36. Hamdia, K.M.; Arafa, M.; Alqedra, M. Structural damage assessment criteria for reinforced concrete buildings by using a Fuzzy Analytic Hierarchy process. Undergr. Space 2018, 3, 243–249. [Google Scholar] [CrossRef]
Figure 1. A section of the driving course [20].
Applsci 10 02890 g001
Figure 2. A view of the experimental scene.
Applsci 10 02890 g002
Figure 3. Procedure of data processing [20].
Applsci 10 02890 g003
Figure 4. The k-Fold cross-Validation.
Applsci 10 02890 g004
Figure 5. Changes in the mean of the drowsiness level, N = 16, Error bars represent SEM [20].
Applsci 10 02890 g005
Figure 6. Receiver operating characteristic curves of the classification.
Applsci 10 02890 g006
Figure 7. Classification accuracy of driver drowsiness in present study (with RF algorithm) and previous studies [12,33].
Applsci 10 02890 g007
Table 1. Drowsiness level based on facial expression [3].
State (Value)Indicators in Images
Alert (0)Fast eye blinks, often reasonably regular; apparent focus on driving with occasional fast sideways glances; normal facial tone.
Slightly Drowsy (1)Increase in duration of eye blinks and possible increase in the rate of eye blinks; increase in duration and frequency of sideways glances; appearance of “glazed-eye” look, occasional yawning.
Moderately Drowsy (2)Occasional disruption of eye focus; significant increase in eye blink duration; disappearance of eye blink patterns observed during the alert state; reduction in the degree of eye opening; occasional disappearance of facial tone.
Significantly Drowsy (3)Discernible episodes of almost complete eye closure; eyes are never fully open; significant disruption of eye focus.
Extremely Drowsy (4)Significant increase in frequency of eye closure episodes; longer duration of episodes.
Table 2. Details of extracted features.
MeasurementDetailsExtracted Feature
Physiological MeasuresElectroencephalogram (EEG)Delta, theta, alpha, and beta wave content of 16 channels
(Fp1, Fp2, F3, F4, C3, C4, P3, P4, O1, O2, F7, F8, T3, T4, T5, and T6)
Electrocardiogram
(ECG)
Mean of R-R interval (RRI)
Coefficient of variation R-R interval (CVRR)
Low frequency per high frequency (LF/HF)
High frequency (HF) content
Behavioral MeasuresVisual BehaviorThe number of eye blinks
Percentage of eye closure (PERCLOS)
Seat PressureDistance of centroid movement
X coordinate of the centroid
Y coordinate of the centroid
Vehicle based MeasuresDS ParameterVehicle velocity
Longitudinal acceleration
Offset from lane center (Lateral position)
Steering wheel acceleration (SWA)
Standard deviation of lateral position (SDLP)
Time headway (THW)
Time to lane crossing (TLC)
Table 3. Classification results in the case of using full hybrid measures.
ClassifiersCases (Alert State vs.)Performance of Classification
Acc. (%)Pre. (%)Rec. (%)F1 (%)
DTSlightly Drowsy73.577.367.671.9
Moderately Drowsy (or more)90.490.488.389.3
MVCSlightly Drowsy82.084.578.681.4
Moderately Drowsy (or more)95.497.192.994.9
RFSlightly Drowsy82.481.684.182.8
Moderately Drowsy (or more)93.793.093.593.2
Table 4. Classification results in the case of excluding physiological indices.
ClassifiersCases (Alert State vs.)Performance of Classification
Acc. (%)Pre. (%)Rec. (%)F1
DTSlightly Drowsy72.275.667.871.4
Moderately Drowsy (or more)83.682.981.782.2
MVCSlightly Drowsy75.377.772.575.0
Moderately Drowsy (or more)85.185.382.283.7
RFSlightly Drowsy78.779.978.078.9
Moderately Drowsy (or more)89.888.789.589.1
Table 5. Priority of features in the case of using random forest algorithm (Top 10).
Priority OrderSelected Feature in Case of Using Full Hybrid MeasuresSelected Feature in Case of Excluding Physiological Indices
1PERCLOSPERCLOS
2RRIY coordinate of the centroid
3THWX coordinate of the centroid
4X coordinate of the centroidTHW
5Y coordinate of the centroidDistance of centroid movement
6The number of eye blinksThe number of eye blinks
7Beta wave content of F3Offset from lane center
8Beta wave content of Fp2Vehicle velocity
9HF contentSDLP
10Beta wave content of Fp1SWA

