Code Visualization for Performance Improvement of Java Code for Controlling Smart Traffic System in the Smart City


Abstract
1. Introduction
2. Materials and Methods
2.1. Software Complexity
2.2. Tools for Software Performance Analysis
2.3. Related Studies of Smart City’s Software
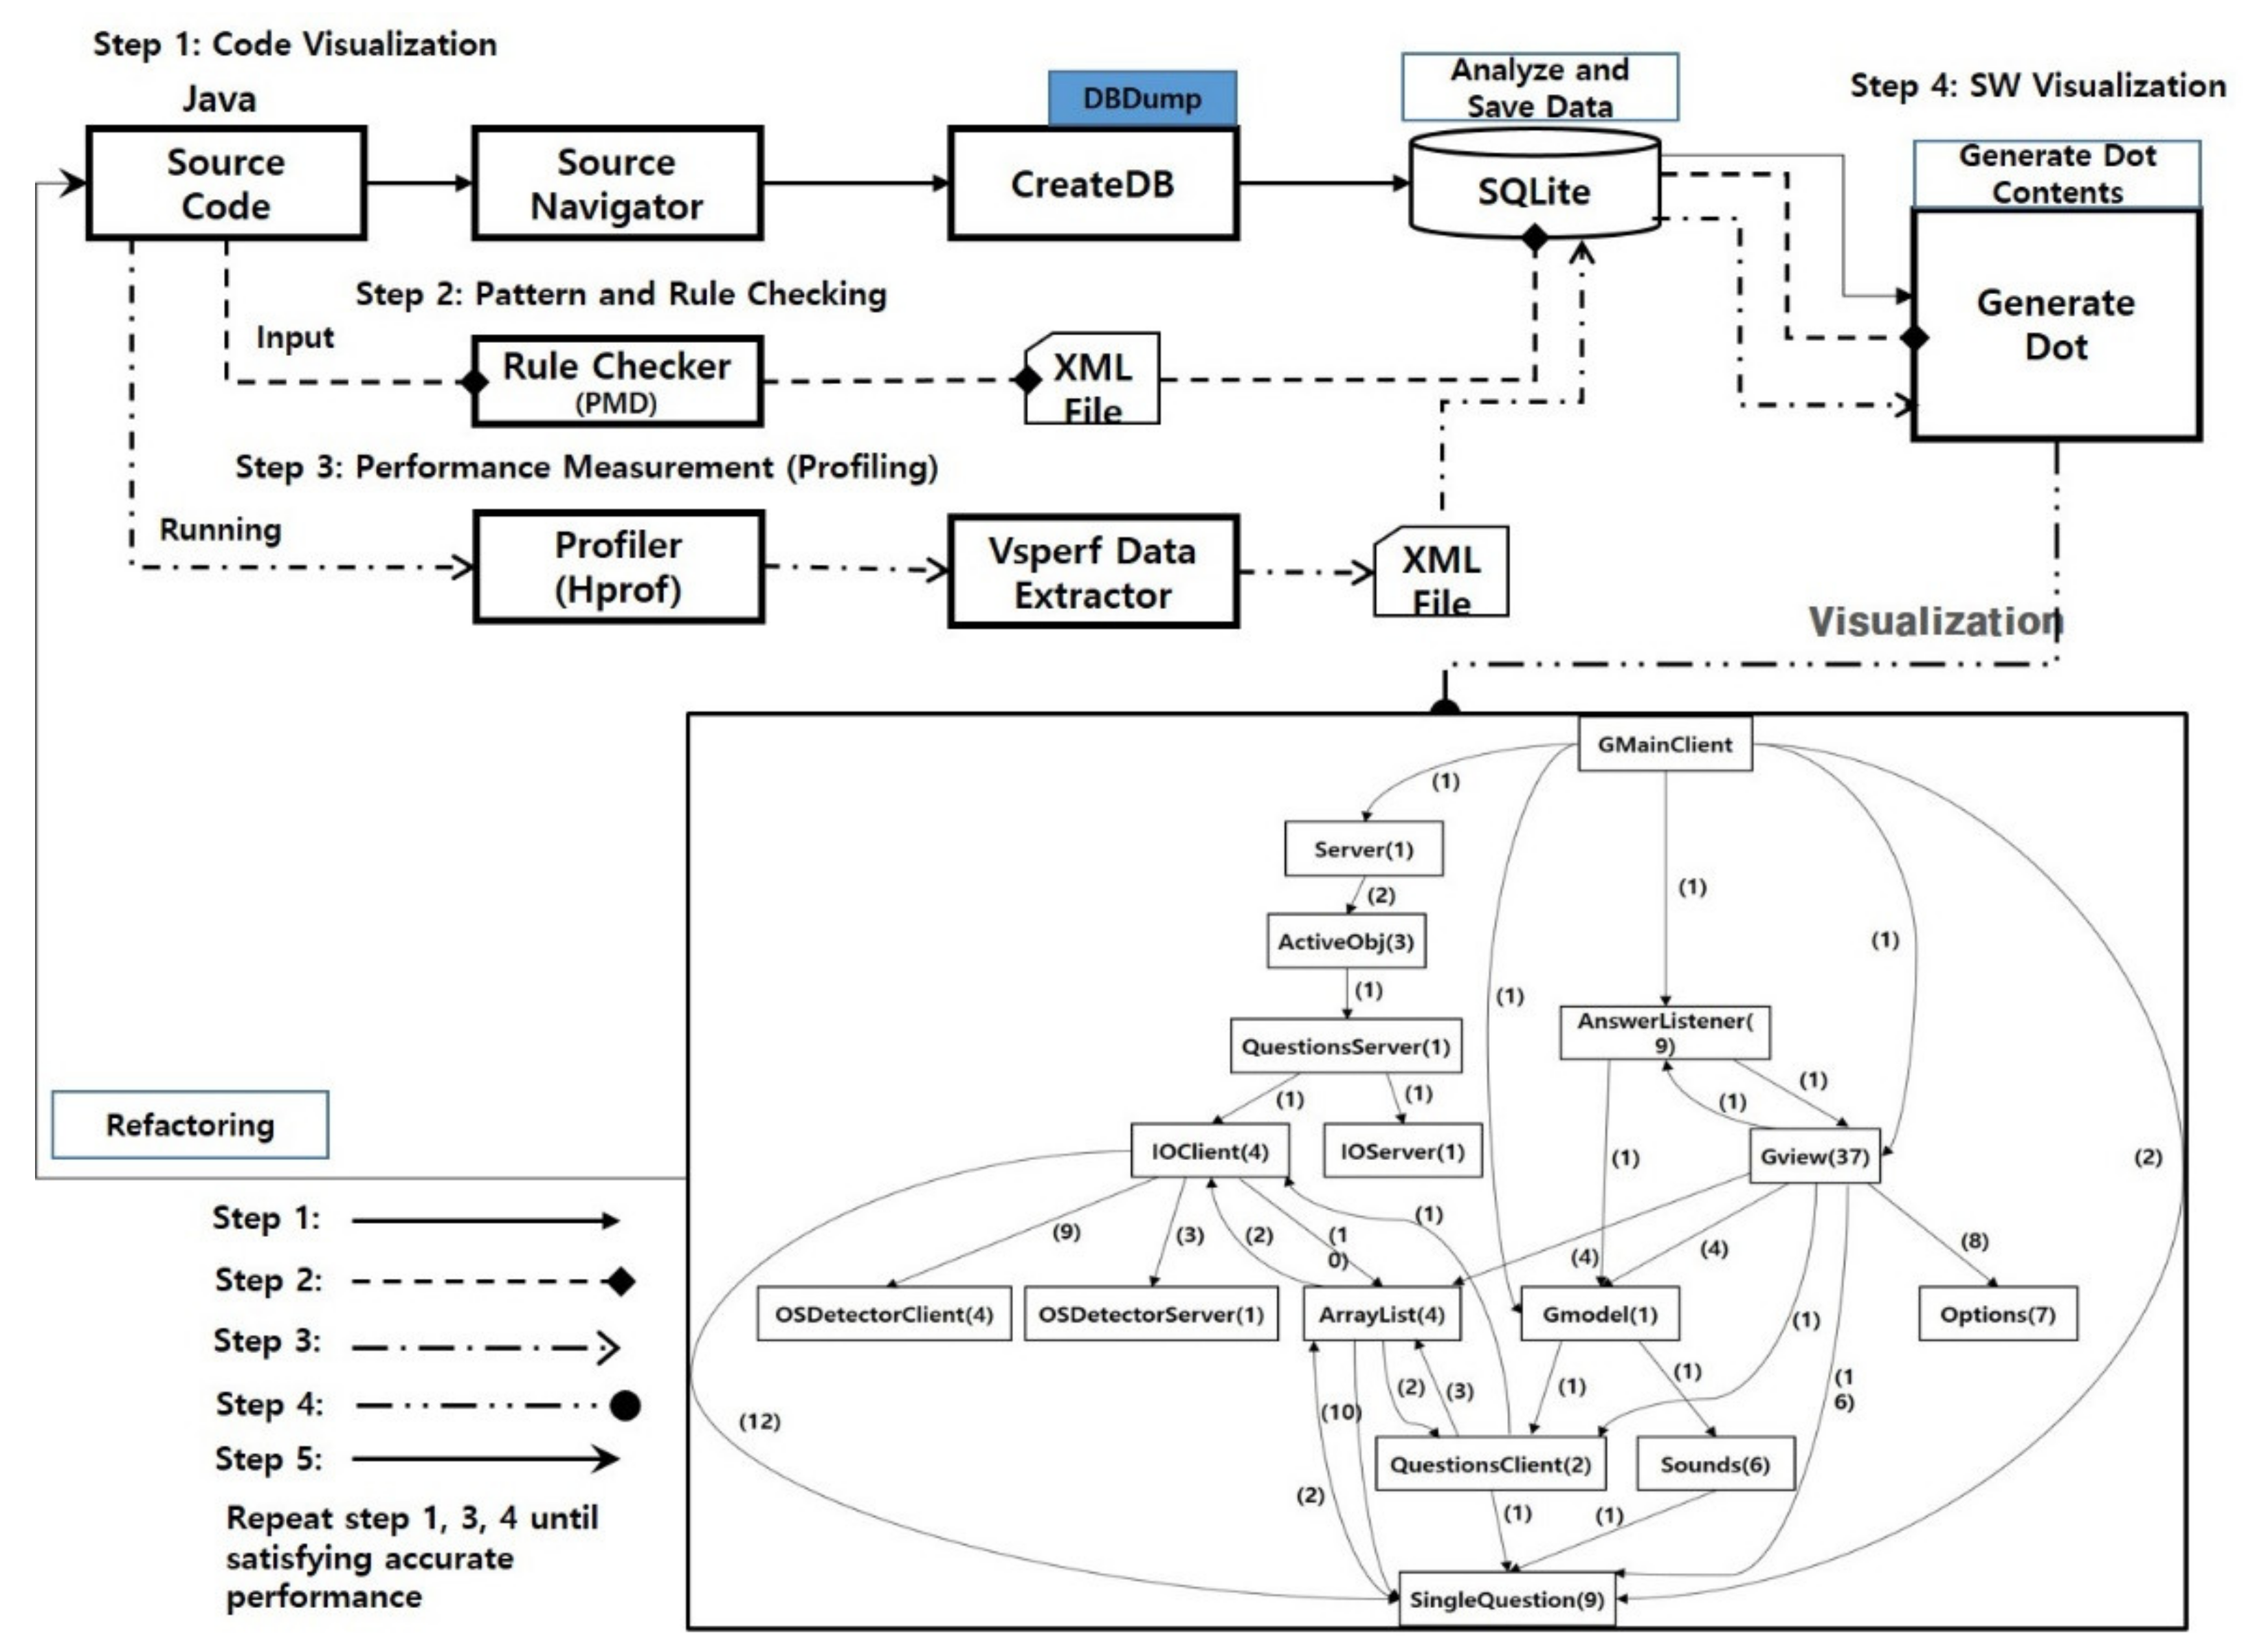
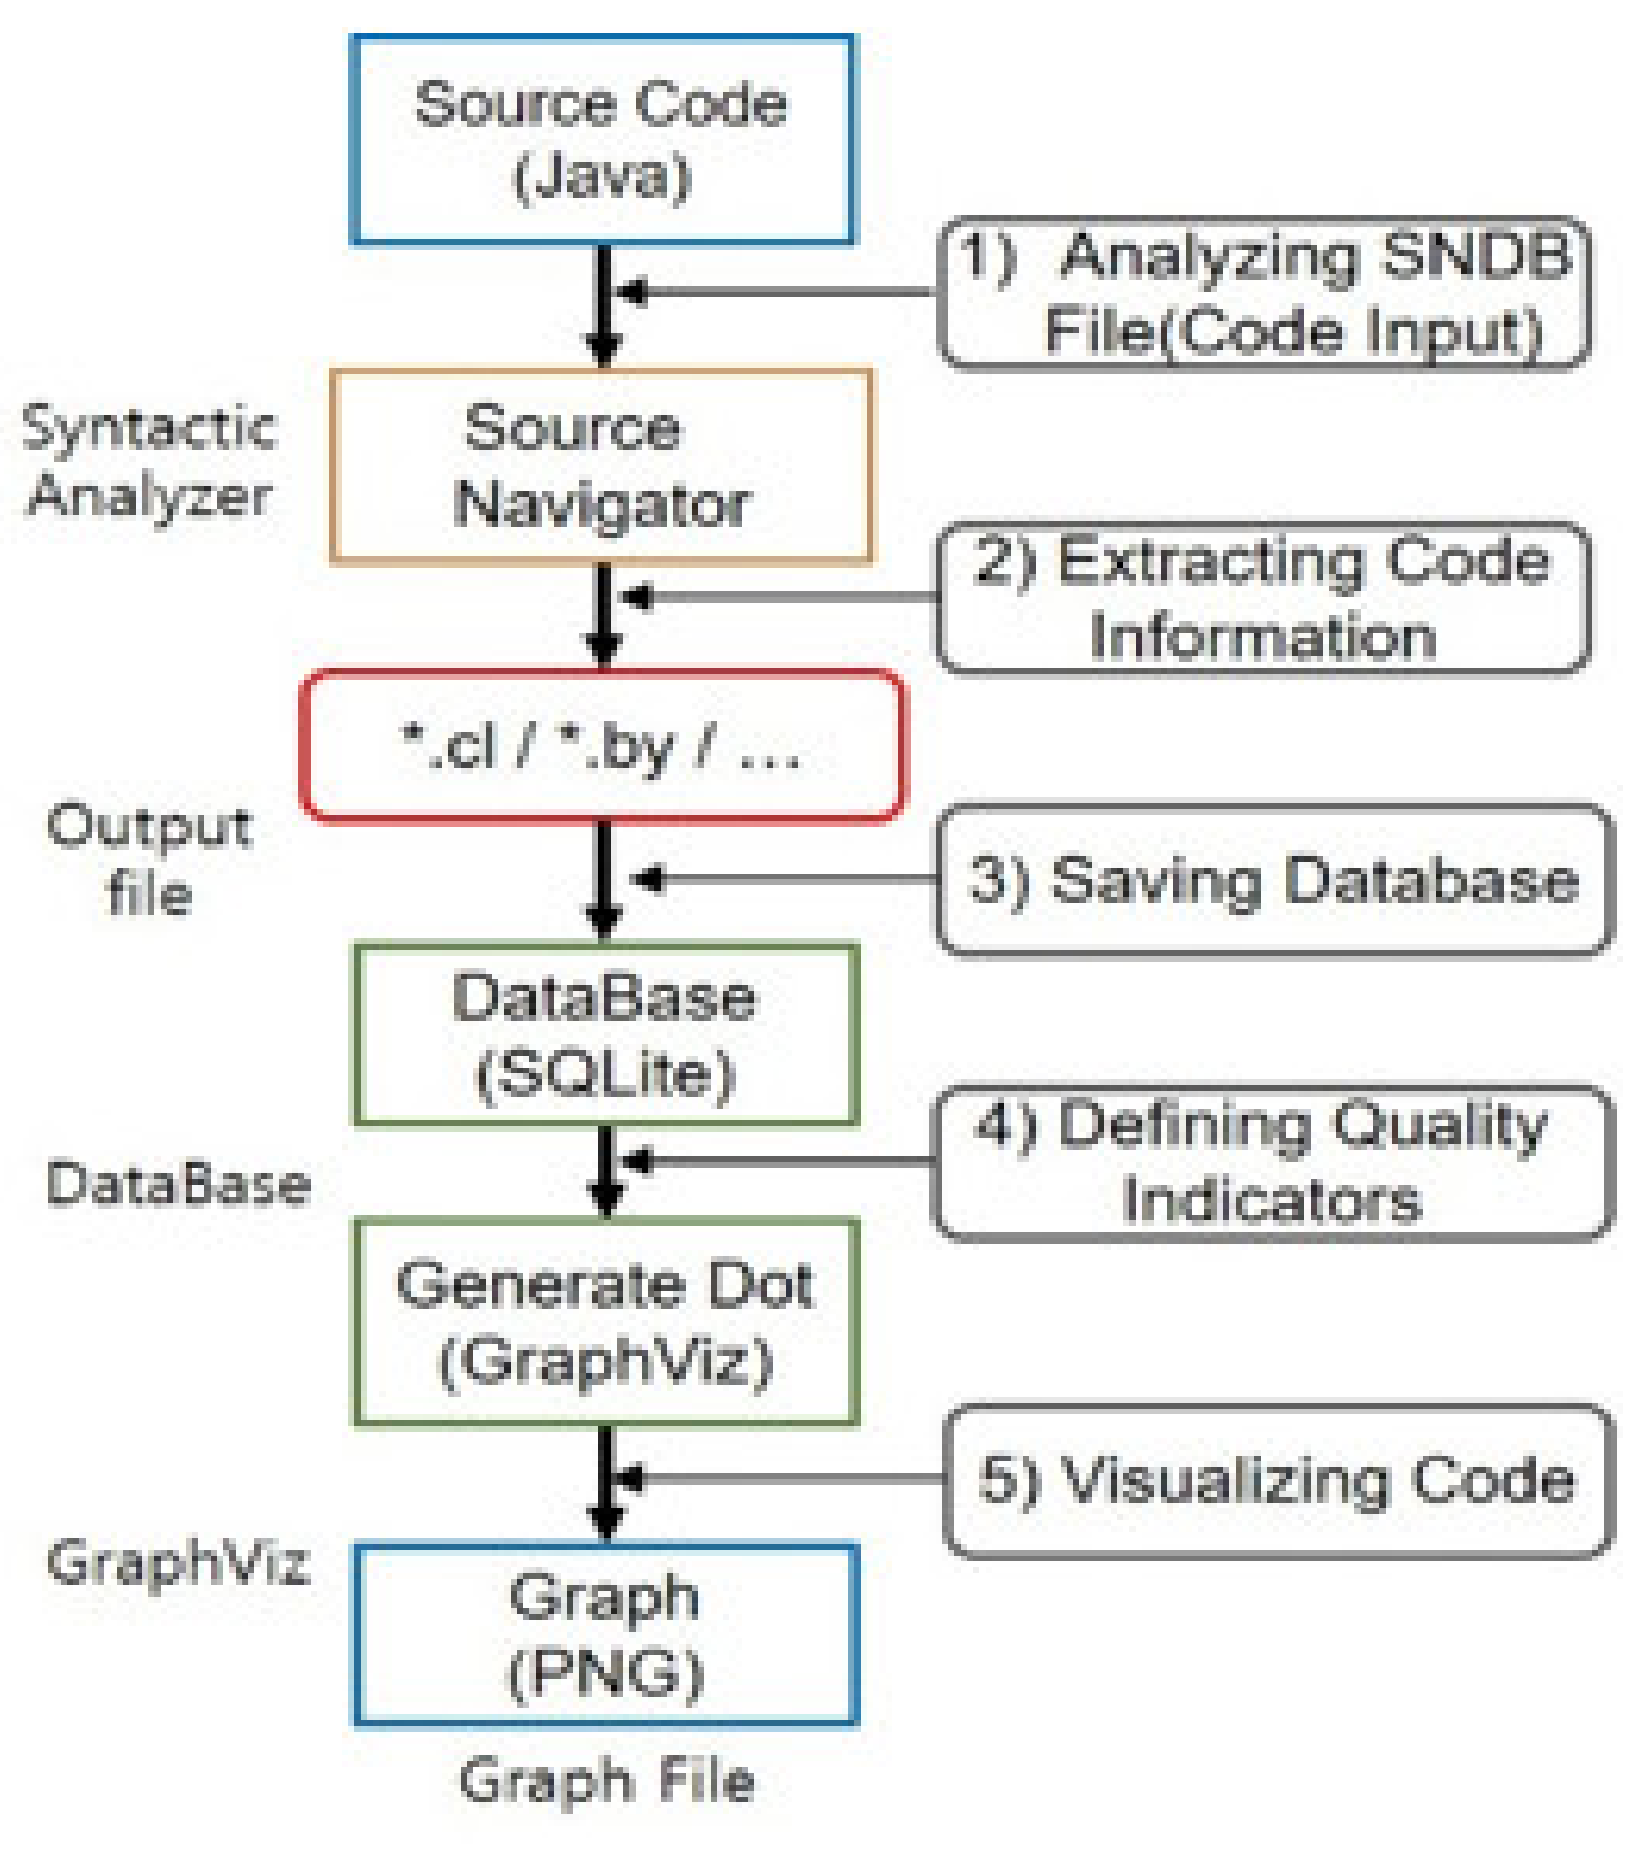
3. Performance Measurement Mechanism for Java Codes
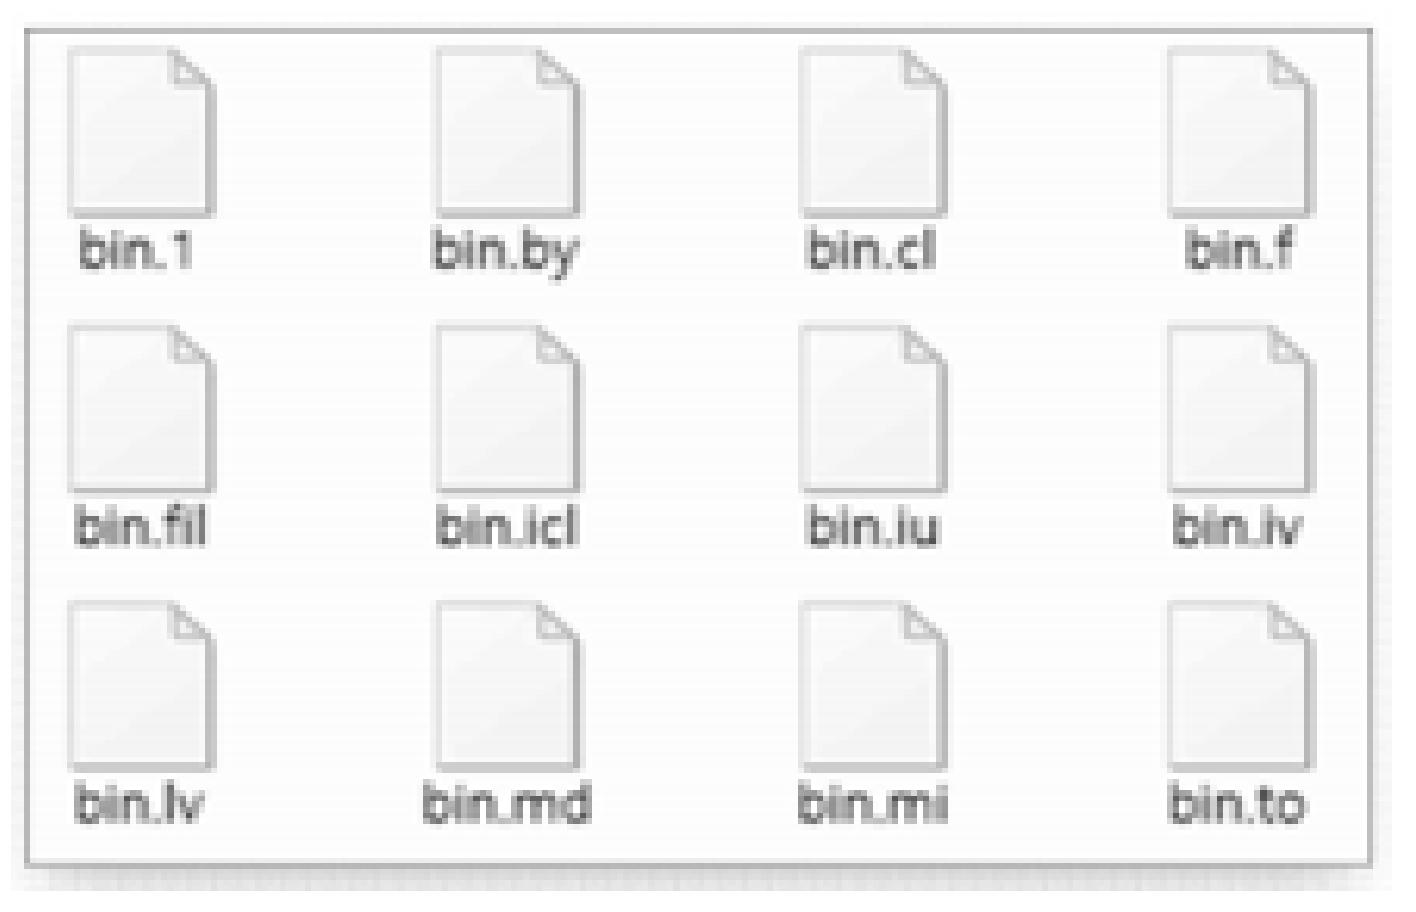
- (1)
- Analyzing SNDB File: Store the data analyzed by the SN into SNDB files. Thereafter, input the program source code into the SN, and extract the information from the source code analyzed by static analysis. The SNDB file contains the complete information of the code program such as function information, local variables, global variables, and parameters. Figure 3 shows the SNDB files generated after parsing the SN.
- (2)
- Extracting Code Information: Extract all code information using DBdump.
- (3)
- Saving Database: Save data in each table of DB. The tables of the database are SNDB_BY, SNDB_CL, SNDB_IN, SNDB_IV, SNDB_LV, and SNDB_MD, respectively. SNDB_BY stores the referenced class name, SYMBOL name, and SYMBOL type; SNDB_IN contains information such as subclasses and inherited classes; SNDB_IV contains information on member variables; SNDB_LV contains information on local variables; while SNDB_MD contains information about the method.
- (4)
- Defining Quality Indicators: Define the quality indicators to determine the quantitative measurement score and make the query for extracting the degree of coupling strength for high quality of the software.
- (5)
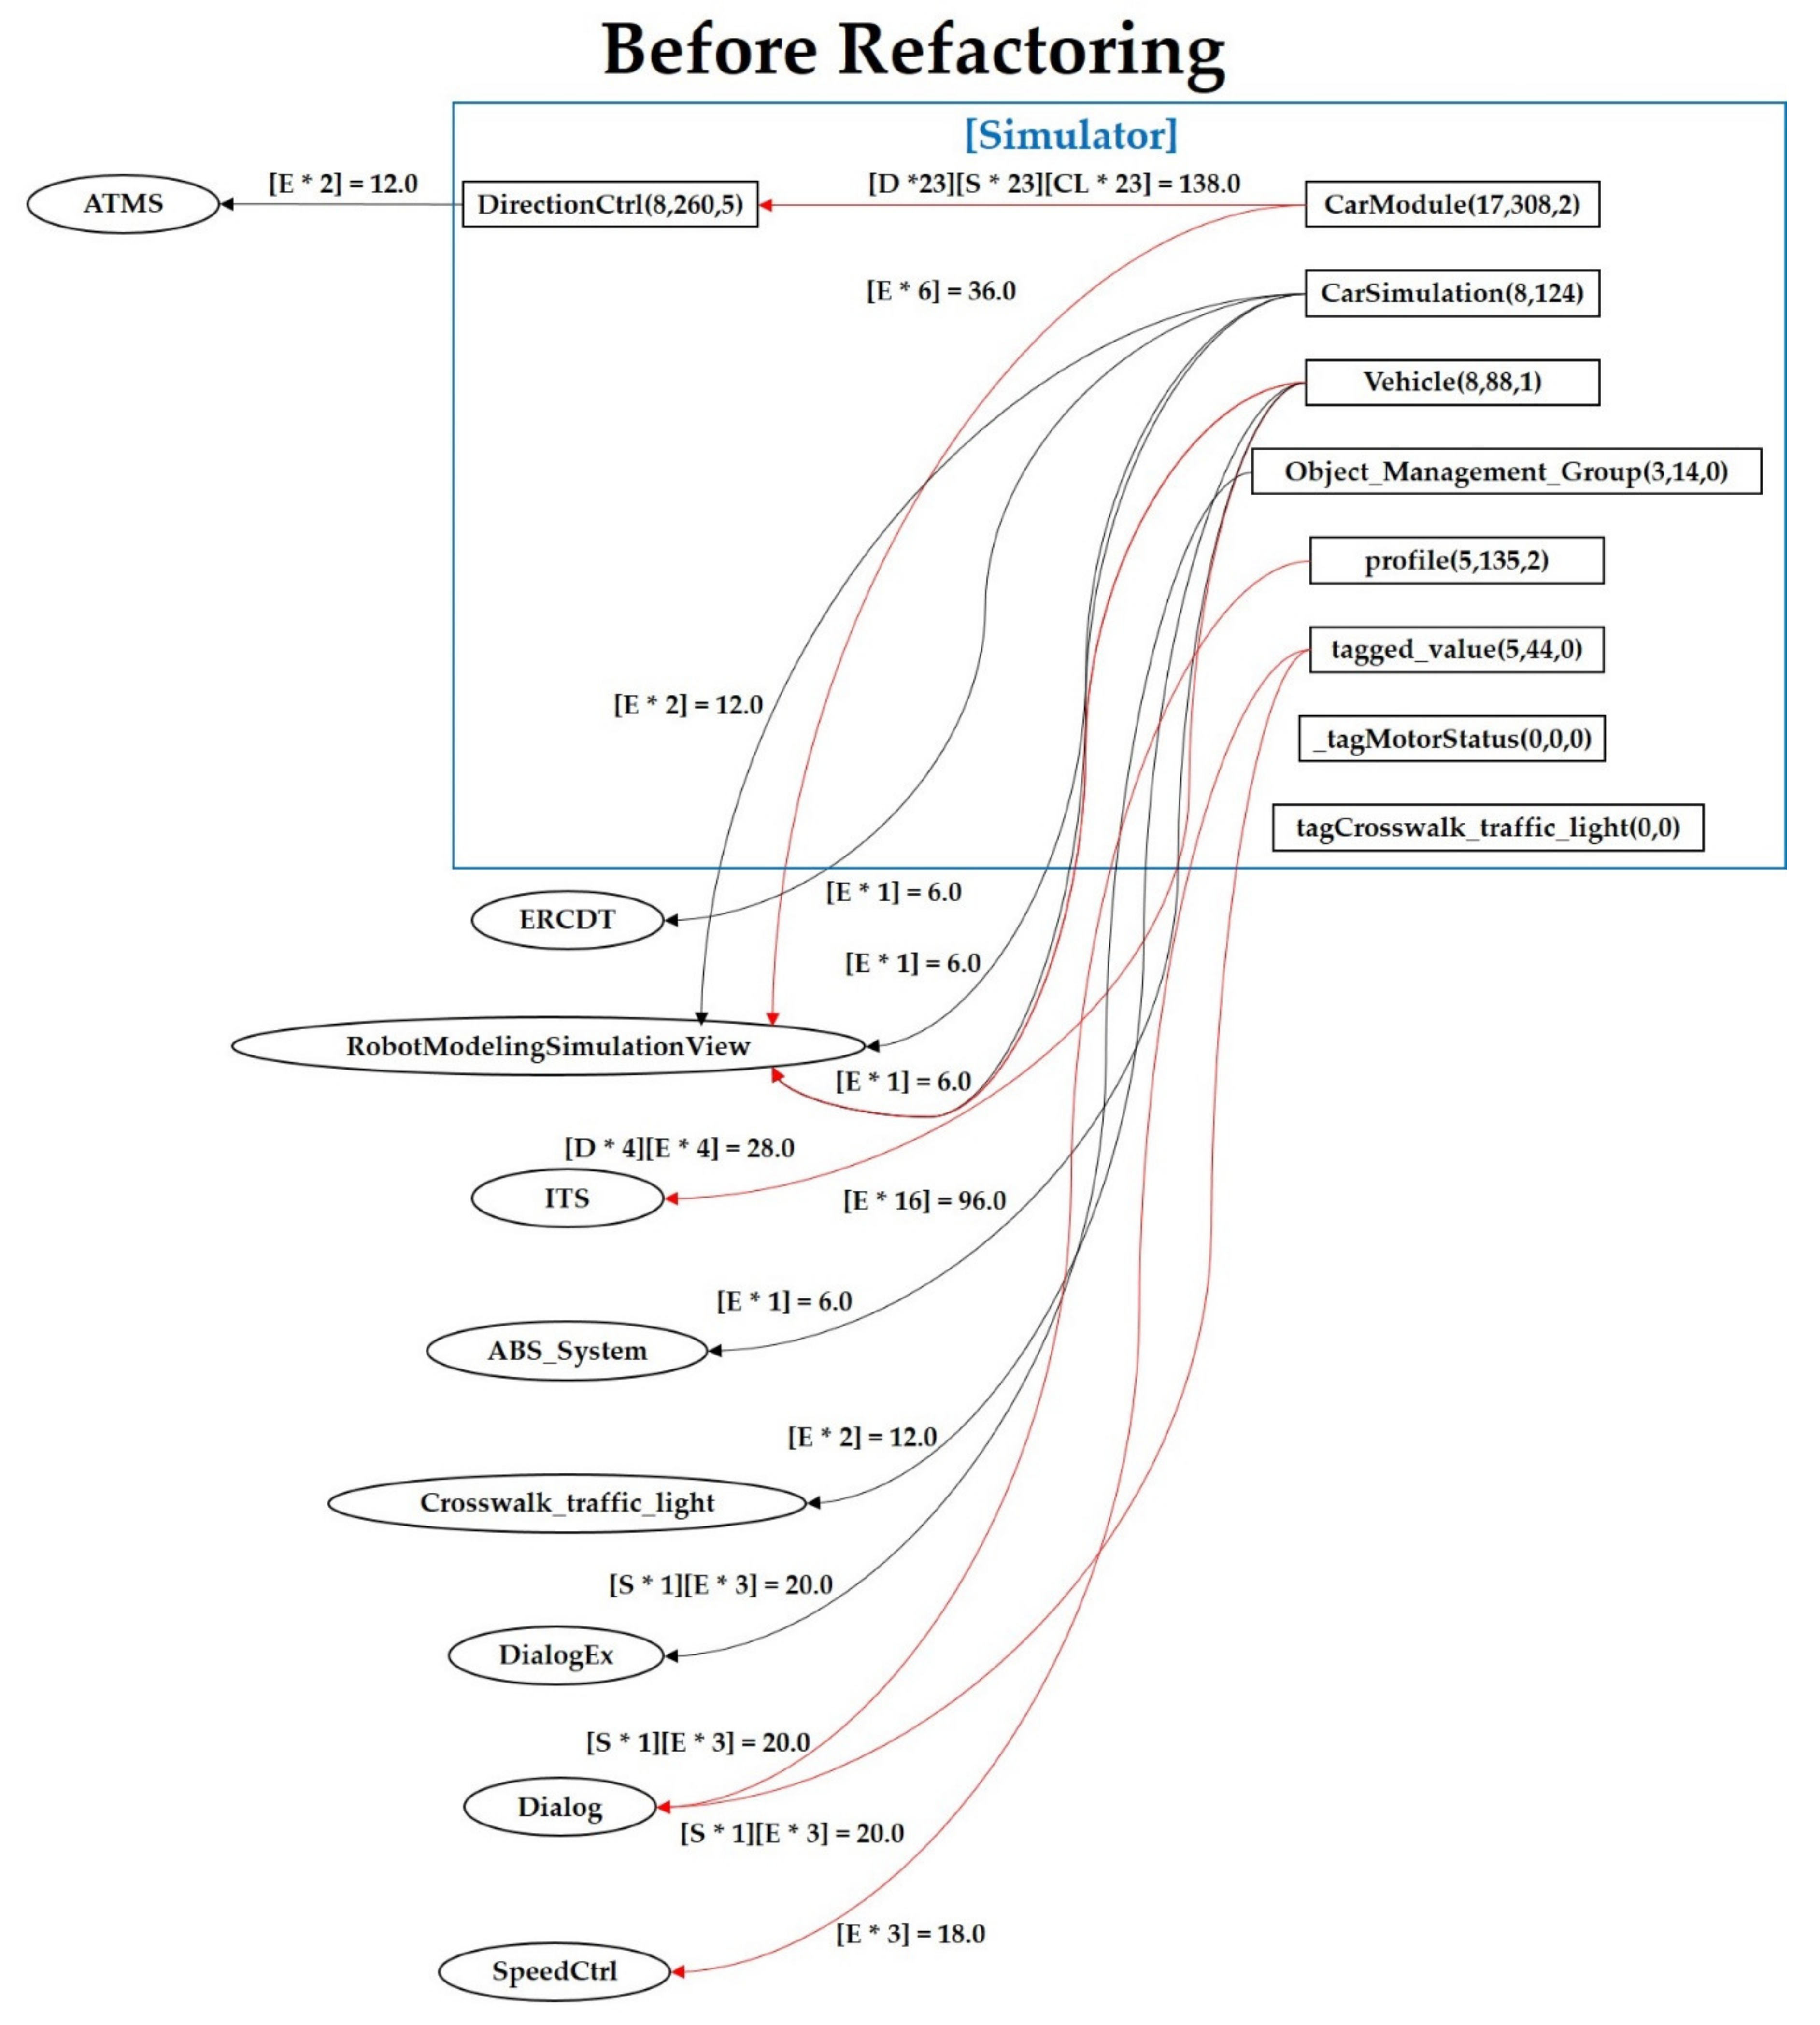
- Visualizing Code: The quality indicators are quantified using the extracted information. Thereafter, it extracts code data by using a query called ‘GenerateDotContents’. The Graph Description Language (DOT) script quantifies the quality indicator value. Subsequently, the Graphviz tool displays quantified values from the DOT script. Finally, it extracts the data into an image file.
4. Results
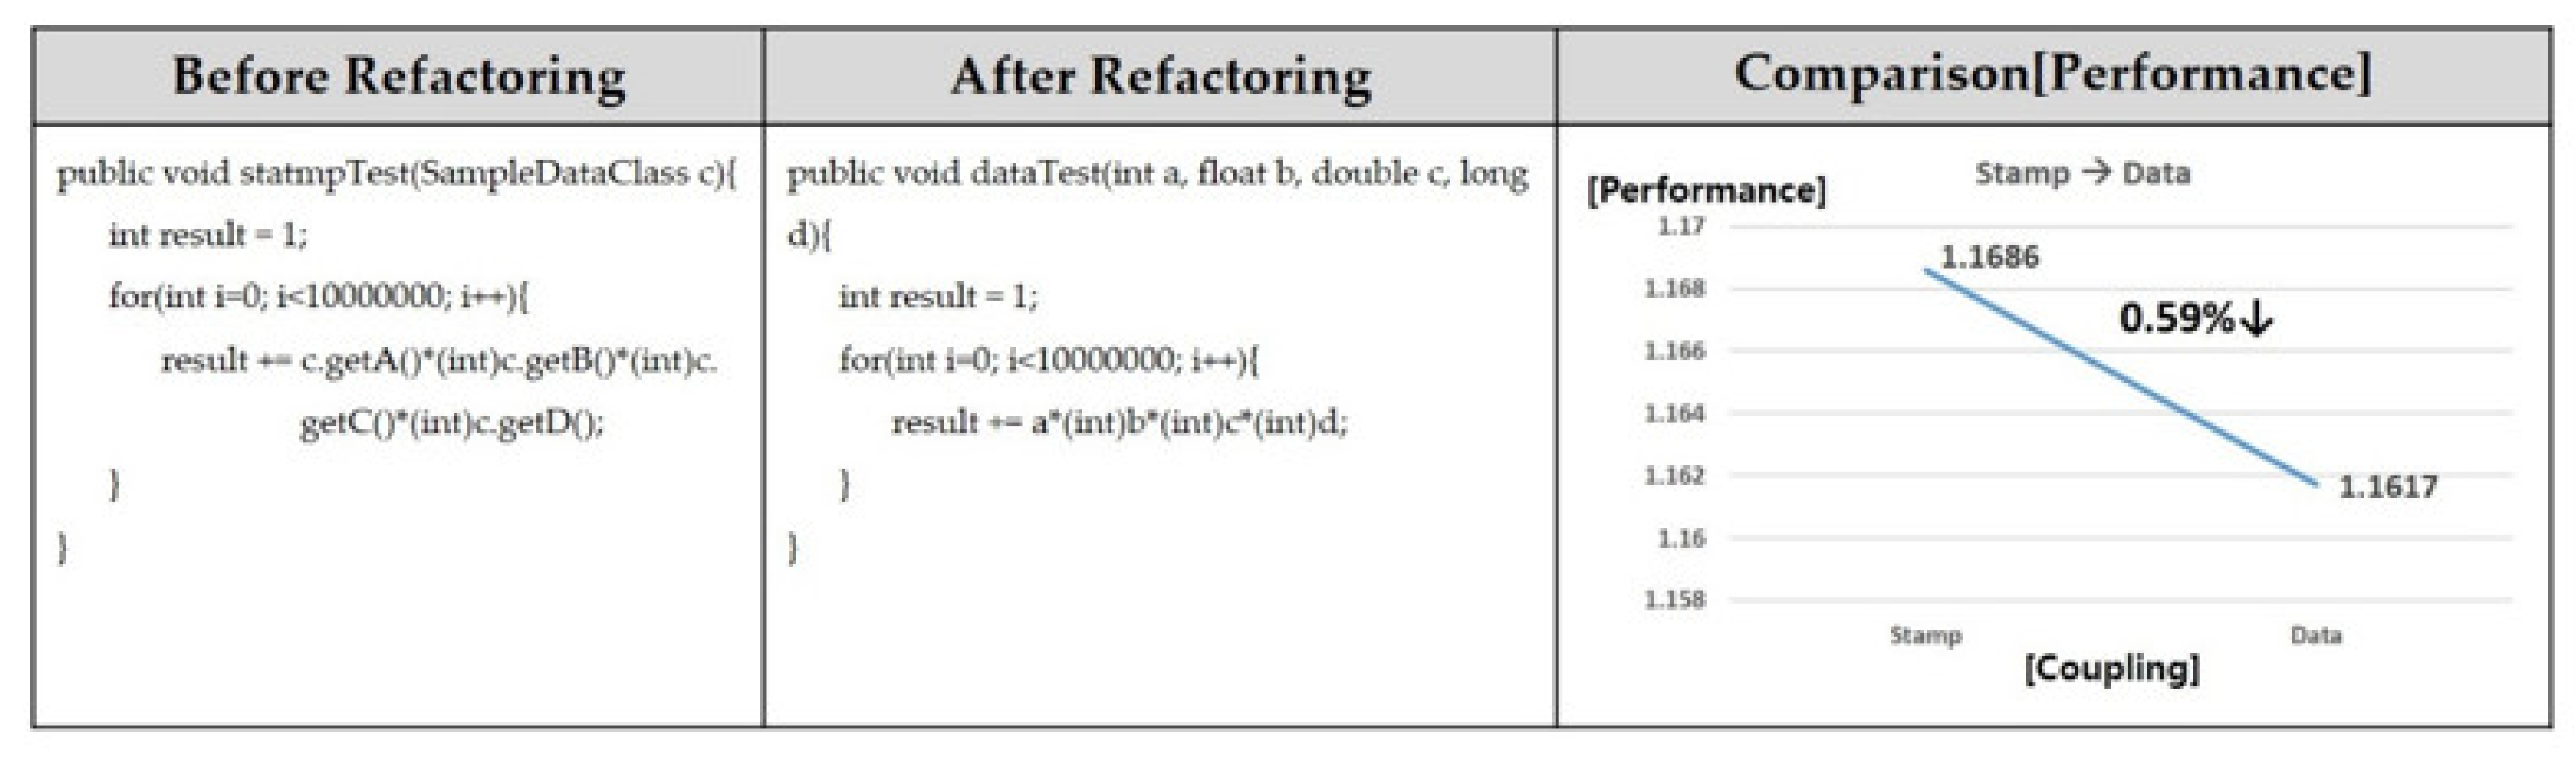
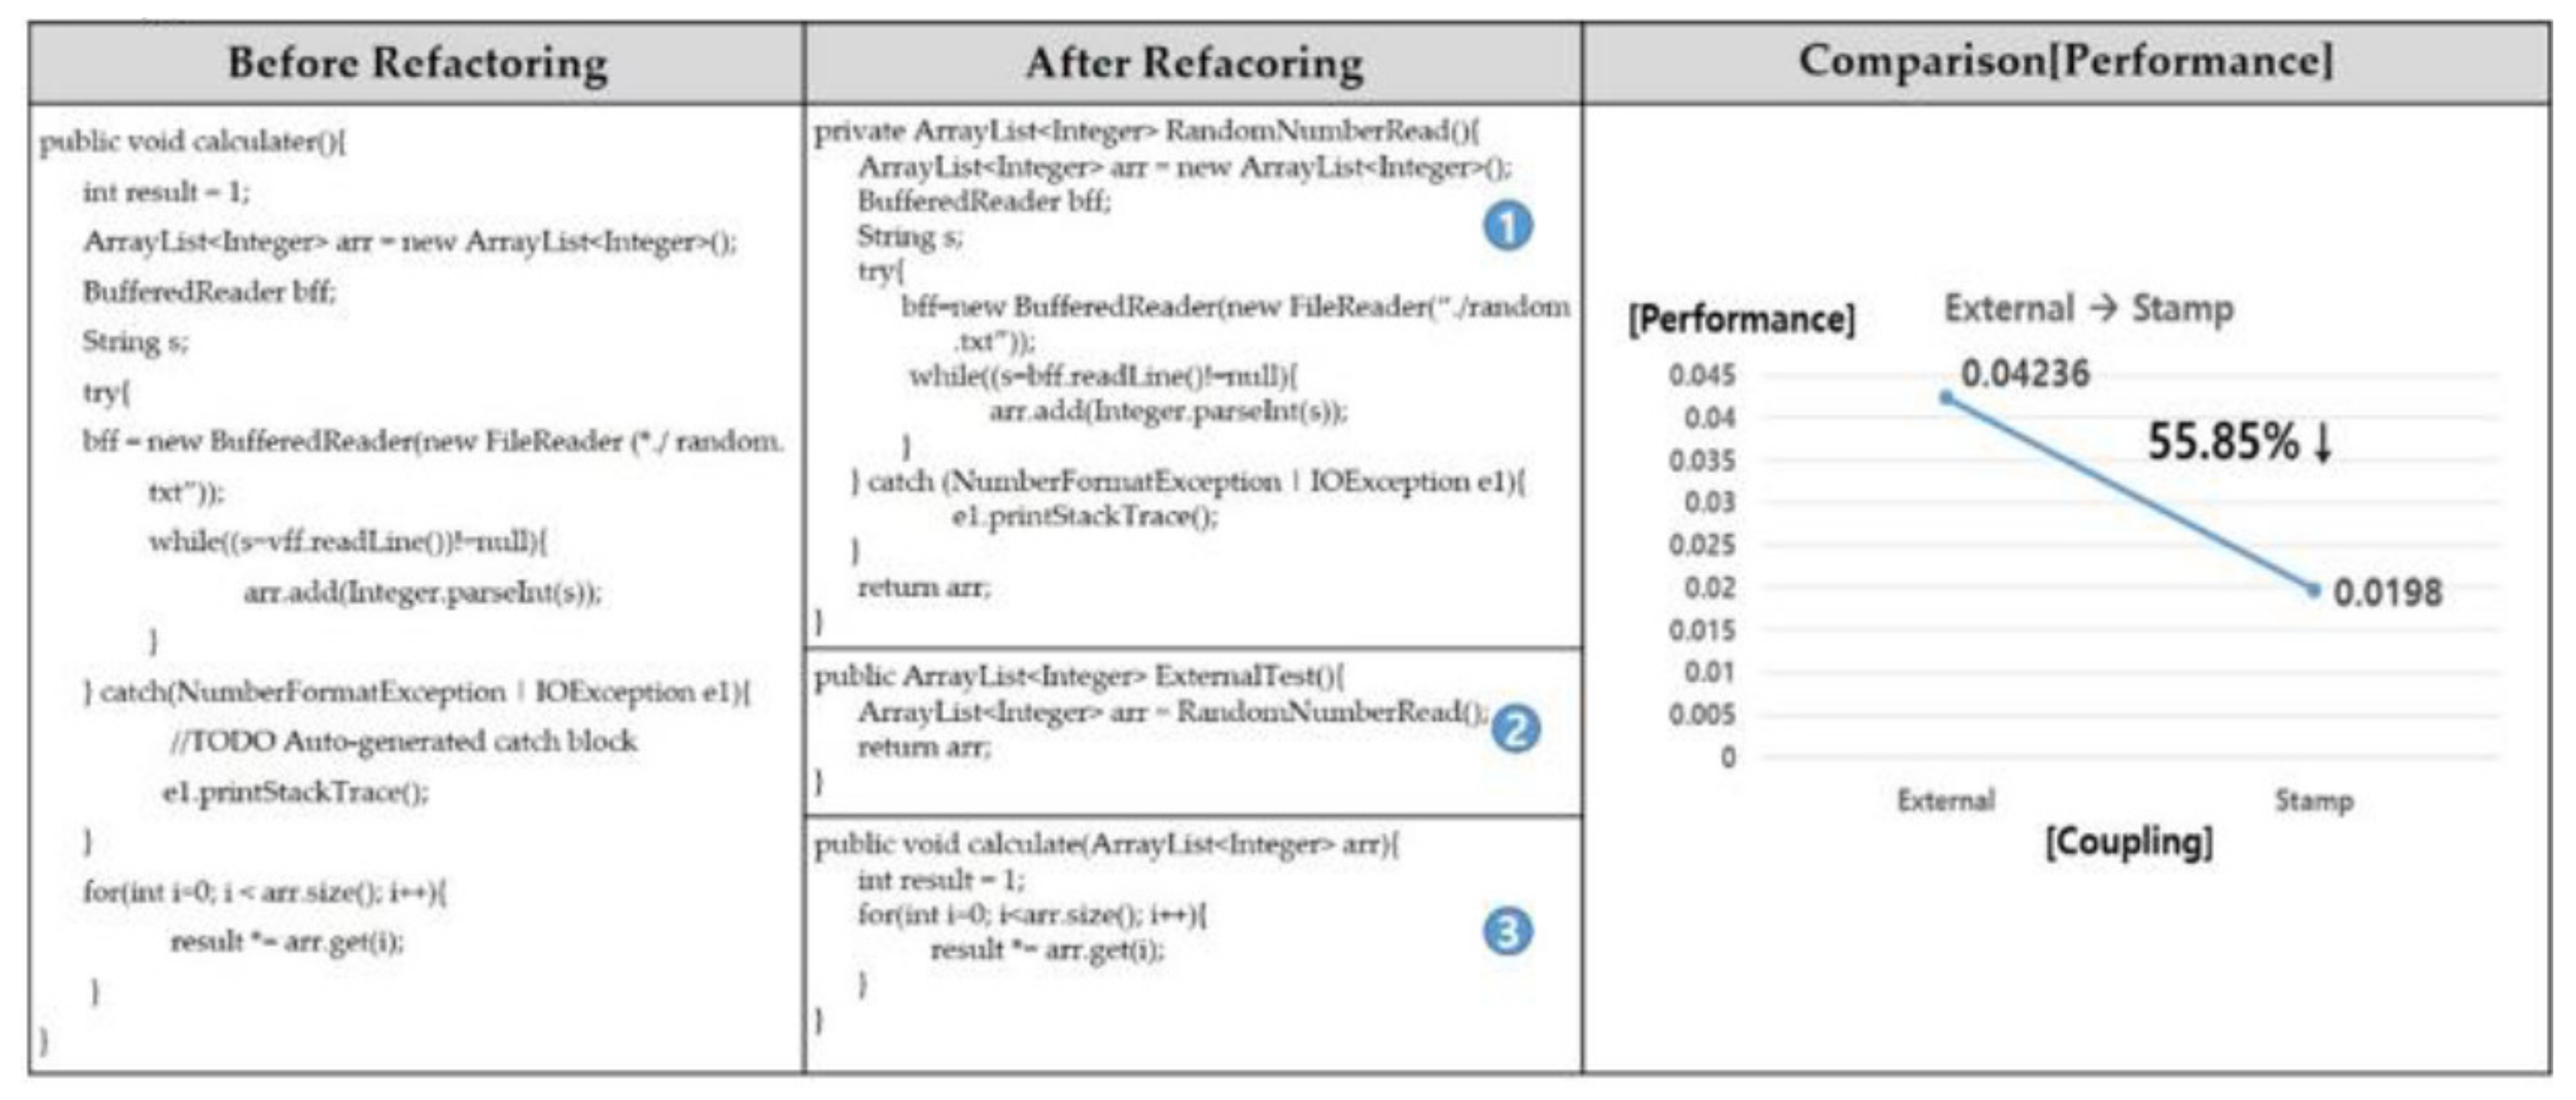
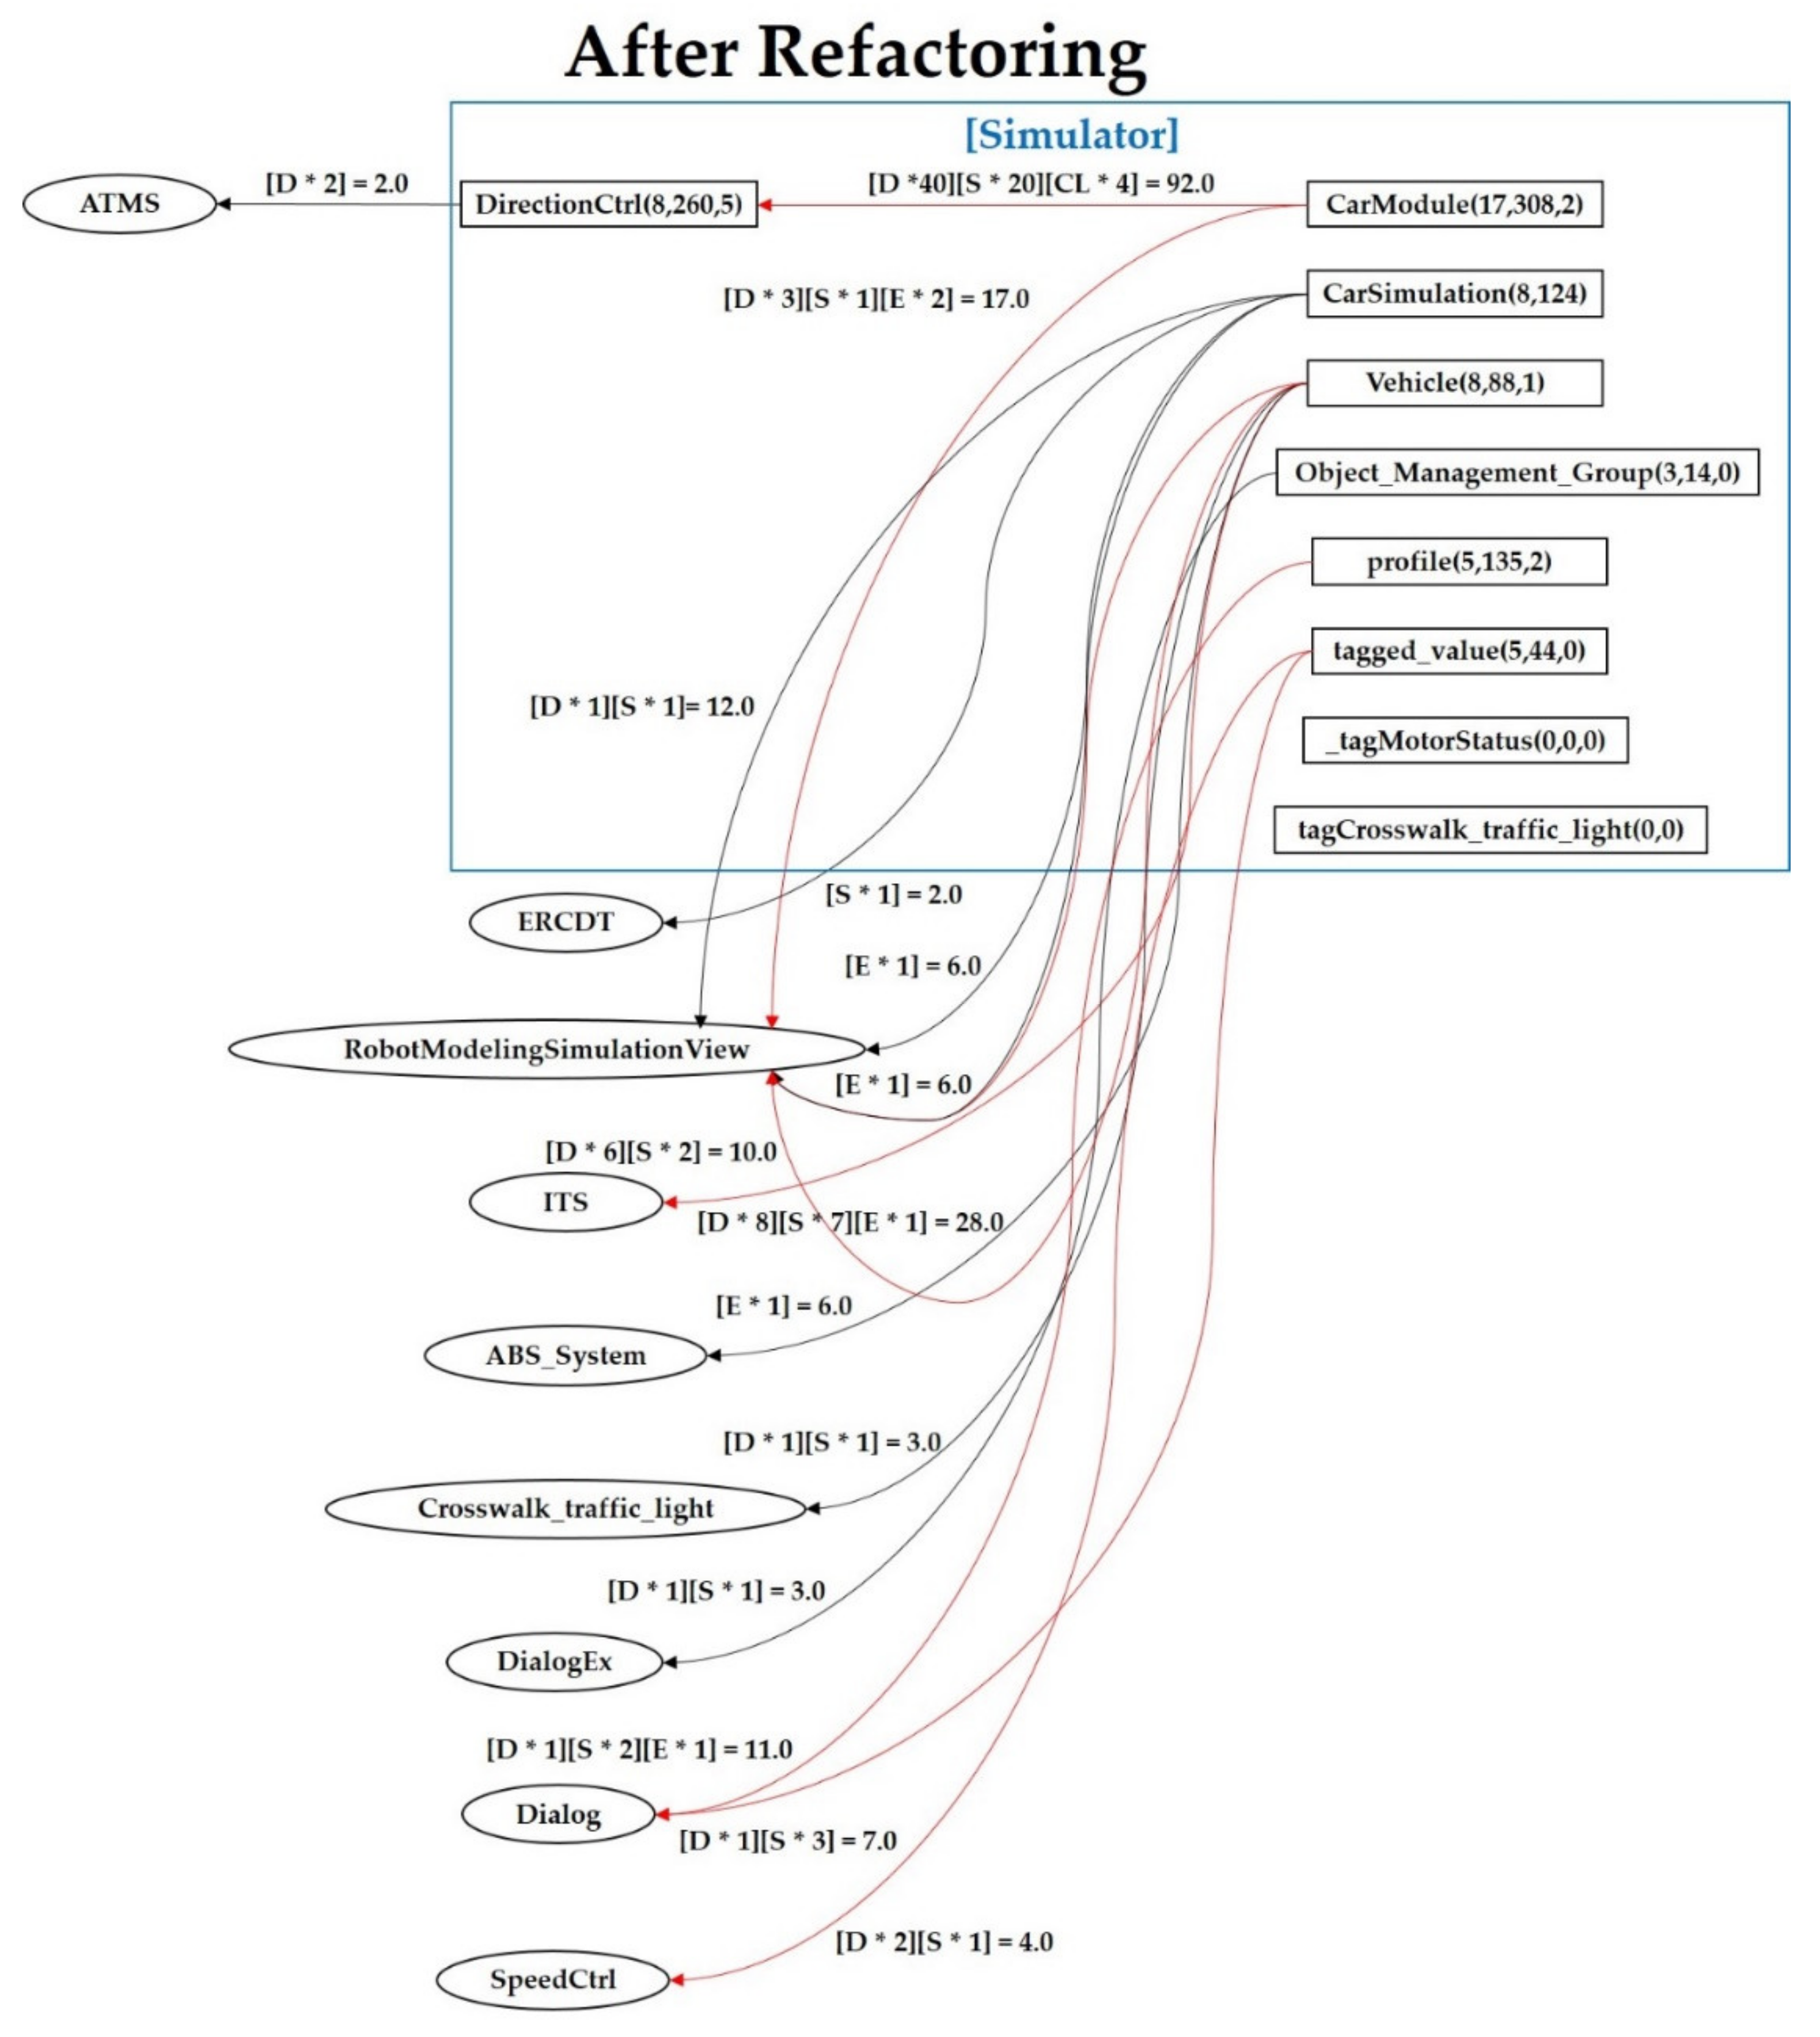
4.1. Improving Coupling
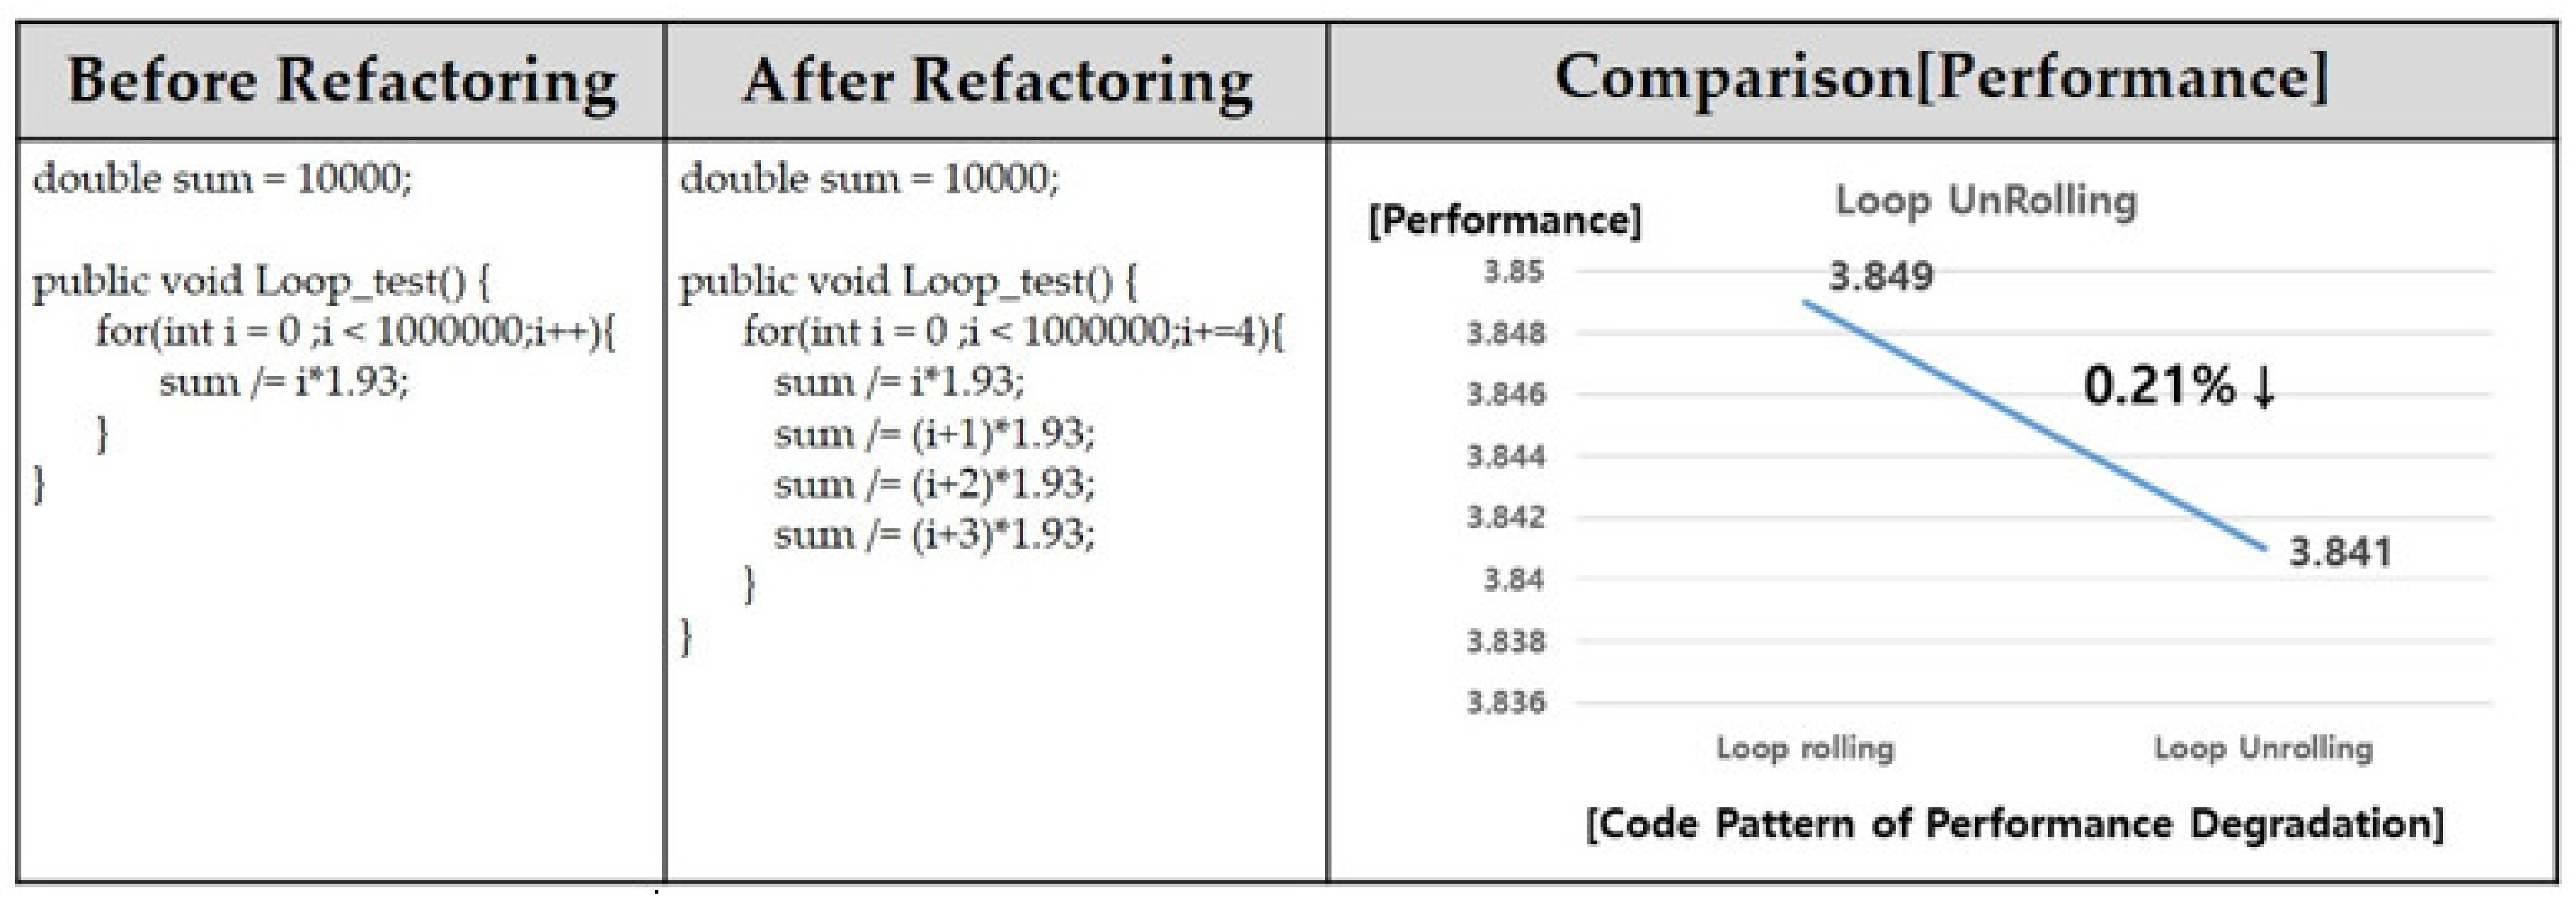
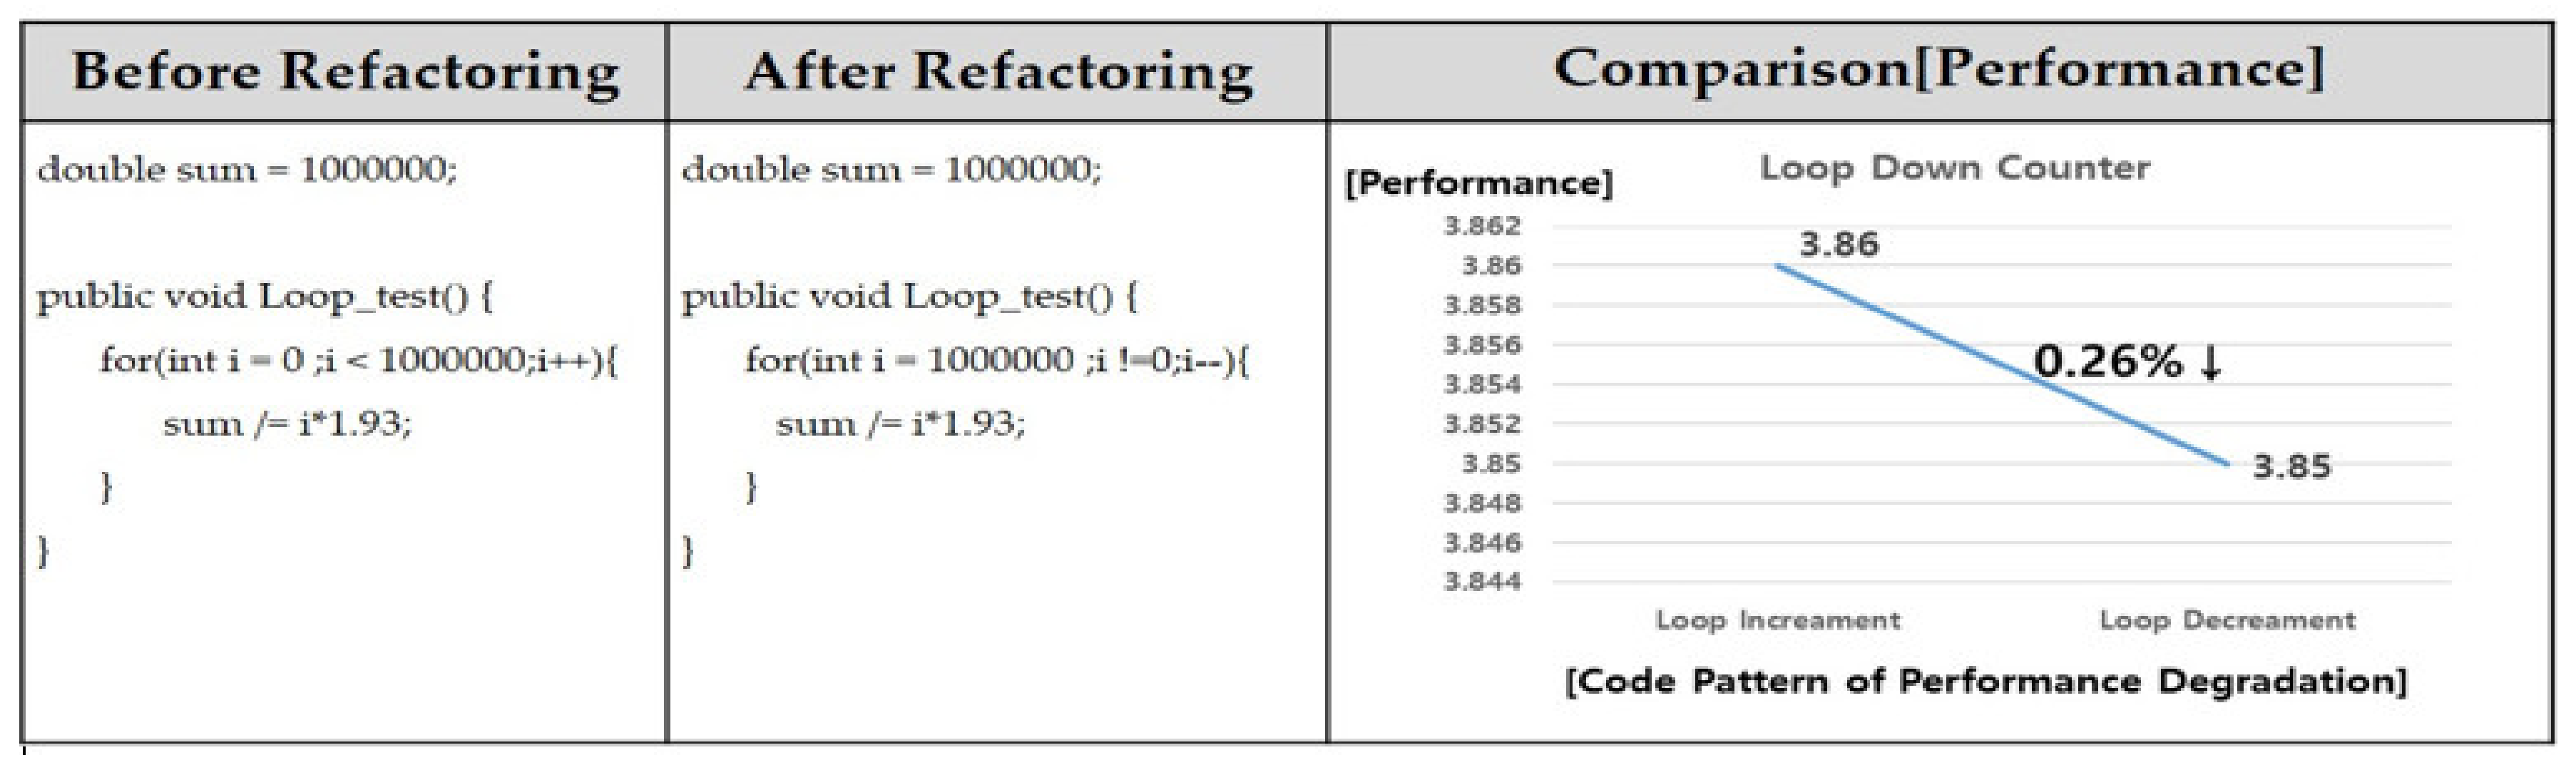
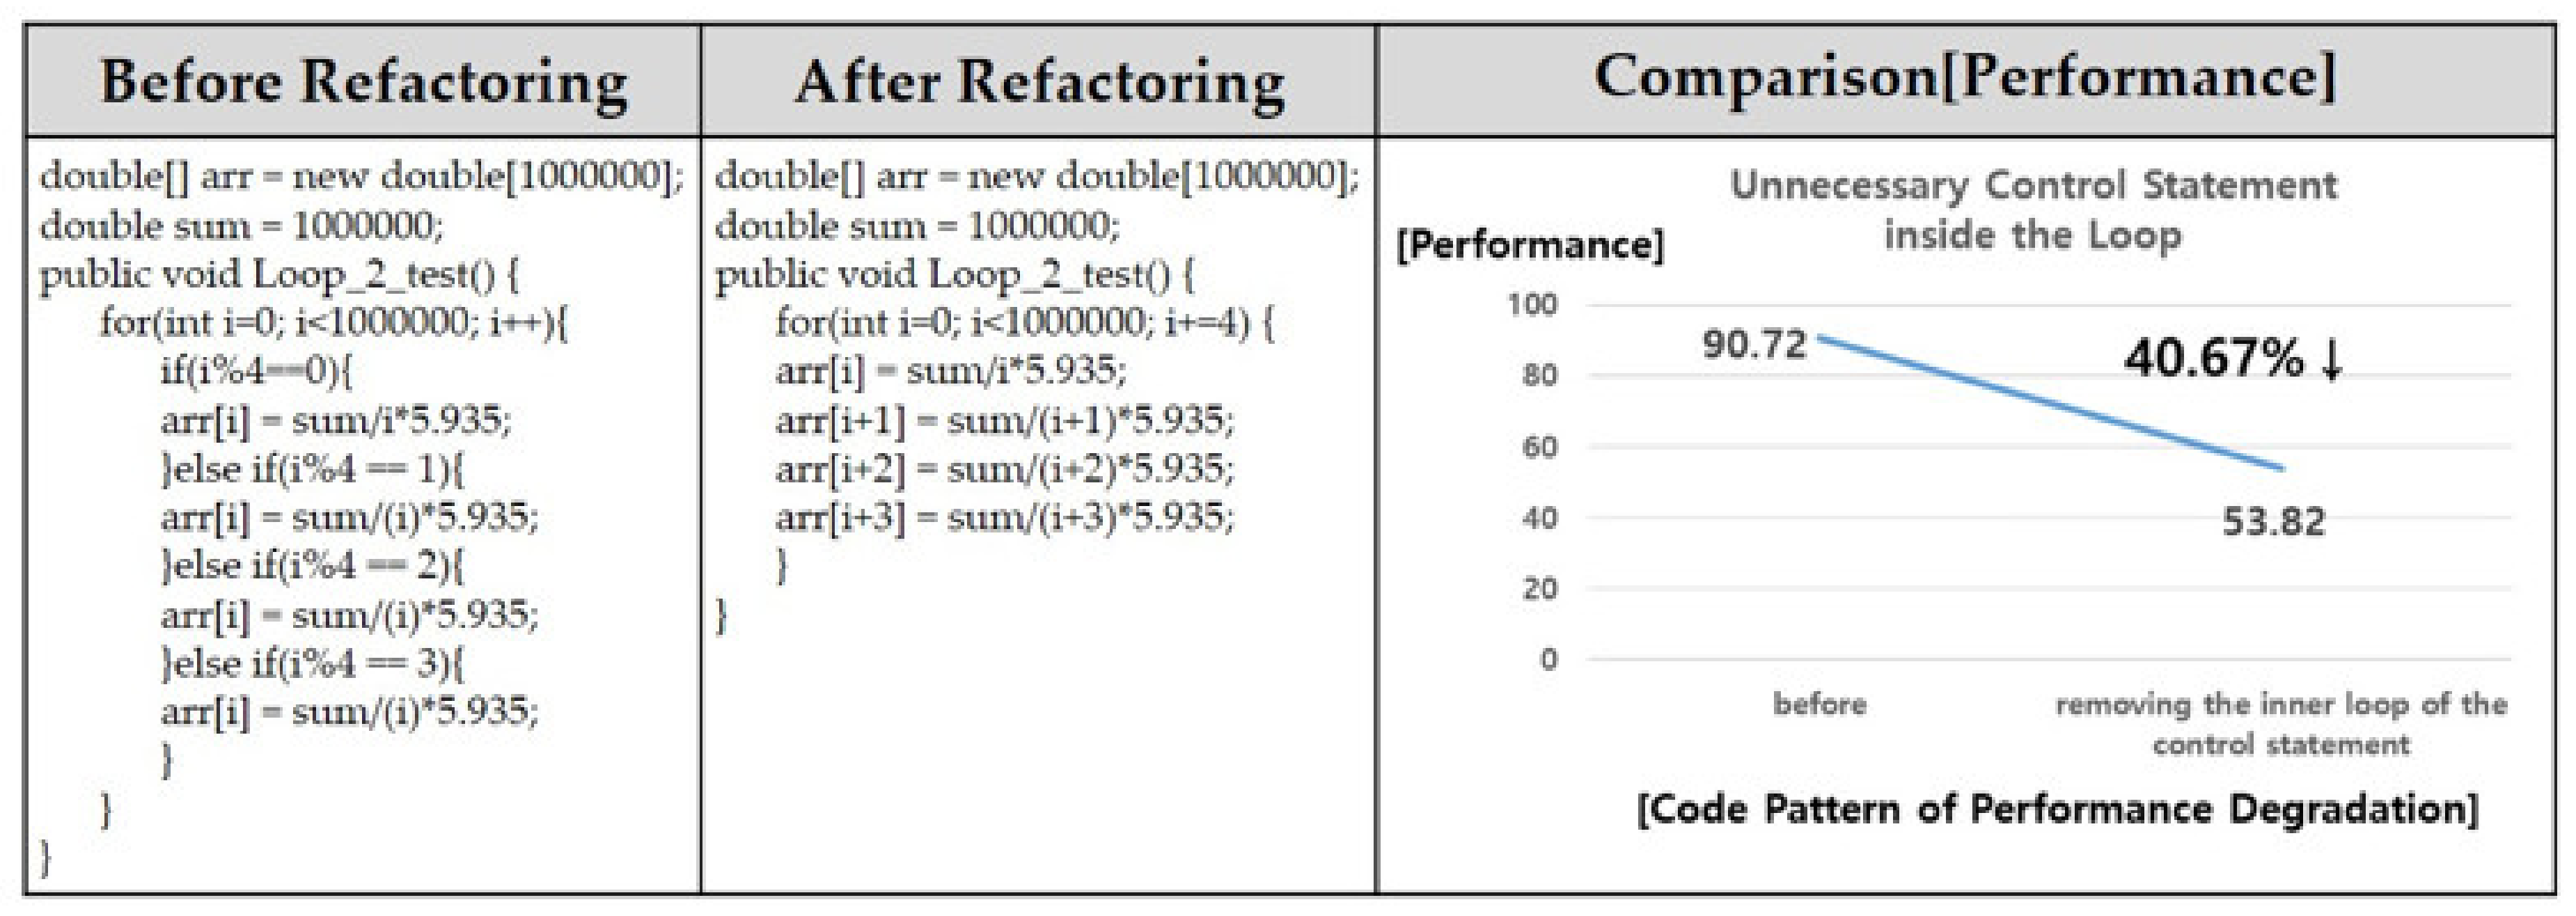
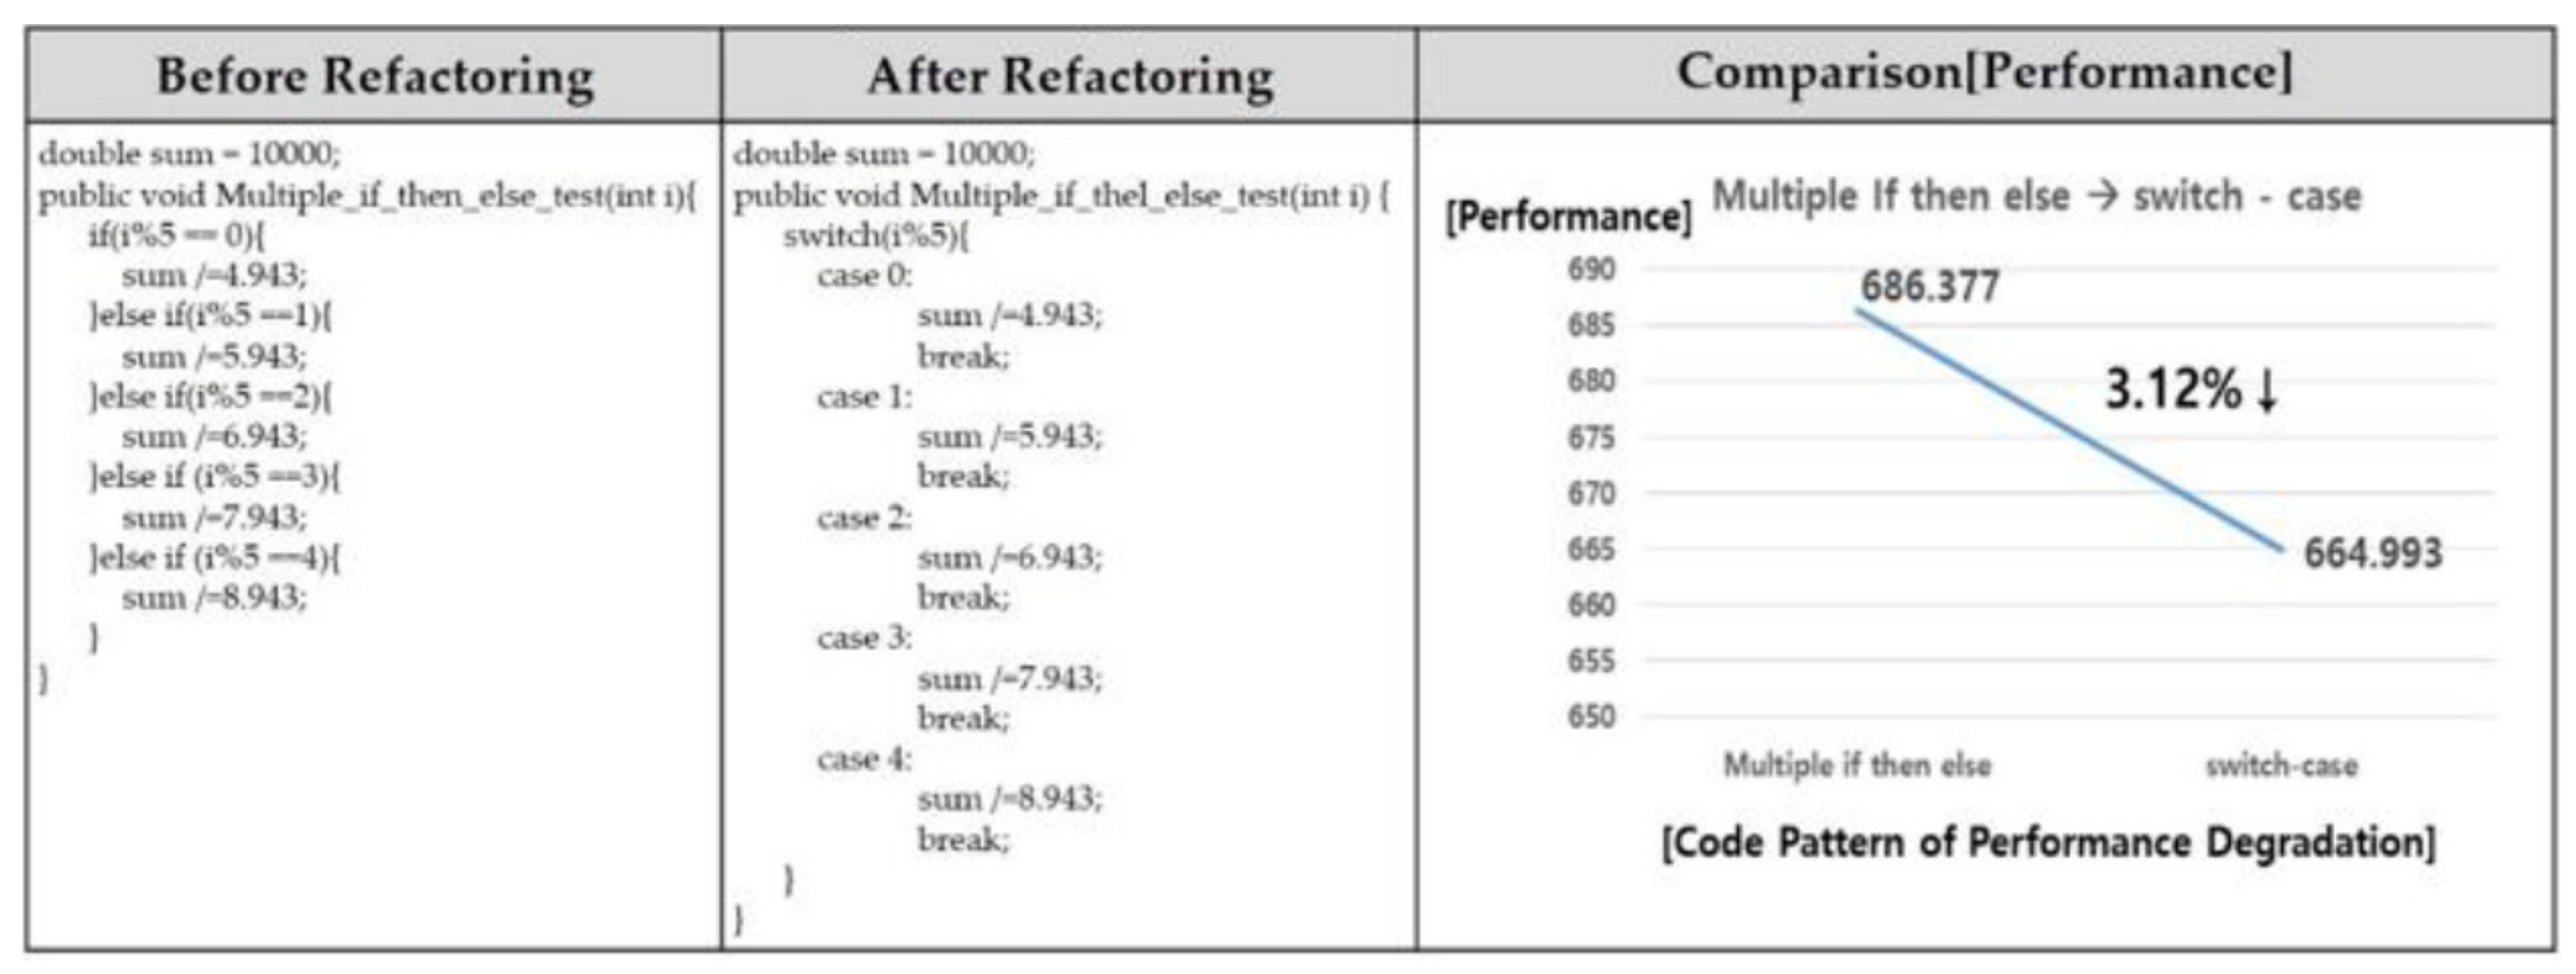
4.2. Enhancement of Performance Degradation Factors
4.3. Result of Refactoring
5. Discussion
5.1. Refactoring Results in Terms of the Level of the Coupling Mechanism
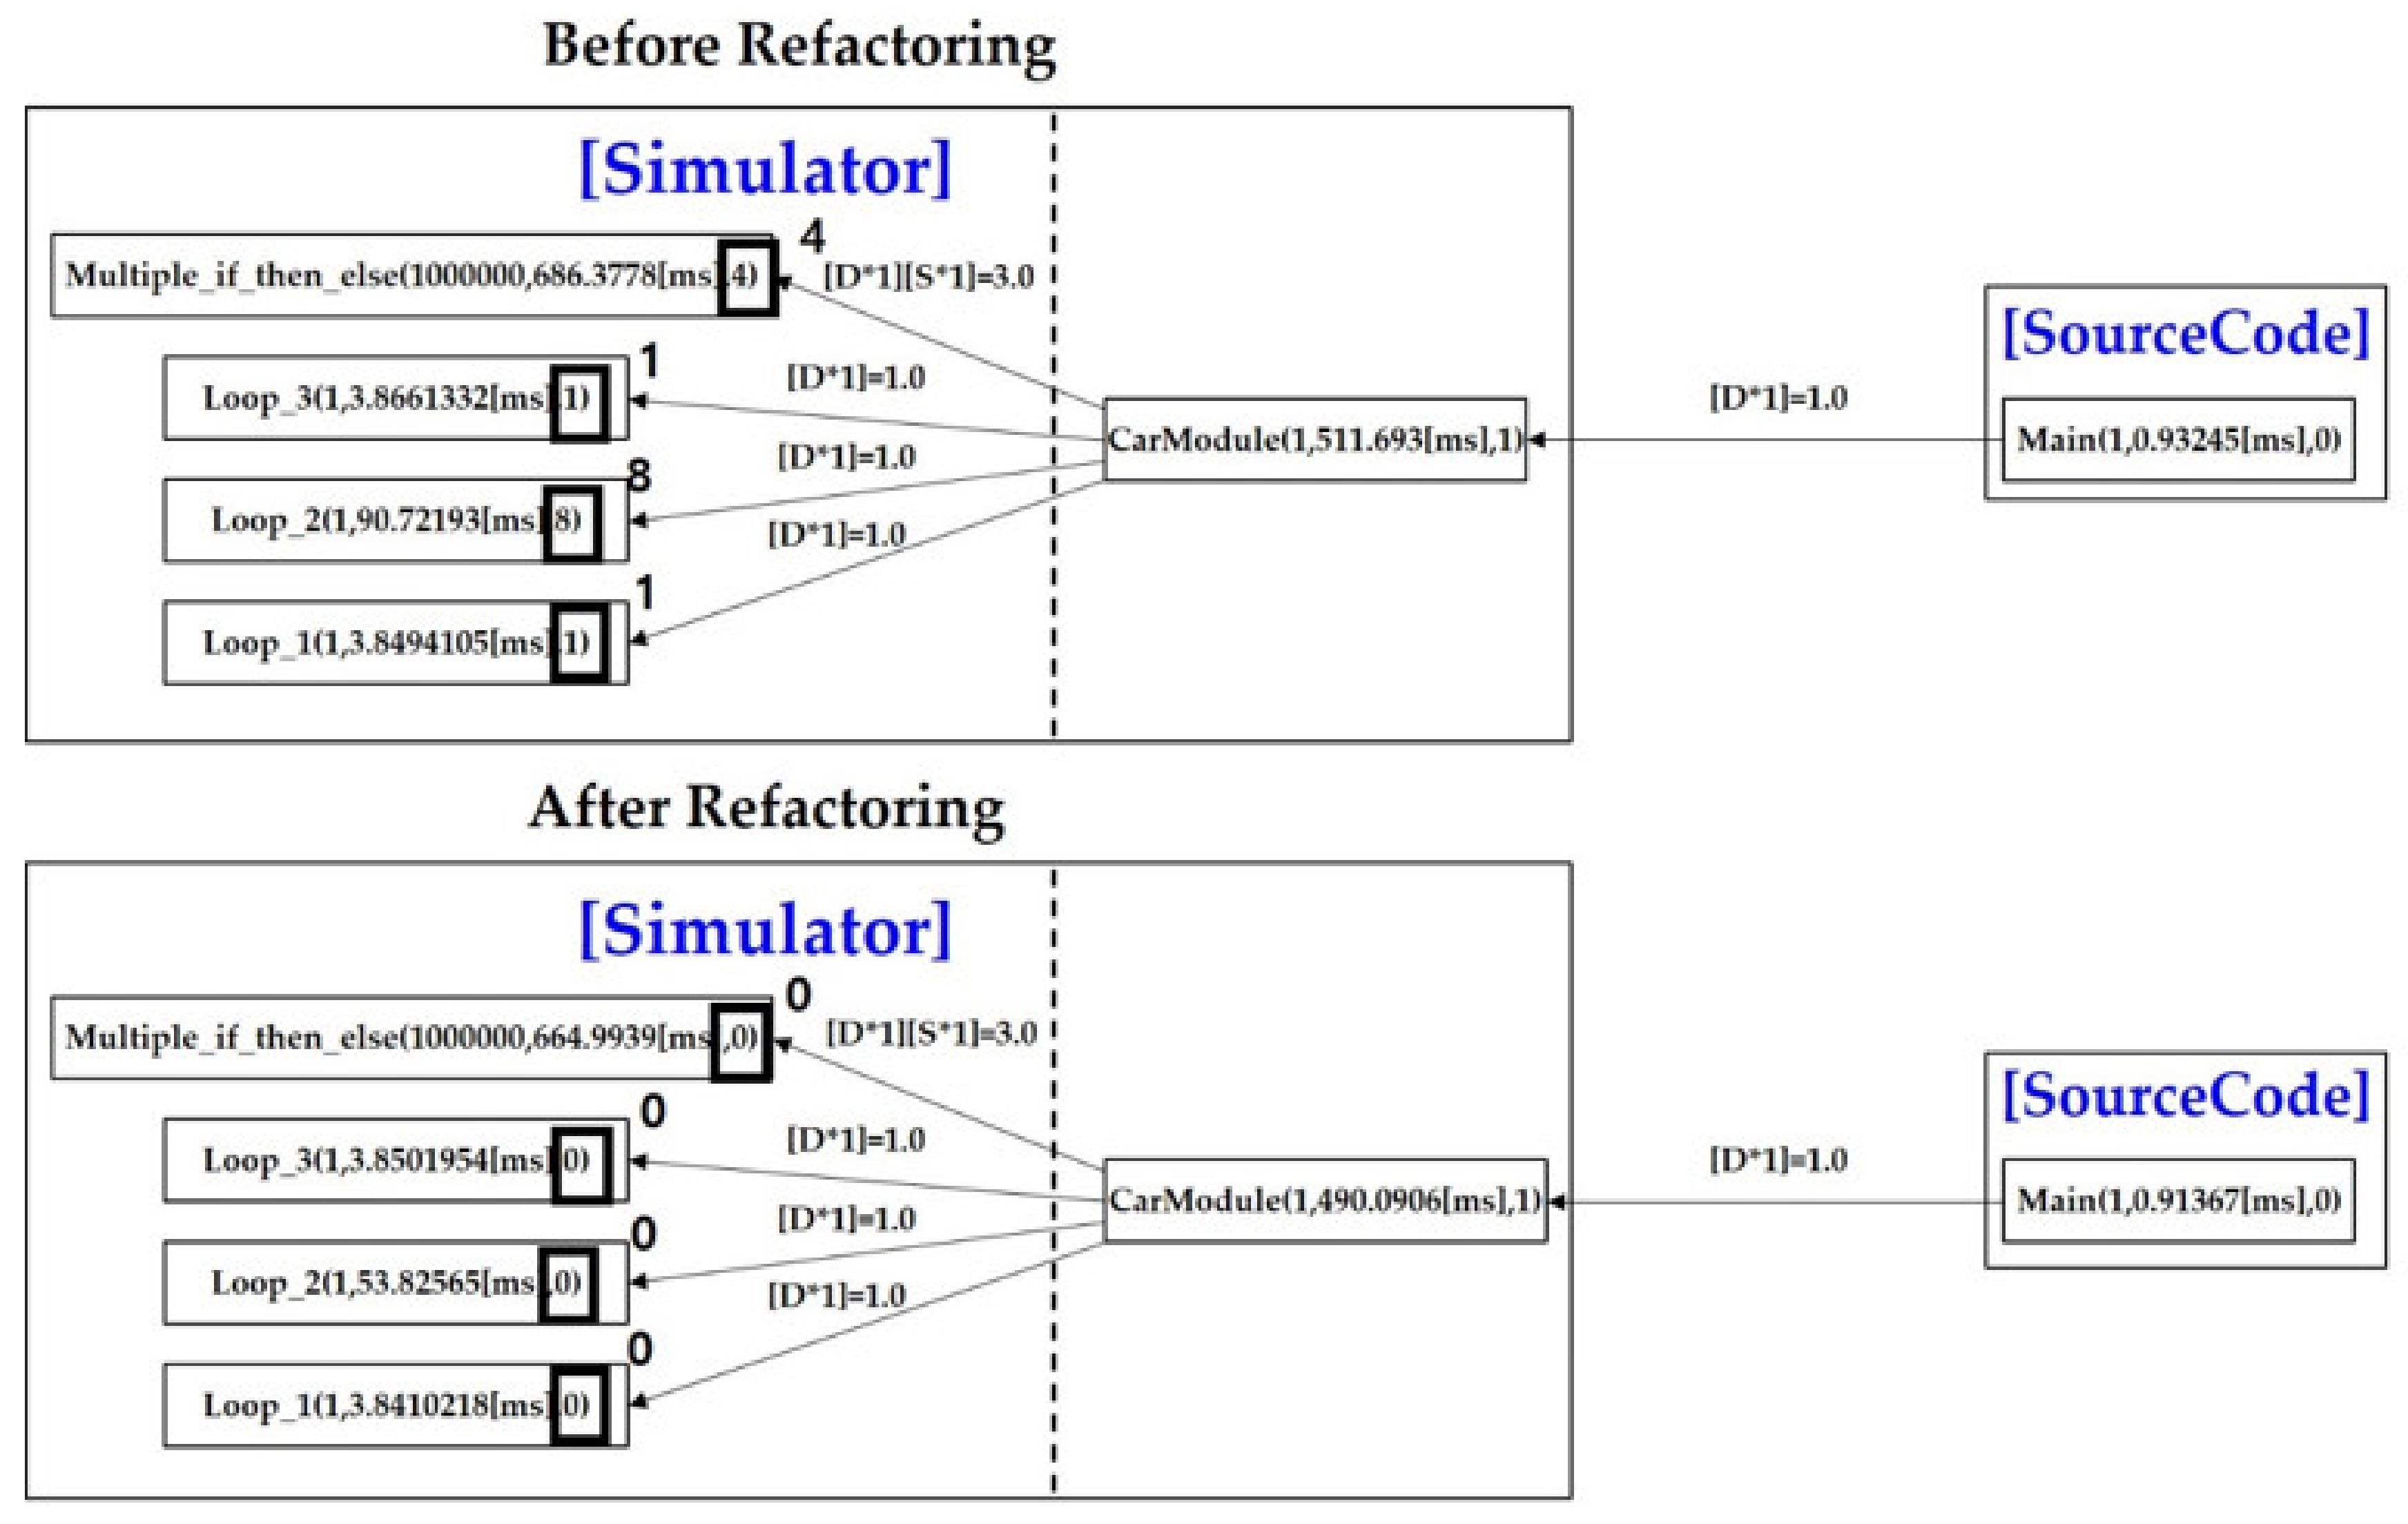
5.2. Identification Results in Terms of Performance Degradation Factors of the Basic Control Structures of ‘CarModule’
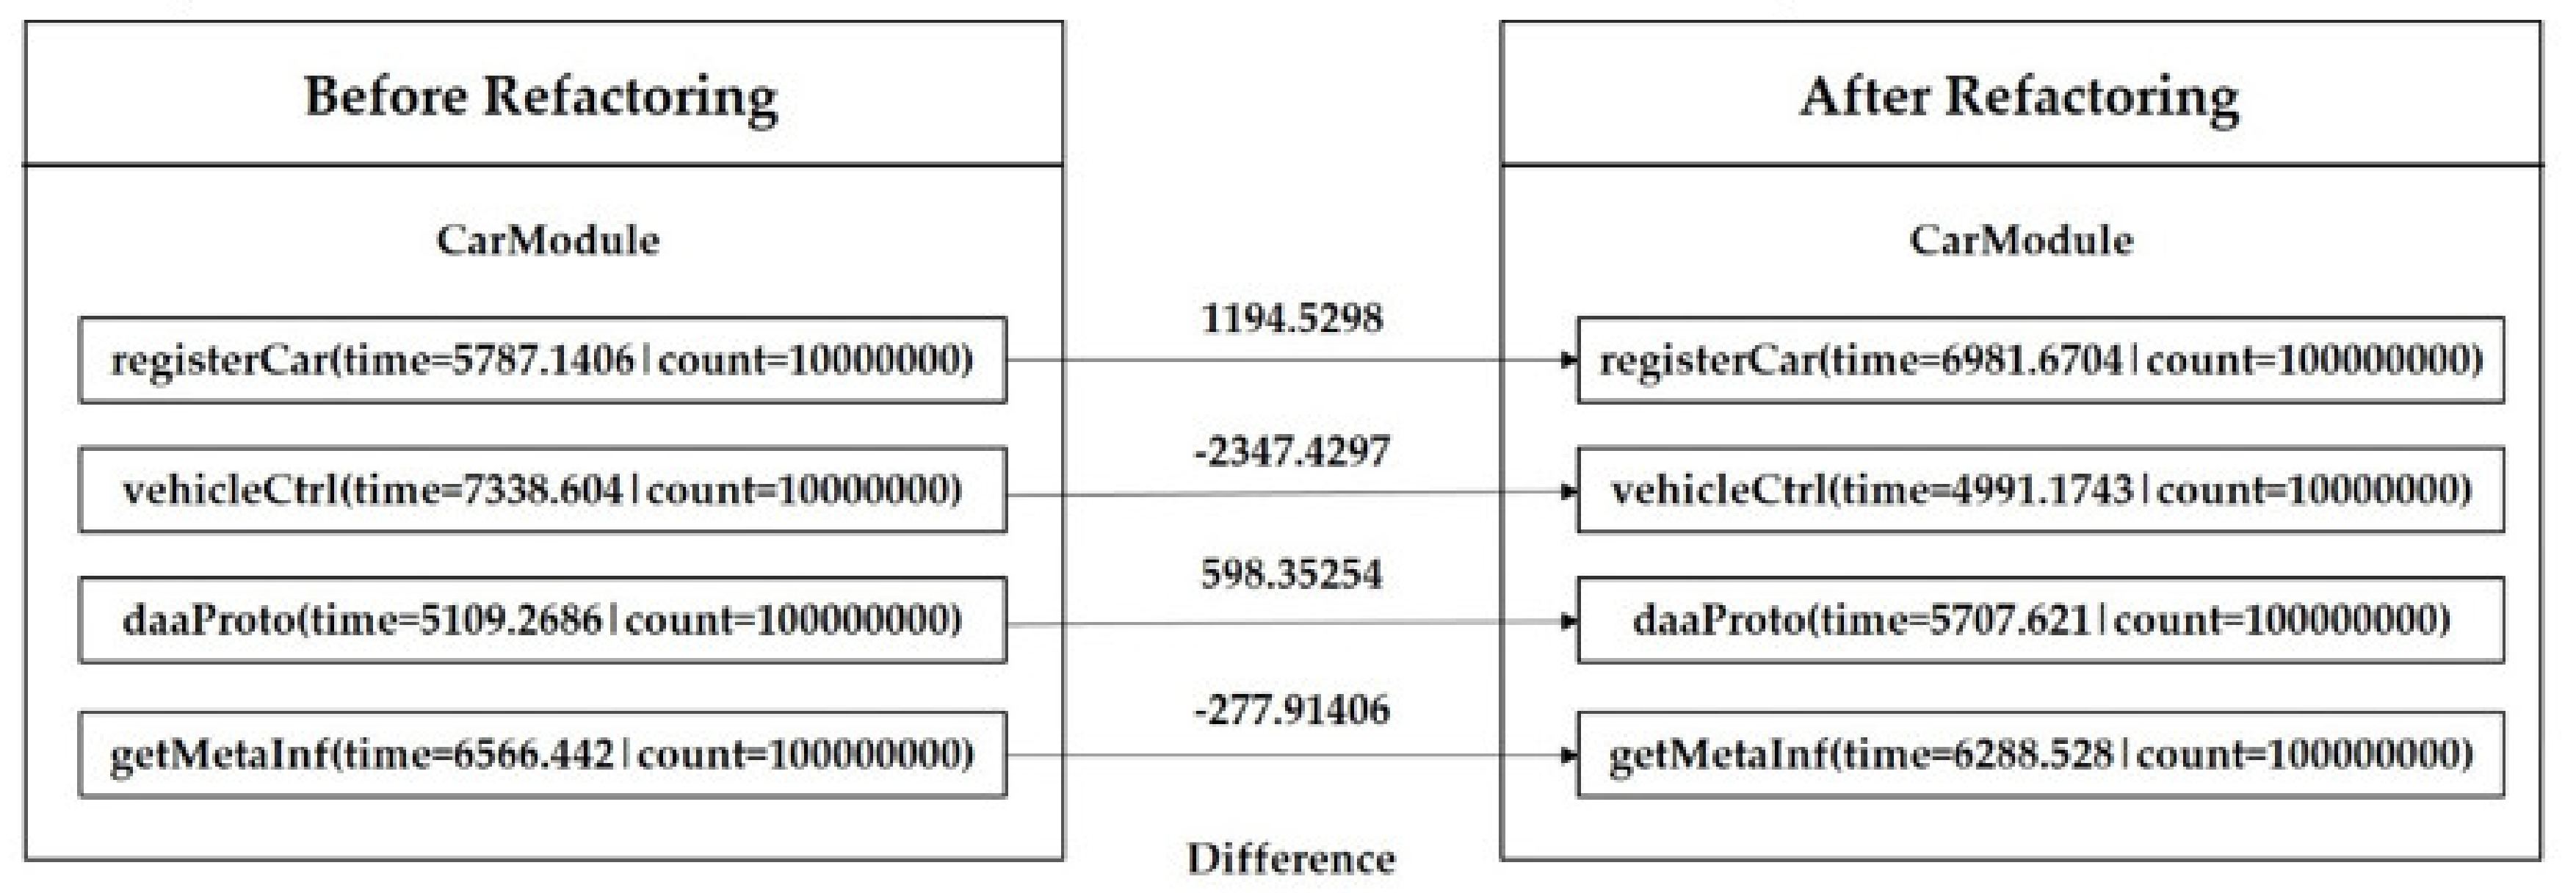
5.3. Performance Result in Terms of Performance Measurement
6. Conclusions
Author Contributions
Funding
Conflicts of Interest
References
- Lee, J.; Bagheri, B.; Kao, H.A. A cyber-physical systems architecture for industry 4.0-based manufacturing systems. Manuf. Lett. 2015, 3, 18–23. [Google Scholar] [CrossRef]
- Rajkumar, R.; De Niz, D.; Klein, M. Cyber-Physical Systems (SEI Series in Software Engineering); Addison-Wesley Professional: New Jersey, NJ, USA, 2017. [Google Scholar]
- Kim, W.; Jeon, I.; Lee, S.; Park, S. CPS Technology Trends. Wkly. Technol. Trends 2010, 1, 1–10. [Google Scholar]
- Son, H.S.; KIM, R.Y.C. The Pre-Testing for Virtual Robot Development Environment. IEICE Trans. Inf. Syst. 2018, 101, 1541–1551. [Google Scholar] [CrossRef]
- Son, H.S.; Kim, W.; Jeon, I.; Lee, H.; Jeon, J.; Kim, R.Y. A Method of Representing Topographic Environment Data through SEDRIS in Cyber Physical System. Korea Soc. Simul. Mag. 2011, 1, 11–18. [Google Scholar]
- PMD. Available online: https://pmd.github.io (accessed on 27 January 2020).
- Tina, B.; Vili, P.; Marjan, H. Towards a Reliable Identification of Deficient Code with a Combination of Software Metrics. Appl. Sci. 2018, 8, 1902. [Google Scholar]
- McCabe, T.J. A complexity measure, Software Engineering. IEEE Trans. Softw. Eng. 1976, 4, 308–320. [Google Scholar] [CrossRef]
- Hariprasad, T.; Vidhyagara, G.; Seenu, K.; Chandrasegar, T. Software Complexity Analysis using Halstead Metrics. In Proceedings of the International Conference on Trends in Electronics and Information (ICEI), Tirunelveli, India, 11–12 May 2017; pp. 1109–1113. [Google Scholar]
- Dand, Z.G.; Hemlata, V. Analysis and evaluation of quality metrics in software engineering. Int. J. Adv. Res. Comput. Commun. Eng. 2015, 4, 235–240. [Google Scholar]
- Microsoft. Available online: https://docs.microsoft.com/en-us/visualstudio/code-quality/ca1502?view=vs-2019 (accessed on 15 December 2019).
- Kwon, H.E.; Son, H.S.; Seo, C.Y.; Kim, Y.S.; Park, B.H.; Kim, R.Y.C. A Study on Comparing Object Oriented Paradigm with the Cohesion and Coupling Mechanism between Traditional Module. In Proceedings of the Korea Computer Congress, Busan, Korea, 25–27 June 2014; pp. 556–558. [Google Scholar]
- Koziolek, H. Performance evaluation of component-based software systems: A survey. Perform. Eval. 2010, 67, 634–658. [Google Scholar] [CrossRef]
- Henry, H. Java Performance and Scalability, A Quantitative Approach; Createspace: South Carolina, SC, USA, 2013. [Google Scholar]
- JMemProf. Available online: https://java-source.net/open-source/profilers/jmemprof (accessed on 12 January 2020).
- Java Memory Profiler (JMP). Available online: http://www.khelekore.org/jmp/ (accessed on 12 January 2020).
- NetBeans Profiler. Available online: https://profiler.netbeans.org/ (accessed on 13 January 2020).
- JAMon API. Available online: http://www.jamonapi.com/ (accessed on 28 December 2019).
- JBoss Profiler. Available online: https://developer.jboss.org/welcome (accessed on 11 December 2019).
- Java Interactive Profiler. Available online: https://sourceforge.net/projects/jiprof/ (accessed on 15 January 2020).
- Profiler4j. Available online: http://profiler4j.sourceforge.net/ (accessed on 15 January 2020).
- HPROF. A Heap/CPU Profiling Tool. Available online: https://docs.oracle.com/javase/8/docs/technotes/samples/hprof.html (accessed on 3 February 2020).
- Frank, A.; Al Aamri, Y.S.K.; Zayegh, A. IoT based smart traffic density control using image processing. In Proceedings of the 2019 4th MEC International Conference on Big Data and Smart City (ICBDSC), Muscat, Oman, 15–16 January 2019. [Google Scholar]
- Wahab, O.A.; Mourad, A.; Otrok, H.; Bentahar, J. CEAP: SVM-based intelligent detection model for clustered vehicular ad hoc networks. Expert Syst. Appl. 2016, 50, 40–54. [Google Scholar] [CrossRef]
- Wahab, O.A.; Otrok, H.; Mourad, A. VANET QoS-OLSR: QoS-based clustering protocol for vehicular ad hoc networks. Comput. Commun. 2013, 36, 1422–1435. [Google Scholar] [CrossRef]
- Hong, K. Performance, Security and Safety Requirements Testing for Smart Systems through Systematic Software Analysis. Ph.D. Thesis, The University of Michigan, Ann Arbor, MI, USA, 2019. [Google Scholar]
- Kang, G.-H.; Kim, R.Y.C.; Lee, J.H. A Case Study on Performance Improvement through extracting Software Performance Degradation Factors. Int. J. Appl. Eng. Res. 2015, 10, 90. [Google Scholar]
- Park, B.K.; Kang, G.; Kim, R.Y.C. Performance Measurement of Procedural Code for CPS Multiple-Joint Robotics Simulator. Adv. Eng. ICT-Converg. Proc. (AEICP) 2019, 38, 75–78. [Google Scholar]
- Park, B.K.; Kang, G.; Kim, R.Y.C. Software Visualization Approach for Performance Measurement of Object-Oriented Code based on Cyber-Physical Systems (CPS) Software. Adv. Eng. ICT-Converg. Proc. (AEICP) 2019, 38, 28–30. [Google Scholar]
- Park, J.; Son, H.S.; Kim, R.Y. Developing an Automatic Tool for Visualizing Source Code against Bad Smell Patterns. In Proceedings of the Global Conference on Engineering and Applied Science, Okinawa, Japan, 7–9 July 2017. [Google Scholar]
- Source Navigator NG. Available online: http://sourcenav.sourceforge.net/ (accessed on 16 December 2019).
- Appropriate Uses For SQLite. Available online: http://www.sqlite.org/whentouse.html (accessed on 8 January 2020).
- Graphviz. Available online: http://www.graphviz.org/ (accessed on 21 January 2020).
- National IT Industry Promotion Agency. Software Engineering White Book; NIPA: JinCheon, Korea, 2018.
- Cppcheck. Available online: http://cppcheck.sourceforge.net/ (accessed on 25 January 2020).
- Park, B.K.; Jeon, B.K.; Kim, R.Y.C. Improvement Practices in the Performance of a CPS Multiple-Joint Robotics Simulator. Appl. Sci. 2020, 10, 185. [Google Scholar] [CrossRef]
- Kang, G.; Kim, R.Y.C.; Lee, S.E.; Jeon, S.N. Extracting performance factors against performance degradation through Code Visualization. In Proceedings of the International Conference on Convergence Technology, Hokkaido, Japan, 29 June–2 July 2015; pp. 276–277. [Google Scholar]
- Lee, H.J.; Kim, R.Y.C.; Son, H.S. Evaluation of a Smart Traffic Light System with an IOT-based Connective Mechanism. Int. Inf. Inst. 2017, 20, 953–961. [Google Scholar]


| Complexity | Error Rate |
|---|---|
| Less than 10 | 5% |
| 11~20 | 20% |
| 21~50 | 41% |
| More than 51 | 60% |
| Profiler | Live Object Analysis | CPU Sampling | Heap Trace | Thread Analysis | Method Analysis | Standalone (Console) | CallTree | Open Source | Automation Possibilities | Specificity |
|---|---|---|---|---|---|---|---|---|---|---|
| JMemProf | ○ | × | ○ | × | × | × | × | ○ | × | Ant Dependency |
| Java memory profiler (JMP) | ○ | × | ○ | ○ | ○ | × | × | ○ | × | Writing Code Directly |
| NetBeans Profiler | ○ | ○ | ○ | ○ | ○ | × | ○ | ○ | × | Net Bean IDE Dependency |
| JAMon API | × | × | × | × | ○ | × | ○ | ○ | × | Writing Code Directly |
| JBoss Profiler | × | × | × | × | ○ | ○ | × | ○ | × | Java Server Application Only (Using API) |
| Java Interactive Profiler (JIP) | ○ | ○ | ○ | × | ○ | ○ | ○ | ○ | ○ | Network Communication required between the JVM |
| Profiler4j | × | ○ | ○ | × | ○ | ○ | ○ | ○ | × | Network Communication required between the JVM |
| Hprof | ○ | ○ | ○ | × | ○ | ○ | × | ○ | ○ | Profiler provided by default in Oracle |
| Coupling | Sample Source Code | Query |
|---|---|---|
| Data | Data data = new Data(); data dataTest(1, 1.01f, 2, 2); | Select REFER_CLASS_NAME, REFER_SYMBOL_NAME, REFERREED_CLASS_NAME, Referred_symbol_name, from SNDB_BY where referred_type = ’mi’ |
| Stamp | Stamp stmp = new Stamp(); SampleDataClass sdc = new SampleDataClass(1, 1.01f, 2, 2); Stmp.stampTest(sdc); | Select argument_types from SNDB_MD where class_name = ‘“ + class + ”’ and method_name = ‘“ + method + ”’ |
| Pattern Name | Code Pattern | Regular Expression Rule (for C) | XPath Rule (PMD) (for Java) |
|---|---|---|---|
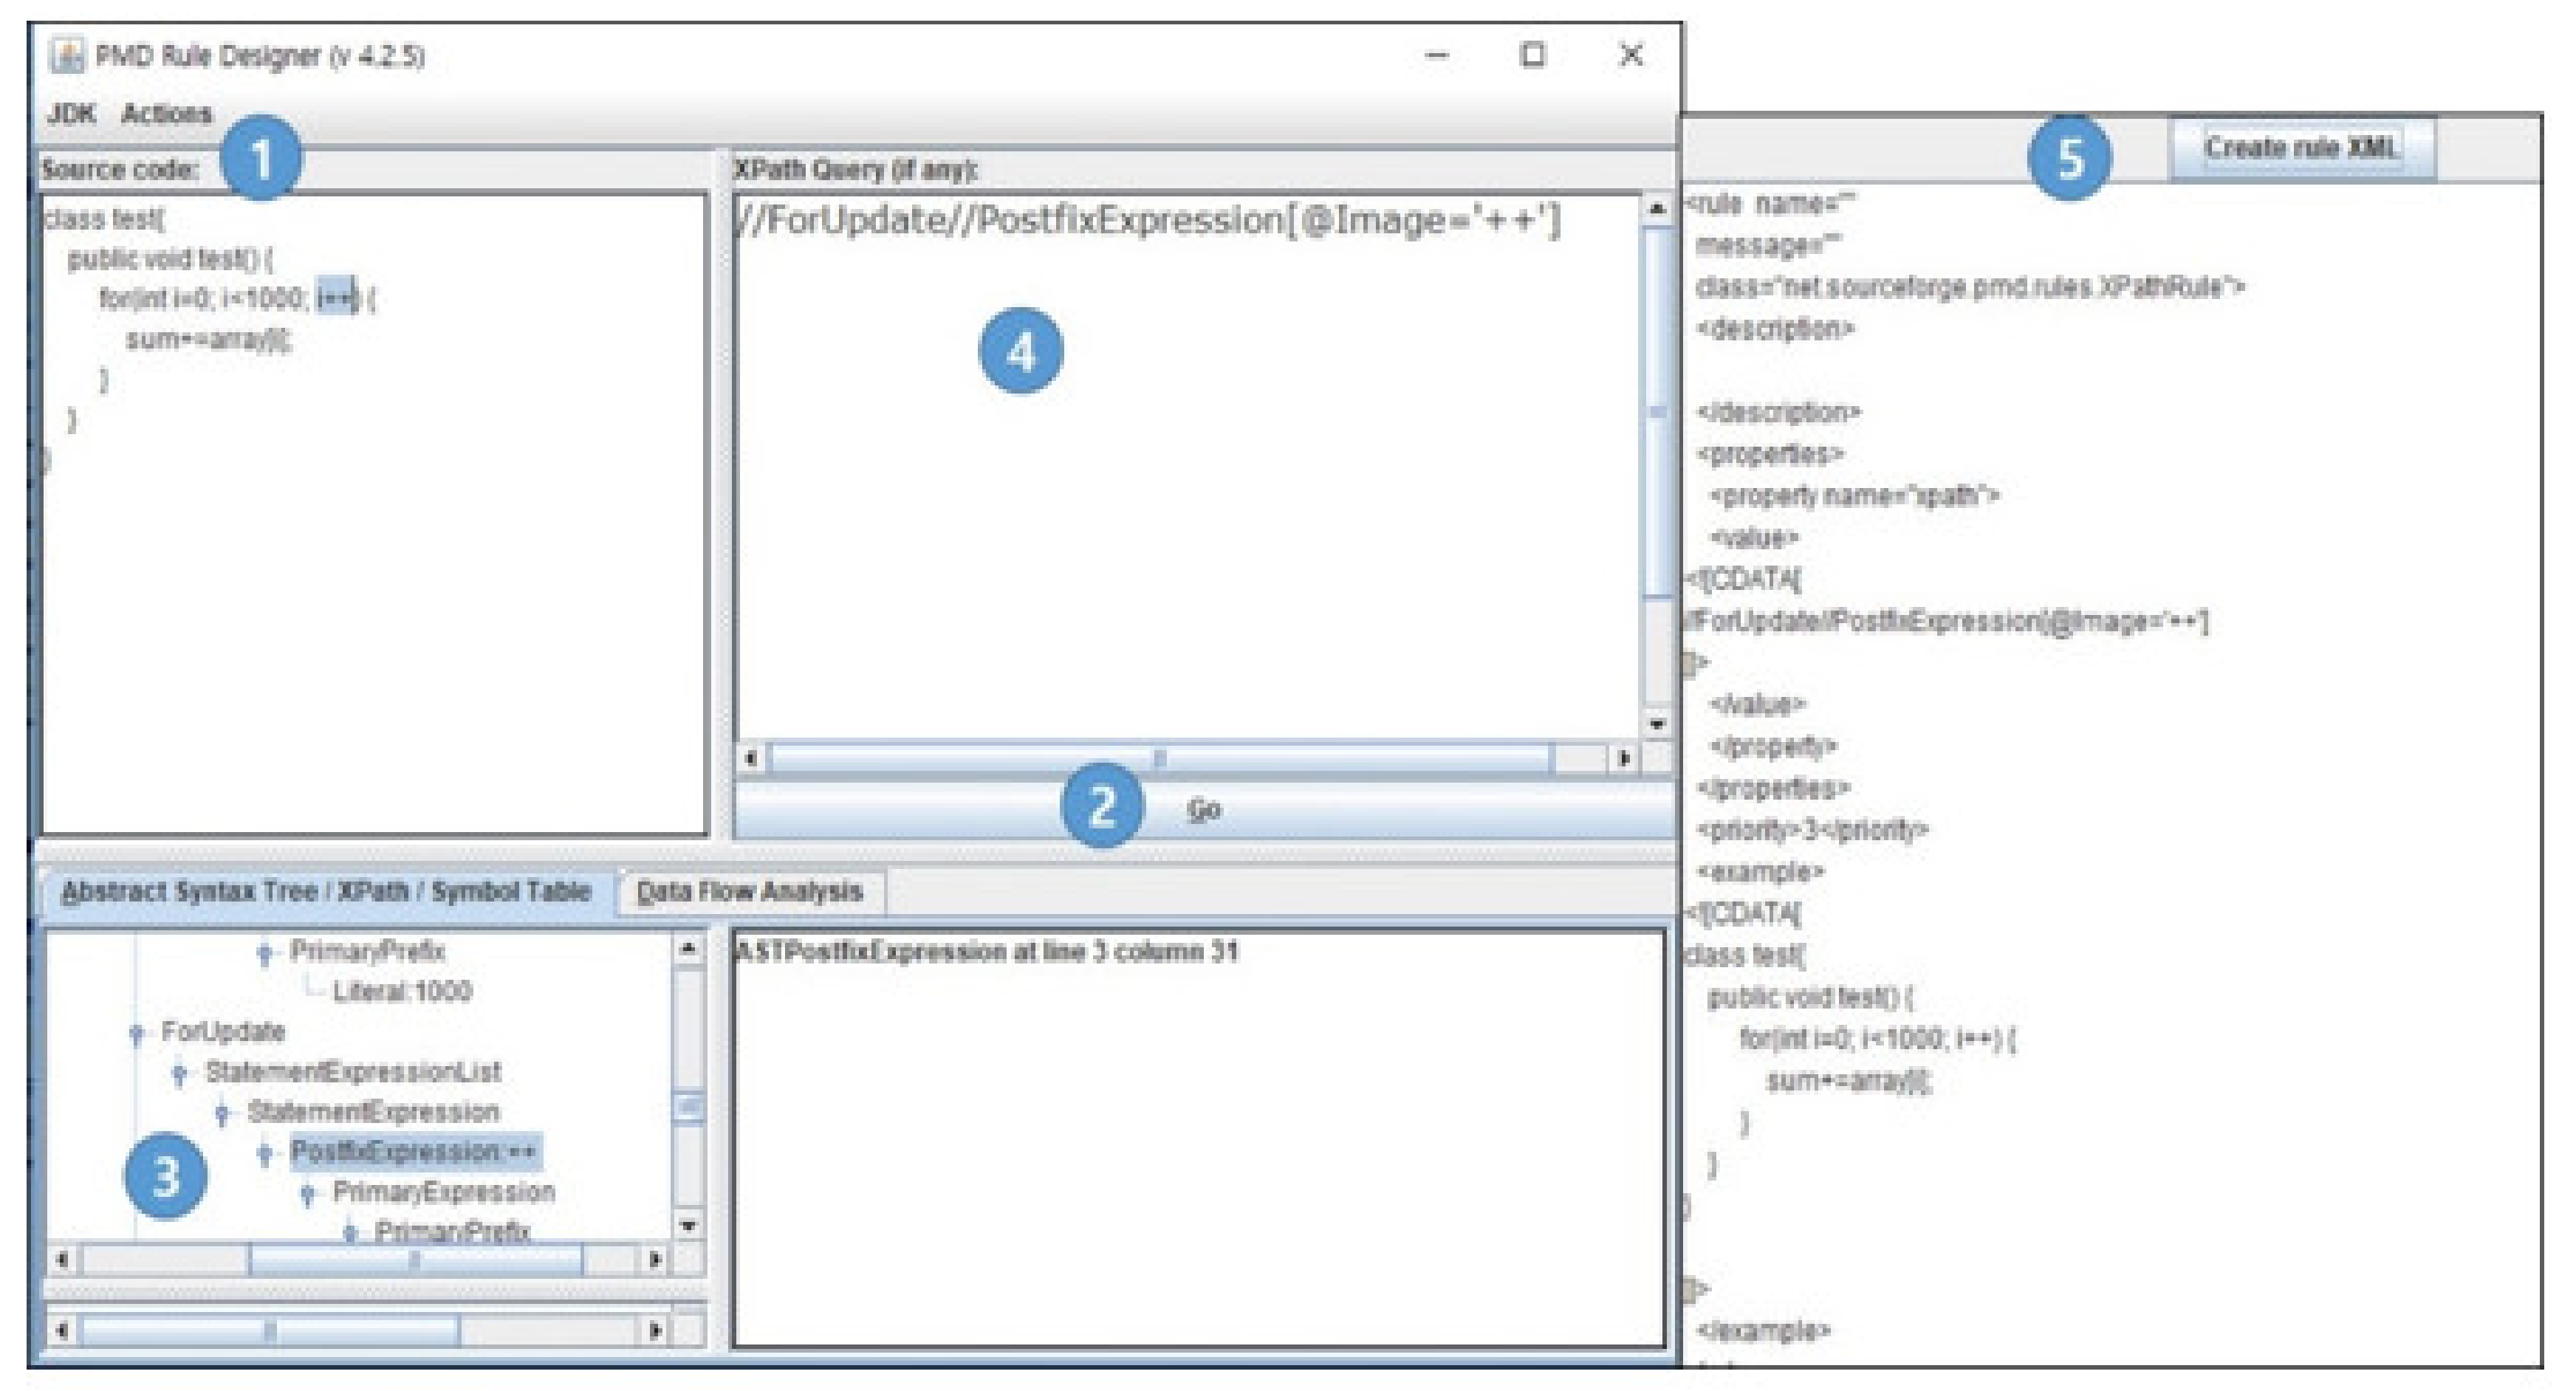
| (1) Loop unrolling and loop down count | int sum = 0; for (int I = 0; i<1000; i++) { sum + = array[i]; } | [a-z,A-Z,_]([a-z,A-Z,_,0-9])* \< ([0-9])+; [a-z,A-Z,_]([a-z,A-Z,_,0-9])* \+\+ | //ForUpdate//PostfixExpression[@Image=’++’] |
| (2) Unnecessary control statements of inner loops | for(I = 0; i<1000; i++){ if(i&&0 × 01) { do_odd(i); }else{ do_even(i); } } | [a-z,A-Z,_]([a-z,A-Z,_,0-9])* \< ([0-9])+; [a-z,A-Z,_]([a-z,A-Z,_,0-9])* \+\+\) \{ if\( | //ForStatement//Statement//Block//BlockStatement//Statement//IfStatement |
| (3) Multiple if-then-else | if (a==1){ }else if (a==2){ }else if (a==3){ }else if (a==4){ }..... | if\( ([a-z,A-Z,_,0-9, \b, \s, \+,, V, \*, \%%, -\>, \>, \<, \[, \]])* == ([0-9])+\) | //Statement//IfStatement[@Else=’true’] |
| Number | Name | Description |
|---|---|---|
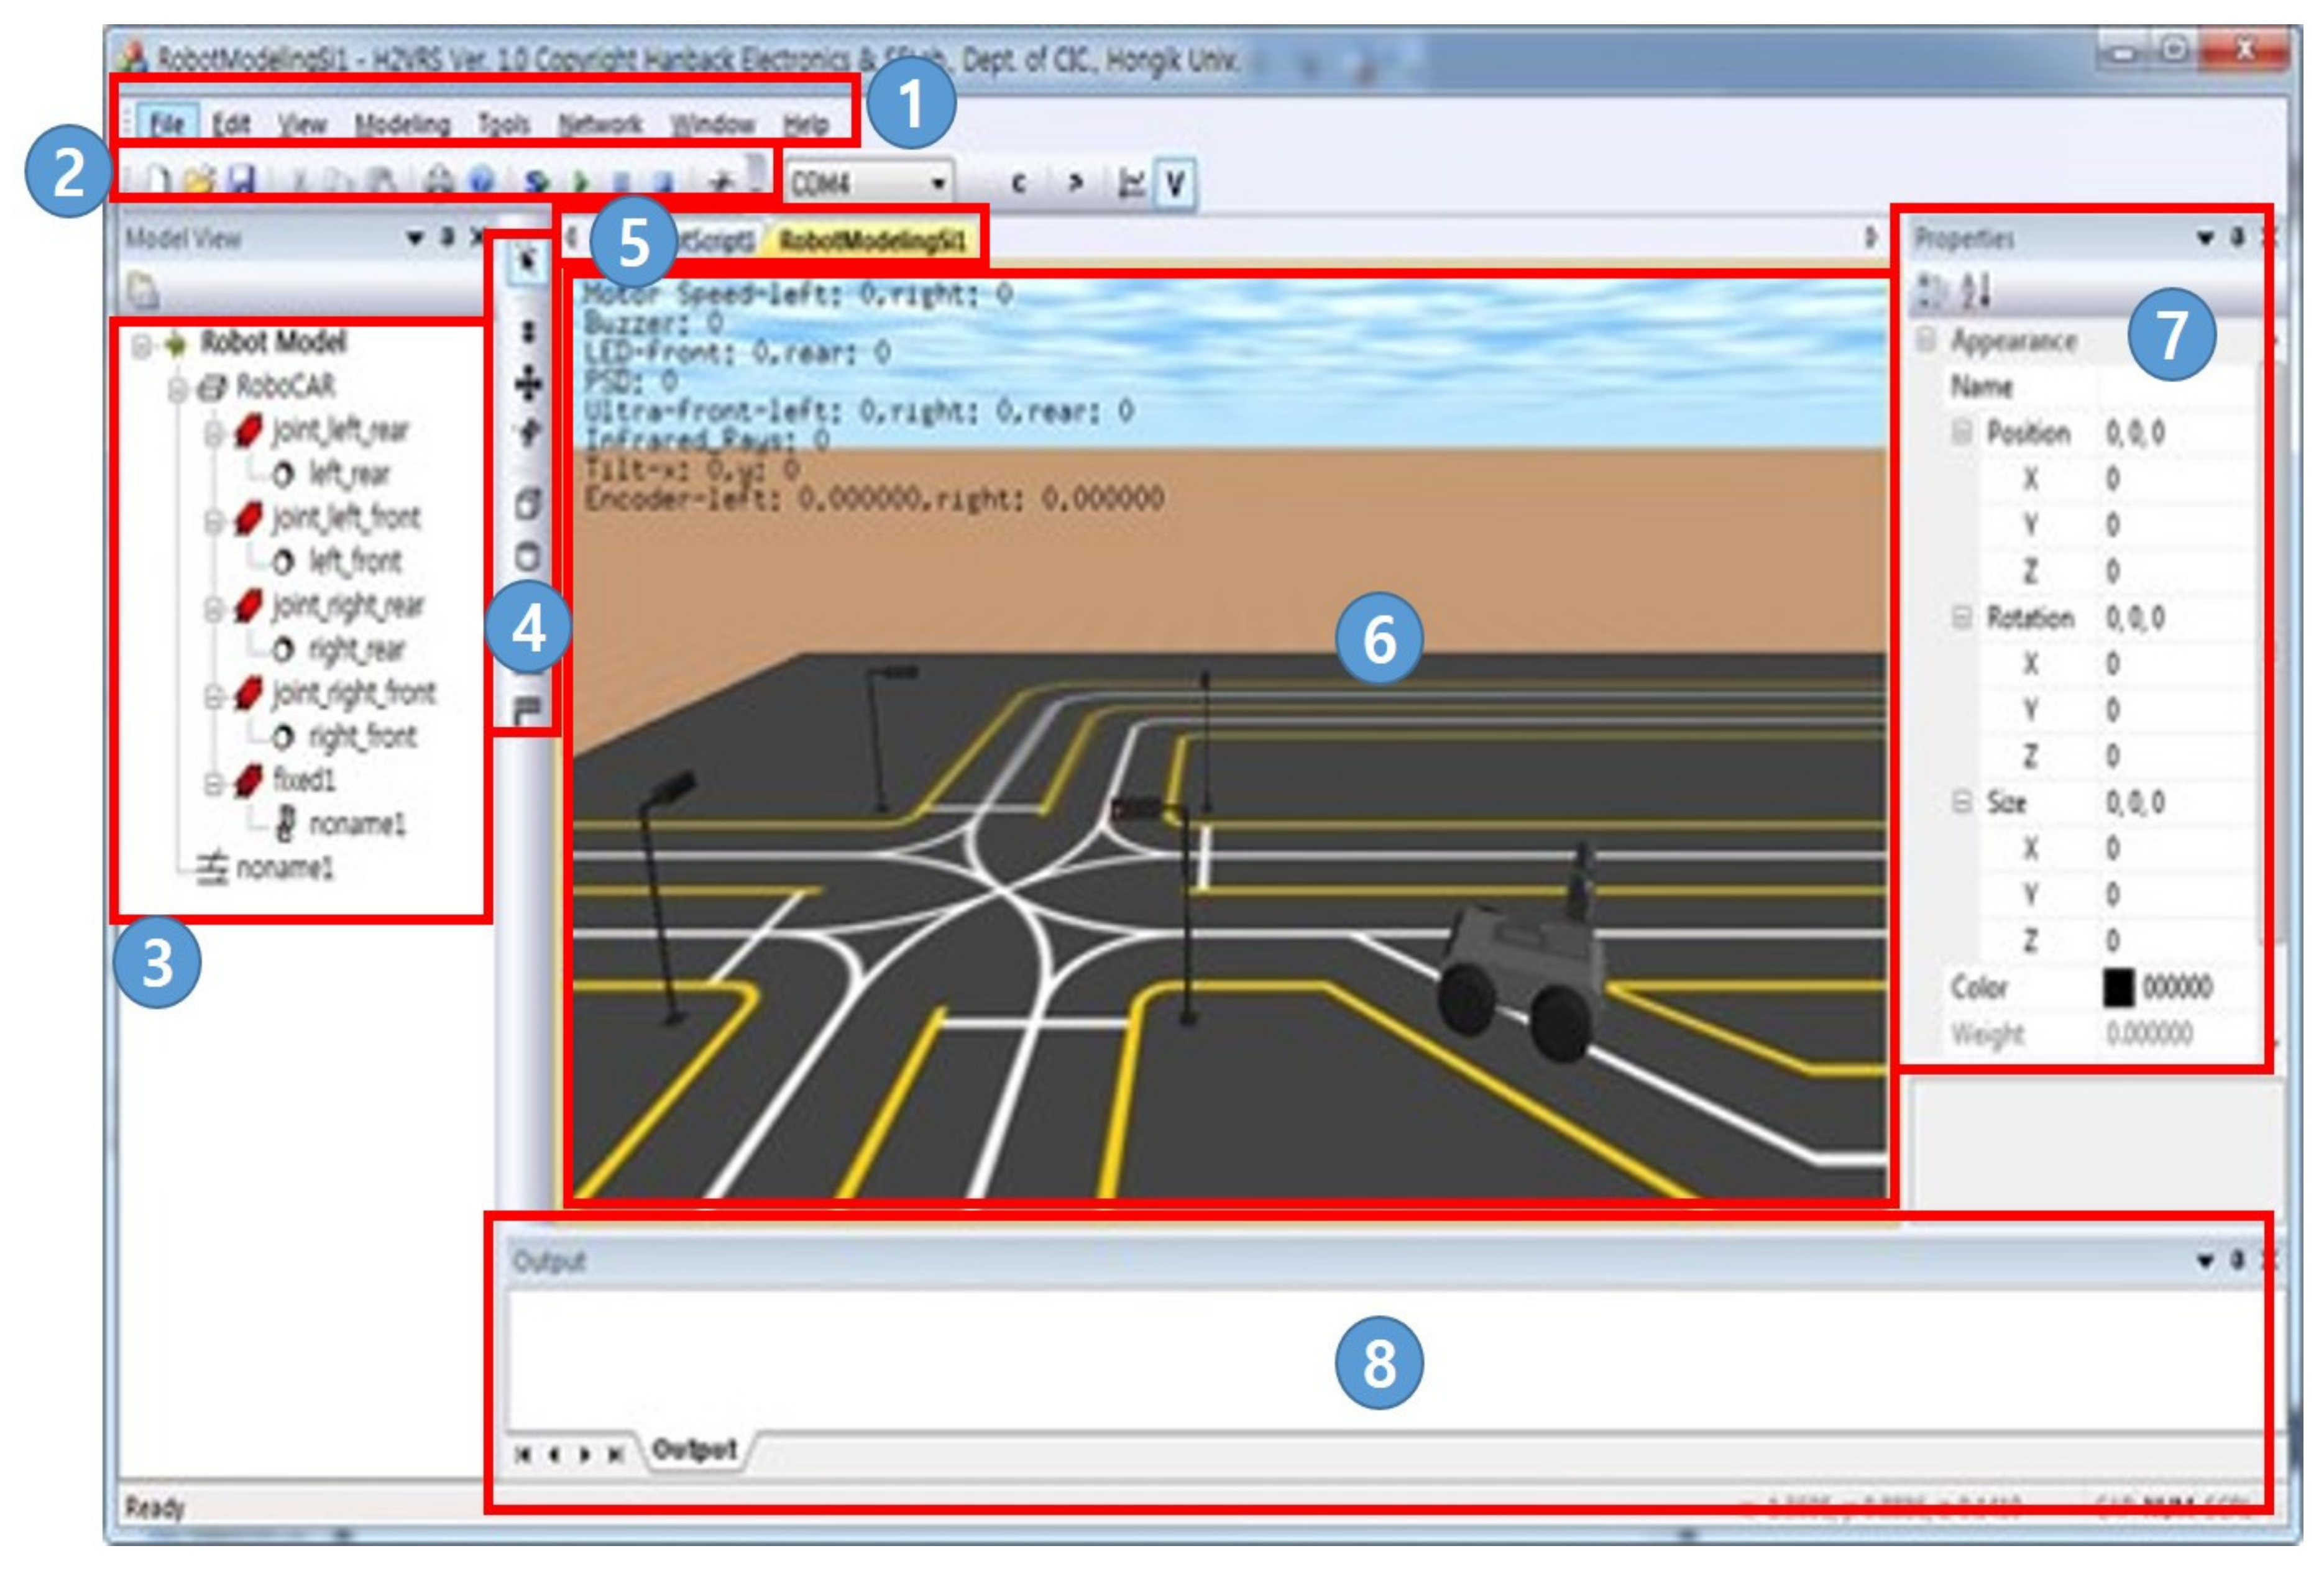
| 1 | MenuBar | Provide functions related to simulation such as saving, loading, starting, and stopping. |
| 2 | Icon Bar | Frequent used icons among the functions in the menu bar. |
| 3 | Model View | Assemble with part modules of the simulation view. |
| 4 | ToolBar | Provides tools for drawing robot models. |
| 5 | Simulation View Tab | Manage multiple simulation views. |
| 6 | Simulation View | Screen for running a robot model. |
| 7 | Property | Manage properties of robot model. |
| 8 | Output | Output the robot modeling and debugging results. |
| Weights of Coupling | CarModule | DirectionCtrl | CarSimulation | Vehicle | Object_Management_Group | Profile | Tagged_value | _tagmotorStatus | tagCrosswalk_traffic_light | |
|---|---|---|---|---|---|---|---|---|---|---|
| Checkpoint | ||||||||||
| Baseline | 138 + 36 = 174 | 12 | 6 + 12 + 6 = 24 | 96 + 12 + 6 + 28 = 142 | 8 | 20 + 6 = 26 | 20 + 18 = 38 | 0 | 0 | |
| Checkpoint1 | 113 + 36 = 149 | 12 | 6 + 12 + 6 = 24 | 72 + 12 + 6 + 28 = 118 | 8 | 15 + 6 = 21 | 16 + 14 = 30 | 0 | 0 | |
| Checkpoint2 | 97 + 32 = 129 | 7 | 2 + 8 + 2 = 12 | 29 + 3 + 6 + 18 = 56 | 3 | 16 + 6 = 22 | 12 + 10 = 22 | 0 | 0 | |
| Checkpoint3 | 92 + 17 = 109 | 2 | 2 + 3 + 2 = 7 | 28 + 3 + 6 + 10 = 47 | 3 | 11 + 6 = 17 | 7 + 6 = 13 | 0 | 0 | |
| Performance | Before | After | Difference Value | |
|---|---|---|---|---|
| Refactoring | ||||
| registerCar | 5787.1406 | 6981.6704 | 1194.5298 | |
| vehicleCtrl | 7338.604 | 4991.1743 | −2347.4297 | |
| daaProto | 5109.2686 | 5705.621 | 596.3524 | |
| getMetaInf | 6566.442 | 6288.528 | −277.914 | |
| Total | 24,801.455 | 23,966.994 | −834.4615 | |
© 2020 by the authors. Licensee MDPI, Basel, Switzerland. This article is an open access article distributed under the terms and conditions of the Creative Commons Attribution (CC BY) license (http://creativecommons.org/licenses/by/4.0/).
Share and Cite
Park, B.K.; Kang, G.-H.; Son, H.S.; Jeon, B.; Kim, R.Y.C. Code Visualization for Performance Improvement of Java Code for Controlling Smart Traffic System in the Smart City. Appl. Sci. 2020, 10, 2880. https://doi.org/10.3390/app10082880
Park BK, Kang G-H, Son HS, Jeon B, Kim RYC. Code Visualization for Performance Improvement of Java Code for Controlling Smart Traffic System in the Smart City. Applied Sciences. 2020; 10(8):2880. https://doi.org/10.3390/app10082880
Chicago/Turabian StylePark, Bo Kyung, Geon-Hee Kang, Hyun Seung Son, Byungkook Jeon, and R. Young Chul Kim. 2020. "Code Visualization for Performance Improvement of Java Code for Controlling Smart Traffic System in the Smart City" Applied Sciences 10, no. 8: 2880. https://doi.org/10.3390/app10082880
APA StylePark, B. K., Kang, G.-H., Son, H. S., Jeon, B., & Kim, R. Y. C. (2020). Code Visualization for Performance Improvement of Java Code for Controlling Smart Traffic System in the Smart City. Applied Sciences, 10(8), 2880. https://doi.org/10.3390/app10082880