Article

Photo-Thermoelectric Conversion of Plasmonic Nanohole Array

1
Division of Advanced Electrical and Electronics Engineering, Tokyo University of Agriculture and Technology, 2-24-16 Naka-cho, Koganei-shi, Tokyo 184-8588, Japan
2
Department of Electrical and Electronic Engineering, Tokyo University of Agriculture and Technology, 2-24-16 Naka-cho, Koganei-shi, Tokyo 184-8588, Japan
3
School of Electronics and Computer Science, University of Southampton, Southampton SO17 1BJ, UK
*
Author to whom correspondence should be addressed.
Appl. Sci. 2020, 10(8), 2681; https://doi.org/10.3390/app10082681
Submission received: 28 February 2020 / Revised: 6 April 2020 / Accepted: 7 April 2020 / Published: 13 April 2020
(This article belongs to the Special Issue Active Nano Optics)

Abstract

:
Plasmonic photo-thermoelectric conversion offers an alternative photodetection mechanism that is not restricted by semiconductor bandgaps. Here, we report a plasmonic photodetector consisting of an ultra-thin silver film with nanohole array, whose photodetection mechanism is based on thermoelectric conversion triggered by plasmonic local heating. The detector exhibits a maximum photocurrent at the wavelength of the surface plasmon polaritons, determined by the periodicity of the nanoholes. Hence, the response wavelength of the detector can be controlled via the morphological parameters of the nanohole pattern. The contribution of plasmonic local heating to thermoelectric conversion is verified experimentally and numerically, enabling discussion on the mechanisms governing light detection. These results provide a starting point for the development of other nanoscale photodetectors.

1. Introduction

Photodetection by semiconductors occurs via a photocurrent flow associated with electron-hole pair generation via light absorption. The absorption band is strictly limited by the value of the semiconductor bandgap, meaning that the response-wavelength range for a semiconductor photodetector is determined by its bandgap. A straightforward method to tune the response-wavelength range of photodetectors is to utilize color filters, and this method has been adopted for conventional image sensors. However, the use of color filters results in limitations for the minimum size of the detection device, and therefore, different techniques are needed for device miniaturization.
Plasmons are an alternative approach for realizing the tuning of photodetector response wavelengths [1,2]. In fact, the response wavelength of a plasmonic photodetector driven by hot carriers can be completely controlled via the design of the metallic nanostructures, regardless of the intrinsic bandgap of the semiconductor [3,4,5,6]. Using this approach, Sobahni et al. demonstrated that the widths of gold nanoslits on a Si substrate determined the photodetection response wavelengths [3].
Meanwhile, we demonstrated a plasmonic photodetector driven by thermoelectric conversion—an alternative approach for photodetection—triggered by plasmonic local heating [7]. Our device consisted of a thin film of a thermoelectric material embedded with plasmonic atoms that generated plasmonic local heating and created a thermal gradient inside the film as a consequence of light detection by absorption, resulting in Seebeck voltage generation. Similarly, many studies of light detection via thermoelectric conversion, in, for example, carbon nanotubes [8,9], graphene [10,11], carbon sprays [12], and commercial thermoelectric devices [13] triggered by metal-nanostructure plasmon resonance, have been reported. These light detection systems were based on thermoelectric materials combined with plasmonic atoms used as light receivers. However, similar light detection via thermoelectric conversion can be realized by using a conductive single nanofilm that includes plasmonic couplers such as prisms or nanohole arrays. Weeber et al. reported thermo-electrical detection of surface plasmon propagation on a gold waveguide [14]. Mauser et al. designed the resonant thermoelectric nanostructure to support guided-mode resonances with spectrally sharp absorption profiles, realizing tunable photodetection across wavelengths from the visible to the mid-infrared (IR) region [15]. More recently, room-temperature Seebeck IR detection using patterned graphene was demonstrated [16,17]. The presence of nanohole arrays on the graphene surface resulted in graphene plasmon excitation, allowing dramatic enhancement of the light-matter interaction [18,19]. These demonstrations illustrate the thermoelectrical photodetection capabilities of a conductive single nanomaterial that supports plasmons and thermoelectric conversion, and they suggest that thermoelectric nanophotonics have great potential for optoelectronic applications. However, the underlying photodetection mechanisms for single and patterned nanomaterials have not been investigated; for example, the amount of local heating contributing to these effects has yet to be determined. In order to discuss the potential of the patterned conductive nanomaterials as practical photodetectors, further studies are required. Specifically, the amount of plasmonic local heating at the nanoscale should be clarified in order to better examine the mechanisms of operation.
In this study, we fabricated an ultra-thin silver (Ag) film punctuated by a nanohole array and examined its potential for plasmonic photodetection via thermoelectric conversion. We verified the amount of plasmonic local heating contributing to photodetection experimentally and numerically and compared this with the results of thermoelectric simulations to discuss the mechanism of photodetection.

2. Materials and Methods

Figure 1a shows a schematic of a Ag thin-film photodetector with nanoholes fabricated on a substrate. A positive resist film (Nihonzeon ZEP520A) with a thickness of 216 nm was prepared on a glass substrate by spin-coating. A pattern of nanoholes was fabricated over an area of 500 × 500 µm2 by electron beam lithography (JEOL; JBX-6300FS). The periodicity of the nanohole array was varied; 250, 300, and 400 nm were all used for inter-hole spacings in different versions of the sample. Then, Ag thin film (40 nm thickness, 2.0 mm width, and 6.0 mm length) was deposited on the resist film by thermal evaporation. This fabrication process created a Ag nanodot at the bottom of each nanohole. Figure 1b shows a field-emission scanning electron microscopy (FE-SEM; Hitachi High-Technologies Corporation; SU8010) image of a top view of the nanohole pattern. Reflection spectra for the Ag nanohole array were measured using a microscopic spectrometer (Ocean Optics HR4000). To carry out thermoelectrical testing of the nanohole-array Ag device, an area encompassing the nanohole pattern was irradiated by a diode laser (Thorlabs) (Supplementary Materials Figure S1); the beam cross-section diameter and the beam full width at half maximum (FWHM) were 70 µm and 50 µm, respectively. The optical power and power density of the laser beam were 10 mW and 2.6 × 10² W/cm2, respectively. Gold wires were connected to both edges of the Ag thin film using Ag paste. The distance between the two areas of Ag paste was 4.5 mm, and the edge of the nanohole area was located at 0.5 mm away from the edge of the nearest Ag paste area. The photocurrent generated in the Ag thin film was measured using a digital multimeter (KEITHLEY 2000). In fact, the location of the Ag nanohole area was optimized to maximize photocurrent because the location of the illuminated area determines the photocurrent flowing between the two Ag paste islands, based on thermoelectric principles. For this reason, the Ag nanohole area was placed very close to one of the Ag paste islands.

3. Results and Discussion

3.1. Optical and Electrical Properties of Ag Thin Film with Nanoholes

Figure 2a shows an extinction spectrum of the Ag nanohole array with a periodicity of 300 nm and a hole diameter of (192 ± 3.22) nm (sample number: 12). The extinction peak was observed at 687 nm, indicating excitation of surface plasmon polaritons on the Ag nanohole array. Finite-element method simulations (COMSOL Multiphysics) produced an extinction spectrum (Supplementary Materials Figure S2) similar to the measured spectrum. The photocurrent flowing through the Ag thin film under illumination was examined. A wavelength of 690 nm, which was close to the plasmon resonance wavelength for the nanoholes, was used to induce an electric current of 173 nA by illuminating of the nanohole array. By contrast, illumination of the Ag film in the vicinity of the nanoholes generated an electric current of 11 nA, which was comparable to the level of the multimeter noise, approximately 8 nA (Supplementary Materials Figure S3). Furthermore, the amount of the electric current was proportional to the optical power, which is consistent with the results of previous investigations [7]. Therefore, we concluded that light illumination of the nanohole array is indispensable for the electric current generation. External quantum efficiency (EQE) was calculated by dividing the number of detected electrons by the number of incident photons. The EQE at the wavelength of 690 nm was 3.1 × 10⁻³%.
The wavelength dependences of the EQEs of the Ag nanoholes were examined, as shown in Figure 2a (red circles). The maximum EQE was observed at a wavelength of 690 nm, and the EQEs at other wavelengths were in the range of 1.8 to 2.2 × 10⁻³%. The wavelength dependence of the EQEs were similar to the extinction spectra of the Ag nanoholes. In contrast, illumination of the Ag film in an area away from the nanoholes resulted in a maximum EQE of 6.1 × 10⁻⁴%, and no significant wavelength dependence was observed in this case (Figure 2, blue triangles). These results suggest the following mechanism for the light detection in these systems: Light illumination on the nanoholes excites surface plasmon polaritons, leading to plasmonic local heating as a consequence of plasmon loss. This creates a temperature gradient across the Ag film, resulting in a potential difference between its edges. Consequently, electric currents flow through the Ag thin film, owing to the Seebeck effect.
In order to verify this hypothesis, the wavelength dependencies of the EQEs of Ag nanoholes with different periodicities were investigated. The Ag nanohole arrays with periodicities of 250 nm and 400 nm were fabricated and evaluated for comparison with the 300 nm-spaced nanohole array (Figure 2b,c). The peak wavelengths of the extinction spectra of the nanoholes with periodicities of 250 and 400 nm were 608 nm and 801 nm, respectively. These results suggest that the peak wavelength of the Ag nanoholes is determined by periodicity of the nanoholes. In each case, the wavelength dependence of the EQEs for illumination of the nanoholes followed a similar trend to the wavelength dependence of the nanohole extinction spectra, whereas, for illumination of an area of the Ag film unpunctuated by nanoholes, no significant wavelength dependence was seen. These results support our above-described hypothesis for the mechanism behind light detection.

3.2. Quantification of Plasmonic Local Heating

As a proof of concept, we estimated the amount of plasmonic local heating generated at the Ag nanohole arrays, experimentally and numerically. The Ag nanohole arrays with a periodicity of 300 nm produced a maximum electric current of 173 nA at a wavelength of 690 nm. The conductivity of the 40 nm-thick Ag film, as measured via a four-probe method, was 1.23 × 10⁷ S/m. In addition, we measured the conductivity of the nanohole arrays by preparing a sample consisting of a film entirely covered in Ag nanohole arrays. The measured conductivity of these nanohole arrays was 0.60 × 10⁷ S/cm, which was nearly half of the value measured for the Ag film. The thermal conductivities of the Ag film and nanoholes were estimated by using the Wiedemann–Frantz law, which states that the ratio of the thermal and electrical conductivities of a metal is proportional to the temperature [20]. The Lorenz number for Ag, 2.42 × 10⁻⁸ W Ω/K2, was used for this estimation [21,22]. The estimated thermal conductivities of the Ag film and nanoholes, being 88.1 and 58.0 W/m·K, respectively, are much greater than those of the resistant polymer and air [23]. We used these conductivity values for the nanohole area and Ag film in a thermoelectric simulation model, simulating the thermoelectric performance of the device by using a thermoelectric module within the COMSOL Multiphysics package. We determined that the temperature of the heat source on the device generates the same value of current as that obtained experimentally. Consequently, the thermoelectric simulation revealed that plasmonic local heating by 4.61 K, at the Ag nanoholes, generated a photocurrent of 173 nA, the measured current.
We also calculated the plasmonic local heating generated at the Ag nanoholes by using the COMSOL software package, including its heat transfer module. Supplementary Materials Figure S4 illustrates the model used for this calculation. Briefly, the model involves a single nanohole in a unit that is surrounded by heat flux layers to permit heat flow from the inside to the outside of the unit. Perfect matching layers were put on the top and bottom of the unit. Experimental values were used for morphological parameters and for the conductivity of the Ag film. In the simulation model, illumination was by a continuous wave light source, with a single wavelength, and an optical power of 2.6 × 10² W/cm2. Since plasmonic local heating occurs as a result of the Joule effect, the heat power density q can be calculated using Equation (1) [24].
q ( r ) = ω 2   Im ( ε ( ω ) ) ε 0 | E ( r ) | 2
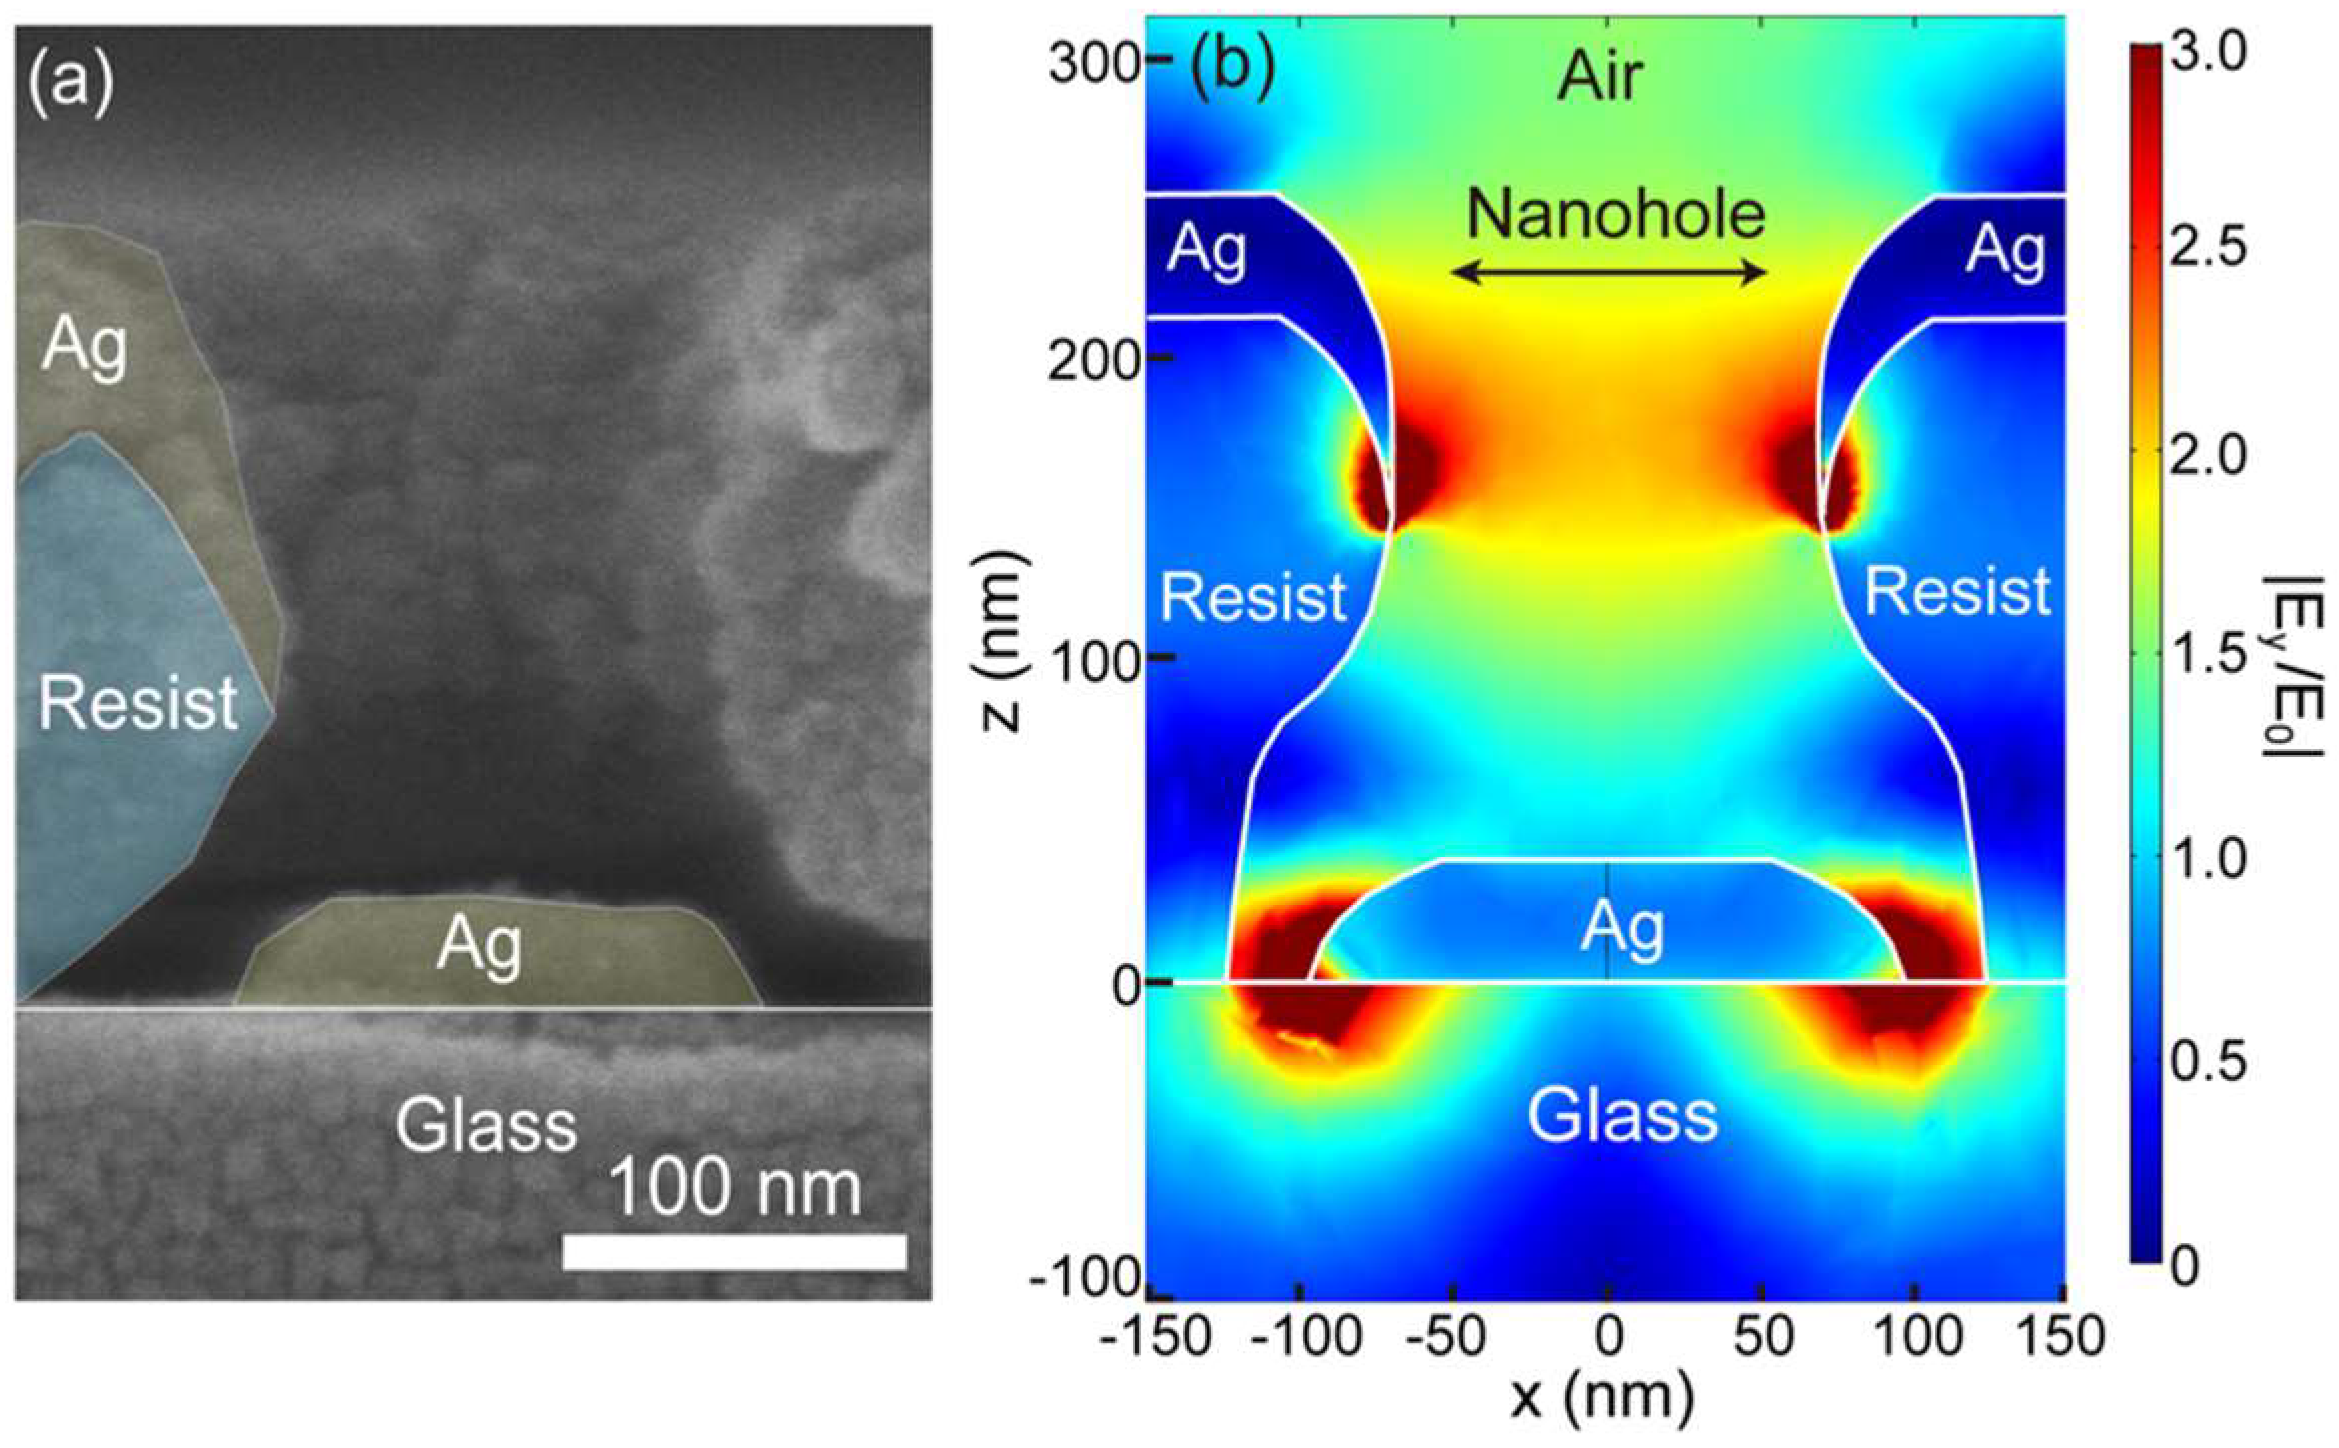
where ε 0 is the vacuum permittivity, ε(ω) is the relative permittivity of the material, and | E ( r ) | 2 is the intensity of the electric field. Figure 3 shows a cross-sectional SEM image of the Ag nanohole alongside the modeled electric field distribution for the same view of the Ag nanohole. The electric field distribution was calculated for a wavelength of 690 nm. Strong electric field confinement at the edge of the Ag film, inside the nanohole, was observed, indicating that the edges of the film are the main sites of plasmonic local heating. The edges of the Ag disk at the bottom of the nanohole were also expected to be heat sources; however, we concluded that the Ag disks did not contribute directly to thermoelectric conversion, owing to the electrical discontinuity.
Heat transfer in a system can be described by a conventional heat transfer expression [25],
ρ ( r ) c ( r ) δ T ( r ) δ t = κ ( r ) T ( r ) + q ( r )
where T(r) is the temperature, ρ ( r ) is the mass density, c ( r ) is the specific heat, and κ ( r ) is the thermal conductivity. In fact, Govorov et al. reported that temperature increases for periodic plasmonic nanoparticles cannot be estimated by considering the nanoparticles individually [26]. They showed that a temperature shift originating from a two-dimensional array of 16 gold nanoparticles was enhanced more than four times with respect to that of a single nanoparticle, because the heating effect can be enhanced as a result of the accumulation effects and inter-particle coulombic interactions [27]. We calculated the local heating temperatures produced upon changing the unit numbers of nanoholes from 1 to 49. As the unit number increases, the amount of plasmonic local heating increases because of a rise in the external temperature generated by the neighboring nanoholes [28,29]. Figure 4 shows a logarithmic fit of plasmonic local temperature versus the number of nanohole units in the array. The fit to the data, also shown in in Figure 4, is expressed analytical by Equation (3).
y = 0.9171ln(x) + 1.239
As the number of nanoholes included in an illumination spot is 4.27 × 10⁴, the estimated plasmonic local heating temperature at the illumination spot is 11.0 K, which is more than 2.4 times higher than that estimated from the experimental data. A possible reason for this difference between the temperatures estimated experimentally and numerically, is the discrepancy between the optical power used in the simulation and the actual power of the illuminated light. Our laser beam has a Gaussian profile, whereas we selected a uniform light spot for the illumination calculations. However, the actual light power illuminating each nanohole is different. Nonetheless, it should be noted that our calculation technique generated a relatively good estimation for the nanoholes of the temperature of the plasmonic local heating, which contributes to the thermoelectric conversion process. In other words, this calculation technique is valid for plasmonic local heating and should facilitate the optimization of configurations for plasmonic local heating.

4. Conclusions

A plasmonic photodetector consisting of a Ag thin-film with a nanohole array pattern was fabricated and investigated. The photodetection mechanism was examined by verifying the amount of plasmonic local heating, using both experimental and numerical methods. The wavelength dependence of EQE values was consistent with the extinction spectrum of the Ag nanohole, indicating that surface plasmon polaritons at the nanoholes played a dominant role in this photodetection mechanism. The calculated plasmonic local heating was a factor of 2.4 greater than the one estimated experimentally; however, our simulation technique for calculating plasmonic local heating is still a powerful tool to optimize the characteristics of this plasmonic photodetector. Calculated and measured extinction spectra confirmed that the wavelength of the surface plasmon polaritons of the Ag nanohole arrays is determined by the nanohole periodicity and dielectric constants for the surrounding media (Ag, air, resist). In other words, suitable design of nanohole periodicity, as well as appropriate selection of metals and surrounding media, will allow the realization of tunable photodetectors, not only for visible light but also in the near IR range. The external quantum efficiency and responsivity of the nanohole-array Ag thin-film device are 3.1 × 10⁻³% and 17.3 µA/W, respectively, which are comparable with those of the respective levels for a plasmonic photodetector driven by hot carriers [3,30] and are significantly lower than those of commercial Si detectors. However, there is ample scope for increasing EQE values, via optimization of device configurations, nanohole morphology, and appropriate material selection. Furthermore, our simple device configuration consisting of a single Ag nanofilm should help to ignite interest in the development of photodetectors that operate effectively on the nanoscale.

Supplementary Materials

The following are available online at https://www.mdpi.com/2076-3417/10/8/2681/s1, Figure S1: Schematic of illumination system, Figure S2: Calculated extinction spectrum, Figure S3: Electric current before and after illumination, Figure S4: Simulation models used for heat calculations.

Author Contributions

W.K. conceived the idea of this study. K.M. and H.E. performed sample fabrication and measurements. K.M. conducted the numerical simulations with support from X.F., K.M.; and W.K. wrote the manuscript. All authors contributed to the analysis and interpretation of results. W.K. supervised and coordinated all the work. All authors have read and agreed to the published version of the manuscript.

Funding

This research was fully supported by the Casio Science Promotion Foundation, The Sumitomo Foundation, and the JSPS-Royal Society bilateral joint research program; and was partially supported by the JSPS Core-to-Core Program.

Acknowledgments

The authors are grateful to James Frame for supporting simulations.

Conflicts of Interest

The authors declare no conflict of interest.

References

  1. Dorodnyy, A.; Salamin, Y.; Ma, P.; Plestina, J.V.; Lassaline, N.; Mikulik, D.; Romero-Gomez, P.; Morral, A.F.; Leuthold, J. Plasmonic Photodetectors. IEEE J. Sel. Top. Quantum Electron. 2018, 24, 1–13. [Google Scholar] [CrossRef]
  2. Li, W.; Valentine Jason, G. Harvesting the loss: Surface plasmon-based hot electron photodetection. Nanophotonics 2017, 6, 177–191. [Google Scholar] [CrossRef]
  3. Sobhani, A.; Lauchner, A.; Najmaei, S.; Ayala-Orozco, C.; Wen, F.; Lou, J.; Halas, N.J. Enhancing the photocurrent and photoluminescence of single crystal monolayer MoS2 with resonant plasmonic nanoshells. Appl. Phys. Lett. 2014, 104, 031112. [Google Scholar] [CrossRef] [Green Version]
  4. Li, W.; Valentine, J. Metamaterial Perfect Absorber Based Hot Electron Photodetection. Nano Lett. 2014, 14, 3510–3514. [Google Scholar] [CrossRef] [PubMed]
  5. Chalabi, H.; Schoen, D.; Brongersma, M.L. Hot-Electron Photodetection with a Plasmonic Nanostripe Antenna. Nano Lett. 2014, 14, 1374–1380. [Google Scholar] [CrossRef]
  6. Brongersma, M.L.; Halas, N.J.; Nordlander, P. Plasmon-induced hot carrier science and technology. Nat. Nanotechnol. 2015, 10, 25–34. [Google Scholar] [CrossRef]
  7. Kubo, W.; Kondo, M.; Miwa, K. Quantitative Analysis of the Plasmonic Photo-Thermoelectric Phenomenon. J. Phys. Chem. C 2019, 123, 21670–21675. [Google Scholar] [CrossRef]
  8. Suzuki, D.; Oda, S.; Kawano, Y. A flexible and wearable terahertz scanner. Nat. Photonics 2016, 10, 809–813. [Google Scholar] [CrossRef]
  9. Ahmad, H.; Suzuki, D.; Kawano, Y. Strain-induced photo-thermoelectric terahertz detection. AIP Adv. 2018, 8, 115002. [Google Scholar] [CrossRef] [Green Version]
  10. Lundeberg, M.B.; Gao, Y.; Woessner, A.; Tan, C.; Alonso-González, P.; Watanabe, K.; Taniguchi, T.; Hone, J.; Hillenbrand, R.; Koppens, F.H.L. Thermoelectric detection and imaging of propagating graphene plasmons. Nat. Mater. 2016, 16, 204–209. [Google Scholar] [CrossRef] [Green Version]
  11. Shautsova, V.; Sidiropoulos, T.; Xiao, X.; Güsken, N.A.; Black, N.C.G.; Gilbertson, A.M.; Giannini, V.; Maier, S.A.; Cohen, L.F.; Oulton, R.F. Plasmon induced thermoelectric effect in graphene. Nat. Commun. 2018, 9, 5190. [Google Scholar] [CrossRef] [PubMed]
  12. Tagliabue, G.; Eghlidi, H.; Poulikakos, D. Rapid-Response Low Infrared Emission Broadband Ultrathin Plasmonic Light Absorber. Sci. Rep. 2014, 4, 7181. [Google Scholar] [CrossRef] [PubMed] [Green Version]
  13. Pan, Y.; Tagliabue, G.; Eghlidi, H.; Höller, C.; Dröscher, S.; Hong, G.; Poulikakos, D. A Rapid Response Thin-Film Plasmonic-Thermoelectric Light Detector. Sci. Rep. 2016, 6, 37564. [Google Scholar] [CrossRef] [PubMed] [Green Version]
  14. Weeber, J.-C.; Hassan, K.; Bouhelier, A.; Colas-des-Francs, G.; Arocas, J.; Markey, L.; Dereux, A. Thermo-electric detection of waveguided surface plasmon propagation. Appl. Phys. Lett. 2011, 99, 031113. [Google Scholar] [CrossRef]
  15. Mauser, K.W.; Kim, S.; Mitrovic, S.; Fleischman, D.; Pala, R.; Schwab, K.C.; Atwater, H.A. Resonant thermoelectric nanophotonics. Nat. Nanotechnol. 2017, 12, 770–777. [Google Scholar] [CrossRef]
  16. Safaei, A.; Chandra, S.; Shabbir, M.W.; Leuenberger, M.N.; Chanda, D. Dirac plasmon-assisted asymmetric hot carrier generation for room-temperature infrared detection. Nat. Commun. 2019, 10, 3498. [Google Scholar] [CrossRef] [Green Version]
  17. Zhang, B.Y.; Liu, T.; Meng, B.; Li, X.; Liang, G.; Hu, X.; Wang, Q.J. Broadband high photoresponse from pure monolayer graphene photodetector. Nat. Commun. 2013, 4, 1811. [Google Scholar] [CrossRef] [Green Version]
  18. Safaei, A.; Chandra, S.; Leuenberger, M.N.; Chanda, D. Wide Angle Dynamically Tunable Enhanced Infrared Absorption on Large-Area Nanopatterned Graphene. ACS Nano 2019, 13, 421–428. [Google Scholar] [CrossRef] [Green Version]
  19. Freitag, M.; Low, T.; Zhu, W.; Yan, H.; Xia, F.; Avouris, P. Photocurrent in graphene harnessed by tunable intrinsic plasmons. Nat. Commun. 2013, 4, 1951. [Google Scholar] [CrossRef] [Green Version]
  20. Shen, X.; Xia, Y.; Wang, G.; Zhou, F.; Ozolins, V.; Lu, X.; Wang, G.; Zhou, X. High thermoelectric performance in complex phosphides enabled by stereochemically active lone pair electrons. J. Mater. Chem. A 2018, 6, 24877–24884. [Google Scholar] [CrossRef]
  21. Kumar, G.S.; Prasad, G.; Pohl, R.O. Experimental determinations of the Lorenz number. J. Mater. Sci. 1993, 28, 4261–4272. [Google Scholar] [CrossRef]
  22. Fenton, E.; Rogers, J.; Woods, S. Lorenz Numbers of Pure Aluminum, Silver, and Gold at Low Temperatures. Can. J. Phys. 2011, 41, 2026–2033. [Google Scholar] [CrossRef]
  23. Lemmon, E.W.; Jacobsen, R.T. Viscosity and Thermal Conductivity Equations for Nitrogen, Oxygen, Argon, and Air. Int. J. Thermophys. 2004, 25, 21–69. [Google Scholar] [CrossRef]
  24. Baffou, G.; Quidant, R. Thermo-plasmonics: Using metallic nanostructures as nano-sources of heat. Laser Photonics Rev. 2013, 7, 171–187. [Google Scholar] [CrossRef]
  25. Richardson, H.H.; Carlson, M.T.; Tandler, P.J.; Hernandez, P.; Govorov, A.O. Experimental and Theoretical Studies of Light-to-Heat Conversion and Collective Heating Effects in Metal Nanoparticle Solutions. Nano Lett. 2009, 9, 1139–1146. [Google Scholar] [CrossRef] [Green Version]
  26. Govorov, A.O.; Zhang, W.; Skeini, T.; Richardson, H.; Lee, J.; Kotov, N.A. Gold nanoparticle ensembles as heaters and actuators: Melting and collective plasmon resonances. Nanoscale Res. Lett. 2006, 1, 84–90. [Google Scholar] [CrossRef] [Green Version]
  27. Govorov, A.O.; Richardson, H.H. Generating heat with metal nanoparticles. Nano Today 2007, 2, 30–38. [Google Scholar] [CrossRef]
  28. Baffou, G.; Berto, P.; Bermúdez Ureña, E.; Quidant, R.; Monneret, S.; Polleux, J.; Rigneault, H. Photoinduced Heating of Nanoparticle Arrays. ACS Nano 2013, 7, 6478–6488. [Google Scholar] [CrossRef]
  29. Baffou, G.; Bon, P.; Savatier, J.; Polleux, J.; Zhu, M.; Merlin, M.; Rigneault, H.; Monneret, S. Thermal Imaging of Nanostructures by Quantitative Optical Phase Analysis. ACS Nano 2012, 6, 2452–2458. [Google Scholar] [CrossRef] [Green Version]
  30. Knight, M.W.; Sobhani, H.; Nordlander, P.; Halas, N.J. Photodetection with Active Optical Antennas. Science 2011, 332, 702–704. [Google Scholar] [CrossRef]
Figure 1. Ag thin-film detector concept and nanostructure. (a) Schematic of the Ag thin-film photodetector, and (b) top-view scanning electron microscopy (SEM) images of the periodic plasmonic nanohole arrays. The inset in (b) is a magnified image of a section of the image in the main panel.
Applsci 10 02681 g001
Figure 2. Plasmonic nanohole array extinction spectra and quantum efficiencies. Measured spectra: (a) 300, (b) 250, and (c) 400 nm. Measured external quantum efficiencies of plasmonic photo-thermoelectric conversion, for illuminations of the nanohole array (red circles) and for illumination of a reference position (blue triangles), are also plotted for each array on the respective panels.
Applsci 10 02681 g002
Figure 3. Electric field enhancement produced by plasmonic local heating. Cross-sectional view of nanohole: (a) scanning electron microscopy (SEM) image; and (b) electric field distribution.
Applsci 10 02681 g003
Figure 4. Dependence of plasmonic local heating on array size. Simulated local heating temperatures as a function of the numbers of nanoholes in the array (red circles). The dashed line indicates a logarithmic fit to the simulation results.
Applsci 10 02681 g004