Article

An Optimized Brain-Based Algorithm for Classifying Parkinson’s Disease

1
Escuela de Ingeniería Civil Informática, Universidad de Valparaíso, Valparaíso 2362905, Chile
2
Escuela de Ingeniería Informática, Pontificia Universidad Católica de Valparaíso, Valparaíso 2362807, Chile
*
Authors to whom correspondence should be addressed.
Appl. Sci. 2020, 10(5), 1827; https://doi.org/10.3390/app10051827
Submission received: 24 January 2020 / Revised: 21 February 2020 / Accepted: 28 February 2020 / Published: 6 March 2020
(This article belongs to the Collection Bio-inspired Computation and Applications)

Abstract

:
During the last years, highly-recognized computational intelligence techniques have been proposed to treat classification problems. These automatic learning approaches lead to the most recent researches because they exhibit outstanding results. Nevertheless, to achieve this performance, artificial learning methods firstly require fine tuning of their parameters and then they need to work with the best-generated model. This process usually needs an expert user for supervising the algorithm’s performance. In this paper, we propose an optimized Extreme Learning Machine by using the Bat Algorithm, which boosts the training phase of the machine learning method to increase the accuracy, and decreasing or keeping the loss in the learning phase. To evaluate our proposal, we use the Parkinson’s Disease audio dataset taken from UCI Machine Learning Repository. Parkinson’s disease is a neurodegenerative disorder that affects over 10 million people. Although its diagnosis is through motor symptoms, it is possible to evidence the disorder through variations in the speech using machine learning techniques. Results suggest that using the bio-inspired optimization algorithm for adjusting the parameters of the Extreme Learning Machine is a real alternative for improving its performance. During the validation phase, the classification process for Parkinson’s Disease achieves a maximum accuracy of 96.74% and a minimum loss of 3.27%.

1. Introduction

Parkinson’s disease (PD) is the most common age-related neurodegenerative disease and is the second most prevalent in the world [1,2]. To date, no treatment has been seen to reduce or prevent the disease’s progression [3,4]. Its detection is based on the manifestation of two or three motor symptoms. Motor symptoms include muscle stiffness, resting tremor, slow movement, and balance problems [5]. Nowadays, evidence exists that signs of PD can be identified through speech, and the analysis using machine learning techniques may help in the diagnosis [6].
Computational intelligence techniques are multi-purpose artificial procedures devoted to mainly treat classification, prediction, and clustering problems. Most computational methods are inspired by interesting natural phenomena, such as inter-species communication [7,8], selection and evolution mechanisms [9], swarm intelligence [10], and evolutionary algorithms [11], among several others [12]. Artificial neural networks (ANN) are a type of bio-inspired algorithms based on how neurons operate in the brain to process data from the senses, establish memories, and control the body [13,14]. Successful studies show that ANNs are able to provide highly precise results in different disciplines [15].
Despite the great success of artificial neural networks, its proper design and its successful implementation to reach acceptable results is not a simple task. The procedure of ANNs is regulated by a set of parameters that demand a previous configuration. In fact, selecting the appropriate parameter setting is crucial for efficient algorithm performance, and therefore to the effective finding of outstanding solutions [16]. Furthermore, there is no general optimal artificial neural network configuration. Hence, the effects of an optimal initial configuration can considerably vary from problem to problem and also between different instances of the same problem. This hard configuration task is typically left to the modeler who has to decide based on the features of the problem and the available parameter tuning knowledge. This task requires a significant amount of expertise.
This open challenge has led to new trends trying to modify ANNs in order to minimize the number of parameters, and thus to avoid adjusting their values. That is how the Extreme Learning Machine (ELM) was designed. In [17], ELM was proposed as a kind of artificial neural network which is only composed by an input layer, an output node, and one or more layers of neurons. Unlike a conventional artificial neural network, the ELM proposes no tuning of the parameters of the hidden nodes: input weights and hidden layer biases, because they are arbitrarily assigned. This design tends to provide an efficient generalization performance at breakneck learning speed [18]. However, to reach this performance, ELM sacrifices precise and accurate in results. The trade-off between high-quality solutions and the fast resolution process is an issue that should be covered.
In this work, we use the Bat Algorithm (BA) to enhance the yield of the extreme learning machine during the learning phase. BA is a metaheuristic inspired by the echolocation feature of microbats [19], and we already had fruitfully proved in optimization problems [20,21]. The main idea is to automatically adjust the random parameters of the ELM for boosting to the neural network to achieve better performance. Next, we use the models generated by the improved ELM as an offline comparison resource and we analyze them in terms of accuracy-loss. There are two objectives in conflict: to maximize accuracy and minimize loss. The balance between these measures allows us to find the best model for the test phase of the ELM. To evaluate our proposal, the BA-ELM is applied to the voice signals of Parkinson’s Disease patients, using a dataset taken from UCI Machine Learning Repository [22]. The dataset was created at the Department of Neurology at Istanbul University and it includes 195 voice recording from 31 people, 23 with PD The authors mentioned that the microphone was set to 44.1 kHz during the data collection process. The signal contains the sustained phonation of the vowel a and possess 23 features. The features includes vocal fundamental frequency, ratio of noise to tonal components in the voice, signal fractal scaling exponent, and among others [22].
Computational experiments are firstly analyzed in terms of the over/under fitting. We compare the results generated in the training phase by calculating the sum of the differences between curves. Moreover, we employ charts for illustrating the behavior the optimized ELM against the native version. If difference between curves trends to zero, then the training phase properly worked. Finally, we employ a non-parametric test for evaluating the statistical different between the original ELM and its optimized version. Results are promising and show that when the random parameters of the ELM are properly adjusted for this classification problem, the accuracy increased from 90.16% to 96.74%, and the loss decreased from 4.08% to 3.27%.
The manuscript is organized as follows. Section 2 illustrates related works in the field. Section 3 presents the methodology used for this work. Section 4 defines the tackled problem. Section 5 exposes the default extreme learning machine, and its improved version with the bat metaheuristic. Next, experimental results and discussions are shown in Section 6. At the end of the manuscript, conclusions are presented in Section 7.

2. Background

In the last decade, interesting works had been proposed on artificial neural networks for classification problems. For instance, in [23] a classification system to identify voice dysphonia via Wavelet Packet Transform and the Best Basis Algorithm is designed. Outstanding results were reported by reaching from 87.5% to 96.8% of accuracy. Recently manuscripts study the deep learning networks for classifying the environmental sounds. In [24], a convolution neural network is applied to sound classification datasets. Results are encouraging due to during the learning phase, an accuracy greater than 77% is achieved. In [25], the authors provide a review of the state-of-the-art deep learning techniques for audio signal processing. Analyzed works range from variants of the long short-term memory architecture, audio-specific neural network models, and also it includes convolution neural networks. Other works detail traditional algorithms for pathological voices, using the auto-correlation method [26], the cepstrum technique [26], and the data reduction procedure [27]. For all of them, the accuracy is between 72.72% and 84.09%. In [28], a Mel Frequency Cepstral Coefficients is applied to identify features in voices signals, which are then used for training an ANN with 10 neurons in the hidden layer. Results are presented in terms of the generated loss. The more precise result is met with nine neurons, a square mean loss of 1.05E-3, and a loss percentage equals to 12.8%.
Now, if we study the integration of bio-inspired metaheuristics in machine learning techniques, an interesting set of works emerge. For example, hybrid methods were proposed in [29,30]. Here, the parameters of a Support Vector Machine are optimized by the Genetic Algorithm and the Particle Swarm Optimization (PSO), respectively. The first one is developed to classify voice disorders. This approach shows an increase in accuracy from 79.16% to 87.5%. The second one was designed to predict the use of electrical energy. The improved algorithm works in iterations. In each iteration, the metaheuristic based on the movement of particles finds the best configuration for the classification method. PSO was also integrated to an ELM. In [31], a mixed procedure based on the machine learning approach is proposed. This technique includes the successful self-regulated learning capability of the particle swarm optimization algorithm with an ELM classifier. The enhanced metaheuristic was applied to define the optimum parameter setting for the ELM in order to reduce the number of hidden layer neurons. The hybrid method was evaluated on five medical dataset classification problems: Wisconsin Breast Cancer, Pima Indians Diabetes, Heart-Statlog, Hepatitis, and Cleveland Heart Disease. Results illustrate that the integration of the self-regulated learning PSO to ELM works better than the native ELM, and it also operates better than the original PSO on ELM.
Finally, if we analyze multi-objective optimization algorithms combined with the extreme machine leaning method, we can find manuscripts such as [32,33,34]. The first one describes how the physical programming that allows selecting the number of hidden nodes and the activation function for an extreme learning machine by optimizing multiple performance objectives of networks. The second one simultaneously considers the ELM model loss and the sparsity constraint of the hidden layer into optimization. The last work details a new model selection method of ELM based on multi-objective optimization to obtain dense networks with good generalization ability.

3. Methodology

In this section, we present the methodology used for the work global process. We begin with a brief description of Parkinson’s Disease and we show how signal voices is transformed to spectrograms. Finally, we describe the used experimental design.

3.1. Parkinson’s Disease

Parkinson’s Disease is a degenerative disorder of the central nervous system characterized by tremors (shaking), rigidity, slow intentional movement as well as changes in memory and cognition [35]. The diagnosis of Parkinson’s Disease is frequently difficult, especially in early disease stages because tremors may occur not only at rest, but also at posture and/or during action [36]. The vocal impairment is considered one of the earliest indications that this disease begins. In this line, recent works have endeavored in handling voice signals to support the diagnosis [22,37]. In this work, we forward another step in the study of automatic classification of complex diseases by improving the learning machine.
We use Parkinson’s Disease Classification Dataset taken from UCI Machine Learning Repository [22,37,38] for testing our proposal. Data was generated from 188 patients with Parkinson’s Disease (107 men and 81 women) with ages ranging from 33 to 87 (65.1 ± 10.9) at the Department of Neurology at Istanbul University. Only 64 healthy individuals (23 men and 41 women) of 188 patients were considered into the control group. Their ages varied between 41 and 82 (61.1 ± 8.9). In [22], the authors inform that during the data collection process, the microphone was set to 44.1 kHz. After the physician’s examination, three repetitions for each subject were extracted. The signal contains the sustained phonation of the vowel a.

3.2. Signal’s Transformation

In [35,36], speech features have been successfully employed to the Parkinson’s Disease diagnosis, such us jitter, shimmer, fundamental frequency parameters, harmonicity parameters, recurrence period density entropy, detrended fluctuation analysis and pitch period entropy. In [22], some features are referred as “baseline features” and they are employed for comparing the performance of the different feature extraction methods.
Dataset was created from firstly voice signal. Next, these signals were transformed in spectrograms using the Mel-Frequency Cepstral Coefficients technique [22]. In literature, Mel-Frequency Cepstral Coefficients is described as a method that emulates the effective filtering properties of the human ear [39]. This approach has been used as a robust feature extraction method in the context of speaker identification, automatic speech recognition and Parkinson’s Disease diagnosis [40,41]. After to apply this method for feature extraction, 23 features were discovered/calculated, detailed in [22]. In our study, we use a feature vector with 23 elements. This vector is employed in the input layer (variables) of the ELM to classify if a patient presents the Parkinson’s Disease or not.

3.3. Experimental Design

The optimized ELM is evaluated via quantitative approach. Results will be compared by using statistical metrics and a hypothesis contrast.
Firstly, we will separate the dataset in two group: 80% for training and 20% for validation. Next, we will run the native ELM to know its performance. Results will be considered as gold standard to compare future BA-ELM results. After, we will test BA-ELM for identifying whether the training phase is under/over fitting. These concepts refer to the fails when the generated models try to generalize the knowledge that machine learning intends to acquire. When a machine learning model is trained with a set of input data, it generates computational models able to generalize a concept. In our case, trained models generalize if a patient presents the Parkinson’s Disease or not. Thus, when a the machine learning will use a new unknown dataset, it should be able of synthesizing it, understanding it and giving us a reliable result.
Nevertheless, there is a key issue that should always be considered. If our training data is too few, our learning algorithm will not be able to generalize the knowledge and will be incurring u n d e r f i t t i n g . On the other hand, if we train the machine learning with a homogeneous dataset, the learning approach will neither be able to generalize the knowledge and will be incurring o v e r f i t t i n g . To identify whether our generalized models suffer under/over fitting, we propose a simple metric: the sum of differences between curves of the learning and the validation of training phase tends to zero. If under/over fitting exists, we must check: minimum input sample, validation dataset, and feature selection, among others factors in order to minimize these issues [42].
Next, to show the robustness of the proposal and to present a better significant difference between the ELM and the optimized neural network, we will perform a contrast statistical test via the Kolmogorov-Smirnov-Lilliefors to confirm the distribution of samples [43] and W i l c o x o n s s i g n e d r a n k [44] to compare statistically the results. For both tests, a hypothesis evaluation is considered, which is analyzed assuming a p-value of 0.05 —uncertainty—i.e., smaller values that 0.05 determine that the corresponding hypothesis cannot be assumed. Both tests were conducted using G N U O c t a v e . The first test allows us to analyze the distribution of samples by determining whether the best value (maximum accuracy and minimum loss) achieves from the 31 executions follow a normal distribution. To proceed, the hypothesis h 0 states that the best value given by an algorithm (original or improved) draws a normal distribution. Finally, if samples do not follow a normal distribution and they are independents, we can assume a non-parametric evaluation for appraising the heterogeneity of them. We will use the W i l c o x o n s s i g n e d r a n k test. We will propose hypotheses h a 0 where the median accuracy achieved by ELM is great or equals than the median value reached by the optimized ELM and we will, in parallel, define h e 0 where the median loss generated by ELM is less or equals than the median value given by the optimized ELM. This method will allow us guarantee that BA-ELM effectively works better than native ELM.

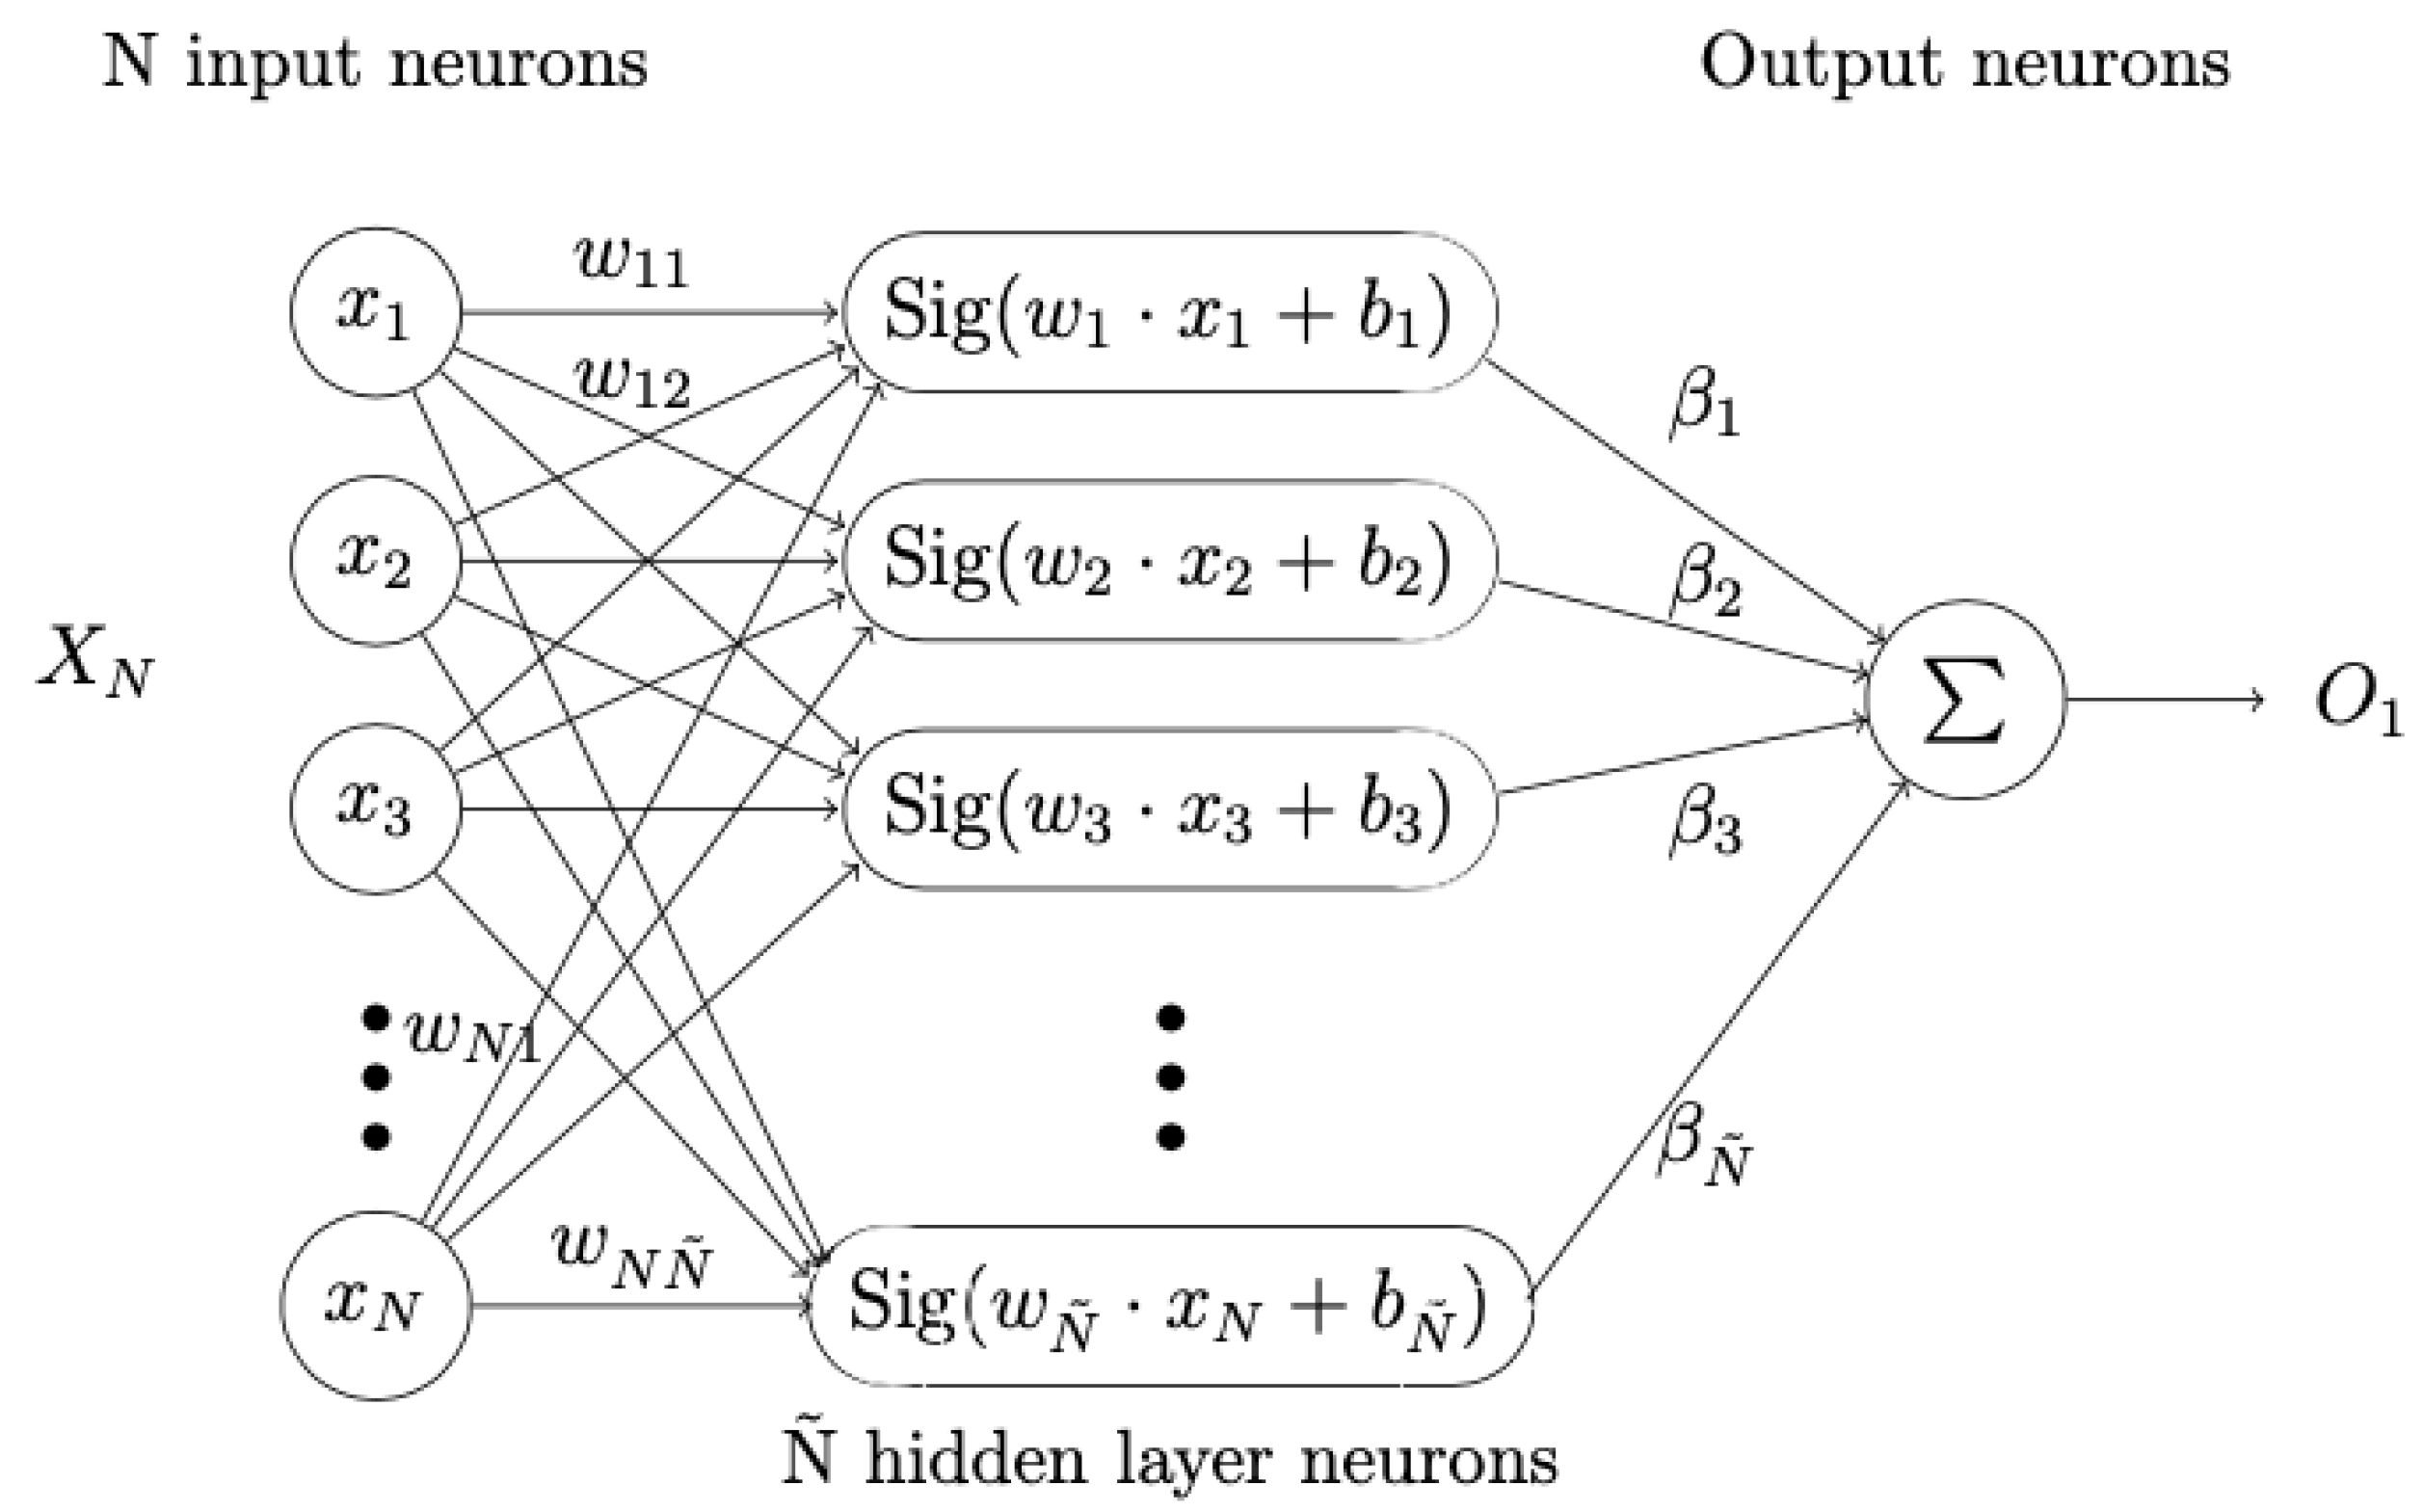
4. Extreme Learning Machine

In artificial intelligence, machine learning approaches have gained popularity in the last years, mainly for their contributions in different disciplines. The extreme learning machine is a particular case of machine learning methods [17]. ELM can be classified as a supervised learning algorithm able to solve linear and non-linear classification problems. Traditional artificial neural network architectures describe ELM as Single Layer Feedforward Neural Network (SLFN) [45], where input weights and hidden layer biases do not need to iteratively be computed. One of the conventional ELM implementations is about the randomly calculated nodes in the hidden layer independently of the training data [46]. ELM has also been designed for working under the linear algebra operators, and thus to achieve the optimal weights in the output layer.
A formal description of an ELM can be described from a set of N independent and identically distributed random variables as a training sample ( x i , t i ) , where x i represents the transpose of the n-dimensional vector, i.e., x i = [ x i 1 , x i 2 , , x i n ] T R n , and t i describes the transpose of the m-dimensional vector, i.e., t i = [ t i 1 , t i 2 , , t i m ] T R m . Thus, standard SLFNs with N ˜ hidden nodes and activation function g ( x ) = S i g ( x ) = 1 1 + e x , they are mathematically modeled by:
i = 1 N ˜ β i g i ( x j ) = i = 1 N ˜ β i g ( w i · x j + β i ) = o j ,   j { 1 , 2 , , N }
where [ w i = w i 1 , w i 2 , , w i n ] T is the weight vector connecting the ith hidden node and the input nodes, [ β i = β i 1 , β i 2 , , β i m ] T is the weight vector connecting the ith hidden node and the output nodes, and β i is the bias of the ith hidden node. The inner product between w i and x j is denoted by w i · x j (see Figure 1).
Huang et al. have rigorously proved in [17] that for N arbitrary distinct samples and any ( w i , β i ) randomly chosen from R n × R m according to any continuous probability distribution, the hidden layer output matrix H of a standard SLFN with N hidden nodes, and it is invertible. Moreover, | | H β T | | = 0 with probability one if the activation function g : R R is infinitely differentiable in any interval.
Then, if we assume H β = T , the N-equations can be defined by:
H ( w 1 , w 2 , , w N , β 1 , β 2 , , β N ˜ , x 1 , x 2 , , w N ˜ ) = g ( w 1 · x 1 + β 1 ) g ( w N ˜ · x 1 + β N ˜ ) g ( w 1 · x N + β 1 ) g ( w N ˜ · x N + β N ˜ ) N × N ˜ ,
where
β = β 1 T β N ˜ T N ˜ × m and T = t 1 T t N T N × m
The solution is given by computing the norm of weights β ^ = H T , where H is the Moore-Penrose generalized inverse of matrix H.
ELM algorithm requires a training sample ( x i , t i ) R n × R m     i { 1 , 2 , , N ˜ } , an activation function g and set of hidden nodes H, to ensure a weight output vector. These weights connect hidden nodes to the hidden output. The procedure can be summarized in three stages:
  • Randomly generate input weight and bias ( w i , β i ) , i = { 1 , 2 , , N ˜ } .
  • Calculate the hidden layer output matrix H.
  • Calculate the weight β ^ = H T .
The original version of ELM works properly, however, we firmly believe that its performance can be even better [47]. For this reason, we focus on stage one and we propose an online parameter control approach for ELM in order to find the best configuration of ( w i , β i ) and to generate the best classification model.

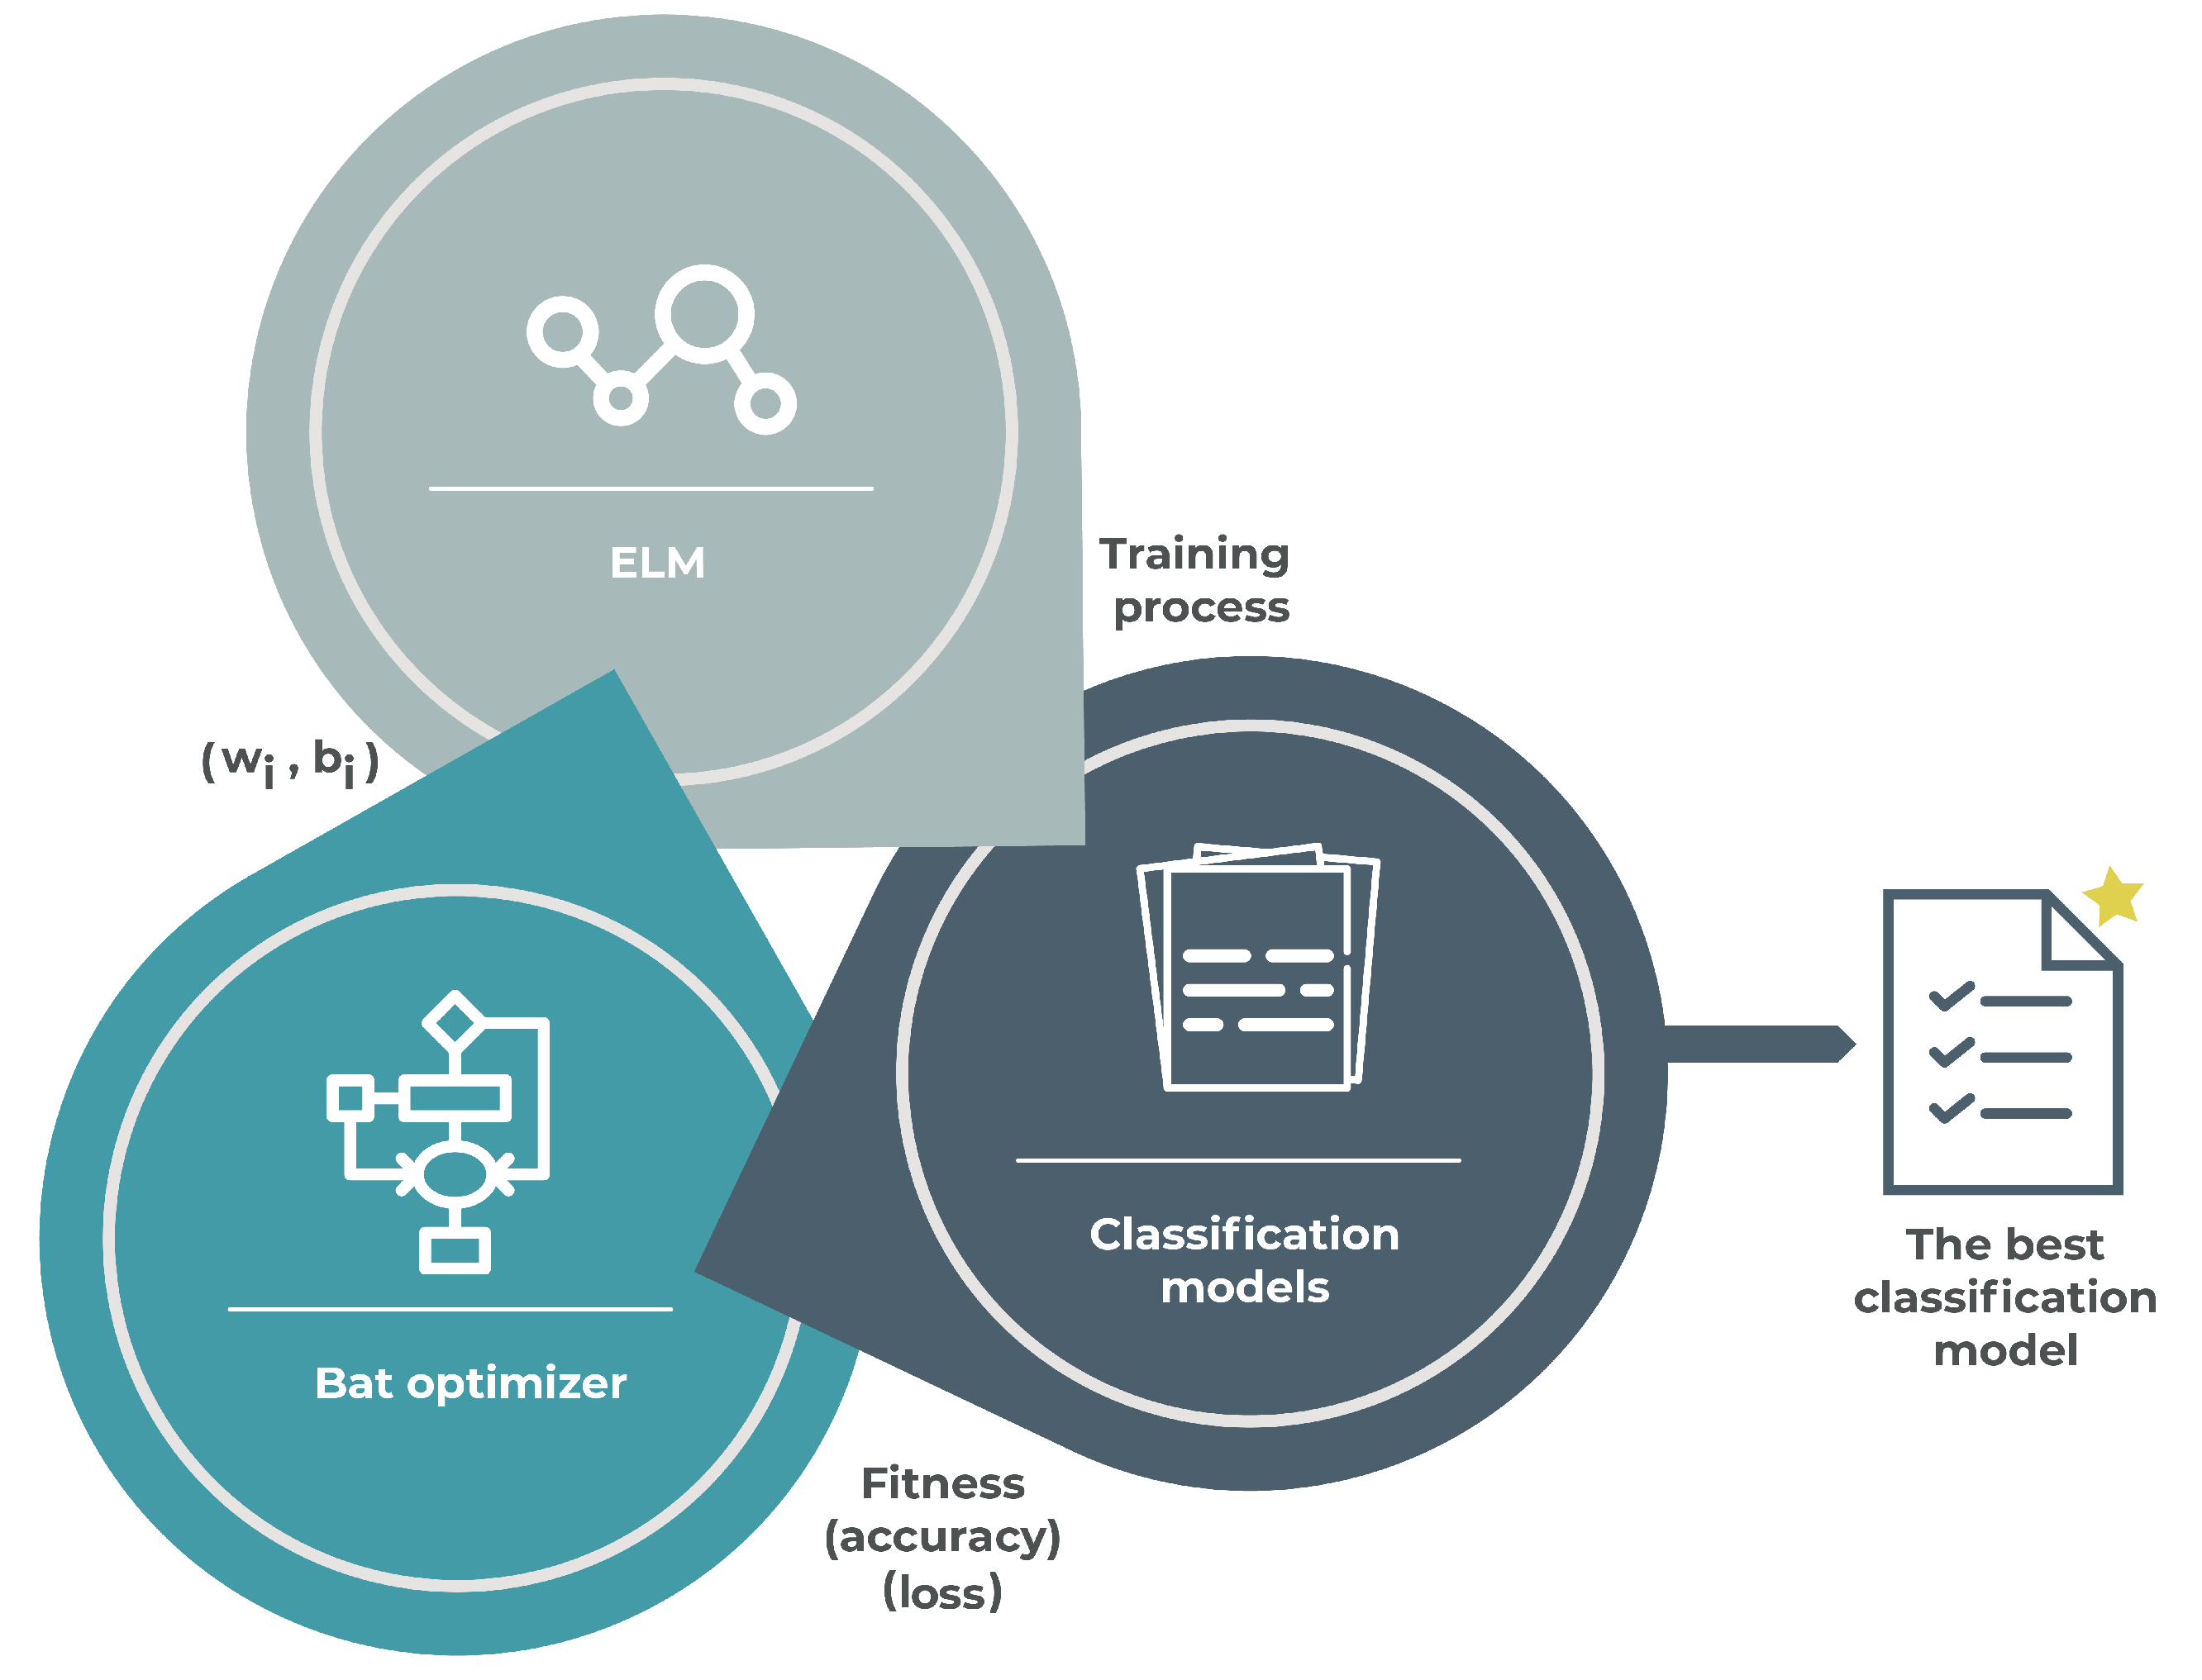
5. Proposed Approach

In optimization, the parameter setting is known as a strategy for providing larger flexibility and robustness to the solvers but requires an extremely careful initialization [48,49]. Indeed, parameters of algorithms influence on the efficiency of the solving process. It is not obvious to a priori define which parameter setting should be used. The optimal values for the parameters mainly depend on the problem and even the instance to deal with and on the search time that the user wants to spend in solving the problem. A universally optimal parameter value set for a given computational intelligence algorithm does not exist [49,50].
In evolutionary computation, automatic parameter tuning is mainly divided into two key approaches: the o f f l i n e parameter tuning and the o n l i n e parameter control. In the first one, the values of different parameters are fixed before the run of the solver. In this situation, no interaction between parameters is studied. This sequential optimization strategy does not guarantee to find the optimal setting, even if an exact optimization setting is performed. In the second one, the parameters are handled and updated during the run of the algorithm. This approach has widely been studied due to the search for the best tuning of parameters that can be considered as an optimization problem itself [50]. It is a complex and extensive task, and the responsibility falls in the capacity and the experience of an expert user. Under the paradigm of the online parameter control, we use a bio-inspired solver to finely determine the most successful set of weights and hidden layer biases for an ELM.
The main idea is to define the best configuration of ELM ( w i , β i ) using the optimization solver for generating solutions in order to properly train the ELM. This process operates as a loop statement by transferring the feedback or fitness (accuracy and loss) given by the ELM towards the optimizer, who tries to improve generated results. Finally, the best configuration of the ELM reaches the best classification model (see Figure 2).
As a bio-inspired solver, we propose the bat algorithm. Bat optimization, also known as the bat algorithm, is a swarm intelligence optimization technique for global numerical optimization and it was proposed by Yang in 2010 [19,51]. It is inspired by the echolocation behavior of bats that allows them to avoid obstacles while flying and it locates his food or shelter. In nature, only the species of the micro-bats exhibit this characteristic, which limits the technique [52]. To overcome this problem, the concept of a v i r t u a l b a t is proposed as an artificial bat indifferent to any species.
The bat algorithm has been developed following three simple rules:
  • It is assumed that all bats use echolocation to determine distances, and all of them are able to distinguish food, prey, and background barriers.
  • A bat b i searches for prey with position x i that initially is random. Bats changes its frequency depending on the proximity of their target, then affecting velocity. Thus, to change their position, all bats used frequency f i calculated by Equation (4) and velocity v i computed by Equation (5). The new position is defined by Equation (6). The bat algorithm is considered a frequency-tuning algorithm that provides a balanced combination of exploration and exploitation. While more (positive) velocity, more exploration, less (positive) velocity, more exploitation.
    f i = f m i n + ( f m a x f m i n ) β β U ( 0 , 1 )
    v ( i , t + 1 ) = v ( i , t ) + ( x b e s t x ( i , t ) ) f i
    x ( i , t + 1 ) = x ( i , t ) + v ( i , t + 1 )
  • Finally, the variability of solutions is given by loudness A 0 and a rate of pulse emission r ( 0 , 1 ) , determined by Equations (7) and (8), respectively. Although the loudness can vary in many ways, it is assumed that the loudness varies from a large (positive) A 0 to a minimum constant value A m i n .
    A ( i , t + 1 ) = α A 0 0 < α < 1
    r ( i , t + 1 ) = r ( i , 0 ) ( 1 e x p ( γ t ) ) γ > 0
Algorithm 1 illustrates the pseudo-code for bat optimization. At the beginning, a population of m bats is initialized with position x i and velocity v i . The position of a bat b i is a vector composed by the set of weights and biases. We instance each bat solution as the position b i . This position corresponds to a vector composed by the set of weights and biases. This vector is used by tuning and training the ELM. This training takes only one epoch and return the achieved accuracy and generated loss. After, the frequency f i at position x i is set followed by pulse rates and loudness, both through uniform distribution between zero and one. Finally, the accuracy and the loss, both are taken by the objective function to be evaluated them as fitness. In this study, we use the objective function as follows:
maximize k · a c c u r a c y + ( 1 k ) · l o s s
where k is a constant that weights the objectives of accuracy and loss. For computational experiments, k { 0 , 10 , 20 , , 100 } , therefore each evaluation of the the objective function is eleven times calculated. The best (greatest) value is returned as fitness and it is stored in ith position of the fitness vector f i t .
Next, a while loop is used to enclose a set of actions for being performed t times until the fixed number T of iterations is reached. Lines 7–11, the loudness of each bat (solution) is compared with a random value. If the loudness of the ith bat surpasses any other bat, then it decreases via Equation (7) and the ratio of pulse emission increases using Equation (8). This condition handles the variability of the potential solutions through the exploration process and the exploitation process. Small values for loudness suggest intensified solutions and large values of the rates of pulse emission. After, b e s t f i t and b e s t i n d e x are obtained by the evaluation o the objective function. If b e s t f i t is better than g l o b a l f i t , then b e s t f i t is stored in g l o b a l f i t .
Next, the loop statement between lines 16 and lines 25, is an equation representing the movement of bats. A solution is firstly selected among the current best solutions, and a new solution is generated via random walks (Equation (10)):
x n e w = x o l d + ϵ A ¯
where ϵ { 1 , 0 , 1 } and A ¯ represents the loudness average of all bats. Then, bats move according to Equations (4)–(6). Equation (4) controls the pace and range of bats movements, where β provides variability to the frequencies and it is randomly generated from an uniform distribution within the interval ( 0 , 1 ) . Equation (5) defines the velocity held by ith bat in time t, where x b e s t represents the current global best position encountered from the m bats. Finally, the Equation (6) determines the new position held by ith bat. At the end, the bats are ranked in order to find x b e s t , i.e., the best configuration ( w i , β i ) for the ELM, and thus it generates the best classification model.
Effectiveness of bat algorithm has been proved in a large instance of combinatorial and optimization problems. For example, in [53] an adaptive version of the metaheuristic was used as an optimization strategy of the observation matrix. In this line, a compact bat algorithm is proposed for the class of optimization problems involving devices that have limited hardware resources [54]. Finally, if we focus on machine learning techniques enhanced by the bat algorithm, we can find [55,56]. In these works, an improved bat algorithm is proposed to optimize artificial neural networks.
Algorithm 1: Bat algorithm.
Applsci 10 01827 i001

6. Computational Experiments

In this section, the proposed hybrid method is compared with the native version of the Extreme Learning Machine. We use the Python programming language to implement the neural artificial network. Experiments have been launched on a 2.5 Ghz Intel Core i5 7300HQ with 8 GB RAM machine running Windows 10. ELM was mainly managed by Anaconda and its packages: Tensorflow, Numpy, and Scipy. We employ 23 neurons in the input layer related directly to 23 features, i.e., N = 23 , each variable associated to one and only one neuron. In hidden layer, we use 12 nodes, i.e., N ˜ = 12 . We apriori define the the number of neurons, i.e., N and N ˜ , both remain unchanged during the computational experiments. All the inputs (attributes) have been normalized into the range [ 0 , 1 ] ; similarly, as we work a binary classification problem, the output (target) has been normalized into [ 0 , 1 ] . ELM only requires one epoch for training data. In this moment, ELM computes the Moore–Penrose generalized inverse H of the hidden layer output matrix H. Respect to the bat algorithm, it was coded by using native Python version 3, and we employ an initial configuration suggested in [57]: m = 20 , f m i n = 0.75 , f m a x = 1.25 , t m a x = 100 , α = γ = 0.9 , and ϵ = 1 .
In the training phase of the ELM, a set of models is generated and improved during the run of the bat algorithm. We perform multiple simulations with different discrete time intervals, in order to demonstrate the robust behavior of the proposed approach. The main idea is to know how the neural network works in its training phase. In this line, two key issues appear: underfitting and overfitting. Both topics can be considered as problems because do not allow that the machine learning properly generalizes the knowledge. In this case, will not give a good classification. To illustrate the performance of the BA-ELM, we evaluate scenarios using:
t T A c c t x A c c t y
t T L o s s t x L o s s t y
where T represents the maximum iteration, A c c t x and A c c t y describe given accuracy, and finally, L o s s t x and L o s s t y depict generated loss, both in the training phase and the validation phase, respectively. Moreover, we report four charts of accuracy and loss during the training phase.
From Figure 3, Figure 4, Figure 5 and Figure 6, it is indicated how the accuracy and loss both vary during the training phase. For instance, curves generated by the accuracy data allow us assume that there is not overfitting and underfitting because difference computed by Equation (11) trends to 0 (see Figure 3 and Figure 4). On the other hand, if we analyze drawn curves by loss data, we note that few iterations BA-ELM produces overfitting and underfitting calculated by Equation (12) (see Figure 5). However, as iterations pass, overfitting and underfitting begin to decrease (see Figure 6). This performance can be explained by converges of parameter setting given by bat algorithm because a properly tune provides models that better generalize knowledge [58].
In the classification phase, we run ELM and the optimized ELM both 31 times. Table 1 shows generated results. We can observe that the non-optimized ELM shows an excellent performance in the classification phase, reaching a maximum accuracy of 91.61%, generating an average accuracy close to 90.7%, and median value equals to 90.87%. These results expose that the ELM is able to properly work when patients present Parkinson’s Disease. Nevertheless, when we analyze the results generated by the optimized neural network, we can note an outstanding performance. For instance, the computed mean value and the calculated median value, both are similar and close to the maximum value (96.74%). This distribution can be seen in Figure 7, where we can observe that achieved values are homogeneously dispersed, so much that the difference between the best value and the worst value is evidently small (0.93%).
Regarding results for generated loss, again the optimized technique behaviors better than the static version, as shown in Figure 8. If we study the loss produced by ELM, we can note that these values are localized between 5.36% and 7.29%, while loss given by the BA-ELM are distributed between 3.27% and 4.25%. If we analyze 2-IQR for the generated loss, we can observe that BA-ELM produces fewer loss than the simple ELM when it classifies Parkinson’s Disease. Similarly, when the mean value is evaluated, the appeared difference between BA-ELM and ELM is abysmal. ELM exceeds 6.35% while BA-ELM does not surpass 3.73%.
To deep the generated results, we employ the statistical tests Kolmogorov-Smirnov-Lilliefors [43] and W i l c o x o n s s i g n e d r a n k , both described in the methodology section. For the first test, we found p-values equal to 0.001278 (the accuracy sample) and 0.000728 (the loss sample), both were smaller than 0.05 , therefore do not allow to assume that samples follow a normal distribution. The non-parametric test computed p-values equal to 6.665 × 10 17 and 1.644 × 10 18 for h a 0 and h e 0 , respectively. Again, both were smaller than 0.05 . These results indicate that h a 0 and h e 0 , they cannot be assumed. By contradiction, we can assume that BA-ELM works better than ELM, in precision as well as in loss.
By summarizing, if we consider the two approaches (accuracy and loss), the homogeneity of the results, and the hypothesis contrast, we can conclude that the optimized artificial method presents a robustness yield and it overcomes its static version. Then, we establish that bat algorithm is a suitable bio-inspired solver to optimize the ELM parameters and it shows outstanding results to classify voice signals in patients with Parkinson’s Disease.

7. Conclusions

Parkinson’s Disease is a degenerative disorder of the central nervous system and it is the most common movement disorder diseases. Its diagnosis is frequently difficult especially when it is at an early stage. An early indication of patients suffer the Parkinson’s Disease is the vocal impairment. Recent works have proposed mechanics to support the diagnosis task. In this paper, we propose an optimized ELM through the bio-inspired algorithm to properly classify patients with Parkinson’s Disease. The approximate method defines an optimal vector with input weights and biases values, at the same time. The idea is optimizing the training phase of the ELM to generate the best classification model. To solve this problem, we first propose the bat algorithm to compute the parameter values in order to find the best attainable configuration for the ELM, and then, we test this proposal on voice signals in patients with Parkinson’s Disease. Results suggest that the bat solver is an efficient optimizer for improving the yield of the ELM For this reason, we can guarantee that whether ELM is fine-tuned, efficient models can be developed by solving classification problems, and thus, BA-ELM become a real alternative to help potential expert users.
As future work, we plan to update this architecture in order to classify ultrasound medial images using different ANNs. Moreover, we will study the learnheuristic approach to take advantage of the machine learning world on optimization algorithms, mainly during the resolution processes, and thus to improve local and global searches. Finally, we consider use a hyper-metaheuristic approach to firstly find the best feature vector using a bio-inspired optimization algorithm and then, training the the already optimized ELM.

Author Contributions

Formal analysis: R.M. and R.O. Investigation: D.C., A.P., R.M., R.O., and R.S. Methodology: B.C., R.S., and C.T. Resources: B.C. and R.S. Software: D.C. and A.P. Validation: B.C., R.M., R.O., and C.T. Writing—original draft: D.C. Writing—review & editing: R.O., R.M., and C.T. All the authors of this paper hold responsibility for every part of this manuscript. All authors have read and agreed to the published version of the manuscript.

Funding

Ricardo Soto is supported by Grant CONICYT/FONDECYT/REGULAR/1190129. Broderick Crawford is supported by Grant CONICYT/FONDECYT/REGULAR/1171243.

Acknowledgments

The authors thank the referees for their helpful coultiments, which highly improved the content and readability of the work.

Conflicts of Interest

The authors declare no conflict of interest. The founding sponsors had no role in the design of the study; in the collection, analyses, or interpretation of data; in the writing of the manuscript, and in the decision to publish the results.

References

  1. Poewe, W.; Seppi, K.; Tanner, C.M.; Halliday, G.M.; Brundin, P.; Volkmann, J.; Schrag, A.E.; Lang, A.E. Parkinson disease. Nat. Rev. Dis. Primers 2017, 3. [Google Scholar] [CrossRef] [PubMed]
  2. Oung, Q.W.; Muthusamy, H.; Lee, H.L.; Basah, S.N.; Yaacob, S.; Sarillee, M.; Lee, C.H. Technologies for Assessment of Motor Disorders in Parkinson’s Disease: A Review. Sensors 2015, 15, 21710–21745. [Google Scholar] [CrossRef] [PubMed] [Green Version]
  3. Kieburtz, K.; Tilley, B.C.; Elm, J.J.; Babcock, D.; Hauser, R.; Ross, G.W.; Augustine, A.H.; Augustine, E.U.; Aminoff, M.J.; Bodis-Wollner, I.G.; et al. Effect of Creatine Monohydrate on Clinical Progression in Patients With Parkinson Disease: A Randomized Clinical Trial. JAMA 2015, 313, 584–593. [Google Scholar] [CrossRef] [PubMed]
  4. Bernardo, L.S.; Quezada, A.; Munoz, R.; Maia, F.M.; Pereira, C.R.; Wu, W.; de Albuquerque, V.H.C. Handwritten pattern recognition for early Parkinson’s disease diagnosis. Pattern Recognit. Lett. 2019, 78–84. [Google Scholar] [CrossRef]
  5. Gelb, D.J.; Oliver, E.; Gilman, S. Diagnostic criteria for Parkinson disease. Arch. Neurol. 1999, 56, 33–39. [Google Scholar] [CrossRef]
  6. Erdogdu Sakar, B.; Serbes, G.; Sakar, C.O. Analyzing the effectiveness of vocal features in early telediagnosis of Parkinson’s disease. PLoS ONE 2017, 12, e0182428. [Google Scholar] [CrossRef] [Green Version]
  7. Mirjalili, S.; Lewis, A. The Whale Optimization Algorithm. Adv. Eng. Softw. 2016, 95, 51–67. [Google Scholar] [CrossRef]
  8. Wu, T.; Yao, M.; Yang, J. Dolphin swarm algorithm. Front. Inf. Technol. Electron. Eng. 2016, 17, 717–729. [Google Scholar] [CrossRef]
  9. Eltaeib, T.; Mahmood, A. Differential Evolution: A Survey and Analysis. Appl. Sci. 2018, 8, 1945. [Google Scholar] [CrossRef] [Green Version]
  10. Chakraborty, A.; Kar, A.K. Swarm Intelligence: A Review of Algorithms. In Nature-Inspired Computing and Optimization; Springer International Publishing: Cham, Switzerland, 2017; pp. 475–494. [Google Scholar] [CrossRef]
  11. Câmara, D. Evolution and Evolutionary Algorithms. In Bio-inspired Networking; Elsevier: Amsterdam, The Netherlands, 2015; pp. 1–30. [Google Scholar] [CrossRef]
  12. Darwish, A. Bio-inspired computing: Algorithms review, deep analysis, and the scope of applications. Future Comput. Inform. J. 2018, 3, 231–246. [Google Scholar] [CrossRef]
  13. Bermejo, J.F.; Fernández, J.F.G.; Polo, F.O.; Márquez, A.C. A Review of the Use of Artificial Neural Network Models for Energy and Reliability Prediction. A Study of the Solar PV, Hydraulic and Wind Energy Sources. Appl. Sci. 2019, 9, 1844. [Google Scholar] [CrossRef] [Green Version]
  14. Firdaus, M.; Pratiwi, S.E.; Kowanda, D.; Kowanda, A. Literature review on Artificial Neural Networks Techniques Application for Stock Market Prediction and as Decision Support Tools. In Proceedings of the 2018 Third International Conference on Informatics and Computing (ICIC), Palembang, Indonesia, 17–18 October 2018. [Google Scholar] [CrossRef]
  15. Zhang, G. Neural networks for classification: A survey. IEEE Trans. Syst. Man Cybern. Part C Appl. Rev. 2000, 30, 451–462. [Google Scholar] [CrossRef] [Green Version]
  16. Bashiri, M.; Geranmayeh, A.F. Tuning the parameters of an artificial neural network using central composite design and genetic algorithm. Scientia Iranica 2011, 18, 1600–1608. [Google Scholar] [CrossRef] [Green Version]
  17. Huang, G.; Zhu, Q.; Siew, C. Extreme learning machine: Theory and applications. Neurocomputing 2006, 70, 489–501. [Google Scholar] [CrossRef]
  18. Huang, G.B.; Wang, D.H.; Lan, Y. Extreme learning machines: A survey. Int. J. Mach. Learn. Cybern. 2011, 2, 107–122. [Google Scholar] [CrossRef]
  19. Yang, X. A New Metaheuristic Bat-Inspired Algorithm. In Nature Inspired Cooperative Strategies for Optimization (NICSO 2010); Springer: Berlin/Heidelberg, Germany, 2010; pp. 65–74. [Google Scholar]
  20. Munoz, R.; Olivares, R.; Taramasco, C.; Villarroel, R.; Soto, R.; Alonso-Sánchez, M.F.; Merino, E.; de Albuquerque, V.H.C. A new EEG software that supports emotion recognition by using an autonomous approach. Neural Comput. Appl. 2018. [Google Scholar] [CrossRef]
  21. Taramasco, C.; Olivares, R.; Munoz, R.; Soto, R.; Villar, M.; de Albuquerque, V.H.C. The patient bed assignment problem solved by autonomous bat algorithm. Appl. Soft Comput. 2019, 81, 105484. [Google Scholar] [CrossRef]
  22. Little, M.A.; McSharry, P.E.; Roberts, S.J.; Costello, D.A.; Moroz, I.M. Exploiting Nonlinear Recurrence and Fractal Scaling Properties for Voice Disorder Detection. BioMed Eng. OnLine 2007, 6, 23. [Google Scholar] [CrossRef] [Green Version]
  23. Paredes, C.; Schuck, A. The Use of Wavelet Packet Transform and Artificial Neural Networks in Analysis and Classification of Dysphonic Voices. IEEE Trans. Biomed. Eng. 2007, 54, 1898–1900. [Google Scholar] [CrossRef] [Green Version]
  24. Khamparia, A.; Gupta, D.; Nguyen, N.G.; Khanna, A.; Pandey, B.; Tiwari, P. Sound Classification Using Convolutional Neural Network and Tensor Deep Stacking Network. IEEE Access 2019, 7, 7717–7727. [Google Scholar] [CrossRef]
  25. Purwins, H.; Li, B.; Virtanen, T.; Schluter, J.; Chang, S.; Sainath, T. Deep Learning for Audio Signal Processing. IEEE J. Select. Top. Signal Process. 2019, 13, 206–219. [Google Scholar] [CrossRef] [Green Version]
  26. Rabiner, L. On the use of autocorrelation analysis for pitch detection. IEEE Trans. Acoust. Speech Signal Process. 1977, 25, 24–33. [Google Scholar] [CrossRef] [Green Version]
  27. Markel, J. The SIFT algorithm for fundamental frequency estimation. IEEE Trans. Audio Electroacoust. 1972, 20, 367–377. [Google Scholar] [CrossRef] [Green Version]
  28. Smitha; Shetty, S.; Hegde, S.; Dodderi, T. Classification of Healthy and Pathological voices using MFCC and ANN. In Proceedings of the 2018 Second International Conference on Advances in Electronics, Computers and Communications (ICAECC), Bangalore, India, 9–10 February 2018. [Google Scholar] [CrossRef]
  29. Firdos, S.; Umarani, K. Disordered voice classification using SVM and feature selection using GA. In Proceedings of the 2016 Second International Conference on Cognitive Computing and Information Processing (CCIP), Mysore, India, 12–13 August 2016. [Google Scholar] [CrossRef]
  30. Lu, N.; Zhou, J.; He, Y.; Liu, Y. Particle Swarm Optimization for Parameter Optimization of Support Vector Machine Model. In Proceedings of the 2009 Second International Conference on Intelligent Computation Technology and Automation, Changsha, China, 10–11 October 2009. [Google Scholar] [CrossRef]
  31. Subbulakshmi, C.V.; Deepa, S.N. Medical Dataset Classification: A Machine Learning Paradigm Integrating Particle Swarm Optimization with Extreme Learning Machine Classifier. Sci. World J. 2015, 2015, 1–12. [Google Scholar] [CrossRef] [Green Version]
  32. Xu, Y.; Yao, F.; Chai, S.; Sun, L. Multi-objective optimization of extreme learning machine using physical programming. In Proceedings of the 2016 35th Chinese Control Conference (CCC), Chengdu, China, 27–29 July 2016. [Google Scholar] [CrossRef]
  33. Cai, Y.; Liu, X.; Wu, Y.; Hu, P.; Wang, R.; Wu, B.; Cai, Z. Extreme Learning Machine Based on Evolutionary Multi-objective Optimization. In Communications in Computer and Information Science; Springer: Singapore, 2017; pp. 420–435. [Google Scholar] [CrossRef]
  34. Mao, W.; Tian, M.; Cao, X.; Xu, J. Model selection of extreme learning machine based on multi-objective optimization. Neural Comput. Appl. 2012, 22, 521–529. [Google Scholar] [CrossRef]
  35. Yunusova, Y.; Weismer, G.; Westbury, J.R.; Lindstrom, M.J. Articulatory Movements During Vowels in Speakers With Dysarthria and Healthy Controls. J. Speech Lang. Hear. Res. 2008, 51, 596–611. [Google Scholar] [CrossRef]
  36. Falk, T.H.; Chan, W.Y.; Shein, F. Characterization of atypical vocal source excitation, temporal dynamics and prosody for objective measurement of dysarthric word intelligibility. Speech Commun. 2012, 54, 622–631. [Google Scholar] [CrossRef]
  37. Sakar, C.O.; Serbes, G.; Gunduz, A.; Tunc, H.C.; Nizam, H.; Sakar, B.E.; Tutuncu, M.; Aydin, T.; Isenkul, M.E.; Apaydin, H. A comparative analysis of speech signal processing algorithms for Parkinson’s disease classification and the use of the tunable Q-factor wavelet transform. Appl. Soft Comput. 2019, 74, 255–263. [Google Scholar] [CrossRef]
  38. Dua, D.; Graff, C. UCI Machine Learning Repository. 2017. Available online: http://archive.ics.uci.edu/ml (accessed on 25 November 2019).
  39. Noda, J.J.; Travieso-González, C.M.; Sánchez-Rodríguez, D.; Alonso-Hernández, J.B. Acoustic Classification of Singing Insects Based on MFCC/LFCC Fusion. Appl. Sci. 2019, 9, 4097. [Google Scholar] [CrossRef] [Green Version]
  40. Tsanas, A.; Little, M.A.; McSharry, P.E.; Spielman, J.; Ramig, L.O. Novel Speech Signal Processing Algorithms for High-Accuracy Classification of Parkinson’s Disease. IEEE Trans. Biomed. Eng. 2012, 59, 1264–1271. [Google Scholar] [CrossRef] [Green Version]
  41. Noda, J.; Travieso, C.; Sánchez-Rodríguez, D. Fusion of Linear and Mel Frequency Cepstral Coefficients for Automatic Classification of Reptiles. Appl. Sci. 2017, 7, 178. [Google Scholar] [CrossRef] [Green Version]
  42. Humayoo, M.; Cheng, X. Parameter Estimation with the Ordered l2 Regularization via an Alternating Direction Method of Multipliers. Appl. Sci. 2019, 9, 4291. [Google Scholar] [CrossRef] [Green Version]
  43. Lilliefors, H. On the Kolmogorov-Smirnov Test for Normality with Mean and Variance Unknown. J. Am. Stat. Assoc. 1967, 62, 399–402. [Google Scholar] [CrossRef]
  44. Mann, H.; Donald, W. On a Test of Whether one of Two Random Variables is Stochastically Larger than the Other. Ann. Math. Statist. 1947, 18, 50–60. [Google Scholar] [CrossRef]
  45. Schmidhuber, J. Deep learning in neural networks: An overview. Neural Netw. 2015, 61, 85–117. [Google Scholar] [CrossRef] [Green Version]
  46. Gavrilescu, M.; Vizireanu, N. Feedforward Neural Network-Based Architecture for Predicting Emotions from Speech. Data 2019, 4, 101. [Google Scholar] [CrossRef] [Green Version]
  47. Cao, W.; Gao, J.; Ming, Z.; Cai, S. Some Tricks in Parameter Selection for Extreme Learning Machine. IOP Conf. Ser. Mater. Sci. Eng. 2017, 261, 012002. [Google Scholar] [CrossRef]
  48. Huang, C.; Li, Y.; Yao, X. A Survey of Automatic Parameter Tuning Methods for Metaheuristics. IEEE Trans. Evol. Comput. 2019, 1–16. [Google Scholar] [CrossRef]
  49. Stützle, T.; López-Ibáñez, M.; Pellegrini, P.; Maur, M.; de Oca, M.M.; Birattari, M.; Dorigo, M. Parameter Adaptation in Ant Colony Optimization. In Autonomous Search; Springer: Berlin/Heidelberg, Germany, 2011; pp. 191–215. [Google Scholar] [CrossRef]
  50. Talbi, E. Metaheuristics: From Design to Implementation; John Wiley & Sons: Hoboken, NJ, USA, 2009. [Google Scholar]
  51. Yang, X. Nature-Inspired Metaheuristic Algorithms, 2nd ed.; Luniver Press: Beckington, UK, 2010. [Google Scholar]
  52. Yang, X.; Gandomi, A.H. Bat algorithm: A novel approach for global engineering optimization. Eng. Comput. 2012, 29, 464–483. [Google Scholar] [CrossRef] [Green Version]
  53. Cui, Z.; Zhang, C.; Zhao, Y.; Shi, Z. Adaptive Bat Algorithm Optimization Strategy for Observation Matrix. Appl. Sci. 2019, 9, 3008. [Google Scholar] [CrossRef] [Green Version]
  54. Nguyen, T.; Pan, J.; Dao, T. A Compact Bat Algorithm for Unequal Clustering in Wireless Sensor Networks. Appl. Sci. 2019, 9, 1973. [Google Scholar] [CrossRef] [Green Version]
  55. Bangyal, W.H.; Ahmad, J.; Rauf, H.T. Optimization of Neural Network Using Improved Bat Algorithm for Data Classification. J. Med. Imaging Health Inform. 2019, 9, 670–681. [Google Scholar] [CrossRef]
  56. Jaddi, N.S.; Abdullah, S.; Hamdan, A.R. Optimization of neural network model using modified bat-inspired algorithm. Appl. Soft Comput. 2015, 37, 71–86. [Google Scholar] [CrossRef]
  57. Yang, X.S.; He, X. Bat algorithm: Literature review and applications. Int. J. Bio-Inspired Comput. 2013, 5, 141. [Google Scholar] [CrossRef] [Green Version]
  58. Marwala, T. Handbook of Machine Learning; World Scientific: Singapore, 2018. [Google Scholar] [CrossRef]
Figure 1. ELM architecture.
Applsci 10 01827 g001
Figure 2. Representation of the process used in the proposed BA-ELM. ELM starts by randomly initializing the input weights and hidden biases. Then, ELM is trained and generates a learning model. This model gives an accuracy and a loss, both are used by bat algorithm to be evaluated as the fitness. Finally, the bat algorithm computes new weights and biases for the ELM. This process operartes while a stop criteria is met.
Applsci 10 01827 g002
Figure 3. Accuracy for BA-ELM training phase with 50 iterations.
Applsci 10 01827 g003
Figure 4. Accuracy for BA-ELM training phase with 100 iterations.
Applsci 10 01827 g004
Figure 5. Loss for BA-ELM training phase with 50 iterations.
Applsci 10 01827 g005
Figure 6. Loss for BA-ELM training phase with 100 iterations.
Applsci 10 01827 g006
Figure 7. Accuracy distribution of ELM versus BA-ELM.
Applsci 10 01827 g007
Figure 8. Loss distribution of ELM versus BA-ELM.
Applsci 10 01827 g008
Table 1. Statistical results of ELM and BA-ELM.
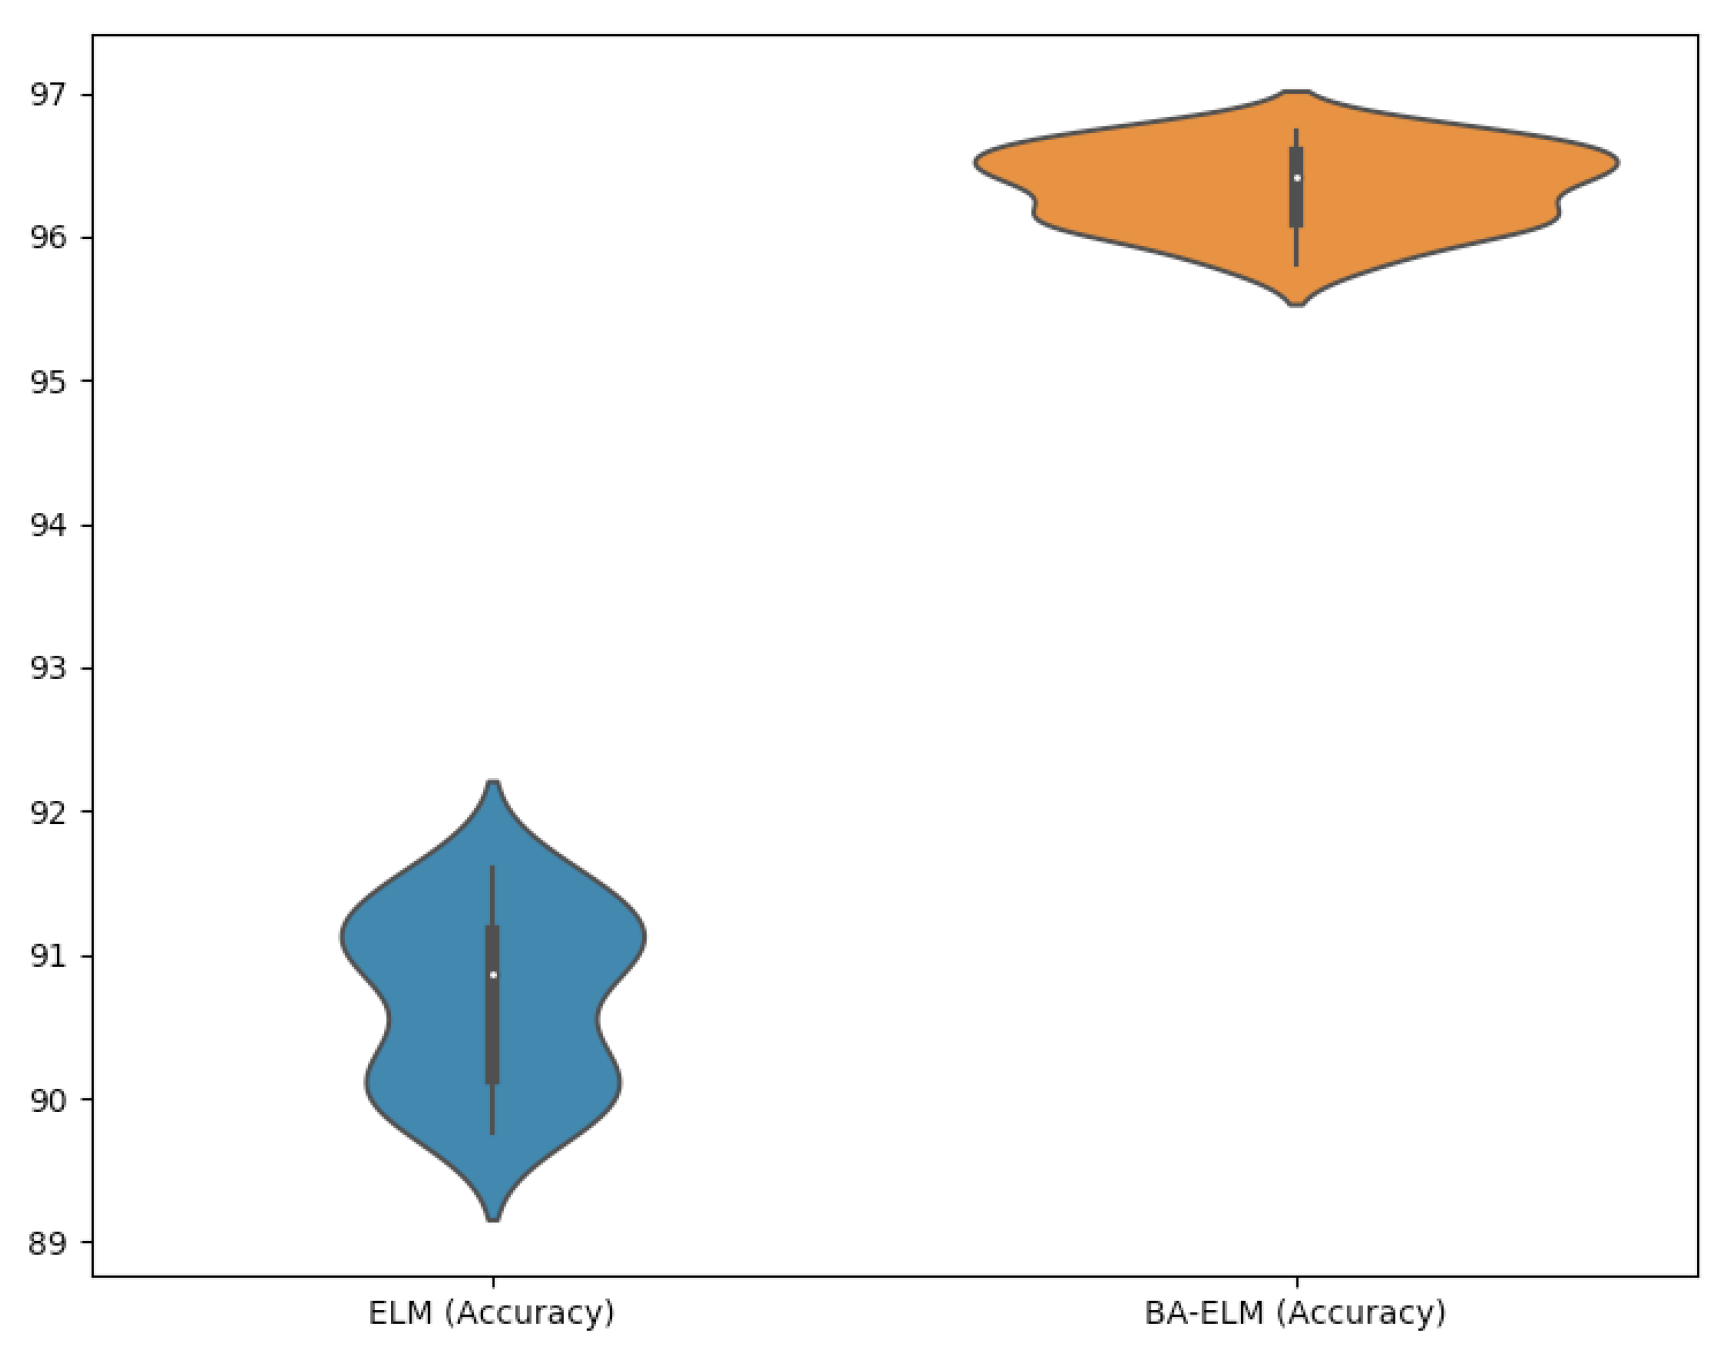
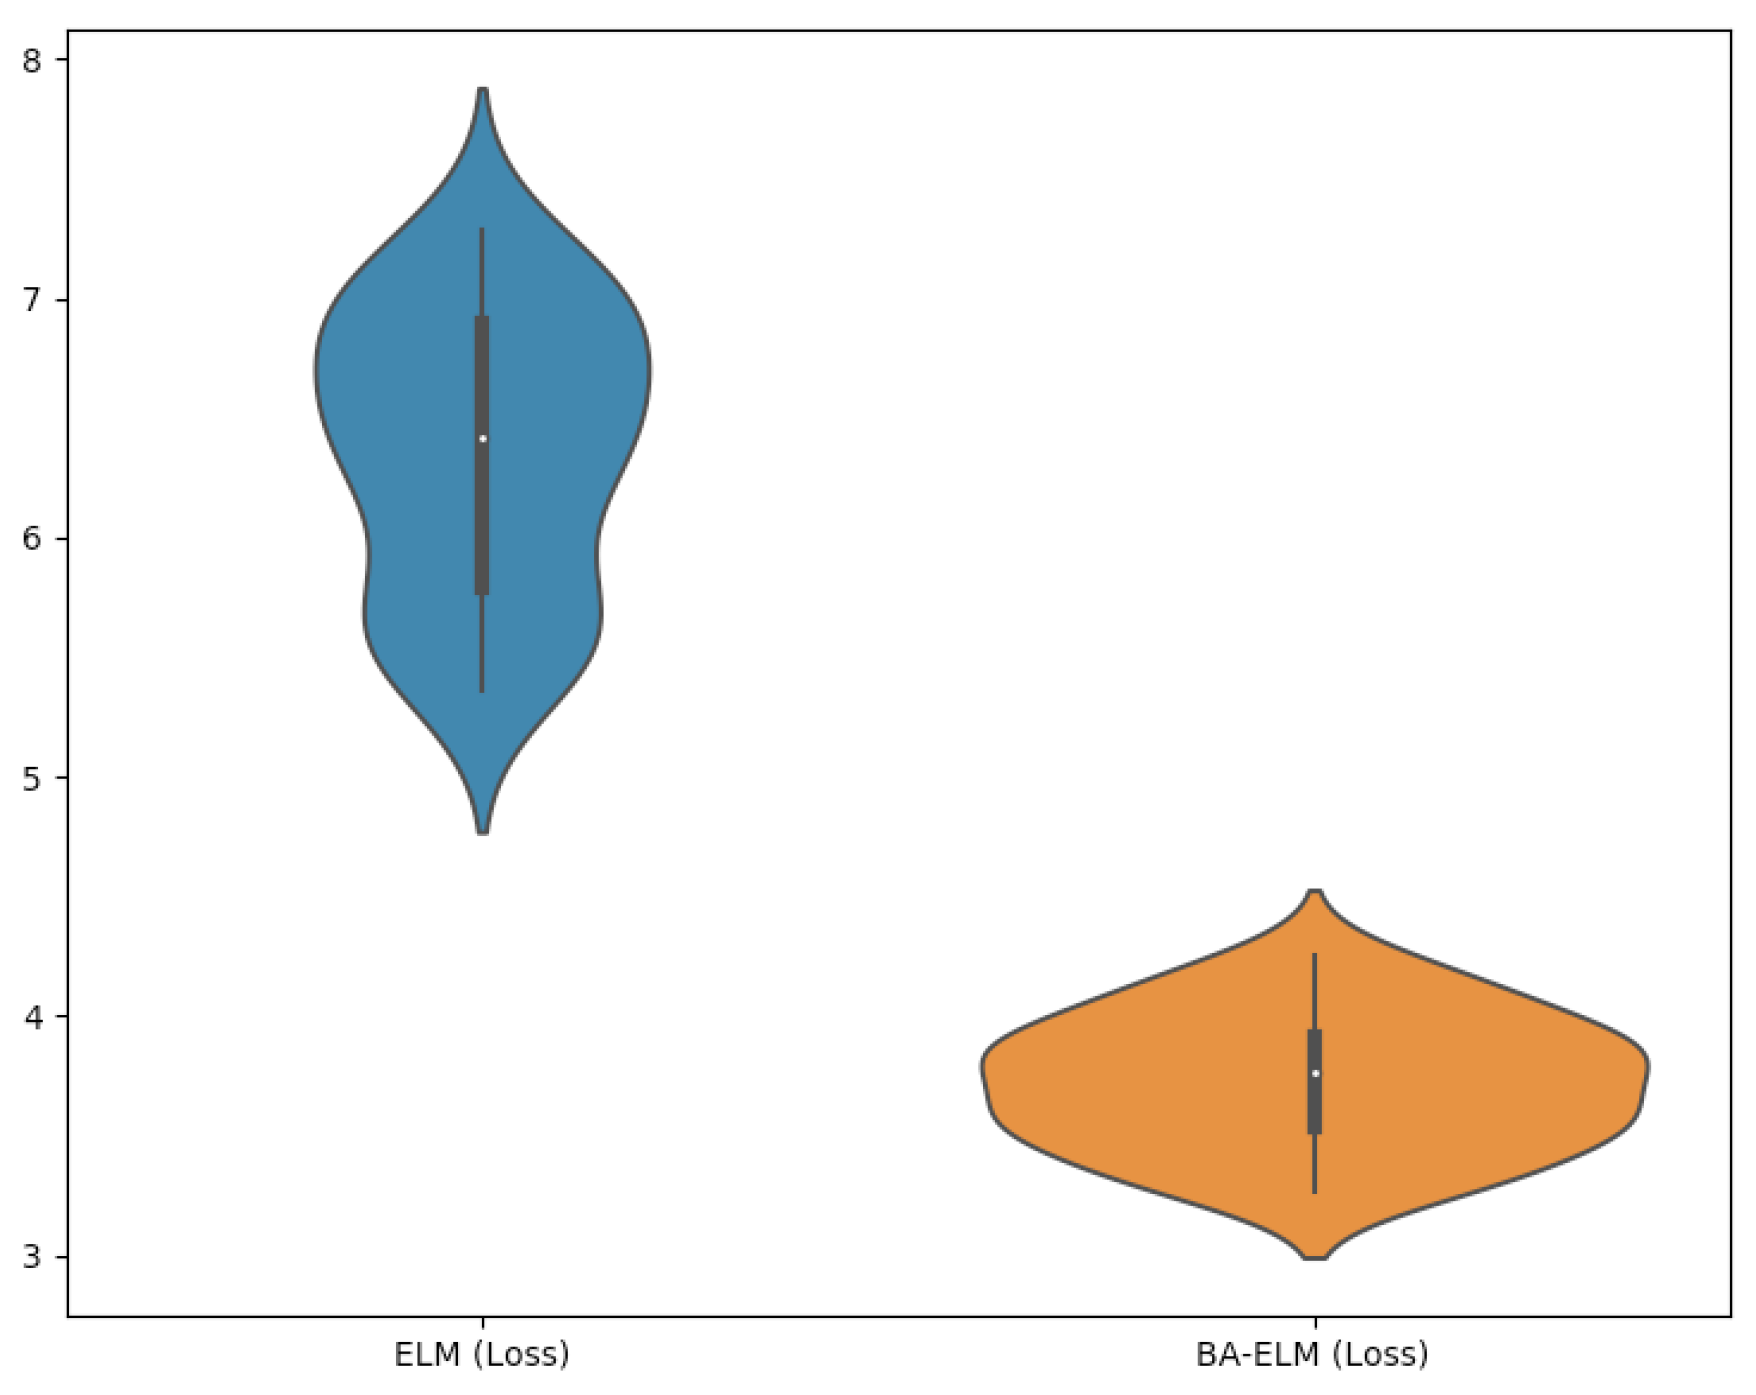
Statistical Comparison
ItemAccuracyLoss
ELMBA-ELMELMBA-ELM
Average90.7096.346.353.72
Standard deviation0.590.270.580.27
Minimum89.7695.815.363.27
1-IQR (25%)90.1496.115.783.53
2-IQR (50%)90.8796.416.423.77
3-IQR (75%)91.1596.586.893.91
Maximum91.6196.747.294.25

