PET/CT Radiomics in Lung Cancer: An Overview

 ,
,  , ,
, ,  , and
, and 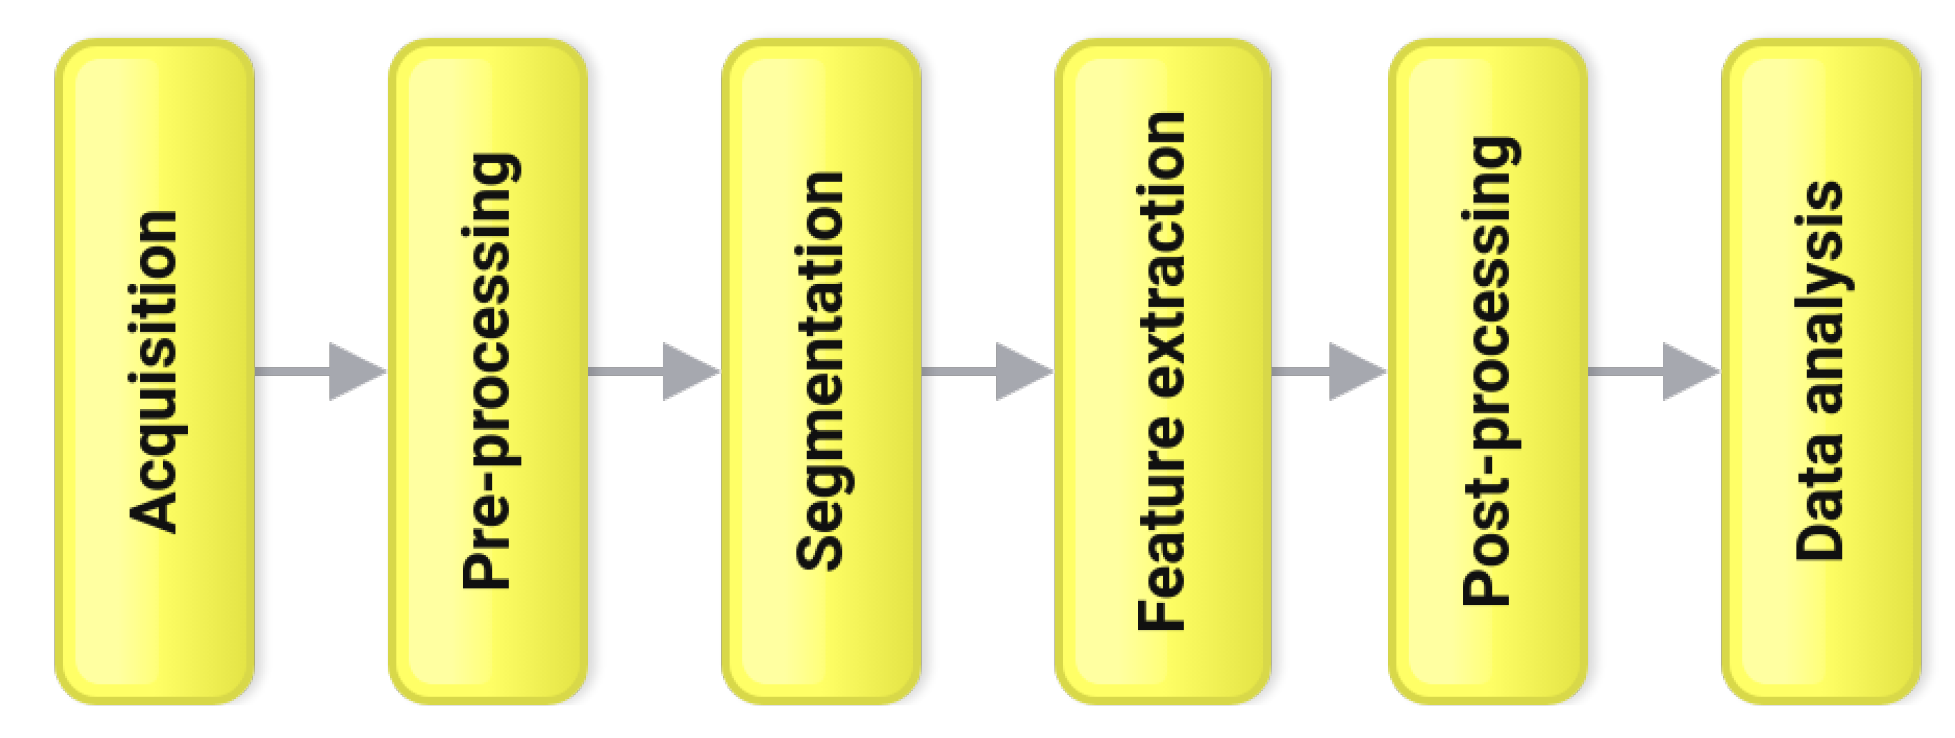
Abstract
1. Introduction
2. Methodology
2.1. Acquisition
2.2. Pre-Processing
2.3. Segmentation
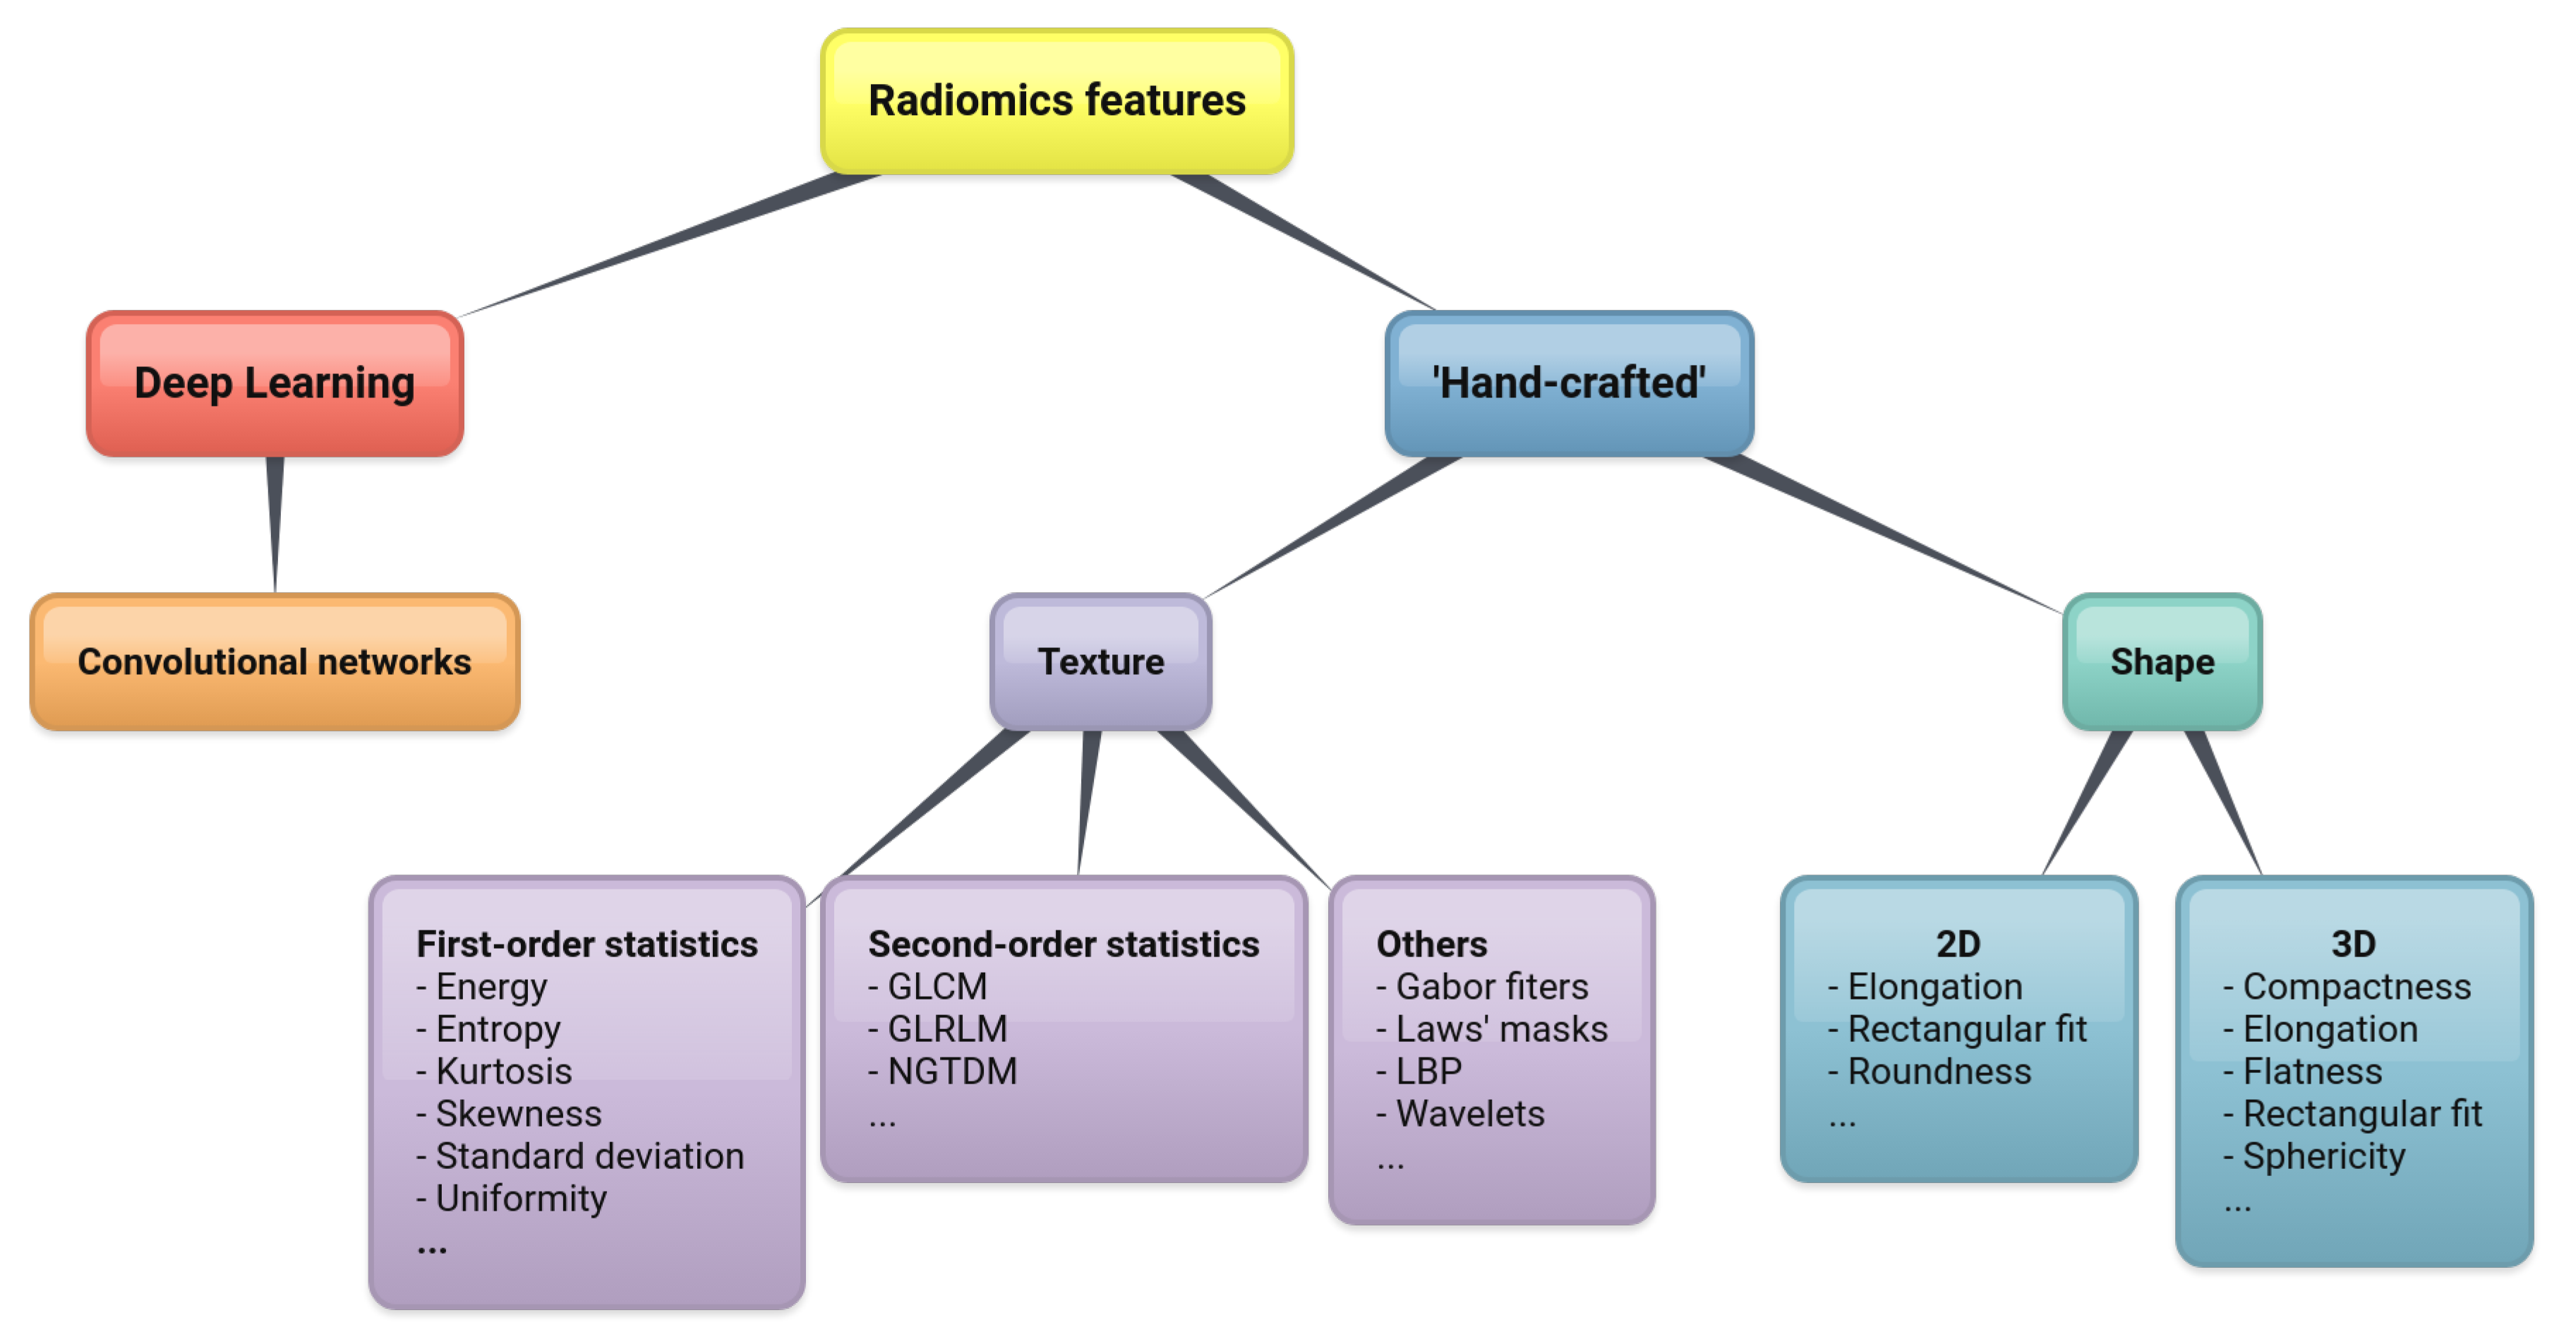
2.4. Feature Extraction
2.4.1. Shape Features
2.4.2. Texture Features
2.4.3. Deep Learning
2.5. Post Processing
2.6. Data Analysis
3. Applications
3.1. Discrimination between Benign and Malignant Pulmonary Nodules
3.2. Classification between Primary and Metastatic Lesions; Histological Subtyping
3.3. Prediction of Survival
3.4. Prediction of Response to Treatment
4. Discussion
5. Conclusions and Perspectives
Author Contributions
Funding
Conflicts of Interest
Abbreviations
| CNN | Convolutional Neural Network(s) |
| CT | Computed Tomography |
| GLCM | Grey-Level Co-occurrence Matrices |
| IBSI | The Image Biomarker Standardization Initiative |
| LDA | Linear Discriminant Analysis |
| MDS | Multi-Dimensional Scaling |
| MRI | Magnetic Resonance Imaging |
| NGTDM | Neighborhood Grey-Tone Difference Matrices |
| NSCLC | Non-Small-Cell Lung Cancer |
| OS | Overall Survival |
| PCA | Principal Components Analysis |
| PET | Positron Emission Tomography |
| ROI | Region(s) of Interest |
| VOI | Volume(s) of Interest |
| SPN | Solitary Pulmonary Nodule(s) |
| SCLC | Small-Cell Lung Cancer |
| SUV | Standardized Uptake Value |
References
- American Cancer Society. Key Statistics for Lung Cancer. 2019. Available online: https://www.cancer.org/cancer/lung-cancer/about/key-statistics.html (accessed on 24 November 2019).
- Associazione Italiana di Oncologia Medica; Associazione Italiana dei Registri Tumori. I Numeri del Cancro in Italia. 2019. Available online: https://www.aiom.it/wp-content/uploads/2019/09/2019_Numeri_Cancro-operatori-web.pdf (accessed on 27 January 2020).
- American Cancer Society. Lung Cancer Survival Rates. 2019. Available online: https://www.cancer.org/cancer/lung-cancer/detection-diagnosis-staging/survival-rates.html (accessed on 24 November 2019).
- Gillies, R.; Kinahan, P.; Hricak, H. Radiomics: Images are more than pictures, they are data. Radiology 2016, 278, 563–577. [Google Scholar] [CrossRef]
- Keek, S.; Leijenaar, R.; Jochems, A.; Woodruff, H. A review on radiomics and the future of theranostics for patient selection in precision medicine. Br. J. Radiol. 2018, 91, 20170926. [Google Scholar] [CrossRef]
- Rizzo, S.; Botta, F.; Raimondi, S.; Origgi, D.; Fanciullo, C.; Morganti, A.; Bellomi, M. Radiomics: The facts and the challenges of image analysis. Eur. Radiol. Exp. 2018, 2, 36. [Google Scholar] [CrossRef]
- Aiello, M.; Cavaliere, C.; D’Albore, A.; Salvatore, M. The challenges of diagnostic imaging in the era of big data. J. Clin. Med. 2019, 8, 316. [Google Scholar] [CrossRef]
- Kirienko, M.; Cozzi, L.; Antunovic, L.; Lozza, L.; Fogliata, A.; Voulaz, E.; Rossi, A.; Chiti, A.; Sollini, M. Prediction of disease-free survival by the PET/CT radiomic signature in non-small cell lung cancer patients undergoing surgery. Eur. J. Nucl. Med. Mol. Imaging 2018, 45, 207–217. [Google Scholar] [CrossRef]
- Castiglioni, I.; Gilardi, M. Radiomics: Is it time to compose the puzzle? Clin. Transl. Imaging 2018, 6, 411–413. [Google Scholar] [CrossRef]
- Oikonomou, A.; Khalvati, F.; Tyrrell, P.; Haider, M.; Tarique, U.; Jimenez-Juan, L.; Tjong, M.; Poon, I.; Eilaghi, A.; Ehrlich, L.; et al. Radiomics analysis at PET/CT contributes to prognosis of recurrence and survival in lung cancer treated with stereotactic body radiotherapy. Sci. Rep. 2018, 8, 4003. [Google Scholar] [CrossRef]
- Sollini, M.; Cozzi, L.; Antunovic, L.; Chiti, A.; Kirienko, M. PET Radiomics in NSCLC: State of the art and a proposal for harmonization of methodology. Sci. Rep. 2017, 7, 358. [Google Scholar] [CrossRef]
- Lee, G.; Lee, H.; Park, H.; Schiebler, M.; van Beek, E.; Ohno, Y.; Seo, J.; Leung, A. Radiomics and its emerging role in lung cancer research, imaging biomarkers and clinical management: State of the art. Eur. J. Radiol. 2017, 86, 297–307. [Google Scholar] [CrossRef]
- Chen, B.; Zhang, R.; Gan, Y.; Yang, L.; Li, W. Development and clinical application of radiomics in lung cancer. Radiat. Oncol. 2017, 12, 154. [Google Scholar] [CrossRef]
- Thawani, R.; McLane, M.; Beig, N.; Ghose, S.; Prasanna, P.; Velcheti, V.; Madabhushi, A. Radiomics and radiogenomics in lung cancer: A review for the clinician. Lung Cancer 2018, 115, 34–41. [Google Scholar] [CrossRef]
- Hassani, C.; Varghese, B.; Nieva, J.; Duddalwar, V. Radiomics in pulmonary lesion imaging. Am. J. Roentgenol. 2019, 212, 497–504. [Google Scholar] [CrossRef]
- Bailly, C.; Bodet-Milin, C.; Bourgeois, M.; Gouard, S.; Ansquer, C.; Barbaud, M.; Sébille, J.C.; Chérel, M.; Kraeber-Bodéré, F.; Carlier, T. Exploring tumor heterogeneity using PET imaging: The big picture. Cancers 2019, 11, 1282. [Google Scholar] [CrossRef]
- Bianconi, F.; Fravolini, M.; Palumbo, I.; Palumbo, B. Shape and texture analysis of radiomic data for Computer-assisted Diagnosis and prognostication: An overview. In Proceedings of the International Conference on Design Tools and Methods in Industrial Engineering (ADM), Modena, Italy, 9–10 September 2019; Rizzi, C., Andrisano, A., Leali, F., Gherardini, F., Pini, F., Vergnano, A., Eds.; Lecture Notes in Mechanical Engineering. Springer: Modena, Italy, 2019; pp. 3–14. [Google Scholar]
- Van Velden, F.H.; Kramer, G.M.; Frings, V.; Nissen, I.A.; Mulder, E.R.; de Langen, A.J.; Hoekstra, O.S.; Smit, E.F.; Boellaard, R. Repeatability of Radiomic Features in Non-Small-Cell Lung Cancer [18F]FDG-PET/CT Studies: Impact of Reconstruction and Delineation. Mol. Imaging Biol. 2016, 18, 788–795. [Google Scholar] [CrossRef]
- Traverso, A.; Wee, L.; Dekker, A.; Gillies, R. Repeatability and Reproducibility of Radiomic Features: A Systematic Review. Int. J. Radiat. Oncol. Biol. Phys. 2018, 102, 1143–1158. [Google Scholar] [CrossRef]
- Fave, X.; Zhang, L.; Yang, J.; Mackin, D.; Balter, P.; Gomez, D.; Followill, D.; Jones, A.; Stingo, F.; Court, L. Impact of image preprocessing on the volume dependence and prognostic potential of radiomics features in non-small cell lung cancer. Transl. Cancer Res. 2016, 5, 349–363. [Google Scholar] [CrossRef]
- Brunese, L.; Greco, B.; Setola, F.; Lassandro, F.; Guarracino, M.; De Rimini, M.; Piccolo, S.; De Rosa, N.; Muto, R.; Bianco, A.; et al. Non-small cell lung cancer evaluated with quantitative contrast-enhanced CT and PET-CT: Net enhancement and standardized uptake values are related to tumor size and histology. Med. Sci. Monit. 2013, 19, 95–101. [Google Scholar] [CrossRef]
- Ravanelli, M.; Farina, D.; Morassi, M.; Roca, E.; Cavalleri, G.; Tassi, G.; Maroldi, R. Texture analysis of advanced non-small cell lung cancer (NSCLC) on contrast-enhanced computed tomography: Prediction of the response to the first-line chemotherapy. Eur. Radiol. 2013, 23, 3450–3455. [Google Scholar] [CrossRef]
- Pyka, T.; Bundschuh, R.; Andratschke, N.; Mayer, B.; Specht, H.; Papp, L.; Zsótér, N.; Essler, M. Textural features in pre-treatment [F18]-FDG-PET/CT are correlated with risk of local recurrence and disease-specific survival in early stage NSCLC patients receiving primary stereotactic radiation therapy. Radiat. Oncol. 2015, 10, 100. [Google Scholar] [CrossRef]
- Bianconi, F.; Fravolini, M.; Bello-Cerezo, R.; Minestrini, M.; Scialpi, M.; Palumbo, B. Evaluation of shape and textural features from CT as prognostic biomarkers in non-small cell lung cancer. Anticancer. Res. 2018, 38, 2155–2160. [Google Scholar]
- Chithra, A.; Renjen Roy, R. Otsu’s Adaptive Thresholding Based Segmentation for Detection of Lung Nodules in CT Image. In Proceedings of the 2nd International Conference on Trends in Electronics and Informatics (ICOEI), Tirunelveli, India, 11–12 May 2018; pp. 1303–1307. [Google Scholar]
- Krishnan, K.; Ibanez, L.; Turner, W.; Jomier, J.; Avila, R. An open-source toolkit for the volumetric measurement of CT lung lesions. Opt. Express 2010, 18, 15256–15266. [Google Scholar] [CrossRef] [PubMed]
- Yip, S.; Parmar, C.; Blezek, D.; Estepar, R.; Pieper, S.; Kim, J.; Aerts, H. Application of the 3D slicer chest imaging platform segmentation algorithm for large lung nodule delineation. PLoS ONE 2017, 12, e0178944. [Google Scholar] [CrossRef] [PubMed]
- Hatt, M.; Laurent, B.; Fayad, H.; Jaouen, V.; Visvikis, D.; Le Rest, C. Tumour functional sphericity from PET images: Prognostic value in NSCLC and impact of delineation method. Eur. J. Nucl. Med. Mol. Imaging 2018, 45, 630–641. [Google Scholar] [CrossRef] [PubMed]
- Limkin, E.; Reuzé, S.; Carré, A.; Sun, R.; Schernberg, A.; Alexis, A.; Deutsch, E.; Ferté, C.; Robert, C. The complexity of tumor shape, spiculatedness, correlates with tumor radiomic shape features. Sci. Rep. 2019, 9, 4329. [Google Scholar] [CrossRef]
- O’Connor, J.; Rose, C.; Waterton, J.; Carano, R.; Parker, G.; Jackson, A. Imaging intratumor heterogeneity: Role in therapy response, resistance, and clinical outcome. Clin. Cancer Res. 2015, 21, 249–257. [Google Scholar] [CrossRef]
- Bashir, U.; Siddique, M.; McLean, E.; Goh, V.; Cook, G. Imaging heterogeneity in lung cancer: Techniques, applications, and challenges. Am. J. Roentgenol. 2016, 207, 534–543. [Google Scholar] [CrossRef]
- Aerts, H.; Velazquez, E.; Leijenaar, R.; Parmar, C.; Grossmann, P.; Cavalho, S.; Bussink, J.; Monshouwer, R.; Haibe-Kains, B.; Rietveld, D.; et al. Decoding tumor phenotype by noninvasive imaging using a quantitative radiomics approach. Nat. Commun. 2014, 5, 4006. [Google Scholar] [CrossRef]
- Haralick, R.M.; Shanmugam, K.; Dinstein, I. Textural Features for Image Classification. IEEE Trans. Syst. Man, Cybern. 1973, 3, 610–621. [Google Scholar] [CrossRef]
- Galloway, M. Texture analysis using gray level run lengths. Comput. Graph. Image Process. 1975, 4, 172–179. [Google Scholar] [CrossRef]
- Adamasun, M.; King, R. Textural features corresponding to textural properties. IEEE Trans. Syst. Man Cybern. 1989, 19, 1264–1274. [Google Scholar] [CrossRef]
- Song, J.; Liu, Z.; Zhong, W.; Huang, Y.; Ma, Z.; Dong, D.; Liang, C.; Tian, J. Non-small cell lung cancer: Quantitative phenotypic analysis of CT images as a potential marker of prognosis. Sci. Rep. 2016, 6, 38282. [Google Scholar] [CrossRef]
- Hawkins, S.; Wang, H.; Liu, Y.; Garcia, A.; Stringfield, O.; Krewer, H.; Li, Q.; Cherezov, D.; Gatenby, R.; Balagurunathan, Y.; et al. Predicting Malignant Nodules from Screening CT Scans. J. Thorac. Oncol. 2016, 11, 2120–2128. [Google Scholar] [CrossRef] [PubMed]
- Zhang, G.; Yang, Z.; Gong, L.; Jiang, S.; Wang, L. Classification of benign and malignant lung nodules from CT images based on hybrid features. Phys. Med. Biol. 2019, 64, 125011. [Google Scholar] [CrossRef] [PubMed]
- Lecun, Y.; Bengio, Y.; Hinton, G. Deep learning. Nature 2015, 521, 436–444. [Google Scholar] [CrossRef] [PubMed]
- Polat, H.; Mehr, H. Classification of pulmonary CT images by using hybrid 3D-deep convolutional neural network architecture. Appl. Sci. 2019, 9, 940. [Google Scholar] [CrossRef]
- Hosny, A.; Parmar, C.; Coroller, T.; Grossmann, P.; Zeleznik, R.; Kumar, A.; Bussink, J.; Gillies, R.; Mak, R.; Aerts, H. Deep learning for lung cancer prognostication: A retrospective multi-cohort radiomics study. PLoS Med. 2018, 15, e1002711. [Google Scholar] [CrossRef]
- Vial, A.; Stirling, D.; Field, M.; Ros, M.; Ritz, C.; Carolan, M.; Holloway, L.; Miller, A. The role of deep learning and radiomic feature extraction in cancer-specific predictive modelling: A review. Transl. Cancer Res. 2018, 7, 803–816. [Google Scholar] [CrossRef]
- Spiegelhalter, D. The Art of Statistics. Learning From Data; Pelican: Torrance, CA, USA, 2019. [Google Scholar]
- Bianconi, F.; Palumbo, I.; Fravolini, M.; Chiari, R.; Minestrini, M.; Brunese, L.; Palumbo, B. Texture Analysis on [18F]FDG PET/CT in Non-Small-Cell Lung Cancer: Correlations Between PET Features, CT Features, and Histological Types. Mol. Imaging Biol. 2019, 21, 1200–1209. [Google Scholar] [CrossRef]
- Remeseiro, B.; Bolon-Canedo, V. A review of feature selection methods in medical applications. Comput. Biol. Med. 2019, 112, 103375. [Google Scholar] [CrossRef]
- Van der Heijden, F.; Duin, R.P.W.; de Ridder, D.; Tax, D.M.J. Classification, Parameter Estimation and State Estimation. An Engineering Approach Using Matlab; John Wiley & Sons, Ltd.: Chichester, UK, 2004. [Google Scholar]
- Theodoridis, S.; Koutroumbas, K. Pattern Recognition, 3rd ed.; Academic Press: Cambridge, MA, USA, 2006. [Google Scholar]
- Kirienko, M.; Cozzi, L.; Rossi, A.; Voulaz, E.; Antunovic, L.; Fogliata, A.; Chiti, A.; Sollini, M. Ability of FDG PET and CT radiomics features to differentiate between primary and metastatic lung lesions. Eur. J. Nucl. Med. Mol. Imaging 2018, 45, 1649–1660. [Google Scholar] [CrossRef]
- Wu, W.; Parmar, C.; Grossmann, P.; Quackenbush, J.; Lambin, P.; Bussink, J.; Mak, R.; Aerts, H. Exploratory study to identify radiomics classifiers for lung cancer histology. Front. Oncol. 2016, 6, 71. [Google Scholar] [CrossRef] [PubMed]
- Wu, W.; Hu, H.; Gong, J.; Li, X.; Huang, G.; Nie, S. Malignant-benign classification of pulmonary nodules based on random forest aided by clustering analysis. Phys. Med. Biol. 2019, 64, 035017. [Google Scholar] [CrossRef] [PubMed]
- Dhara, A.; Mukhopadhyay, S.; Dutta, A.; Garg, M.; Khandelwal, N. A Combination of Shape and Texture Features for Classification of Pulmonary Nodules in Lung CT Images. J. Digit. Imaging 2016, 29, 466–475. [Google Scholar] [CrossRef] [PubMed]
- Saad, M.; Choi, T.S. Computer-assisted subtyping and prognosis for non-small cell lung cancer patients with unresectable tumor. Comput. Med Imaging Graph. 2018, 67, 1–8. [Google Scholar] [CrossRef]
- Ganeshan, B.; Panayiotou, E.; Burnand, K.; Dizdarevic, S.; Miles, K. Tumour heterogeneity in non-small cell lung carcinoma assessed by CT texture analysis: A potential marker of survival. Eur. Radiol. 2012, 22, 796–802. [Google Scholar] [CrossRef]
- Huang, Y.; Liu, Z.; He, L.; Chen, X.; Pan, D.; Ma, Z.; Liang, C.; Tian, J.; Liang, C. Radiomics signature: A potential biomarker for the prediction of disease-free survival in early-stage (I or II) non-small cell lung cancer. Radiology 2016, 281, 947–957. [Google Scholar] [CrossRef]
- Krarup, M.; Nygård, L.; Vogelius, I.; Andersen, F.; Cook, G.; Goh, V.; Fischer, B. Heterogeneity in tumors: Validating the use of radiomic features on 18F-FDG PET/CT scans of lung cancer patients as a prognostic tool. Radiother. Oncol. 2020, 144, 72–78. [Google Scholar] [CrossRef]
- Sacconi, B.; Anzidei, M.; Leonardi, A.; Boni, F.; Saba, L.; Scipione, R.; Anile, M.; Rengo, M.; Longo, F.; Bezzi, M.; et al. Analysis of CT features and quantitative texture analysis in patients with lung adenocarcinoma: A correlation with EGFR mutations and survival rates. Clin. Radiol. 2017, 72, 443–450. [Google Scholar] [CrossRef]
- Hammerschlag, G.; Cao, J.; Gumm, K.; Irving, L.; Steinfort, D. Prevalence of incidental pulmonary nodules on computed tomography of the thorax in trauma patients. Intern. Med. J. 2015, 45, 630–633. [Google Scholar] [CrossRef]
- Marrer, J.D.; Arveux, P.; Lejeune, C.; Woronoff-Lemsi, M.C.; Jégu, J.; Guillemin, F.; Velten, M. Incidence of solitary pulmonary nodules in Northeastern France: A population-based study in five regions. BMC Cancer 2017, 17, 47. [Google Scholar] [CrossRef]
- McWilliams, A.; Tammemagi, M.; Mayo, J.; Roberts, H.; Liu, G.; Soghrati, K.; Yasufuku, K.; Martel, S.; Laberge, F.; Gingras, M.; et al. Probability of cancer in pulmonary nodules detected on first screening CT. New Engl. J. Med. 2013, 369, 910–919. [Google Scholar] [CrossRef] [PubMed]
- Edey, A.; Hansell, D. Incidentally detected small pulmonary nodules on CT. Clin. Radiol. 2009, 64, 872–884. [Google Scholar] [CrossRef] [PubMed]
- Suo, S.; Cheng, J.; Cao, M.; Lu, Q.; Yin, Y.; Xu, J.; Wu, H. Assessment of Heterogeneity Difference Between Edge and Core by Using Texture Analysis: Differentiation of Malignant From Inflammatory Pulmonary Nodules and Masses. Acad. Radiol. 2016, 23, 1115–1122. [Google Scholar] [CrossRef] [PubMed]
- Ferreira, J.J.; Oliveira, M.; de Azevedo-Marques, P. Characterization of Pulmonary Nodules Based on Features of Margin Sharpness and Texture. J. Digit. Imaging 2018, 31, 451–463. [Google Scholar] [CrossRef] [PubMed]
- Wu, W.; Pierce, L.; Zhang, Y.; Pipavath, S.; Randolph, T.; Lastwika, K.; Lampe, P.; Houghton, A.; Liu, H.; Xia, L.; et al. Comparison of prediction models with radiological semantic features and radiomics in lung cancer diagnosis of the pulmonary nodules: A case-control study. Eur. Radiol. 2019, 29, 6100–6108. [Google Scholar] [CrossRef] [PubMed]
- Balagurunathan, Y.; Schabath, M.; Wang, H.; Liu, Y.; Gillies, R. Quantitative Imaging features Improve Discrimination of Malignancy in Pulmonary nodules. Sci. Rep. 2019, 9, 8528. [Google Scholar] [CrossRef] [PubMed]
- Taralli, S.; Scolozzi, V.; Foti, M.; Ricciardi, S.; Forcione, A.; Cardillo, G.; Calcagni, M. 18F-FDG PET/CT diagnostic performance in solitary and multiple pulmonary nodules detected in patients with previous cancer history: Reports of 182 nodules. Eur. J. Nucl. Med. Mol. Imaging 2019, 46, 429–436. [Google Scholar] [CrossRef]
- Karyaǧar, S.; Koç, Z.; Karyaǧar, S.; Bekar, Y. Diagnostic performance of 18F-FDG PET/CT in solitary pulmonary nodules of non-smokers. Turk. J. Thorac. Cardiovasc. Surg. 2017, 25, 235–241. [Google Scholar] [CrossRef]
- Jia, Y.; Gong, W.; Zhang, Z.; Tu, G.; Li, J.; Xiong, F.; Hou, H.; Zhang, Y.; Wu, M.; Zhang, L. Comparing the diagnostic value of 18F-FDG-PET/CT versus CT for differentiating benign and malignant solitary pulmonary nodules: A meta-analysis. J. Thorac. Dis. 2019, 11, 2082–2098. [Google Scholar] [CrossRef]
- Miwa, K.; Inubushi, M.; Wagatsuma, K.; Nagao, M.; Murata, T.; Koyama, M.; Koizumi, M.; Sasaki, M. FDG uptake heterogeneity evaluated by fractal analysis improves the differential diagnosis of pulmonary nodules. Eur. J. Radiol. 2014, 83, 715–719. [Google Scholar] [CrossRef]
- Chen, S.; Harmon, S.; Perk, T.; Li, X.; Chen, M.; Li, Y.; Jeraj, R. Diagnostic classification of solitary pulmonary nodules using dual time 18F-FDG PET/CT image texture features in granuloma-endemic regions. Sci. Rep. 2017, 7, 9370. [Google Scholar] [CrossRef] [PubMed]
- Zander, D. Primary vs. metastatic pulmonary adenocarcinoma: Toward a fuller understanding of truth. Chest 2010, 137, 3–4. [Google Scholar] [CrossRef]
- Fukui, T.; Taniguchi, T.; Kawaguchi, K.; Fukumoto, K.; Nakamura, S.; Sakao, Y.; Yokoi, K. Comparisons of the clinicopathological features and survival outcomes between lung cancer patients with adenocarcinoma and squamous cell carcinoma. Gen. Thorac. Cardiovasc. Surg. 2015, 63, 507–513. [Google Scholar] [CrossRef]
- Rinaldi, S.; Berardi, R. Lung cancer prognosis: Can histological patterns and morphological features have a role in the management of lung cancer patients? Ann. Transl. Med. 2017, 5, 353. [Google Scholar] [CrossRef] [PubMed][Green Version]
- Win, T.; Miles, K.; Janes, S.; Ganeshan, B.; Shastry, M.; Endozo, R.; Meagher, M.; Shortman, R.; Wan, S.; Kayani, I.; et al. Tumor heterogeneity and permeability as measured on the CT component of PET/CT predict survival in patients with non-small cell lung cancer. Clin. Cancer Res. 2013, 19, 3591–3599. [Google Scholar] [CrossRef] [PubMed]
- Astaraki, M.; Wang, C.; Buizza, G.; Toma-Dasu, I.; Lazzeroni, M.; Smedby, O. Early survival prediction in non-small cell lung cancer from PET/CT images using an intra-tumor partitioning method. Phys. Medica 2018, 60, 58–65. [Google Scholar] [CrossRef]
- Khorrami, M.; Khunger, M.; Zagouras, A.; Patil, P.; Thawani, R.; Bera, K.; Madabhushi, A. Combination of Peri- and Intratumoral Radiomic Features on Baseline CT Scans Predicts Response to Chemotherapy in Lung Adenocarcinoma. Radiol. Artif. Intell. 2019, 1, e180012. [Google Scholar] [CrossRef]
- Mu, W.; Qi, J.; Lu, H.; Schabath, M.; Balagurunathan, Y.; Tunali, I.; Gillies, R. Radiomic biomarkers from PET/CT multi-modality fusion images for the prediction of immunotherapy response in advanced non-small cell lung cancer patients. In Proceedings of the SPIE, Medical Imaging 2018: Computer-aided Diagnosis, Houston, TX, USA, 10–15 February 2018; Petrick, N., Mori, K., Eds.; Volume 10575, p. 105753S. [Google Scholar]
- Chalkidou, A.; O’Doherty, M.; Marsden, P. False discovery rates in PET and CT studies with texture features: A systematic review. PLoS ONE 2015, 10, e0124165. [Google Scholar] [CrossRef]
- Joober, R.; Schmitz, N.; Annable, L.; Boksa, P. Publication bias: What are the challenges and can they be overcome? J. Psychiatry Neurosci. 2012, 37, 149–152. [Google Scholar] [CrossRef]
- Buvat, I.; Orlhac, F. The dark side of radiomics: On the paramount importance of publishing negative results. J. Nucl. Med. 2019, 60, 1543–1544. [Google Scholar] [CrossRef]
- Hatt, M.; Vallieres, M.; Visvikis, D.; Zwanenburg, A. IBSI: An international community radiomics standardization initiative. J. Nucl. Med. 2018, 59, 38S–44S. [Google Scholar]


© 2020 by the authors. Licensee MDPI, Basel, Switzerland. This article is an open access article distributed under the terms and conditions of the Creative Commons Attribution (CC BY) license (http://creativecommons.org/licenses/by/4.0/).
Share and Cite
Bianconi, F.; Palumbo, I.; Spanu, A.; Nuvoli, S.; Fravolini, M.L.; Palumbo, B. PET/CT Radiomics in Lung Cancer: An Overview. Appl. Sci. 2020, 10, 1718. https://doi.org/10.3390/app10051718
Bianconi F, Palumbo I, Spanu A, Nuvoli S, Fravolini ML, Palumbo B. PET/CT Radiomics in Lung Cancer: An Overview. Applied Sciences. 2020; 10(5):1718. https://doi.org/10.3390/app10051718
Chicago/Turabian StyleBianconi, Francesco, Isabella Palumbo, Angela Spanu, Susanna Nuvoli, Mario Luca Fravolini, and Barbara Palumbo. 2020. "PET/CT Radiomics in Lung Cancer: An Overview" Applied Sciences 10, no. 5: 1718. https://doi.org/10.3390/app10051718
APA StyleBianconi, F., Palumbo, I., Spanu, A., Nuvoli, S., Fravolini, M. L., & Palumbo, B. (2020). PET/CT Radiomics in Lung Cancer: An Overview. Applied Sciences, 10(5), 1718. https://doi.org/10.3390/app10051718