Article

An Empirical Study on Greenhouse Gas Emission Calculations Under Different Municipal Solid Waste Management Strategies

1
School of Economics and Management, Beijing University of Chemical Technology, 15 North 3rd Ring Rd. E., Chaoyang, Beijing 100029, China
2
Zhongshan Institute, University of Electronic Science and Technology, Zhongshan 528400, China
3
School of Economics and Management, Shanghai Institute of Technology, Shanghai 201418, China
*
Author to whom correspondence should be addressed.
Appl. Sci. 2020, 10(5), 1673; https://doi.org/10.3390/app10051673
Submission received: 5 February 2020 / Revised: 24 February 2020 / Accepted: 24 February 2020 / Published: 2 March 2020
(This article belongs to the Special Issue Advances in Industrial Waste Reduction)

Abstract

:
The Chinese government is committed to ensuring separation of municipal solid waste (MSW), promoting the integrated development of the MSW management system with the renewable resource recovery system, and achieving construction of ecological civilization. Guided by the methods in Intergovernmental Panel on Climate Change (IPCC) guidelines, the greenhouse gas (GHG) emissions under five waste disposal scenarios in Beijing under the life cycle framework were assessed in this research. The study included collection and transportation, as well as three end disposal methods (sanitary landfill, incineration, and composting), and the emission reduction benefits of electricity generation from incineration and recycling of renewable resources were taken into account. The results show that an emission reduction benefit of 70.82% could be achieved under Scenario 5 in which kitchen waste and recyclables are sorted and recycled and the residue is incinerated, and the selection of the optimal strategy was not affected by changes in the separation rate. In addition, landfill would emit more GHG than incineration and composting. The results of this study are helpful for the government to make a decision on MSW management considering the goal of GHG emission reduction.

1. Introduction

In recent years, global climate change has been one of the most urgent environmental challenges facing society. The per capita annual CO2 emissions increased from 2.2 t in 1990 to 7.5 t in 2014, with a growth rate far higher than the world’s average per capita level [1]. China is the largest GHG emitter in the world [2]. At the 2015 climate conference in Paris, China formally proposed to strive to reach the peak of CO2 emission in advance by around 2030. In addition, China endeavors to reduce carbon intensity by 60–65% in 2030 based on 2005 levels [3,4]. As one of the main sources of GHG emissions, waste management activities have recently attracted the attention of the government and many researchers. According to the emission reduction experience of some developed countries, waste is the second largest research area for emission reduction after energy. Therefore, reducing GHG emissions from municipal solid waste (MSW) disposal is one of the most effective ways to achieve the national goal of emission reduction in China.
With the development of urbanization and the improvement of people’s living standards, the amount of MSW in China has been increasing rapidly, leading to economic and environmental problems that need to be solved urgently [5,6]. As shown in Figure 1, landfill has always been the main disposal method of MSW in China, accounting for more than 85% of total waste in 2003. In recent years, under the influence of national policies, the proportion of waste incineration in China has increased to about 40% of total waste and the proportion of landfill has decreased, but it still accounts for more than 57% of total waste [7]. A large amount of GHG will be emitted both during the transportation and disposal of MSW, which will have a large impact on the climate and environment.
For a long time, the MSW has been mixed during collection, transportation, and disposal and the source separation of MSW has not been realized in China, which not only reduces the reusable economic value of waste, but also produces high environmental costs. The MSW can be divided into nine categories: kitchen waste, inorganic waste (sand and stone), paper waste, textile waste, wood and bamboo waste, plastic waste, rubber waste, glass waste, and metal waste. Among these, paper waste, textile waste, plastic waste, rubber waste, glass waste, and metal waste are recyclables [8]. In addition, four of the categories contain degradable contents: kitchen waste, paper waste, textile waste, and wood and bamboo waste [9], with a high proportion of kitchen waste about 50% or more in China [10], containing high organic matter content, but there is almost no composting disposal. Therefore, in China, the waste disposal methods do not match well with the waste components. Moreover, the kitchen waste currently used for composting has a high impurity content and poor composting effect because source separation is not carried out. A large number of organic substances are currently sent to landfill, which produces high amounts of landfill gas. Without recycling, this causes considerable GHG emissions.
From the whole MSW management system, the environmental impact of GHG emissions from the transportation process is lower than that from the disposal process [11,12,13]. Salhofer et al. studied whether the recycling of waste still has environmental benefits under the condition of long transportation distance, and found that the transportation process does not affect the environmental benefits of the recycling strategy [14]. There are fewer reports studying GHG emissions from the transportation of MSW alone, most of which are combined with route optimization research [15,16,17].
The disposal processes of MSW including landfill, incineration and composting comprise important sources of GHG emissions. Many researchers have studied GHG emissions under different waste disposal strategies to help the government make the most favorable decisions for the environment. These studies are mostly based on scenario comparisons [11,12,13,18,19,20]. Some researchers have shown that compared with disposal methods such as composting and incineration, landfill produces the highest GHG emissions. Thus, it is suggested that landfill disposal shall be reduced or combined with composting and incineration [12,18,20]. However, Chen et al. found that compared with landfill and material recovery, incinerating directly led to the highest GHG emissions because of diesel consumption of facilities and equipment, but it would have a significant reduction in GHG emissions when considering recycling of materials [11].
MSW landfills are amongst the largest human-related sources of methane emissions [21], so there are many studies on GHG emissions from landfill of MSW. Du et al. studied the CH4 emissions from landfill sites between 2003 and 2013 in China, and they further compared the emissions from different regions. The results showed that CH4 emissions increased by 62.9% in the 10 years, and the growth was higher in the north and west than in the south and east [22]. Couth et al. estimated the GHG emissions from landfill sites in Africa, and found that it accounted for 8.1% of the total African GHG emissions, and they also emphasized the importance of avoiding direct landfill of degradable organic carbon from the waste for emission reduction [23]. Friedrich and Trois analyzed and compared the GHG emissions under three landfill scenarios by combining the processes of transportation, recycling, composting, and landfill gas recycling [24]. Yang et al. showed that kitchen waste is the key category affecting the GHG emissions from landfill, and kitchen waste separation and improvement of the incineration percentage of mixed waste can reduce GHG emissions from landfill [10]. MSW landfills emit large amounts of methane, which means that efficient methane recovery is an effective method of the reduction of GHG emissions. Ghosh et al. estimated the GHG emissions from landfill sites in Delhi, India, and they pointed out that effective CH4 recycling is a sustainable waste management scheme [25]. Besides, Carbon dioxide capture and recycling methods such as the production of biobased products through microalgae can be used as effective means of reducing GHG emissions [26,27].
Incineration is a type of treatment technology that can convert the energy in waste into electricity with GHG emissions and efficiently reduce the volume of waste [28], which is a primary way in some countries such as Japan and still remains a secondary option in countries such as China because of economic and technical reasons but is gradually spreading [29]. However, incineration releases pollutants such as fly ash and chemical gases, causing negative impact on environment. And the treatment technologies for the pollutants were drawn special attention. Zhang et al. discussed the degradation technologies for dioxins in MSW incineration fly ash [30]. Asl et al. researched the application of adsorbents derived from coal fly ash in removing aqueous and gaseous pollutants [31]. Karatza et al. presented one technology to catalyze the oxidation of calcium bisulfite as the key step in the flue gas desulfurization process [32]. And Zhang et al. introduced a mercury adsorption technology [33]. Moreover, the impact of incineration on GHG emissions was also considered. Wang et al. analyzed that either incineration with energy recovery or landfill with landfill gas utilization is more effective under different climatic conditions in China in terms of GHG emission reduction [34,35]. Havukainen et al. found that refuse-derived fuel production and incineration can have a more positive environmental impact including global warming potential, acidification potential, and eutrophication potential than the co-incineration of MSW with coal in Hangzhou, China [36].
Waste separation and recycling are considered to be important activities that affect GHG emissions from MSW. Chen studied the impact of electricity generation from waste incineration on reduction of GHG emissions in Taiwan, China, and indicated that recycling of paper, metal, and food waste is conducive to the reduction of GHG emissions [37]. Calabrò studied the influence of different separate collection methods and separation rate combined with disposal methods of incineration and landfill on GHG emissions in Italy and found that the best model is to landfill the residual waste combined with state-of-the-art energy recycling system [38]. Turner et al. used the life cycle assessment (LCA) model to analyze the impact of recycling of various types of waste on GHG emissions in detail. The results show that the source separation of waste can help reduce emissions [39]. Through the Granger causal relation test, Lee et al. showed that there is a significant negative correlation between waste recycling and GHG emissions from waste [40].
There are a few methods used by researchers to account the GHG emissions from MSW. The fifth chapter of the National GHG Inventory prepared by the Intergovernmental Panel on Climate Change (IPCC) of the United Nations lists the calculation methods for GHG emissions from waste disposal [41]. Many researchers have followed the guidance of the IPCC in the calculation of GHG emissions from MSW [9,20,22,23,25]. LCA is regarded as an effective method to quantify product sustainability [42]. Therefore, it is also used by researchers in the field of MSW management to evaluate environmental impacts [12,24,39,43]. Clean Development Mechanism (CDM) was proposed under the Kyoto Protocol to reduce GHG emissions through the trade between the developed countries and the developing countries. Researchers use it to evaluate the waste management projects with considering the economic and environmental benefits [44,45,46,47,48]. In addition, the landfill gas emissions modeling (LandGEM) is specifically used to study the GHG emissions from landfill sites [49,50].This paper used the guidance method of the IPCC and built the LCA framework to assess the GHG emissions from MSW, including the processes of collection and transportation, landfill, incineration, composting, electricity generation from incineration, and recycling of renewable resources for emission reduction.
In recent years, in order to improve the waste management system, China has issued some policies to promote the separation of MSW at the source and realize the integration of the MSW management system with the renewable resource recycling system. So this paper designed five scenarios, one of which was used as the baseline scenario to reflect the existing MSW management system, and the other four reflected the further possible scenarios after the integration of the two systems. Through the comparison of five scenarios, the benefits of emission reduction were analyzed to indicate the environmental feasibility of the integrated system.
In addition, some researches have revealed that different types of waste and recycling rate have different effects on GHG emissions. However, few researchers integrated the impact of different waste separation methods and recycling rate on GHG emissions into comprehensive waste disposal strategies. In the actual situation, the Chinese governments often adopt a comprehensive disposal strategy including landfill, incineration, and composting. Therefore, in this paper, different waste separation and recycling methods were taken into account, merging into the comprehensive waste disposal strategies under five different scenarios.

2. Materials and Methods

2.1. Materials

In 2017, the MSW disposal capacity in Beijing was 24,341 tons per day, including 10,341 tons of sanitary landfill, 9200 tons of incineration, and 4800 tons of other disposal methods. Therefore, at present, the MSW disposal method in Beijing is mainly landfill and incineration. In recent years, the efficiency of waste separation is not high, although the Chinese government has vigorously advocated the waste separation policy. The mixed collection and transportation system of MSW remains dominant. With the development and implementation of relevant national policies, laws, and regulations, the source-separated collection, transportation, and disposal of MSW will be the development trend of MSW management systems in China. Therefore, in order to adapt to waste separation, composting and recycling of renewable resources are expected to be parallel to landfill and incineration, and the proportion of landfill will gradually decrease with the improvement in waste separation.
The mixed MSW in Beijing is classified into eight categories, of which kitchen waste can be transported to composting plant, and paper, plastics, textile, glass and metal can be transported to recycling center as recyclable resources. The composition and other relevant parameters of MSW are shown in Table 1, with related values referred to some researches [51,52], standards in China [53,54] and IPCC recommended values [41] In some developed countries, MSW classification works better. For example, the MSW recycling rate of South Korea was 59.1% in 2012 [55]. As one of the earliest cities to implement waste classification in China, Shanghai has realized that 51.8% of the kitchen waste could be separated in pilot communities [56]. So this paper assumed a separation rate of 50% (the separation of kitchen waste and recyclable resources each accounts for 50% of their total amounts).

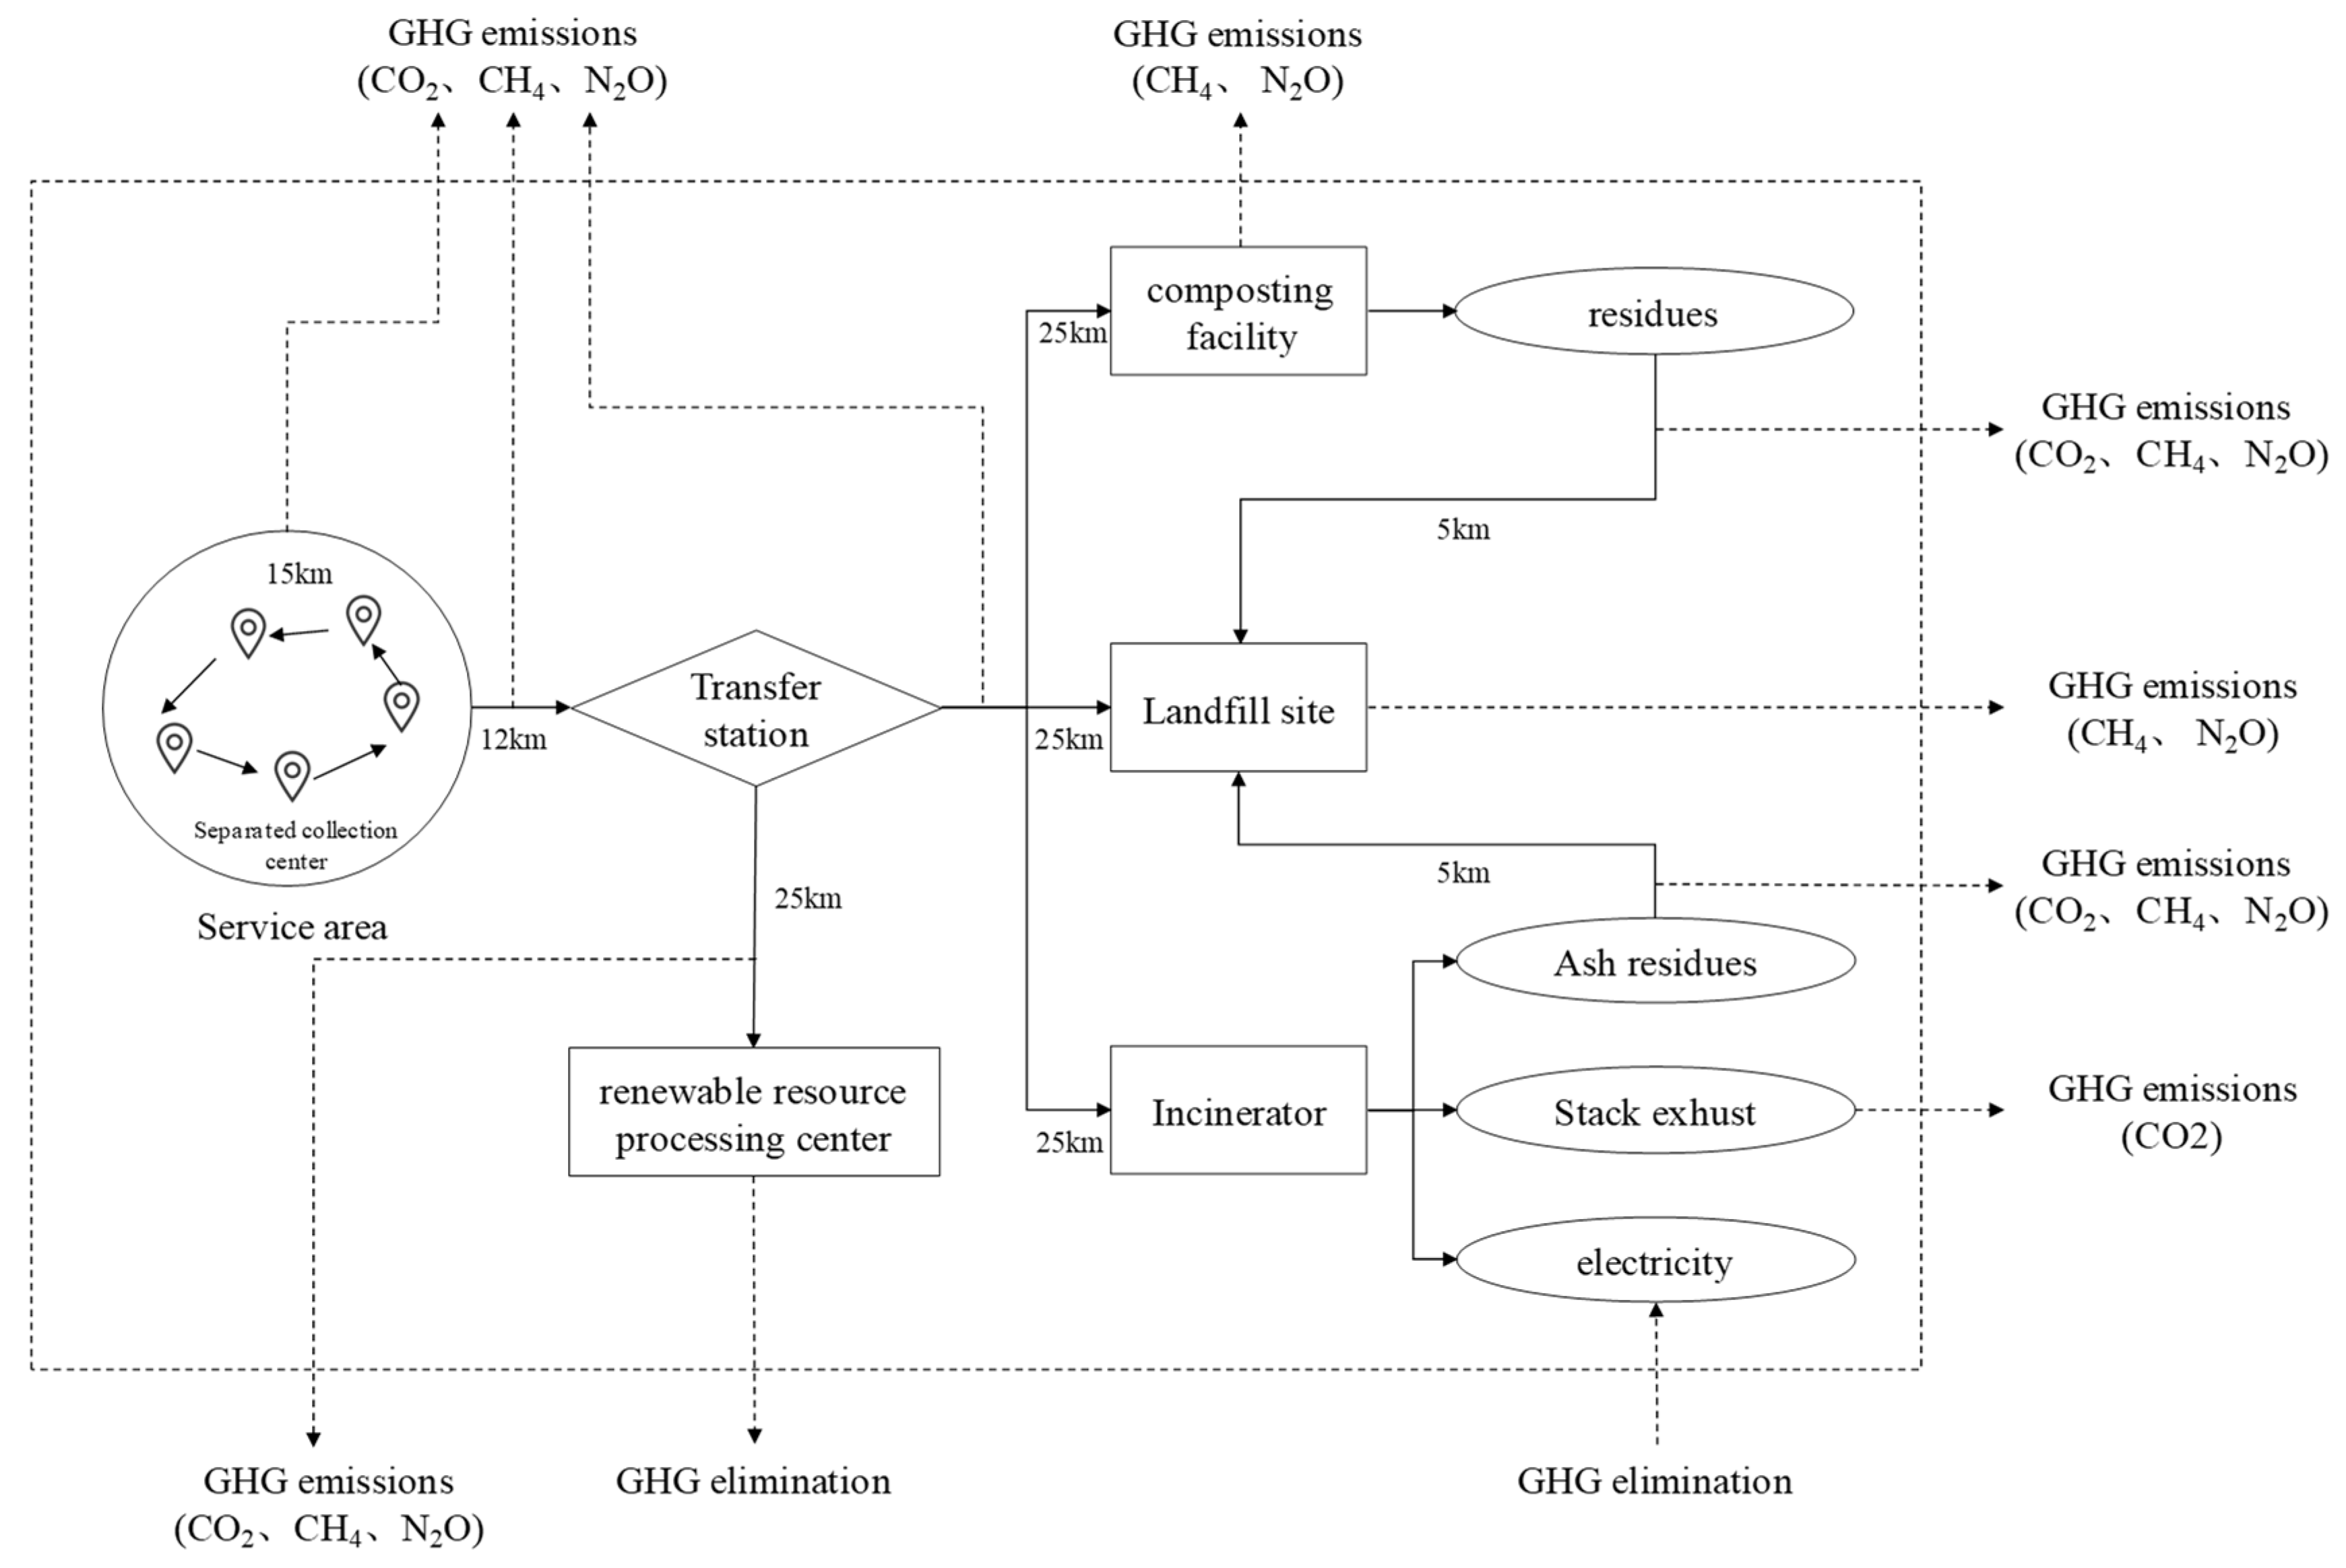
2.2. System Boundary

The sources of GHG emissions in this study are shown in Table 2. The main sources can be summarized as follows: (1) emissions generated by MSW transportation vehicles, including the transportation from collection point to transfer station, the transportation from transfer station to waste disposal plant (landfill site, incineration plant, or composting plant) or recycling center, and the transportation of incineration and composting residues to landfill site; (2) emissions from decomposition of MSW in landfill; (3) emissions from incineration of MSW and emission reduction benefits of GHG brought by electricity generation from incineration; (4) emissions from composting of MSW; and (5) emission reduction benefits of energy consumption saved by recycling of renewable resources. Due to the lack of data, GHG emissions from energy consumption for daily operation of transfer stations and disposal point facilities are not discussed in this paper. In addition, most of the landfill gas in China is emitted into the air without recycling, so the energy recycling of landfill site is also not discussed in this paper.
The GHG emissions from disposal of MSW primarily include CO2, CH4, and N2O. In the transportation process, CO2, CH4, and N2O were considered as the GHGs emitted by vehicle exhaust. In the landfill process, only CH4 emissions were taken into account. Furthermore, CO2 was considered to be generated by the decomposition of biological carbon, so it was not included in the calculation. In the composting process, CH4 and N2O emissions were taken into account, without considering CO2. In the incineration process, only CO2 emissions were taken into account, as CH4 and N2O were assumed to be negligible.

2.3. Scenario Design

On the basis above, five MSW disposal strategies were designed, as shown in Table 3. Besides, the Figure 2, Figure 3, Figure 4, Figure 5 and Figure 6 showed the GHG emission boundary under the five scenarios. The descriptions of the five scenarios are as follows:
Scenario 1: mixed waste + landfill + incineration. As the baseline scenario, according to the current landfill and incineration ratio in Beijing, part of the waste was landfilled (10341t/d), and part of the waste was incinerated (10341t/d). The heat generated by incineration was used for electricity generation, which is in line with the current disposal mode in Beijing. The incineration residue was landfilled
Scenario 2: classified waste + landfill + incineration + composting. According to 50% separation rate, MSW was divided into kitchen waste and residual waste for source-separated collection. The separated kitchen waste was composted, and residual waste was landfilled and incinerated in proportion as Scenario 1. The heat generated by incineration was used for electricity generation. The incineration and composting residues were transported to landfill.
Scenario 3: classified waste + incineration + composting. This scenario had the same classification as that of Scenario 2, with the difference that all residual waste was incinerated instead of being landfilled, and the incineration residue was landfilled.
Scenario 4: classified waste + landfill + incineration + composting + recycling. According to 50% separation rate, MSW was divided into kitchen waste, recyclable resources, and residual waste. The separated kitchen waste was composted, the recyclable resources were sent to the recycling center as renewable resources, the residual waste was landfilled and incinerated in proportion as Scenario 1, and the incineration and composting residues were landfilled.
Scenario 5: classified waste + incineration + composting + recycling. This scenario had the same classification as that of Scenario 4, with the difference that all residual waste was incinerated.
It should be specified that the proportion of residual mixed waste components varied when kitchen waste or recyclable resources were separated. As shown in Table 4, Scenarios 2 and 3 had the same the composition but were different from Scenario 1 as the result of separating kitchen waste. The waste composition in Scenario 4, 5 varied from Scenario 2, 3 because of the separation of both kitchen waste and recyclable resources. Besides, heat value of residual mixed waste also varied with the change of waste composition.

2.4. Estimation Method

2.4.1. GHG Emissions from Transportation

In the MSW transportation process, the main source of GHG emissions is consumption of diesel fuel. In addition, because of the large number of harmful substances in automobile exhaust, (including CO, nitrogen oxides, hydrocarbons, and solid suspended particles), the vehicle is equipped with an exhaust purification device, which uses catalysts to convert CO, nitrogen oxides, and hydrocarbons in exhaust into non-toxic and harmless CO2, H2O, and N2 and thus control the emission quality of exhaust. Therefore, GHG emissions will also be produced in the exhaust disposal process. According to the guidance given by the IPCC and in combination with the Guidelines for Calculation and Reporting of GHG Emissions from Land Transportation Enterprises of China, the calculation of GHG emissions from vehicles is as follows:
E t = E d + E u
where Et is the GHG emissions during transportation, Ed is the GHG emissions caused by fuel consumption of vehicles, and Eu is the GHG emissions in the exhaust-purification process. Ed is estimated via the following equation:
E d = E C O 2 d + E C H 4 d + E N 2 O d
where E C O 2 d is the CO2 emissions caused by fossil fuel consumption during transportation, E C H 4 d is the CH4 emissions caused by fossil fuel consumption during transportation, and E N 2 O d is the N2O emissions caused by fossil fuel consumption during transportation. They were calculated as follows:
E C O 2 d = F C d * κ d * C C d * O F d * 44 12
E C H 4 d = d * E F C H 4 d * G W P C H 4 * 10 9
E N 2 O d = d * E F N 2 O d * G W P N 2 O * 10 9
where FCd is the amount of diesel consumption, κd is the low heating value of diesel with the typical value of 42.652 GJ/t [57], CCd is the carbon content per unit heating value of diesel, and OFd is the oxidation factor of diesel consumption. The recommended values were shown in Beijing local standard DB11/T 1416-2017 [53]. In the Equations (4) and (5), d is the driving distance of a vehicle, EF is the CH4 (or N2O) emission factor of a certain type of fuel consumed by a given vehicle type under given emission standards, which typical values could be found in the Guidelines for Calculation and Reporting of GHG Emissions from Land Transportation Enterprises of China. GWP is the global warming potential of CH4 (or N2O). According to the IPCC recommendations, the GWP of CH4 and N2O converted to CO2 is 21 and 310 at a 100-year scale, respectively [41]. The number of 10−9 is the conversion coefficient from milligram to ton.
The GHG emissions from exhaust treatment, Eu, is calculated as follows:
E u = M 1 * 12 60 * L * 44 12 * 10 3
where M1 is the mass of urea additive consumed by catalytic converter, and its value is related to the road conditions and speed of the vehicle. When the road is congested, the driving speed is slow, and the exhaust temperature is low, then the injection amount of urea additive is small. L is the mass ratio of urea in the urea additive with the value of 32.5% in this paper [58]. The number of 10−3 is the coefficient to convert from kilogram to ton. Table 5 shows the interpretation and values of relevant parameters.
The fossil fuel consumption during vehicle transportation is affected by transportation distance and energy consumption per unit distance. Route planning is involved in vehicle traveling from collection point to transfer station, so different waste separation modes will affect vehicle transportation distance. In other transportation stages, the transportation is point-to-point, and the transportation distance is subject to the actual distance between the two sites.
Energy consumption per unit distance of the vehicle is affected by the load of the vehicle, driving speed, road conditions, and engine model. Of these, the load and speed of vehicle can be controlled by the driver, thus affecting energy consumption. In this paper, the comprehensive modal emissions model (CMEM) proposed by Scora and Barth was used and simplified [59]. The fuel consumption rate, FR, was calculated as follows:
F R = ϕ ( k N V + P / η ) / κ
P = P t / ε + P a
P t = M a v + M g sin θ v + 0.5 C d A ρ v 3 + M g C r cos θ v
In Equation (7), ϕ is the air equivalent ratio of fuel, k is the friction coefficient of engine, N is the speed of engine, V is the engine displacement, P is the engine power output, η is the diesel engine efficiency index, and κ is the low heating value of diesel. Equation (8) displays the conversion between engine power output, P, and traction demand, Pt. In the equation, ε is the efficiency of vehicle power transmission system, and Pa is the engine power demand related to engine running loss and vehicle accessory operation. Equation (9) shows the calculation of Pt, where M is the weight of the vehicle (empty weight, w1; plus vehicle load, w2), a is the acceleration of the vehicle, v is the speed of the vehicle, g is the gravity constant, θ is the slope of road, Cd is the resistance coefficient, A is the front area of the vehicle, ρ is the air density, and Cr is the rolling resistance coefficient.
According to the above model, the fuel consumption on path (i, j) is:
F C i j = ϕ κ { k N V * d i j v i j + [ M ( a + g sin θ + g C r cos θ ) d i j + 0.5 C d A ρ d i j v i j 2 ] ε η + P a η * d i j v i j }
In this paper, Pa was assumed to be 0. In addition, in the path of vehicle, except for the speed and load, other parameters were all assumed to be fixed constants on path (i, j). Therefore, the model can be simplified as follows:
F C i j = λ ( k N V * d i j v i j + γ α d i j M i j + γ β d i j v i j 2 )
In the model, the relevant parameters were referenced from the conventional values and/or the values determined by other researchers. The parameter definition and relevant values are shown in Table 6. As Demir et al. and Bektaş et al. researched the routing optimization using the CMEM, the relevant parameters in this article adopted the recommended values from their researches [15,60].

2.4.2. GHG emissions from Landfill

The GHG emissions from landfill were calculated according to the IPCC. In the First Order Decay (FOD) model, the gradual decay of degradable organic carbon of MSW in the landfill site over several years was taken into account. However, in this paper, only the GHGs that were emitted by a fixed amount of MSW were considered, and thus the impact of time was not considered. Moreover, in the landfill process, only CH4 emissions were considered. The calculation model is shown in Equations (12)–(15) [20]. The default value of DOCf is 0.5, of MCF is 1, of F is 0.5, of Rl is 0, and of OX is 0 [41]. The definition of relevant parameters in the model is shown in Table 7.
E l = E C H 4 l = C H 4 e m i s s i o n l * G W P C H 4
C H 4 e m i s s i o n l = D D O C * F * 16 12 * ( 1 R l ) * ( 1 O X )
D D O C = M S W l * D O C * D O C f * M C F l
D O C = D O C i * f i

2.4.3. GHG Emissions from Incineration of Waste

The method in IPCC as well as the Guidelines for accounting of greenhouse gas emissions from municipal solid wastes incineration enterprise according to the Beijing local standard DB11/T 1416-2017 were used for the calculation of GHG emissions from incineration of waste [53]. The GHG emissions from incineration of MSW include the direct CO2 emissions from fossil carbon in the incineration process and the CO2 emissions caused by the net purchased electricity and heat consumption of enterprises. The first part includes the direct emission of CO2 from incineration of fossil carbon of MSW and the direct emission of CO2 from fossil fuel combustion added for auxiliary combustion. It is worth noting that the CO2 emissions caused by the burning of bio carbon in MSW were not included in the calculation. Grate furnaces are mainly used in incineration plants in Beijing, which do not need combustion improvement in normal operation, but a small amount of fossil fuel is added during ignition, and thus the direct emission of CO2 from fossil fuel combustion added for auxiliary combustion was not considered in this paper. The second part includes the CO2 emissions from the purchased electricity and heat consumption of the incineration plant minus the CO2 emissions from on-grid electricity generation by incineration and from external heating. In this paper, it was assumed that the on-grid electricity generated by the incineration plant was the net electricity after self-deduction. So the calculation of the GHG emissions from incineration of waste was shown as Equation (16). Ei and Ee were calculated by Equations (17) and (18) [61]:
E I = E i E e
E i = M S W i * ( f i * d m i * C F i * F C F i , t * O F w ) * 44 12
E e = A D e * E F e
The on-grid electricity of electricity generation from incineration of MSW, ADe is related to the amount of MSW incineration (MSW), the heating value of MSW (HVMSW), the thermal efficiency of incineration plant (ξ), and the auxiliary electricity ratio (ζ). The calculation was conducted with Equation (19) [62]. In this paper, ξ was assumed to be 20%, and ζ was assumed to be 20%. The meaning and value of related parameters in the model are shown in Table 8.
A D e = M S W i * H V M S W * ξ / 3600 * ( 1 ζ )

2.4.4. GHG Emissions from Composting of Kitchen Waste

In the anaerobic state, CH4 and N2O were produced during the composting of kitchen waste, so the GHG emissions were calculated by Equation (20), in which MSWC = the kitchen waste quantity sent to compost (t), ECCH4 and ECN2O were the GHG emission factors based on the recommended IPCC values, which were 4 g CH4/kg MSW for CH4 and 0.3 g N2O/kg MSW for N2O [41]. The GHG emissions from composting of kitchen waste can be calculated as 0.177 t CO2e/t MSW:
E c = M S W c * ( E C H 4 c * G W P C H 4 + E N 2 O c * G W P N 2 O )

2.4.5. Calculation of Emission Reduction of GHG from Recycling of Renewable Resources

Recycling of renewable resources can replace the production of related products, so as to save the energy consumption required for the production of raw materials. The calculation of GHG emissions is shown in Equation (21), in which Ri is the recycling amount of the ith category renewable resources in t, and Fi is the comprehensive equivalent coal consumption per unit output of the raw material that was replaced by the ith category renewable resources. As paper and plastics were the main components in recyclable resources, with the proportion of 20.83% and 20.74% in mixed waste, so the paper only considered Fi for these two categories. Fi for paper and plastics were 0.3332 and 0.5113 (unit: t standard coal/t recyclable resources). And the values were assessed from China Statistical Yearbook 2018 [7]. EFc is the GHG emission coefficient of standard coal, which was set to 0.69 in this paper, and it is close to the value of 0.68 used by the Institute of Energy Economics of Japan and 0.69 used by the Energy Information Administration of the Department of Energy of the United States. OFc is the oxidation factor of standard coal, which was set to 0.93.
E r = R i * F i * E F c * O F c * 44 12

3. Results and Discussion

3.1. GHG Emissions under Each Scenario

In this paper, using the existing model of MSW disposal in Beijing as the standard scenario, four scenarios of collection, transportation, and disposal of waste after integrating two systems were designed. Using the guidance method of the IPCC and the LCA framework, the GHG emissions from collection, transportation, and disposal of MSW under the five scenarios in Beijing were estimated and compared. The results are shown in Figure 7, and data are shown in Table 9.
Under the five scenarios, the GHG emissions were 4781.37–16387.68 t, with the highest emissions under Scenario 1 and the lowest under Scenario 5. Compared with the situation under Scenario 1, the GHG emissions under Scenario 2, which included recycling of some of the kitchen waste, were reduced by 1764.59 t, and the emission reduction increased with the increase of separation rate of kitchen waste. Under Scenario 3, the disposal via landfill was removed, and the emission reduction compared with Scenario 1 increased significantly to 7759.95 t. Compared to Scenario 2, the benefit of the GHG emission reduction for Scenario 3 was more significant, because the incineration treatment totally replaced landfill. The emission reduction under Scenario 4 was 6791.33 t. Although the recycling resources were separated, the total emissions were still greater than those under Scenario 3, which reflects the advantages of waste incineration. Scenario 5 was the optimal approach. In the case of increasing kitchen waste and recyclable resources, all the residue waste was incinerated, with the emission reduction of 11606.31 t. Relative to Scenario 3, Scenario 5 further reduced emissions by 3846.36 t, which was resulted from the recycling of recyclable resources. When considering the emission reduction benefits of electricity generation from waste and recycling of renewable resources, the net emissions under Scenario 1 to Scenario 5 were successively reduced.
Of incineration, landfill, and composting, composting had the lowest GHG emissions per unit (0.117 t), followed by incineration (0.3690–0.5181 t), and landfill had the highest GHG emissions per unit (1.2252–1.2803 t). Therefore, increasing the disposal amount of incineration and composting would lead to an emission reduction effect. Wang et al. found that sanitary landfill’s carbon emissions were more than thrice those of composting, and more than twice those generated during burning [20]. In the case of Shanghai, the research also shew the same conclusion that the landfill treatment should be replaced by incineration and composting [56]. So improving the rate of incineration and composting was important to reduce GHG emissions.

3.2. GHG Emitted from Waste Incineration

According to the relevant waste incineration standards in China, the moisture content of the waste entering the furnace should not be higher than 50%, and the low heating value (wet base) should not be lower than 5000 kJ. The heating value of primary waste in China is relatively high and generally meets the heating value standard. Because of the high proportion of kitchen waste in China as well as its moisture content, the moisture content of the primary waste is slightly higher than 50%. Before the waste is put into the incinerator, it must be stored and dried to reduce the moisture content. The GHG emissions from incineration of waste include two parts: the emission of GHG and the emission reduction effect of electricity generation. Figure 8 shows the GHG emissions per unit under the five scenarios. The GHG emissions and electricity generation under Scenario 2, 3 were 0.5181 t CO2e/t MSW and 0.4868 MWh/t MSW, higher than Scenario 1, because only part of the kitchen waste was separated, which reduced the water content per unit waste and increased the fossil carbon content. Under Scenario 4 and Scenario 5, after sorting out recyclables such as plastics with high heating value and fossil carbon content, the GHG emissions and electricity generation per unit waste from incineration decreased, but the net emissions were still lower than those under Scenario 1, with 0.1802 t CO2e/t MSW. Compared with landfill, incineration was an effective way to reduce GHG emissions. In recent years, the proportion of waste incineration in Beijing has gradually increased, and the waste disposal method has gradually become optimized.
The research shows that the recycling of recyclables had a great impact on the GHG emissions from incineration [11]. Paper and plastic account for a large proportion of the recycled materials. With the characteristics of high fossil carbon content and high heating value, the separation rate of plastic will directly affect the GHG emissions from incineration. And because of the very low fossil carbon content in paper, the impact on the GHG emissions from incineration is very small. In this paper, based on the separation rate of 50% of plastic, a sensitivity analysis was carried out by increasing or decreasing this rate by 10% and 20%. The results are shown in Figure 9. When the separation rate of plastic was increased from 50% to 60%, the net GHG emissions from incineration of per unit waste were reduced from 0.0623 tCO2e to 0.0295 tCO2e (a decrease of 52.64%), which means the separation rate of plastic is a highly sensitive factor to the GHG emissions from incineration of waste. Therefore, as a key category affecting the GHG emissions from MSW incineration, the government should consider collecting plastic separately to improve the separation rate.

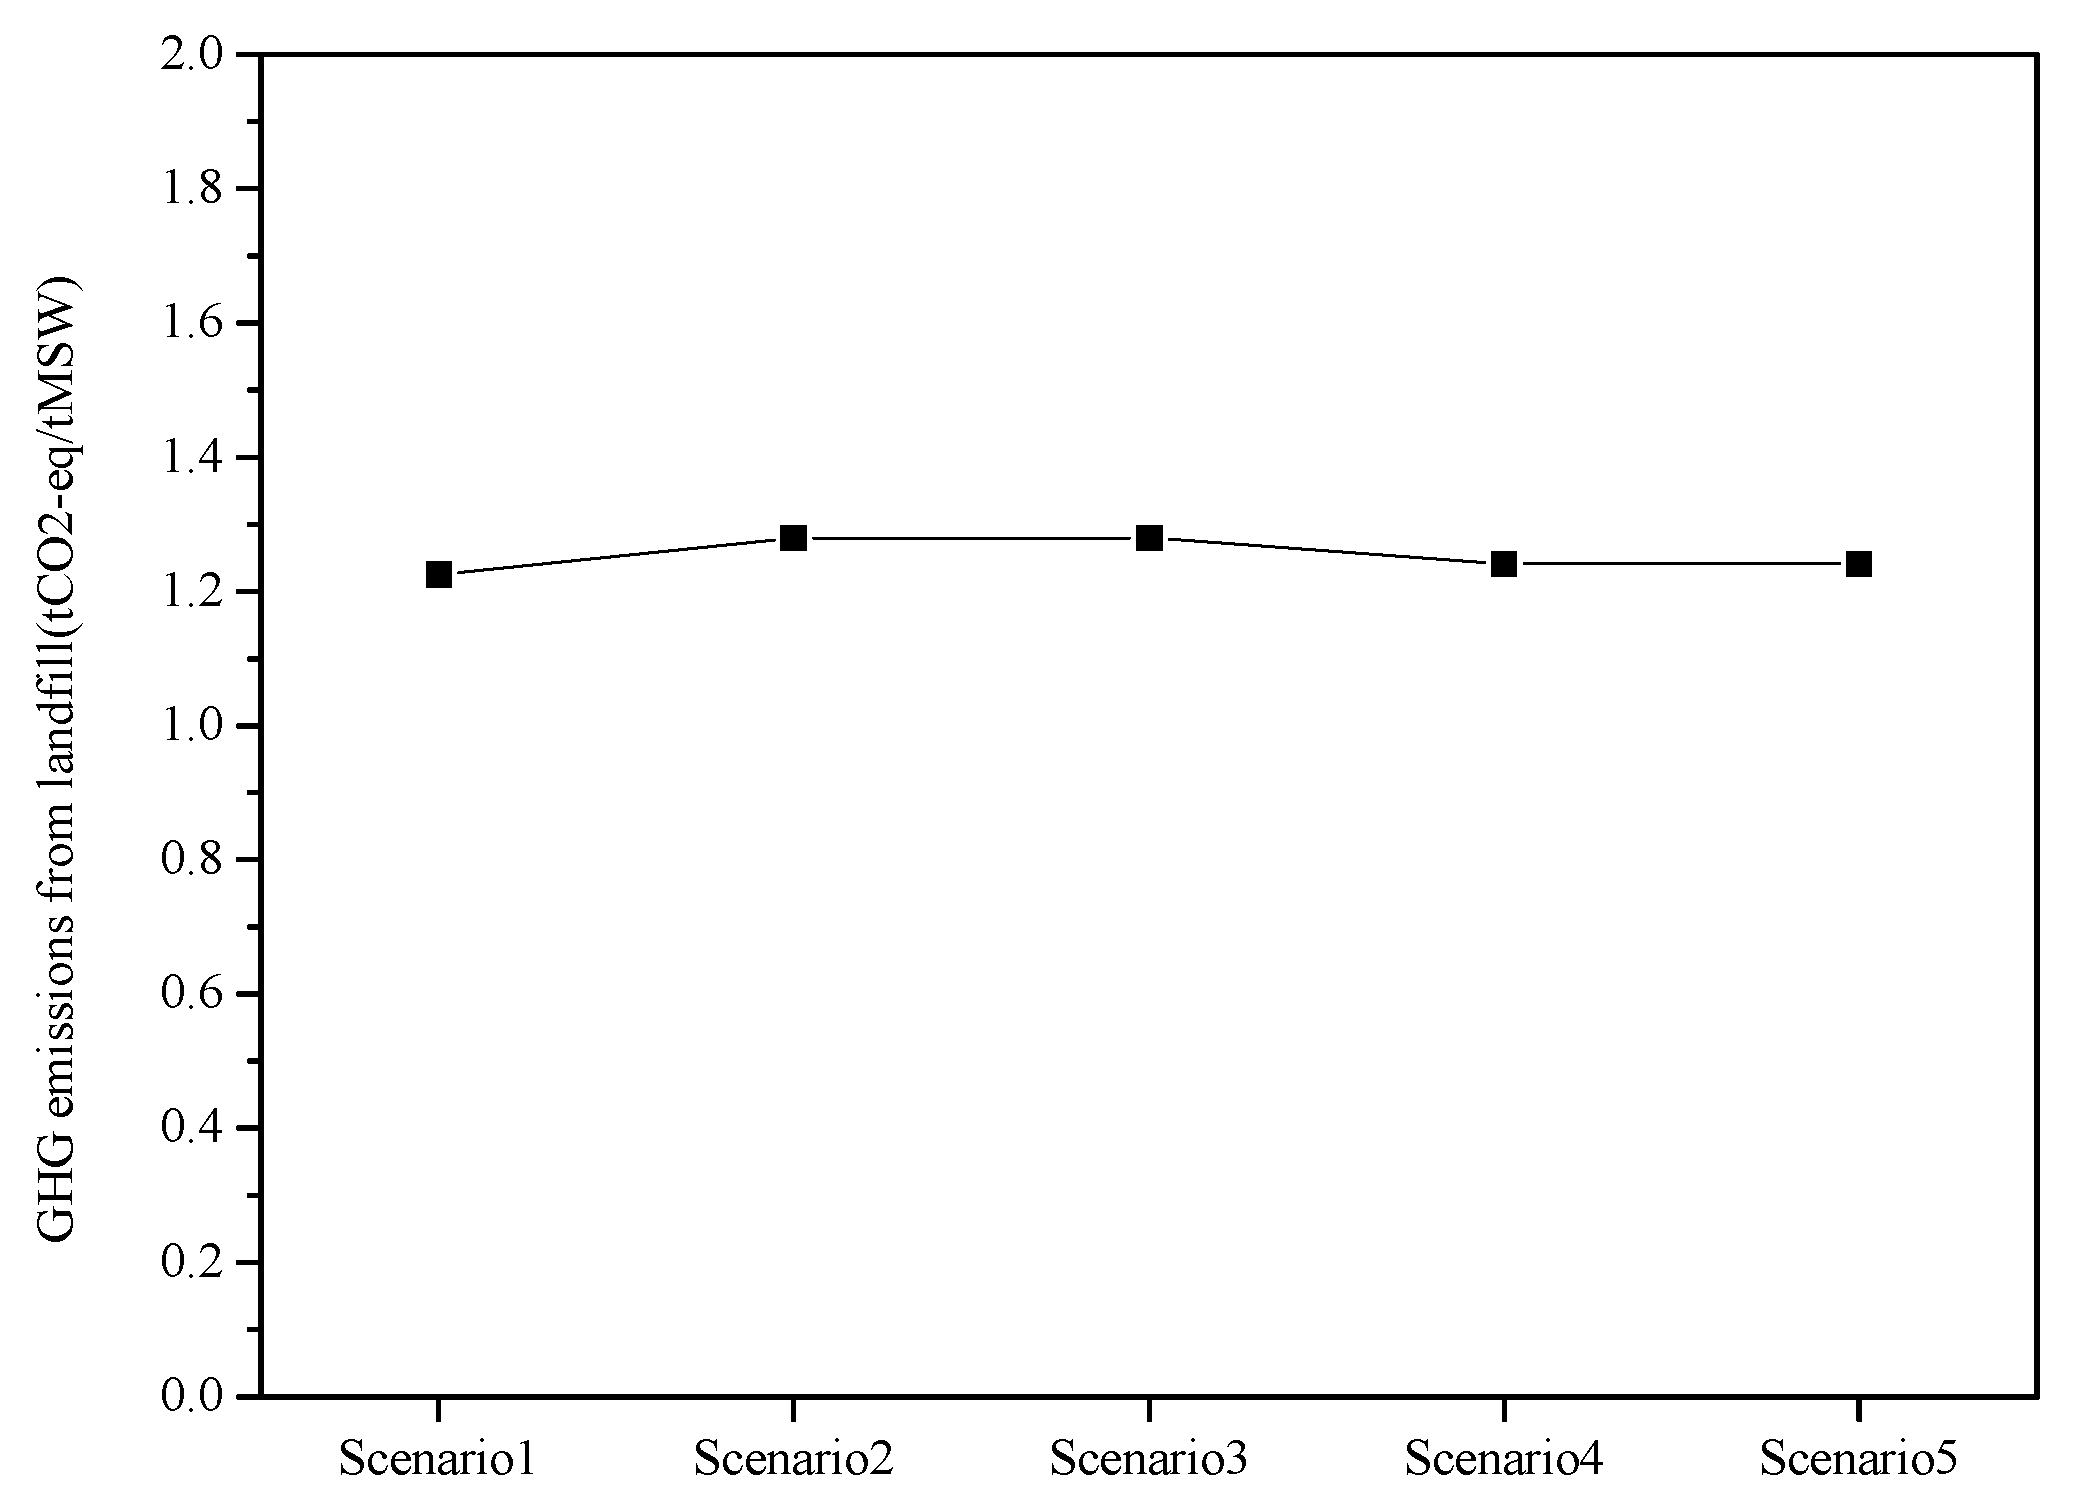
3.3. GHG Emitted from Landfill

Landfill was the method by which the most GHG were emitted compared with incineration and composting. As shown in Figure 10, the emissions from landfill varied from 1.2252 to 1.2803 t CO2e/t MSW in five scenarios, changing slightly. And in all scenarios, the emissions were over 1 t CO2e/t MSW [9,11], almost twice as much as emissions from incineration [20]. As wood and bamboo contain the most degradable organic carbon in all waste categories, followed by paper, the separation of kitchen waste and recyclables will not reduce the GHG emissions per unit of landfilled waste. In order to reduce the GHG emissions per unit of landfilled waste, it is necessary to separate wood, bamboo, and paper. From the environmental point of view, landfill is the worst method of waste disposal, but because of its simple process and low cost, it remains the main method of waste disposal in some developing countries.
The main type of GHG emitted by landfill is CH4. Therefore, if landfill disposal is adopted, a high-efficiency recycling method for also CH4 needs to be in place to generate environmental benefits [38]. As shown in Figure 11, under Scenario 2, the recycling rate of CH4 needs to be about 60% to reduce the GHG emissions per unit of landfilled waste to the level of incineration emissions, and under Scenario 4, it needs to reach more than 70%. In addition, in China, especially in Beijing, land resources are scarce, which is not ideal for landfill-based waste management. In the future, landfill should only be used as an auxiliary waste disposal method for incineration and composting.

3.4. GHG Emitted from Composting of Waste

Among the three disposal methods, composting of waste was the method that emitted the least GHG, and the GHG emissions per unit of waste composting reached only 0.177 t, which was similar with the result in other research [56]. Previous researches have shown that compared with mixed disposal method of waste, the emission reduction benefits of GHG are pronounced when the kitchen waste is treated separately and combined with composting or anaerobic digestion [56,63]. At present, there is only one waste composting plant in Beijing, and compared to the other two methods, the composted amount of waste can be ignored. Because waste separation in Beijing is still not popular, the content of impurities in kitchen waste is high, and the quality of composting is poor. With the implementation of waste separation policy in China, kitchen waste requires collection and transportation separately, in order to increase the proportion of waste composting.

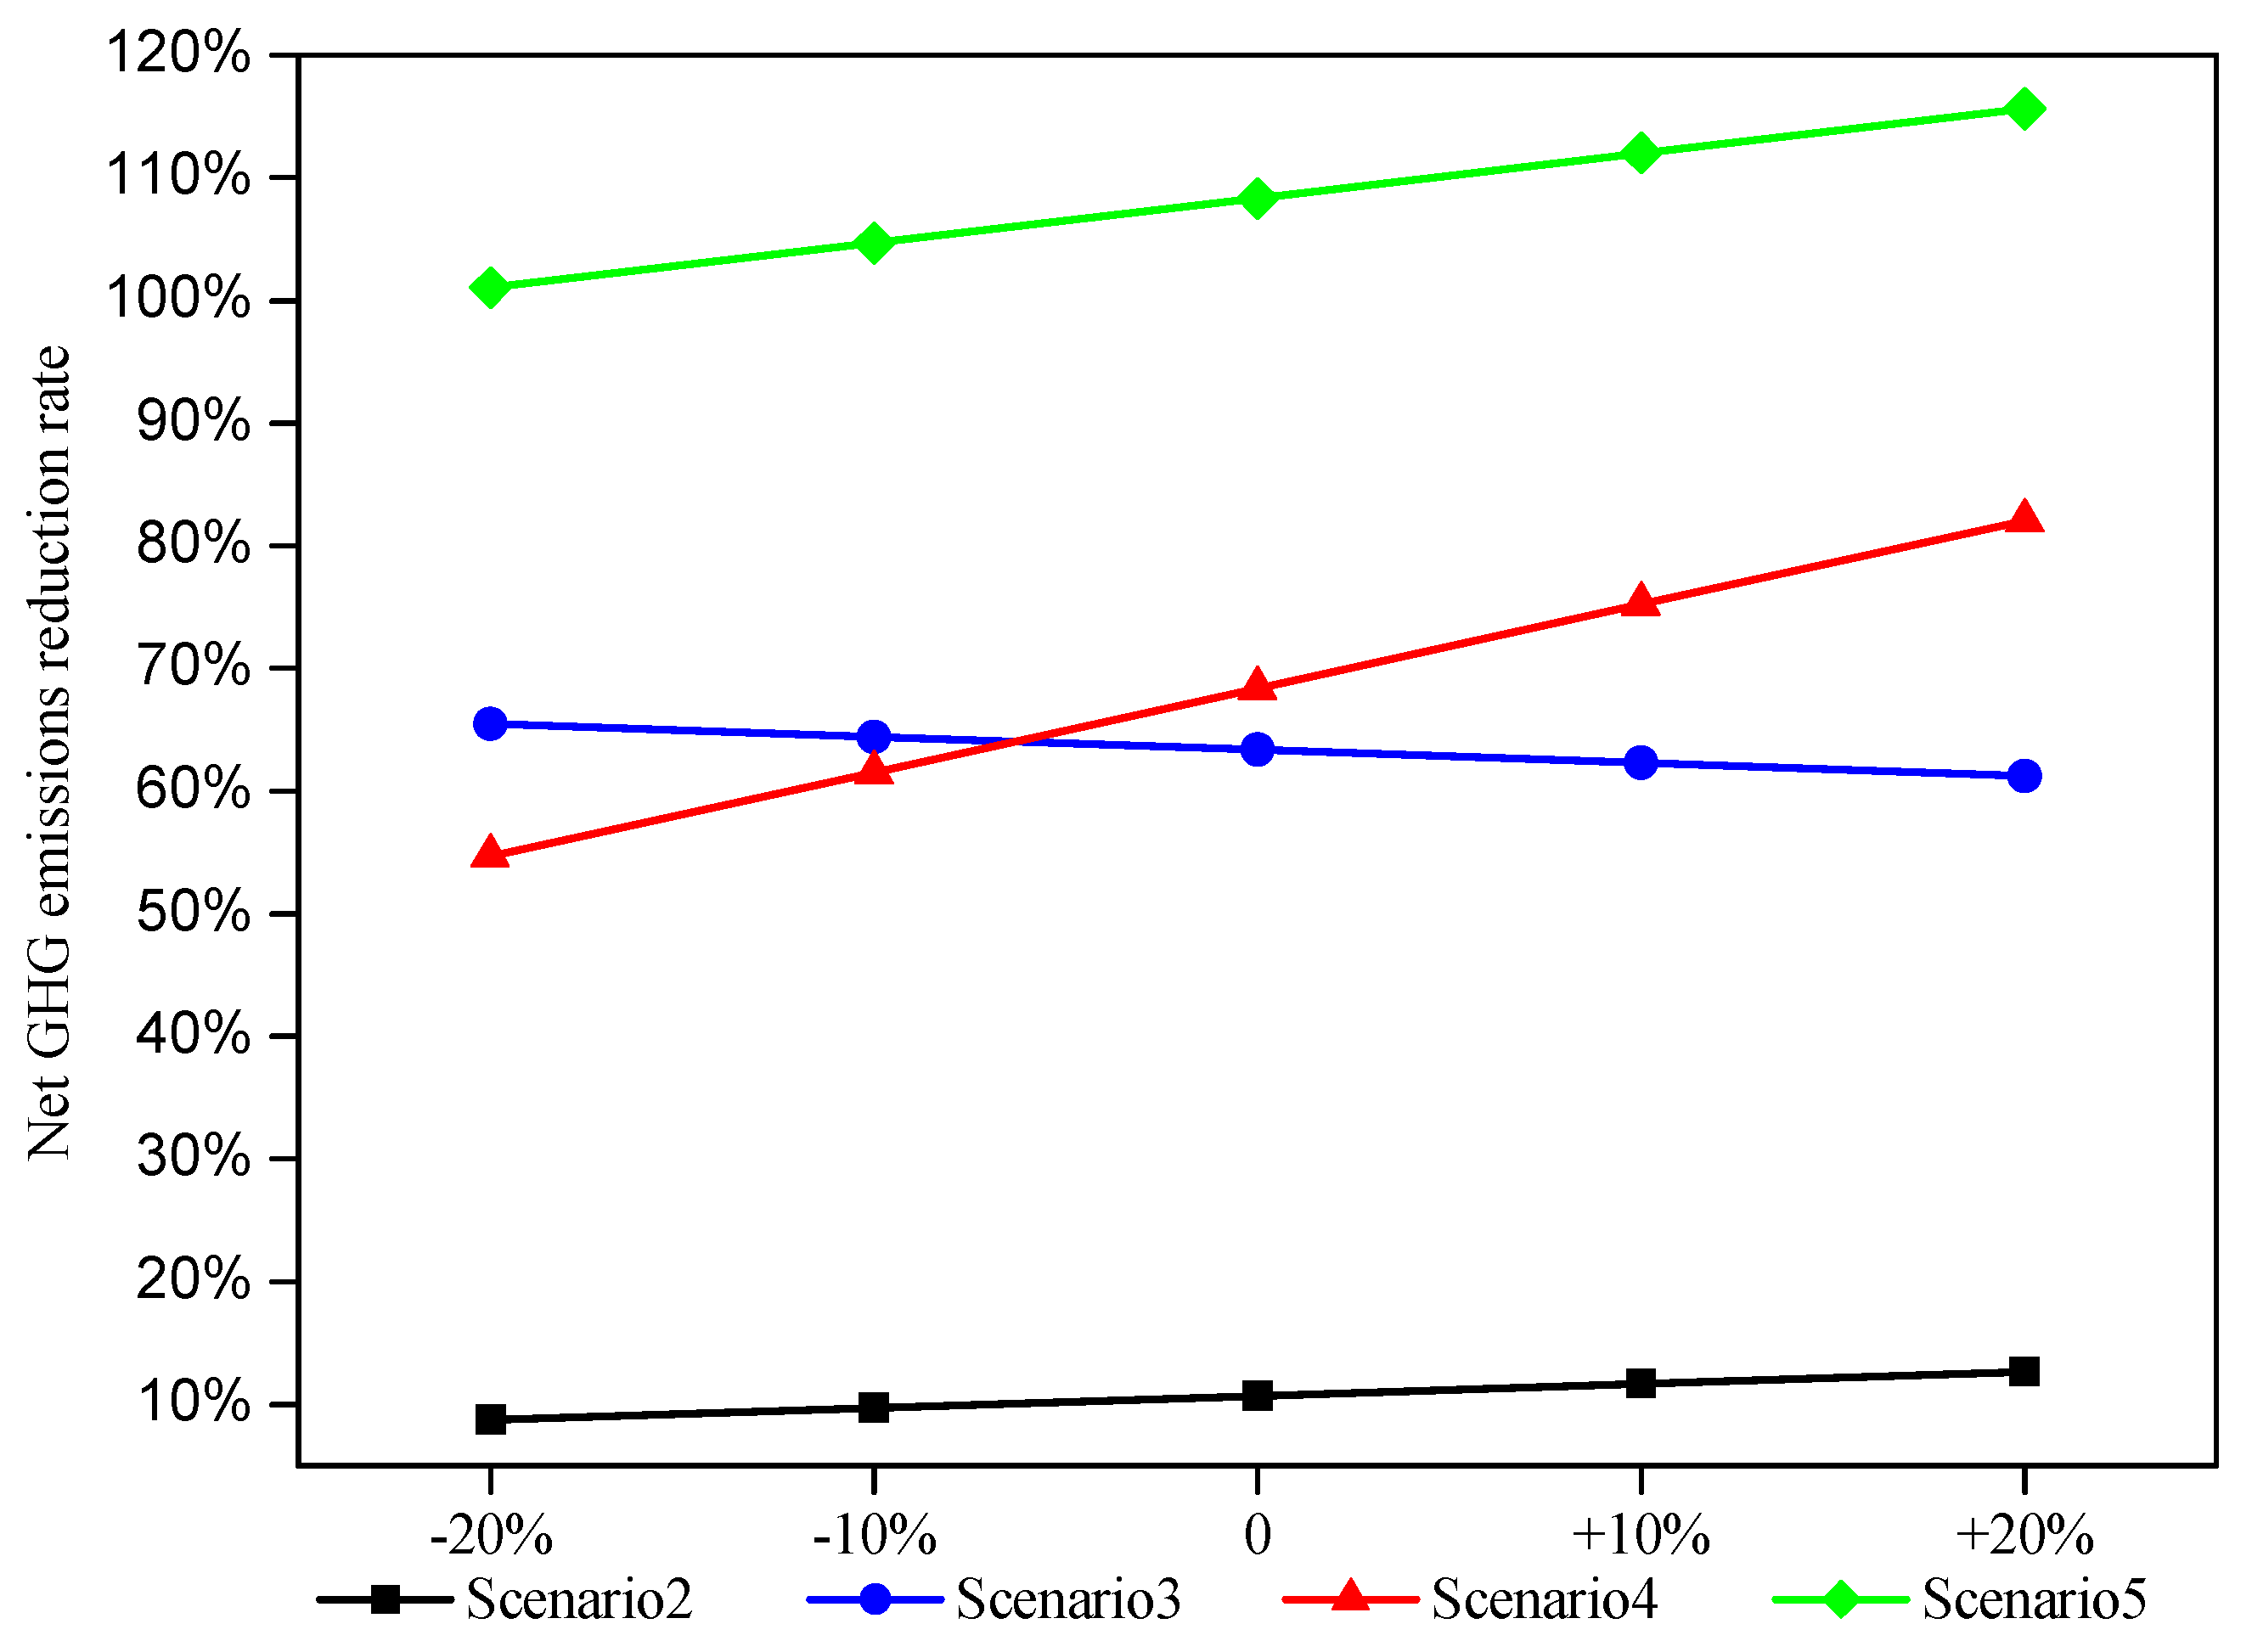
3.5. Contribution of Separation and Recycling of Waste to Emission Reduction of GHG

The moisture content of kitchen waste in Beijing is as high as 82.1%, and the proportion of kitchen waste is high, which leads to high moisture content of waste, making incineration challenging task [64]. The separation of kitchen waste can reduce the moisture content of incineration waste, improve the heating value, and increase the electricity generation per unit of waste [56]. Under Scenario 2 and Scenario 3, after 50% of the kitchen waste was separated, the moisture content of the waste was reduced from 53.80% to 44.90%. Correspondingly, the heating value of the waste entering the furnace increased from 9407 to 10,952 kJ/kg, the electricity generation per unit of waste was increased by 68.67 kWh, and the emission reduction effect of electricity generation from incineration of waste was improved. Under Scenario 4 and Scenario 5, since the fossil carbon content of plastics was the highest among all kinds of waste, the GHG emissions from incineration of per unit waste was reduced after recycling recyclables such as plastics and paper, and was thus 0.0251 t lower than that under Scenario 1. Therefore, the separation and recycling of waste can effectively reduce the GHG emissions from waste incineration.
Separation and recycling of waste can reduce the amount of waste end disposal, and the recycled resources can replace the raw materials in production, reducing the comprehensive energy consumption of production processes and thus achieving energy savings. In this research, recycling of renewable resources and electricity generation from incineration of waste were regarded as measures of energy conservation and emission reduction. Morris pointed out that compared with incineration, recycling of most types of MSW can enhance energy savings [65]. Sevigné-Itoiz et al. suggested that mechanical recycling of plastic could bring the greatest emission reduction benefits of GHGs [66]. Therefore, improving the separation rate of waste sources and promotion of the recycling of renewable resources is an effective way to reduce GHG emissions.
Because of the uncertainty of the separation rate, a separation rate of 50% was used as the standard in this paper, and it was modified up and down by 10% and 20%. The results are shown in Figure 12. The changes in the separation rate had little impact on the results. Scenario 5 was still the optimal mode, and Scenario 2–5 still had emission reduction benefits compared with Scenario 1. The emission reduction rate of Scenario 2, 4, 5 increased with an increase in separation rate. In contrast, when the separation rate was reduced, the emission reduction effect under Scenario 3 was better than that under Scenario 4. Overall, the impact of separation rate on GHG emissions under each scenario was robust. Therefore, the level of separation rate in reality should not affect the government’s decision-making.

3.6. GHG Emitted from Transportation of Waste

The GHG emitted in the MSW transportation process mainly come from the energy consumption of vehicles, and the amount of emissions depends on factors such as transportation distance and vehicle type. For the GHG emissions in the transportation process, route planning of vehicle can help to reduce emissions [15,60,67,68,69,70]. In addition, the appropriate location of transfer facilities and disposal facilities can also shorten the collection and transportation routes, thus reducing GHG emissions. Compared to treatment, MSW collection and transportation are more expensive, but researches have shown that the environmental impact of transportation is minor [11,14]. The emissions from transportation varied from 91.49 t CO2e to 102.69 t CO2e under the five scenarios which could be considered a slight change, accounting for 0.56–2.15% of the whole process (Figure 13), which is insignificant compared with other processes. This is consistent with the conclusions of previous studies. The GHG emissions caused by transportation after waste separation will increase compared with the mixed collection and transportation mode, but the increase has little effect on the whole process which does not need to be considered.

4. Conclusions

Based on a separation rate of 50%, the GHG emissions from collection, transportation, and disposal of MSW in Beijing with current mixed MSW management system and source-separated MSW management system in future were investigated. The results show that the source-separated MSW management system realizing the integration of the MSW management system with the renewable resource recovery system has environmental benefits, and GHG emissions from MSW using the dichotomy and the trichotomy separation method were lower than those under the existing approach. In particular, using the trichotomy method, the optimal approach was obtained after the separation of kitchen waste and recyclables followed by the incineration of the residue waste, which could achieve an emission reduction benefit of 70.82%. The GHG emission reduction benefits brought by electricity generation from incineration of waste and recycling of recyclables were even greater than the amount of emissions. Changing the separation rate revealed that the optimal model in this paper was robust. Therefore, for the purpose and requirements of national GHG emission reduction, the integration of the two systems is environmentally feasible.
In addition, the comparative analysis of the activities in the whole life cycle of MSW management revealed that the GHG emissions from collection and transportation were the smallest, and the GHG emissions from landfill were the largest compared with incineration and composting, which was the opposite of some researches results from the economic perspective. Therefore, future research can integrate the economic and environmental benefits and compare the comprehensive cost on mixed MSW management system and source-separated MSW management system, which may lead to different results.

Author Contributions

Writing: C.X., T.Z.; Providing case and idea: C.X., T.Z.; Revising and editing: S.-B.T., Y.-M.Z. and J.W. All authors have read and agreed to the published version of the manuscript.

Funding

Supported by the National Key Technology Research and Development Program of the Ministry of Science and Technology of China (No. 2015BAK39B00) and the Funds for First-class Discipline Construction (XK1802-5).

Acknowledgments

Provincial and Municipal Co-construction Project Fund of Zhongshan City and Guangdong Province.

Conflicts of Interest

The authors declare no conflict of interest.

References

  1. World Bank CO2 Emissions (Metric Tons Per Capita) in China. Available online: https://data.worldbank.org.cn/ (accessed on 16 June 2019).
  2. Le Quéré, C.; Moriarty, R.; Andrew, R.M.; Peters, G.P.; Ciais, P.; Friedlingstein, P.; Jones, S.D.; Sitch, S.; Tans, P.; Arneth, A.; et al. Global carbon budget 2014. Earth Syst. Sci. Data 2015, 7, 47–85. [Google Scholar] [CrossRef] [Green Version]
  3. den Elzen, M.; Fekete, H.; Höhne, N.; Admiraal, A.; Forsell, N.; Hof, A.F.; Olivier, J.G.J.; Roelfsema, M.; van Soest, H. Greenhouse gas emissions from current and enhanced policies of China until 2030: Can emissions peak before 2030? Energy Policy 2016, 89, 224–236. [Google Scholar] [CrossRef] [Green Version]
  4. Zhang, X.; Zhao, X.; Jiang, Z.; Shao, S. How to achieve the 2030 CO2 emission-reduction targets for China’s industrial sector: Retrospective decomposition and prospective trajectories. Glob. Environ. Chang. 2017, 44, 83–97. [Google Scholar] [CrossRef]
  5. Pham, T.P.T.; Kaushik, R.; Parshetti, G.K.; Mahmood, R.; Balasubramanian, R. Food waste-to-energy conversion technologies: Current status and future directions. Waste Manag. 2015, 38, 399–408. [Google Scholar] [CrossRef] [PubMed]
  6. Zhang, D.Q.; Tan, S.K.; Gersberg, R.M. Municipal solid waste management in China: Status, problems and challenges. J. Environ. Manag. 2010, 91, 1623–1633. [Google Scholar] [CrossRef] [PubMed]
  7. Statistics, N. China Statistical Yearbook 2018; China Statistics Press: Beijing, China, 2018. [Google Scholar]
  8. Du, W.; Gao, Q.; Zhang, E.; Miao, Q.; Wu, J. The emission status and composition analysis of municipal solid waste in China. J. Res. Environ. Sci. 2006, 19, 85–90. [Google Scholar]
  9. Cai, B.-F.; Liu, J.-G.; Gao, Q.-X.; Nie, X.-Q.; Cao, D.; Liu, L.-C.; Zhou, Y.; Zhang, Z.-S. Estimation of methane emissions from municipal solid waste landfills in china based on point emission sources. Adv. Clim. Chang. Res. 2014, 5, 81–91. [Google Scholar]
  10. Yang, N.; Zhang, H.; Shao, L.-M.; Lu, F.; He, P.-J. Greenhouse gas emissions during MSW landfilling in China: Influence of waste characteristics and LFG treatment measures. J. Environ. Manag. 2013, 129, 510–521. [Google Scholar] [CrossRef]
  11. Chen, Y.C.; Lo, S.L. Evaluation of greenhouse gas emissions for several municipal solid waste management strategies. J. Clean. Prod. 2016, 113, 606–612. [Google Scholar] [CrossRef]
  12. Liu, Y.; Ni, Z.; Kong, X.; Liu, J. Greenhouse gas emissions from municipal solid waste with a high organic fraction under different management scenarios. J. Clean. Prod. 2017, 147, 451–457. [Google Scholar] [CrossRef]
  13. Liu, Y.; Xing, P.; Liu, J. Environmental performance evaluation of different municipal solid waste management scenarios in China. Resour. Conserv. Recycl. 2017, 125, 98–106. [Google Scholar] [CrossRef]
  14. Salhofer, S.; Schneider, F.; Obersteiner, G. The ecological relevance of transport in waste disposal systems in Western Europe. Waste Manag. 2007, 27, S47–S57. [Google Scholar] [CrossRef] [PubMed]
  15. Bektaş, T.; Laporte, G. The Pollution-Routing Problem. Transp. Res. Part B Methodol. 2011, 45, 1232–1250. [Google Scholar] [CrossRef]
  16. Bing, X.; de Keizer, M.; Bloemhof-Ruwaard, J.M.; van der Vorst, J.G.A.J. Vehicle routing for the eco-efficient collection of household plastic waste. Waste Manag. 2014, 34, 719–729. [Google Scholar] [CrossRef]
  17. Tavares, G.; Zsigraiova, Z.; Semiao, V.; Carvalho, M.G. Optimisation of MSW collection routes for minimum fuel consumption using 3D GIS modelling. Waste Manag. 2009, 29, 1176–1185. [Google Scholar] [CrossRef]
  18. Iqbal, A.; Zan, F.; Liu, X.; Chen, G.-H. Integrated municipal solid waste management scheme of Hong Kong: A comprehensive analysis in terms of global warming potential and energy use. J. Clean. Prod. 2019, 225, 1079–1088. [Google Scholar] [CrossRef]
  19. Liu, Y.; Sun, W.; Liu, J. Greenhouse gas emissions from different municipal solid waste management scenarios in China: Based on carbon and energy flow analysis. Waste Manag. 2017, 68, 653–661. [Google Scholar] [CrossRef]
  20. Wang, Z.; Geng, L. Carbon emissions calculation from municipal solid waste and the influencing factors analysis in China. J. Clean. Prod. 2015, 104, 177–184. [Google Scholar] [CrossRef]
  21. Kormi, T.; Ali, N.B.H.; Abichou, T.; Green, R. Estimation of landfill methane emissions using stochastic search methods. Atmos. Pollut. Res. 2017, 8, 597–605. [Google Scholar] [CrossRef]
  22. Du, M.; Peng, C.; Wang, X.; Chen, H.; Wang, M.; Zhu, Q. Quantification of methane emissions from municipal solid waste landfills in China during the past decade. Renew. Sustain. Energy Rev. 2017, 78, 272–279. [Google Scholar] [CrossRef]
  23. Couth, R.; Trois, C.; Vaughan-Jones, S. Modelling of greenhouse gas emissions from municipal solid waste disposal in Africa. Int. J. Greenh. Gas Control 2011, 5, 1443–1453. [Google Scholar] [CrossRef]
  24. Friedrich, E.; Trois, C. Current and future greenhouse gas (GHG) emissions from the management of municipal solid waste in the eThekwini Municipality—South Africa. J. Clean. Prod. 2016, 112, 4071–4083. [Google Scholar] [CrossRef]
  25. Ghosh, P.; Shah, G.; Chandra, R.; Sahota, S.; Kumar, H.; Vijay, V.K.; Thakur, I.S. Assessment of methane emissions and energy recovery potential from the municipal solid waste landfills of Delhi, India. Bioresour. Technol. 2019, 272, 611–615. [Google Scholar] [CrossRef] [PubMed]
  26. Molino, A.; Mehariya, S.; Karatza, D.; Chianese, S.; Iovine, A.; Casella, P.; Marino, T.; Musmarra, D. Bench-scale cultivation of microalgae scenedesmus almeriensis for CO2 capture and lutein production. Energies 2019, 12, 2806. [Google Scholar] [CrossRef] [Green Version]
  27. Valdovinos-García, E.M.; Barajas-Fernández, J.; Olán-Acosta, M.D.L.Á.; Petriz-Prieto, M.A.; Guzmán-López, A.; Bravo-Sánchez, M.G. Techno-economic study of CO2 capture of a thermoelectric plant using microalgae (chlorella vulgaris) for production of feedstock for bioenergy. Energies 2020, 13, 413. [Google Scholar]
  28. Chen, Y.-C. Evaluating greenhouse gas emissions and energy recovery from municipal and industrial solid waste using waste-to-energy technology. J. Clean. Prod. 2018, 192, 262–269. [Google Scholar] [CrossRef]
  29. Zhao, Y.; Xing, W.; Lu, W.; Zhang, X.; Christensen, T.H. Environmental impact assessment of the incineration of municipal solid waste with auxiliary coal in China. Waste Manag. 2012, 32, 1989–1998. [Google Scholar] [CrossRef]
  30. Zhang, J.; Zhang, S.; Liu, B. Degradation technologies and mechanisms of dioxins in municipal solid waste incineration fly ash: A review. J. Clean. Prod. 2020, 250, 119507. [Google Scholar] [CrossRef]
  31. Asl, S.M.H.; Javadian, H.; Khavarpour, M.; Belviso, C.; Taghavi, M.; Maghsudi, M. Porous adsorbents derived from coal fly ash as cost-effective and environmentally-friendly sources of aluminosilicate for sequestration of aqueous and gaseous pollutants: A review. J. Clean. Prod. 2019, 208, 1131–1147. [Google Scholar]
  32. Karatza, D.; Prisciandaro, M.; Lancia, A.; Musmarra, D. Sulfite oxidation catalyzed by cobalt ions in flue gas desulfurization processes. J. Air Waste Manag. Assoc. 2010, 60, 675–680. [Google Scholar] [CrossRef]
  33. Zhang, C.; Song, W.; Zhang, X.; Li, R.; Zhao, S.; Fan, C. Synthesis, characterization and evaluation of resin-based carbon spheres modified by oxygen functional groups for gaseous elemental mercury capture. J. Mater. Sci. 2018, 53, 9429–9448. [Google Scholar] [CrossRef]
  34. Wang, Y.; Yan, Y.; Chen, G.; Zuo, J.; Yan, B.; Yin, P. Effectiveness of waste-to-energy approaches in China: From the perspective of greenhouse gas emission reduction. J. Clean. Prod. 2017, 163, 99–105. [Google Scholar] [CrossRef]
  35. Wang, Y.; Yan, Y.; Chen, G.; Zuo, J.; Du, H. Effective approaches to reduce greenhouse gas emissions from waste to energy process: A China study. Resour. Conserv. Recycl. 2015, 104, 103–108. [Google Scholar] [CrossRef]
  36. Havukainen, J.; Zhan, M.; Dong, J.; Liikanen, M.; Deviatkin, I.; Li, X.; Horttanainen, M. Environmental impact assessment of municipal solid waste management incorporating mechanical treatment of waste and incineration in Hangzhou, China. J. Clean. Prod. 2017, 141, 453–461. [Google Scholar] [CrossRef]
  37. Chen, Y.-C. Potential for energy recovery and greenhouse gas mitigation from municipal solid waste using a waste-to-material approach. Waste Manag. 2016, 58, 408–414. [Google Scholar] [CrossRef] [PubMed]
  38. Calabrò, P.S. Greenhouse gases emission from municipal waste management: The role of separate collection. Waste Manag. 2009, 29, 2178–2187. [Google Scholar] [CrossRef]
  39. Turner, D.A.; Williams, I.D.; Kemp, S. Greenhouse gas emission factors for recycling of source-segregated waste materials. Resour. Conserv. Recycl. 2015, 105, 186–197. [Google Scholar] [CrossRef] [Green Version]
  40. Lee, S.; Kim, J.; Chong, W.K.O. The causes of the municipal solid waste and the greenhouse gas emissions from the waste sector in the United States. Waste Manag. 2016, 56, 593–599. [Google Scholar] [CrossRef]
  41. Eggleston, S.; Buendia, L.; Miwa, K.; Ngara, T.; Tanabe, K. 2006 IPCC Guidelines for National Greenhouse Gas Inventories; Institute for Global Environmental Strategies: Hayama, Japan, 2006; Volume 5. [Google Scholar]
  42. ISO. Environmental Management—Life Cycle Assessment—Principles and Framework. 2006. Available online: https://www.iso.org/standard/37456.html (accessed on 8 January 2020).
  43. Lee, U.; Han, J.; Wang, M. Evaluation of landfill gas emissions from municipal solid waste landfills for the life-cycle analysis of waste-to-energy pathways. J. Clean. Prod. 2017, 166, 335–342. [Google Scholar] [CrossRef]
  44. Couth, R.; Trois, C. Sustainable waste management in Africa through CDM projects. Waste Manag. 2012, 32, 2115–2125. [Google Scholar] [CrossRef]
  45. Maalouf, A.; El-Fadel, M. Towards improving emissions accounting methods in waste management: A proposed framework. J. Clean. Prod. 2019, 206, 197–210. [Google Scholar] [CrossRef]
  46. Potdar, A.; Singh, A.; Unnikrishnan, S.; Naik, N.; Naik, M.; Nimkar, I.; Patil, V. Innovation in solid waste management through clean development mechanism in developing countries. Procedia Environ. Sci. 2016, 35, 193–200. [Google Scholar] [CrossRef]
  47. Santos, M.M.O.; van Elk, A.G.P.; Romanel, C. A correction in the CDM methodological tool for estimating methane emissions from solid waste disposal sites. J. Environ. Manag. 2015, 164, 151–160. [Google Scholar] [CrossRef] [PubMed]
  48. Unnikrishnan, S.; Singh, A. Energy recovery in solid waste management through CDM in India and other countries. Resour. Conserv. Recycl. 2010, 54, 630–640. [Google Scholar] [CrossRef]
  49. Fallahizadeh, S.; Rahmatinia, M.; Mohammadi, Z.; Vaezzadeh, M.; Tajamiri, A.; Soleimani, H. Estimation of methane gas by LandGEM model from Yasuj municipal solid waste landfill, Iran. MethodsX 2019, 6, 391–398. [Google Scholar] [CrossRef] [PubMed]
  50. Nikkhah, A.; Khojastehpour, M.; Abbaspour-Fard, M.H. Hybrid landfill gas emissions modeling and life cycle assessment for determining the appropriate period to install biogas system. J. Clean. Prod. 2018, 185, 772–780. [Google Scholar] [CrossRef]
  51. Zhang, X. Determination and Evaluation on Calculation Model of Calorific Value of Municipal Solid Waste in Beijing. Presented at ”Environmental Engineering”2018 National Academic Annual Meeting, Beijing, China, 2018. [Google Scholar]
  52. Yang, N.; Shao, L.; He, P. Study on the moisture content and its features for municipal solid waste fractions in China. China Environ. Sci. 2018, 38, 1033–1038. [Google Scholar]
  53. Beijing Municipal Commission of Development and Reform. Guidelines for Accounting of Greenhouse Gas Emissions from Municipal Solid Wastes Incineration Enterprise; Beijing Municipal Commission of Development and Reform: Beijing, China, 2019.
  54. Ministry of Housing and Urban-Rural Development of the People’s Republic of China. Sampling and Analysis Methods for Domestic Waste; Ministry of Housing and Urban-Rural Development of the People’s Republic of China: Beijing, China, 2009.
  55. Park, S.; Lah, T.J. Analyzing the success of the volume-based waste fee system in South Korea. Waste Manag. 2015, 43, 533–538. [Google Scholar] [CrossRef]
  56. Chen, S.; Huang, J.; Xiao, T.; Gao, J.; Bai, J.; Luo, W.; Dong, B. Carbon emissions under different domestic waste treatment modes induced by garbage classification: Case study in pilot communities in Shanghai, China. Sci. Total Environ. 2020, 717, 137193. [Google Scholar] [CrossRef]
  57. Statistics, N. China Energy Statistical Yearbook 2018; China Statistics Press: Beijing, China, 2013. [Google Scholar]
  58. Zhuo, Y.; Liu, Y.; Liu, B. Measuring method and application of urea aqueous solution consumption for SCR after-treatment system. Bus Coach Technol. Res. 2014, 36, 50–52. [Google Scholar]
  59. Scora, G.; Barth, M. Comprehensive Modal Emission Model (CMEM). Cent. Environ. Res. Technol. 2006, 23, 24. [Google Scholar]
  60. Demir, E.; Bektaş, T.; Laporte, G. An adaptive large neighborhood search heuristic for the pollution-routing problem. Eur. J. Oper. Res. 2012, 223, 346–359. [Google Scholar] [CrossRef]
  61. Wang, L.; Li, Y. Greenhouse gas (GHG) emissions and its influencing factors in Beijing municipal solid waste incineration power plant. Chin. J. Environ. Eng. 2017, 11, 6490–6496. [Google Scholar]
  62. Ibikunle, R.A.; Titiladunayo, I.F.; Akinnuli, B.O.; Dahunsi, S.O.; Olayanju, T.M.A. Estimation of power generation from municipal solid wastes: A case study of Ilorin metropolis, Nigeria. Energy Rep. 2019, 5, 126–135. [Google Scholar] [CrossRef]
  63. Guo, Q.; Dai, X. Analysis on carbon dioxide emission reduction during the anaerobic synergetic digestion technology of sludge and kitchen waste: Taking kitchen waste synergetic digestion project in Zhenjiang as an example. Waste Manag. 2017, 69, 360–364. [Google Scholar] [CrossRef]
  64. Kathirvale, S.; Yunus, M.N.M.; Sopian, K.; Samsuddin, A.H. Energy potential from municipal solid waste in Malaysia. Renew. Energy 2004, 29, 559–567. [Google Scholar] [CrossRef]
  65. Morris, J. Recycling versus incineration: An energy conservation analysis. J. Hazard. Mater. 1996, 47, 277–293. [Google Scholar] [CrossRef]
  66. Sevigné-Itoiz, E.; Gasol, C.M.; Rieradevall, J.; Gabarrell, X. Contribution of plastic waste recovery to greenhouse gas (GHG) savings in Spain. Waste Manag. 2015, 46, 557–567. [Google Scholar] [CrossRef] [Green Version]
  67. Srinivasa, K.G.; Sowmya, B.J.; Shikhar, A.; Utkarsha, R.; Singh, A. Data analytics assisted internet of things towards building intelligent healthcare monitoring systems: Iot for healthcare. J. Organ. User Comput. 2018, 30, 83–103. [Google Scholar] [CrossRef]
  68. Biswas, S.; Devi, D.; Chakraborty, M. A hybrid case based reasoning model for classification in internet of things (Iot) environment. J. Organ. User Comput. 2018, 30, 104–122. [Google Scholar] [CrossRef]
  69. Reddy, M.R.; Srinivasa, K.G.; Reddy, B.E. Smart vehicular system based on the internet of things. J. Organ. User Comput. 2018, 30, 45–62. [Google Scholar] [CrossRef]
  70. Sousa Matos, M.R.; Frota, Y.; Ochi, L.S. Green vehicle routing and scheduling problem with split delivery. Electron. Notes Discret. Math. 2018, 69, 13–20. [Google Scholar] [CrossRef]
Figure 1. MSW quantity from 2004 to 2017 in China.
Applsci 10 01673 g001
Figure 2. GHG emissions evaluation boundary in Scenario 1.
Applsci 10 01673 g002
Figure 3. GHG emissions evaluation boundary in Scenario 2.
Applsci 10 01673 g003
Figure 4. GHG emissions evaluation boundary in Scenario 3.
Applsci 10 01673 g004
Figure 5. GHG emissions evaluation boundary in Scenario 4.
Applsci 10 01673 g005
Figure 6. GHG emissions evaluation boundary in Scenario 5.
Applsci 10 01673 g006
Figure 7. GHG emissions quantity in five scenarios.
Applsci 10 01673 g007
Figure 8. GHG emissions from MSW incineration under five scenarios.
Applsci 10 01673 g008
Figure 9. The relationship between plastic separation rate and net GHG emissions from incineration.
Applsci 10 01673 g009
Figure 10. GHG emissions from MSW landfill under five scenarios.
Applsci 10 01673 g010
Figure 11. GHG emissions from MSW landfill for different methane recycling rate.
Applsci 10 01673 g011
Figure 12. The relationship between separation rate and net GHG emission reduction rate.
Applsci 10 01673 g012
Figure 13. GHG emissions from MSW transportation and its proportion of total emissions.
Applsci 10 01673 g013
Table 1. MSW characteristics in Beijing.
Waste ComponentsWaste Composition
(%) [51]
Moisture Content
(%) [52]
Total Carbon Content on Dry Basis
(%) [53]
Fraction of Fossil Carbon in Total Carbon Content
(%) [41]
Fraction of Degradable Organic Carbon on Wet Basis (%) [41]Heat Value
on Dry Basis
(MJ/t) [54]
Kitchen waste47.8582.150.60154650
Ash and brick3.4811.5010006980
Wood3.3321.653.0304318,610
Paper20.8329.246.131416,600
Textile2.3422.961.03202417,450
Plastics20.7432.578.77100023,260
Glass1.232.4000140
Metal0.25.4000700
Table 2. GHG emissions evaluation scope in the paper.
Waste Management ActivitiesIncluding or Not
Collection and transportation
Fixed facility operation×
Landfill
Energy recover from landfill×
Composting
Incineration
Energy recover from incineration
Recycling of renewable resources
Table 3. MSW disposal quantity by different treatment way in five scenarios.
ScenarioLandfill (t/d)Incineration (t/d)Composting (t/d)Recycling (t/d)
Scenario 1103419200————
Scenario 2786769994675——
Scenario 3——14,8664675——
Scenario 45523491346754430
Scenario 5——10,43646754430
Note that for comparison purposes, the MSW quantity in all scenarios is consistent with the baseline scenario (Scenario 1), which is the sum of the landfill and incineration treatment volumes in Beijing per day in 2017.
Table 4. Waste component and heat value of residual mixed waste in five scenarios.
Waste CompositionScenario 1Scenario 2Scenario 3Scenario 4Scenario 5
Kitchen waste (%)47.8531.45 31.45 44.80 44.80
Ash and brick (%)3.484.57 4.57 6.52 6.52
Wood (%)3.334.38 4.38 6.24 6.24
Paper (%)20.8327.38 27.38 19.50 19.50
Textile (%)2.343.08 3.08 2.19 2.19
Plastics (%)20.7427.26 27.26 19.42 19.42
Glass (%)1.231.62 1.62 1.15 1.15
Metal (%)0.20.26 0.26 0.19 0.19
Heat value on dry basis (MJ/t)9407109521095294279427
Table 5. Relevant parameters of GHG emissions calculation model for MSW transportation.
NotationDescriptionTypical Values
κdthe low heating value of diesel(GJ/t)42.652
CCdthe carbon content per unit heating value of diesel(tC/GJ)0.0202
OFdthe oxidation factor of diesel consumption98%
E F C H 4 d the CH4 emission factor of diesel consumed by heavy duty vehicle under State-Ⅴ emission standard in China (mgCH4/km)175
E F N 2 O d the N2O emission factor of diesel consumed by heavy duty vehicle under State-Ⅴ emission standard in China (mgN2O/km)30
GWPCH4the global warming potential of CH4 21
GWPN2OOOthe global warming potential of N2O310
Lthe mass ratio of urea in the urea additive32.5%
Table 6. Relevant parameters for vehicle fuel consumption model.
NotationDescriptionTypical Values
ϕFuel-to-air mass ratio1
kEngine friction factor (J/r/L)0.2
NEngine speed (r/s)33
VEngine displacement (L)5
ηEfficiency parameter for diesel engines0.45
κdHeating value of a typical diesel fuel (J/g)42652
εVehicle drive train efficiency0.4
w1Curb-weight (kg)5000
w2Vehicle load (kg)10,000
aAcceleration (m/s2)0
gGravitational constant (m/s2)9.81
θRoad angle0
CdCoefficient of aerodynamic drag0.7
AFrontal surface area (m2)5
ρAir density (kg/m3)1.2041
CrCoefficient of rolling resistance0.01
Table 7. Relevant parameters of GHG emissions calculation model for MSW landfill.
NotationDescriptionTypical Values
DOCFraction of degradable organic carbon——
DOCiDegradable organic carbon for waste fraction ishown in Table 1
fiWaste composition shown in Table 4
DDOCMass of decomposable DOC——
MSWlMass of waste landfilledshown in Table 3
DOCfFraction of DOC that can decompose0.5
MCFCH4 correction factor for aerobic decomposition
4
correction factor for aerobic decomposition
1
FFraction of CH4 in generated landfill gas
4
in generated landfill gas
0.5
RlCH4 recovered rate0
OXOxidation factor0
C H 4 emission L Mass of CH4 emissions in landfill——
E C H 4 L Carbon dioxide equivalent of CH4 emissions——
Table 8. Relevant parameters of GHG emissions calculation model for MSW incineration.
NotationDescriptionTypical Values
EIGHG emissions in incineration (t)——
EiDirect emissions from mineral carbon incineration (t)——
EeGHG emissions reduction from electricity generation (t)——
MSWiMass of waste incinerated (t)shown in Table 3
fiWaste compositionshown in Table 4
dmiDry matter content of wet weightshown in Table 1
CFiDOC content of dry weightshown in Table 1
FCFi,tFossil carbon fraction of total carbon
total carbon
shown in Table 1
OFwOxidation factor0.95
ADeMass of on-grid energy from incineration (MWh)——
EFeElectricity GHG emissions factor (tCO2/MWh)0.4506
HVMSWHeat value (kJ/kg MSW)shown in Table 4
ξHeat efficiency for incineration plant20%
ζSelf-used electricity rate for incineration plant20%
Table 9. GHG emissions quantity in five scenarios.
ActivitiesScenario1 (tCO2e)Scenario2 (tCO2e)Scenario3 (tCO2e)Scenario4 (tCO2e)Scenario5 (tCO2e)
Transportation91.4997.0697.84102.14102.69
Landfill12,669.9010,072.220.006853.690.00
Incineration3626.293626.347702.411813.053851.21
Compost0.00827.48827.48827.48827.48
Recyclable0.000.000.00−4033.40−4033.40
Electricity−1733.20−1535.11−3260.59−927.53−1970.23

