Article

Chemical, Nutritional and Antioxidant Characteristics of Different Food Seeds

National Institute for Research and Development of Optoelectronics INOE 2000, Research Institute for Analytical Instrumentation, 67 Donath street, 400293 Cluj-Napoca, Romania
*
Author to whom correspondence should be addressed.
Appl. Sci. 2020, 10(5), 1589; https://doi.org/10.3390/app10051589
Submission received: 17 October 2019 / Revised: 19 January 2020 / Accepted: 25 January 2020 / Published: 27 February 2020
(This article belongs to the Section Food Science and Technology)

Abstract

:
The objective of this study was to determine the chemical composition of five different food seeds (sunflower, poppy, hemp, flax and sesame) regarding fatty acid, mineral (Fe, Cu, Zn, Na, Mg, K, Ca, Al) and protein content. In addition, the total antioxidant capacity of the seeds was evaluated using the photochemiluminescent assay. The food seeds were subjected to lipid extraction and converted into fatty acid methyl esters before the gas chromatography analysis. In all food seeds, the saturated (SFAs), monounsaturated (MUFAs) and polyunsaturated fatty acids (PUFAs) were identified, respectively. PUFAs were the most abundant fatty acids (61.2% ± 0.07% and 84.8% ± 0.08% of total fatty acids), with the highest content in flax and hemp seed oil. Also, high amounts of omega-3 from PUFAs were determined in flax and hempseed oil. Based on the obtained results the sunflower, sesame and poppy seeds are good sources of omega-6, while flax and hemp seeds are good sources of omega-3. All samples are rich in minerals (Na, K, Ca, Mg) and have more than 20% protein content.

1. Introduction

The importance of functional foods, nutraceuticals, food supplements and other natural diet compounds has been associated with health promotion and disease prevention. Fatty acids (FAs) have important biological functions, such as being components of biological membranes, precursors of different molecules, energy storage and the transport of vitamins [1,2]. Lipids, carbohydrates, proteins, minerals and vitamins present in all foods are essential nutrients, compounds that cannot be synthetized by the human body in adequate quantities and must be supplied by the diet [3,4].
The major sources of lipids are vegetable oil and different foodstuffs of animal origin [5]. Lipids consist of FAs classified, according to the presence or absence of double bonds, in: saturated fatty acids (SFAs—without double bonds), monounsaturated fatty acids (MUFAs—with one double bond) and polyunsaturated fatty acids (PUFAs—with two or up to six double bonds). The SFAs are harmful for human health and their excessive consumption leads to cardiovascular diseases, obesity, hypertension and colon cancer [6]. Unlike these, unsaturated FAs have beneficial effects on human health, such as cholesterol reduction and cardiovascular disease prevention (MUFAs) [7], the reduction of insulin levels in diabetes, and the stabilization of protein and mineral deficiency in the human body (PUFAs with more than two double bonds) [4]. The two major PUFA classes are α-linolenic acid (C18:3, (n-3)) and linoleic acid (C18:2, (n-6)) [6]. Vegetable oil, margarine, nuts and whole-grain products are important sources of omega-6 FAs (C18:2, (n-6)), while seafood, canola oil, soybean, flaxseed and walnuts are rich in omega-3 FAs (C18:3, (n-3). The consumption of omega-3 FAs is recommended to improve immunity, brain function and human health [8,9,10]. Generally, the seeds are good sources of protein and carbohydrates due to their high oil content [11]. The hemp seeds (non-drug varieties of Cannabis sativa) contain also high levels of vitamins A, C and E, minerals (Ca, Mg, Zn, Fe, K, P), β-carotene and fibers [12]. In addition, poppy seeds are suitable for human nutrition due to their high content of FAs, such as linoleic, oleic, palmitic, stearic and α-linolenic acids [13]. Flaxseed oil contains all the essential FAs, especially omega-3 FAs and amino acids, necessary to maintain proper cellular function through the synthesis of proteins [14]. The most widely used technique for FAs analysis in vegetable oils is gas chromatography (GC) coupled with flame ionization detector (GC-FID) or mass spectrometry (GC-MS) [15,16]. Prior to GC analysis, FAs should be converted into fatty acid methyl esters (FAMEs), which are more volatile than their correspondent FAs [1]. The extraction is the most significant step for extraction of all FAs from seed samples. Usually, liquid–liquid extraction with solvent is used for separation of FAs from food samples. Thus, depending on the solvent used, several lipids, such as free FAs, triacylglycerols, phospholipids, free sterols, sterol esters, etc. can be extracted [9]. The acid hydrolysis is used to improve the lipid extraction process from different food samples and the elimination of non-lipid compounds [17]. The obtained fat content by using the acid hydrolysis is considerably improved (36.74% from dried egg without hydrolysis and 42.39% using acid hydrolysis before extraction) [18]. Teymouri et al. [19] used hydrolysis before solvent extraction of lipids from algae. These minerals play an important role in human growth and development due to their contribution to nutrient metabolism, hormonal function and cell differentiation [20]. Mineral deficiencies can be associated with growth stunting and cognitive impairment in the population [21]. The antioxidants can prevent lipid oxidation and deterioration of color, flavor and nutritional quality of food, but antioxidant properties are affected by processing, storage, and total solid and FAs content [5]. To our knowledge, the mineral content of selected seeds (sunflower, hemp, flax, poppy and sesame) were not completely characterized. Based on the importance of these food seeds as a mineral source, a complete characterization regarding the mineral composition of these foods will be proposed.
The aim of this study was to determine the content of FAs (SFAs, MUFAs and PUFAs), omega-6 and omega-3 FAs, minerals and protein from poppy, sunflower, sesame, flax and hemp seeds. The antioxidant activities and their correlation with FA content were also investigated.

2. Materials and Methods

2.1. Chemicals and Reagent

Hydrochloric acid, isooctane, potassium hydroxide, methanol, sodium hydrogen sulphate monohydrate of analytic reagent grade and suprapure nitric acid 65% and hydrogen peroxide 30% were purchased from Merck (Darmstadt, Germany). FAME standard mixture (Supelco 37 component FAME mix, CRM47885) was purchased from Sigma–Aldrich (Darmstadt, Germany). The chemical kit (kits no. 400801) for the determination of antioxidant capacity of lipid-soluble (ACL) substances using photochemiluminescence (PCL) assay was procured from analytic Jena (Jena, Germany). All solutions were prepared using ultrapure water (18.2 MΩ/cm, 20 °C) obtained from a Direct-Q3 UV Water Purification System (Millipore, Molsheim, France).

2.2. Sample Description

Five different shelled seed samples (10 samples of each seed type) (poppy, sunflower, sesame, flax and hemp) were purchased from local supermarkets from Cluj-Napoca, Romania. All the samples were freeze-dried (FreeZone 2.5 LiterBenchtop freeze dry system, Labconco, Kansas, MO, USA) at −40 °C and −25 psi for 24 h to uniform their moisture content. The freeze-dried samples were grounded using an agate mortar and pestle to obtain homogenized powders. The moisture of samples was determined by drying the samples to constant mass at 105 °C in a universal oven (UFE 400, Memmert, Germany).

2.3. Extraction of Lipids

The dried samples (2 g) were treated with 50 mL 4 M hydrochloric acid and boiled for 1 h. A volume of 150 mL distilled water was added to the mixture and the obtained solution was filtered and washed until neutral pH. Afterwards, the filter paper was dried at 105 °C for 1 h and then subjected to extraction with petroleum ether for 4 h in a Soxhlet apparatus. After extraction, the petroleum ether was evaporated, the flask was dried at 105 °C and weighted.

2.4. Preparation of Fatty Acid Methyl Esters (FAMEs)

The obtained lipids were converted into FAMEs by transesterification with potassium hydroxide according to Petrović et al. [1]. The samples (0.06 g) were dissolved in isooctane, treated with 0.2 mL methanolic potassium hydroxide solution (2 mol/L) and vigorously stirred for 30 s. Finally, the mixture was treated with 1 g sodium hydrogen sulphate to prevent the saponification of the methyl esters and to neutralize excess alkali.

2.5. Free Fatty Acid (FFA) Content from Extracted Oils
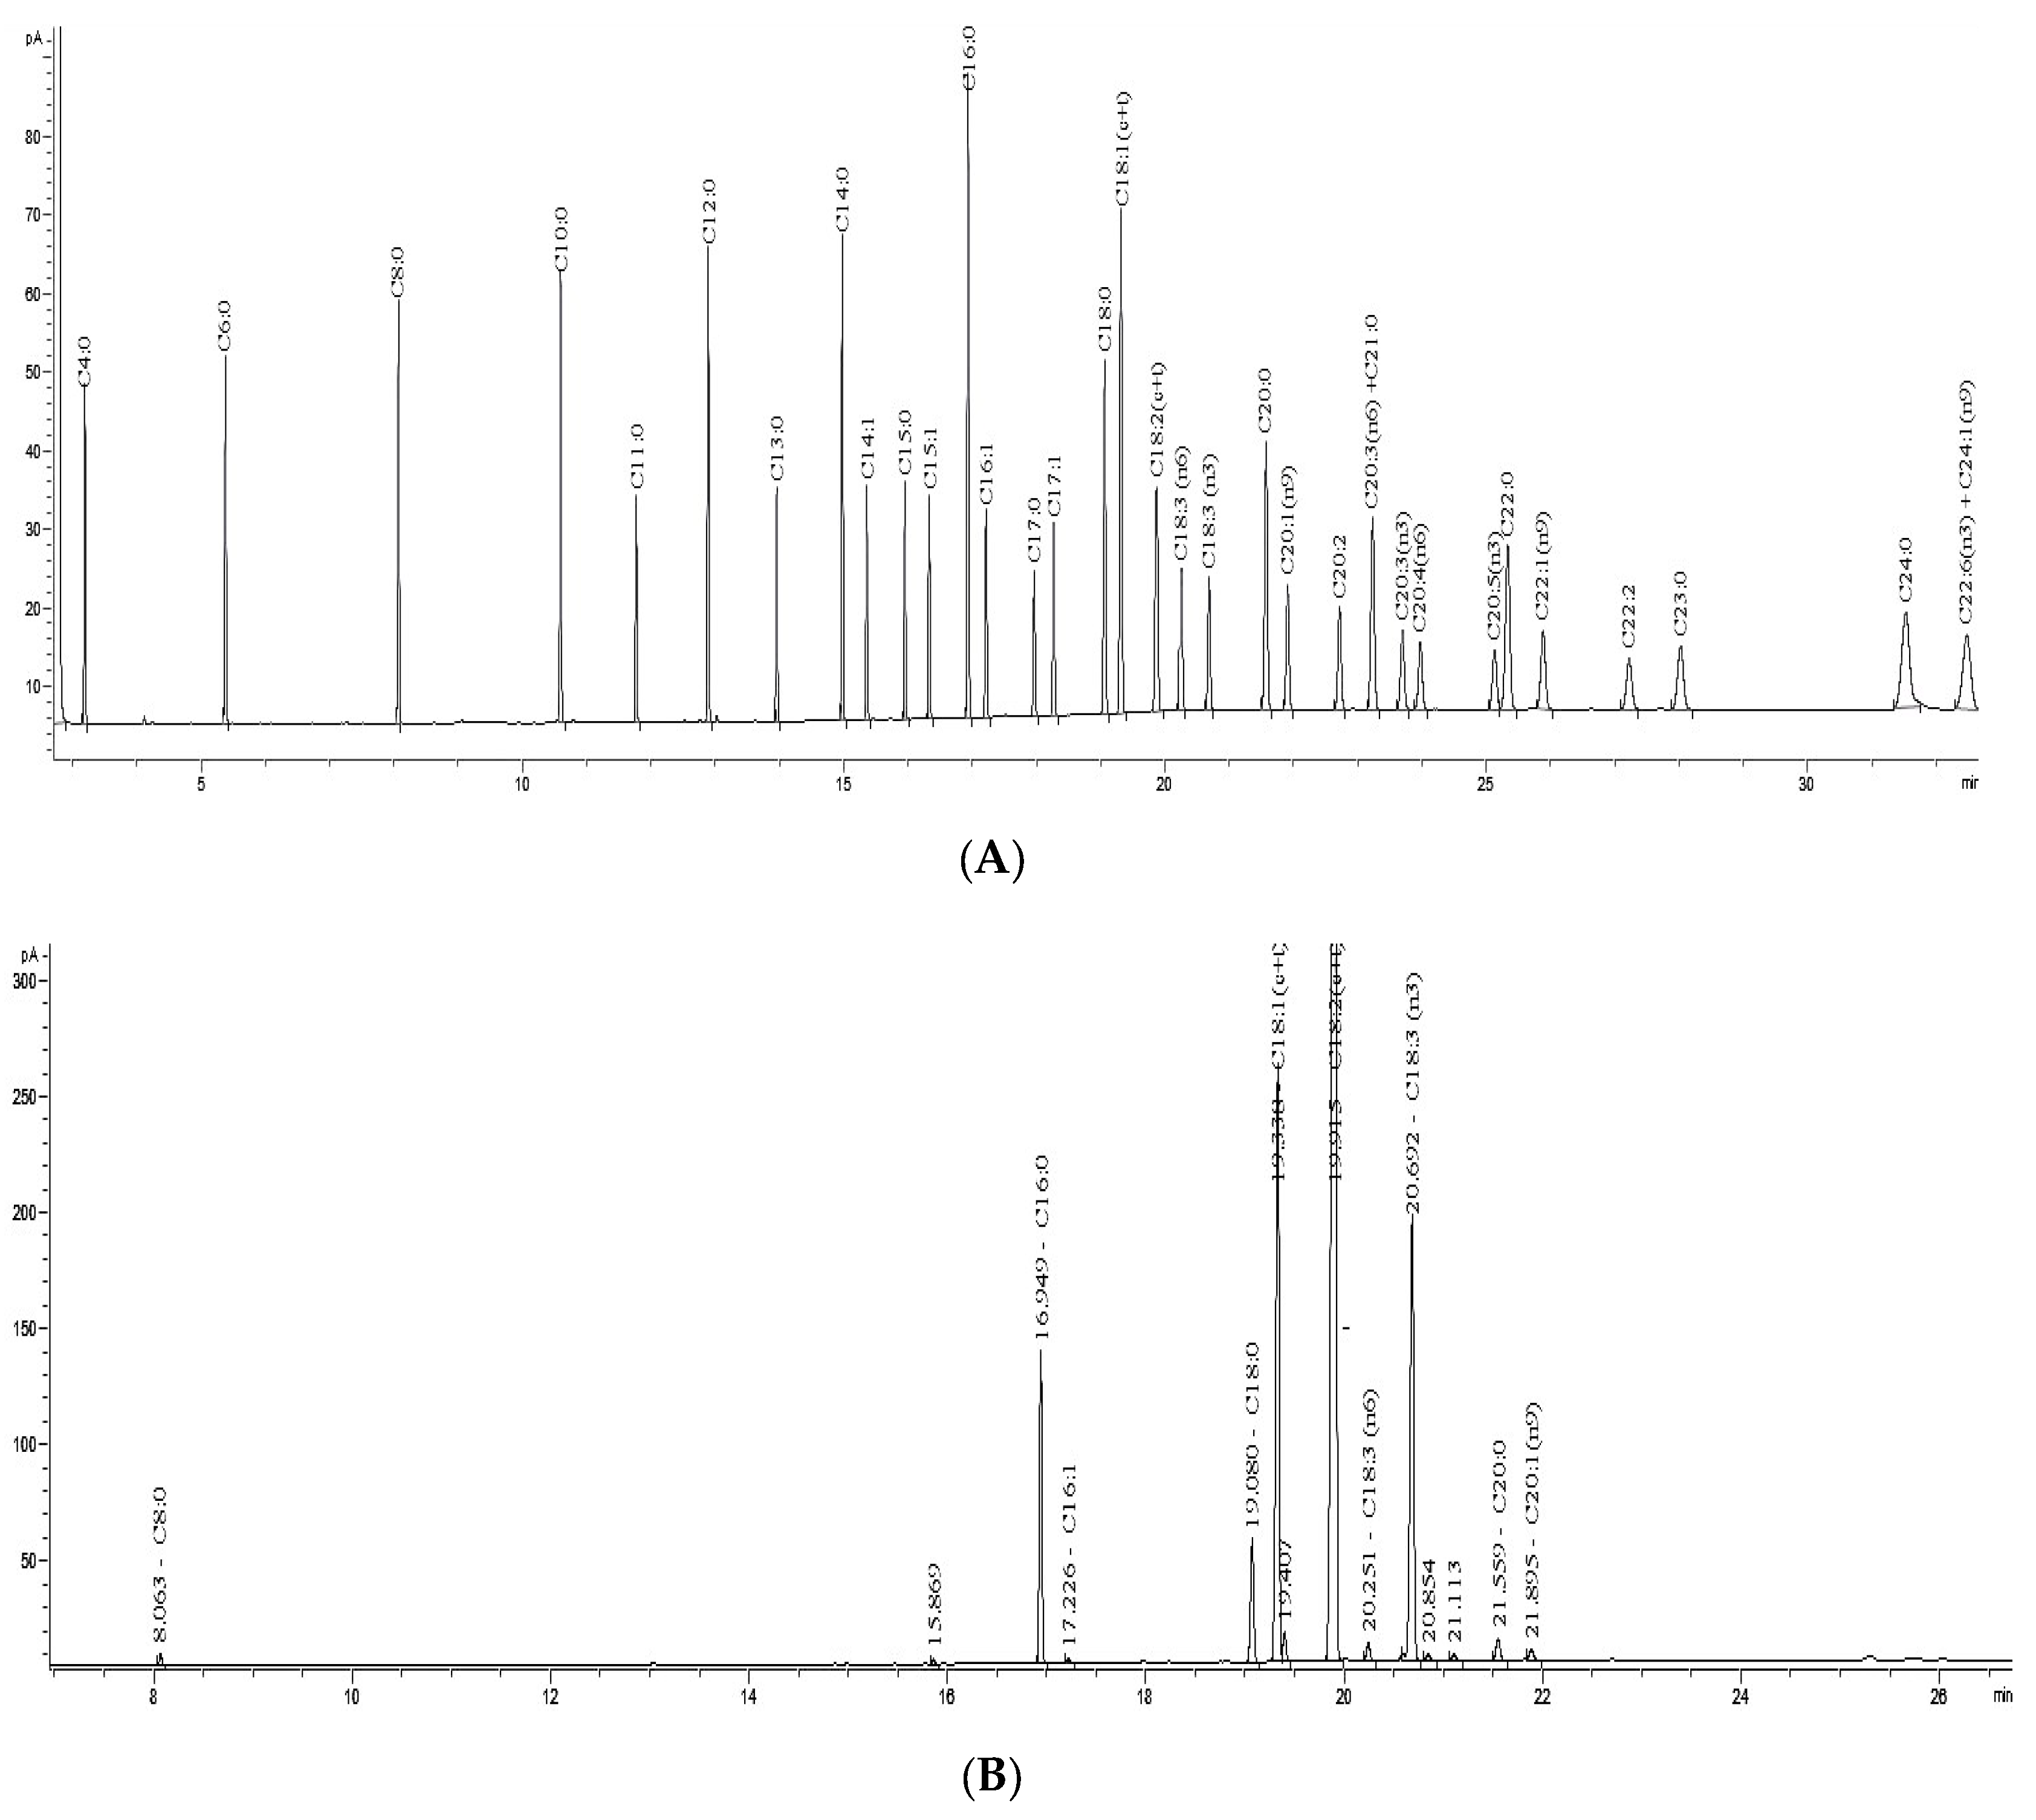
The FFA content was determined based on the acid value by dissolving the samples in a mixture of solvents (diethyl ether: ethanol, 1:1, v/v) and 2% phenolphthalein (in ethanol) as indicator and titrated with KOH (0.1 M in ethanol). The FFA was calculated with the Equation (1):
FFA = V * 56.1 * C m mg   KOH / g
where: V is the volume of KOH used for titration (mL), 56.1 is the molecular weight of KOH (mg/mmol), C is the concentration of KOH (m mol/mL) and m is the mass of the analyzed sample (g) [22].

2.6. GC Analysis

The FAMEs content was determined by GC-FID (Agilent Technologies, 6890N GC, Wilmington, DE, USA) equipped with a DB-WAX capillary column with polyethylene glycol stationary phase (30 m × 0.25 mm × 0.25 µm) and a flame ionization detector (Agilent 7683). The gas carrier was helium with a constant flow rate of 1 mL/min. The injection volume was 1 µL in 1:20 split mode. The GC oven temperature program consists of three stages: 60 °C for 1 min, 60 to 200 °C (rate 10 °C/min, 2 min), from 200 to 220 °C (5 °C/min, 20 min). The temperature of the injector and detector was set to 250 °C. The identification of FAs in samples was completed by comparing their retention times with those of the standard mixture.

2.7. Mineral Determination in Seeds Samples

An amount of 1 g sample was digested with 5 mL nitric acid 65% and 2 mL hydrogen peroxide 30% in a closed polytetrafluoroethylene (PTFE) vessel using a microwave digestion system (Speedwave MWS-3+, Berghof, Eningen, Germany) according to the method described by Naozuka et al. [23]. The digested samples were quantitatively transferred into 20 mL volumetric flasks and diluted to the mark with ultrapure water. Three replicate measurements were carried out for each sample. The metal contents were measured using ICP-OES Optima 5300 DV (Perkin Elmer, Woodbridge, ON, USA). The calibration standards were prepared from 1000 mg/L single element (Fe, Cu, Zn, Na, Mg, K, Ca and Al) standard solutions (Merck, Germany) by appropriate dilutions.

2.8. Protein Determination

The protein content was determined by Flash EA 2000 CHNS/O analyzer (Thermo Fisher Scientific, Waltham, MA, USA) by means of combustion of 2–3 mg dried powder. The instrument calibration (K factor method) was performed with atropine (Thermo Fisher Scientific, Cambridge, UK). The protein was calculated using the general factor (6.25).

2.9. Determination of the Antioxidant Activity

The antioxidant activity of the seeds extracts was determined using two methods: (1) facile chemiluminescence assay by using Photochem device (Analytik Jena, AG, Jena, Germany). 1 g dried powder was weight in a 50 mL centrifuge flask and 10 mL methanol was added, the flask was vortexed for 5 min, then centrifuge for 10 min at 4500 rpm according to the procedure reported by [24]. The supernatant was taken into analysis. The antioxidant capacity of the sample is quantified by comparison with a calibration curve of Trolox and the results are expressed as µmol Trolox/mg of seeds and (2) 2,2-diphenyl-1-picrylhydrazyl (DPPH) radical scavenging activity according to the a modified method of [25]: 0.1 g dried powder was derivatized with 2.7 mL DPPH in ethanol and the mixture was vigorously stirred for 60 min. The absorbance of the mixture was measured at 517 nm with spectrophotometer Lambda 25 (Perkin Elmer, Woodbridge, UK). The DPPH radical scavenging activity in the extracts was expresses as µmol Trolox/mg of seeds.

2.10. Statistics

For the statistical processing of the data, the XLStat Microsoft Excel plug-in (Addinsoft) was used. Pearson’s correlation matrix was employed to identify relationships between parameters at a statistical significance of p < 0.05. Principal component analysis (PCA) with Varimax rotation was used to interpret the structure of the principal dataset.

3. Results and Discussion

3.1. Lipid Extraction Yield

FAs were determined using the following steps: (i) oil extraction using a Soxhlet apparatus and (ii) conversion of FAs to FAMEs through esterification. A hydrolysis pre-treatment was used in order to improve FAs separation. The conventional procedures for the lipid extraction from different types of samples (like Bligh and Dyer, and Folch method) use a mixture of two solvents (e.g., chloroform and methanol). In these cases, high oil yield was obtained due to extraction of total lipids [17,18]. However, by using polar solvents, beside FAs, the phospholipids are also extracted [12]. Therefore, in order to extract only FAs from seeds, a hydrolysis pre-treatment was introduced before the oil extraction. For the free-lipid extraction, the use of non-polar solvent (e.g., petroleum ether or hexane) is recommended. The hydrolysis of seeds was applied before solvent extraction to: (i) improve the separation of lipids from non-lipid components (proteins, carbohydrates and amino acids), (ii) breakdown the covalent bonds (lipids, carbohydrates and proteins) and hydrogen binding (lipids and proteins) and to obtain easily extractable forms [18]. The lipid extraction yield from studied seed samples are shown in Table 1. In order to compare the results obtained with those reported in the literature, some data are given in Table 1.
The highest yield of extracted lipids was obtained for sunflower seeds (54.1 ± 0.50%), while the lower yield was obtained for hemp seeds (30.8 ± 0.21%). The obtained oil yield for sesame seeds was 40.0 ± 0.40%, which was lower than the value obtained by Junpeng et al. [30]. The differences can be attributed to different geographical origin and genotype. The obtained yield of flaxseed oil extracted with petroleum ether was lower compared with the extraction using a mixture of chloroform-methanol (2:1(v/v)) (35.0%) and supercritical extraction with n-propane (41.0%) [29]. The difference can be attributed to the used extraction method, the extraction of oil using a polar solvent being more efficient compared with a physico-chemical method.

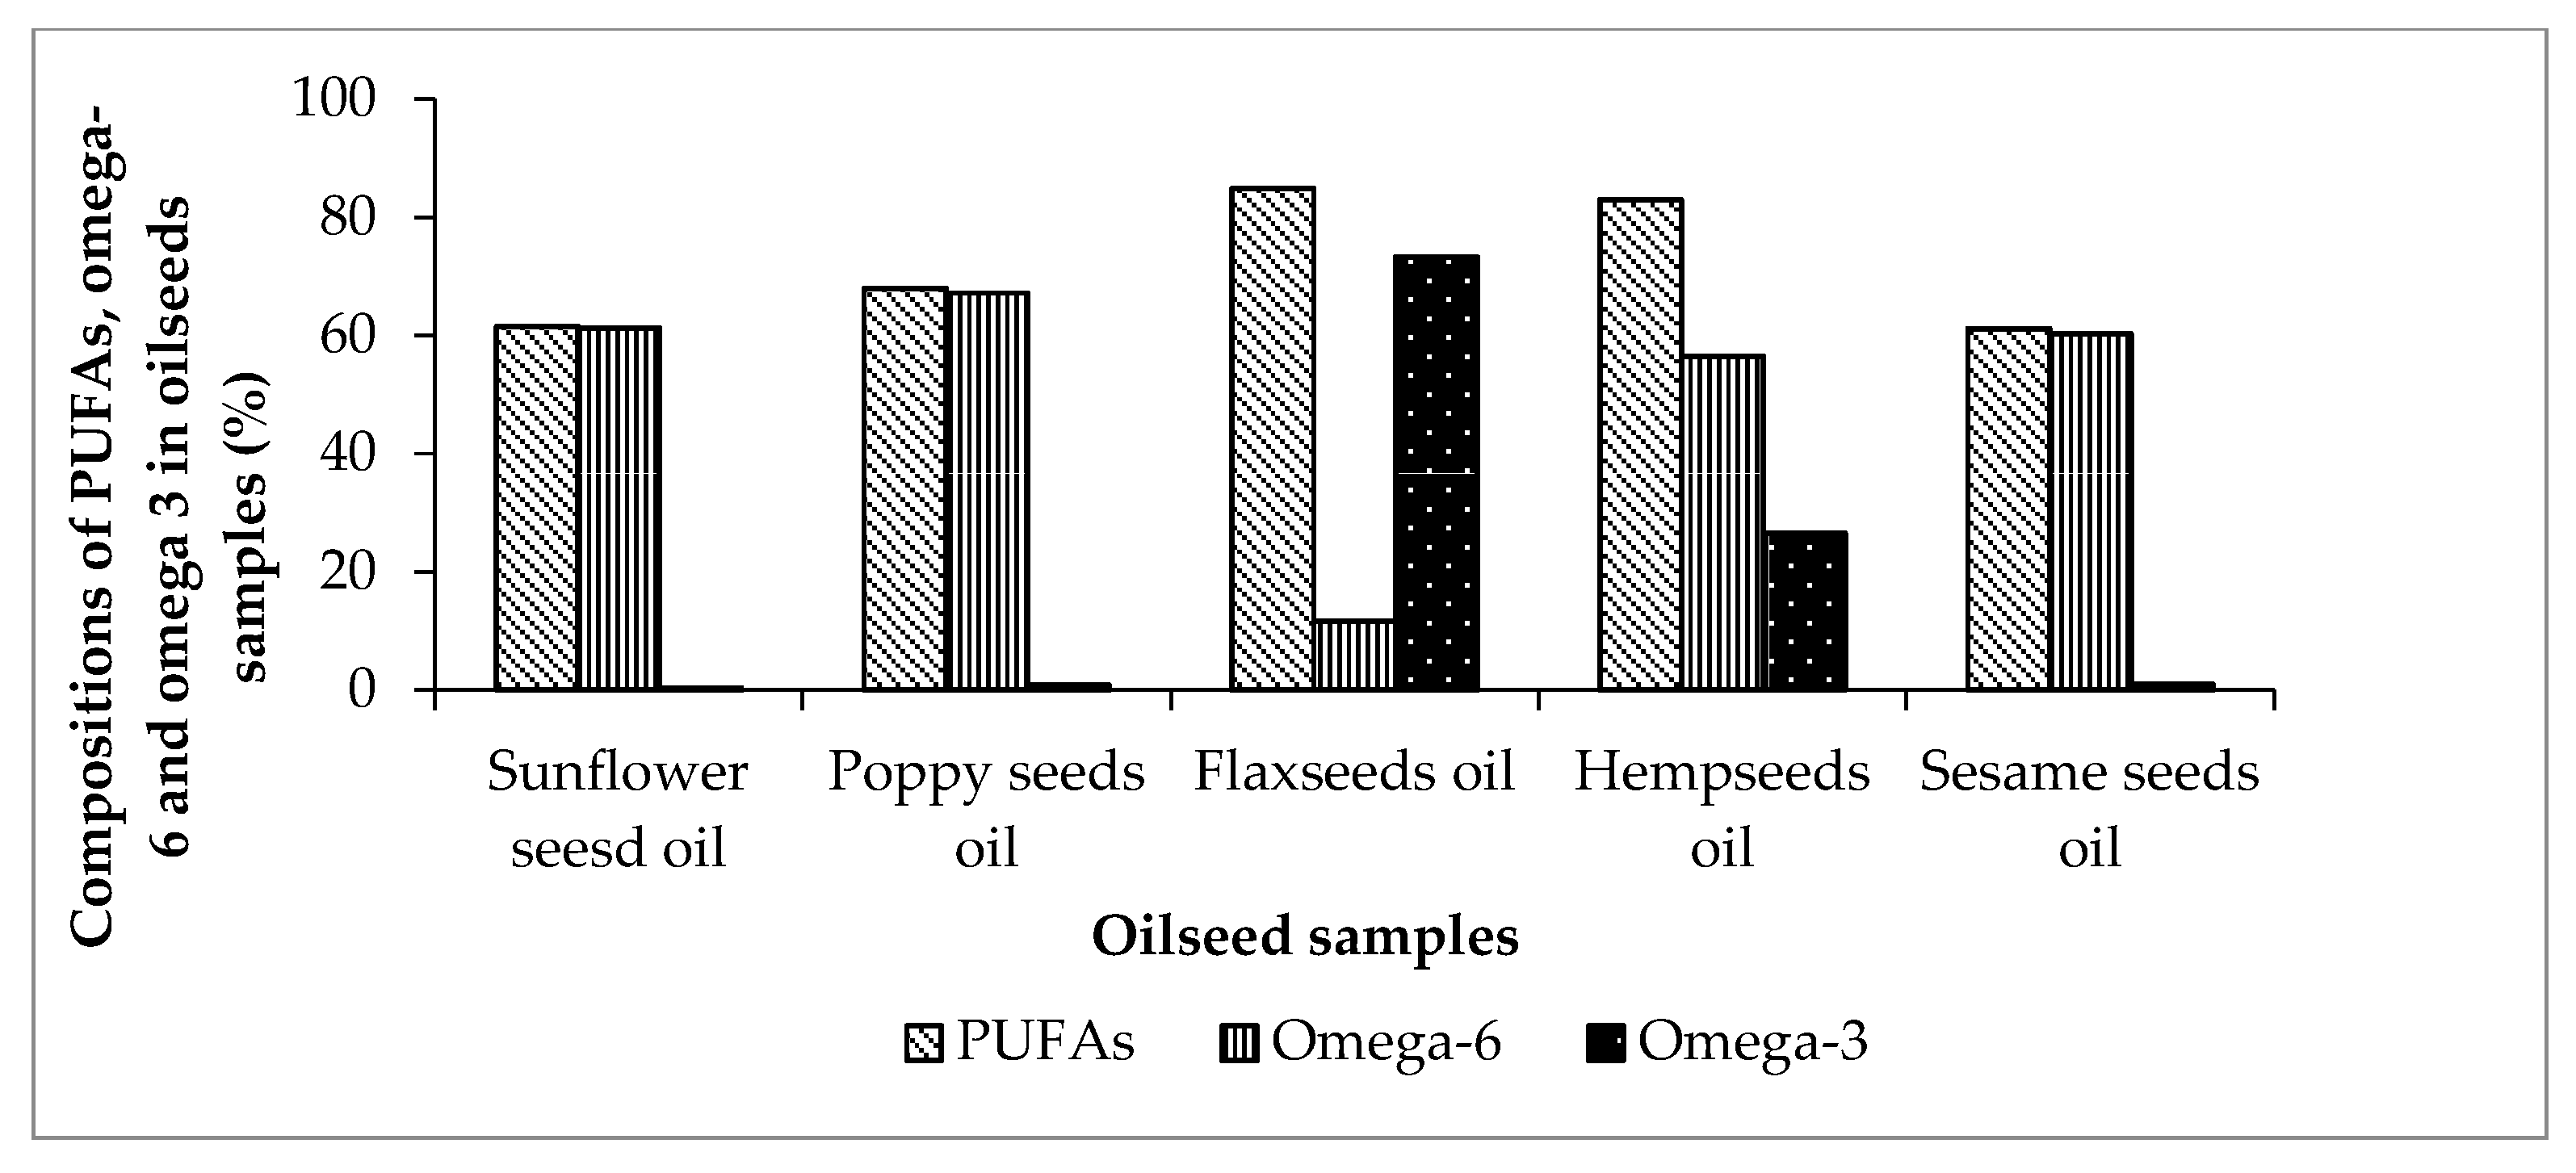
3.2. FAs Composition

The FAs obtained from seeds after extraction were converted to corresponding FAMEs to determine their profiles by GC-FID. The main problem identified in analysis of FAMEs standards is the overlapping of isomers. MUFAs and PUFAs present two configurations (cis and trans) based on the position of the first double bond from the FAs. The peaks are overlapping for oleic acid (C18:1 (n-9)) and linoleic acid (C18:2 (n-6). C20:3(n-6) overlap with C21:0, C20:3 (n-6) and C21:0 coelute and C22:6(n-6) and C24:1(n-9) coelute. Similar results were reported by Chung et al. for FAs from milk samples [31]. The peak overlapping is caused by oleic acid (C18:1) present in olive and rapeseed oils, by linoleic acid (C18:2) present in sunflower and soya bean oils and by linolenic acid (C18:3) present in flaxseed and hemp seed oils [1]. Figure 1 shows the representative chromatograms of the 37 components FAME standard mixture (A) and analyzed hemp seed oil (B).
The obtained oilseeds analyzed for FFAs (as acid value) presented an acid value of 0.70 ± 0.1 mg KOH/g for sunflower oil, 0.72 ± 0.2 mg KOH/g for sesame oil, 1.43 ± 0.2 mg KOH/g for flaxseed oil, 1.68 ± 0.3 mg KOH/g for hempseed oil and 1.86 ± 0.3 mg KOH/g for poppy seed oil. The FAs, SFAs, MUFAs and PUFAs composition in the oilseeds and PUFAs/SFAs ratio are presented in Table 2.
FAs composition of the analyzed seed oils contains SFAs (caprylic acid (C8:0), lauric acid (C12:0), myristic acid (C14:0), palmitic acid (C16:0), stearic acid (C18:0), arachidic acid (C20:0), tricosanoic acid (C23:0) and lignoceric acid (C24:0)), MUFAs and PUFAs. The SFAs classes include: caprylic acid (C8:0), capric acid (C10:0), lauric acid (C12:0), myristic acid (C14:0), palmitic acid (C16:0), stearic acid (C18:0), arachidic acid (C20:0), eicosadienoic acid (C22:0), tricosanoic acid (C23:0) and lignoceric acid (C24:0). The predominant SFA identified in all the analyzed seed oils is palmitic acid (C16:0). The highest value of the palmitic acid was obtained in poppy seed oil (7.79% ± 0.07%), while the lowest value was in flaxseed oil (2.51% ± 0.07%). In addition, the stearic acid (C18:0) was found in a lower amount than palmitic acid. The highest amount of stearic acid (C18:0) was found in sesame seed oil (3.89% ± 0.02%). Small traces of archidic acid (C20:0) were detected in all samples. A small amount of tricosanoic acid (C23:0) was found in sesame (2.86% ± 0.03%), sunflower (1.67% ± 0.02%) and hempseed oils (0.17% ± 0.02%), respectively. Excessive consumption of SFAs has a negative effect on human health, especially at the cardiovascular level [32]. The vegetable oils contain five major FAs, such as stearic (C18:0, SFA), palmitic (C16:0, SFA), oleic (C18:1, n-9, MUFA), linoleic (C18:2, n-6, PUFA) and linolenic (C18:3, n-3, PUFA) acids [33]. The obtained results revealed a high content of oleic acid (C18:1 cis (n-9)) in sunflower seed oil (26.0% ± 0.50%), followed by sesame seed oil (21.5% ± 0.60%). In the case of poppy seed, flaxseed and hempseed oils, the content of oleic acid is smaller than 8%. Therefore, it can be concluded that the investigated sunflower, poppy and sesame seeds are good sources of oleic acid (C18:1 (n-9)) and linoleic acid (C18:2, n-6). Linoleic acids (C18:2, n-6) are PUFAs and are found in high amounts in poppy, sunflower and sesame seeds. The main FA is linoleic acid in poppy (67.2% ± 0.80%), sunflower (61.0% ± 0.70%), sesame (60.2% ± 0.50%) and hemp (55.9% ± 0.30%) seed oils, and linolenic acid (73.2% ± 0.40%) in flaxseed oil. In addition, hempseed oil contains linolenic acid (26.5% ± 0.30%), but in lower amounts than flaxseed oil. The optimal ratio of linoleic acid to α-linolenic acid is 3:1. Similar results (74.1% linolenic acid, 13.7% oleic acid, 8.99% palmitic acid, 2.15% stearic acid and 1.00% linoleic acid) were reported by Bratfalean et al. [27] for poppy seed oil and by Orsavova et al. [6] for sunflower seed oil. Furthermore, in sesame, poppy and sunflower seed oils, relatively low contents of linolenic acid (0.91% ± 0.01%, 0.77% ± 0.02% and 0.21% ± 0.02%, respectively) were determined. The obtained results suggested that the flaxseed and hempseed oil are also good sources of linolenic acid. Lu et al. reported that hemp seed oil contains linoleic acid (approximately 50%–70% of the total seeds FAs content) and α-linolenic acids from omega-3 (ω-3) about 15%–25% [34]. Sun et al. [14] investigated the lipid profile of hempseed oil and identified the following FAs contents: 55% linoleic (C18:2 (cis+trans) (n-6)), 16% linolenic acids (C18:3, n-3) and 11.0% oleic acid (C18:1 cis (n-9)). It can be seen that the reported results are similar with our results, out of which for α-linolenic (C18:3, n-3) the highest content (26.5% ± 0.30%) was obtained. Another FA found in low amounts in all analyzed samples was gondoic acid (C20:1, n-9). The content of SFAs, MUFAs and PUFAs in the oilseeds and PUFAs/SFAs ratio is presented in Figure 2.
The obtained results showed that MUFAs were represented by oleic acid (C18:1, (cis+trans) (n-9)), palmitoleic acid (C16:1, n-7), cis-11-eicosenoic acid (C20:1, n-9), 13-docosenoic (C22:1, n-9) acid and nervonic acid (C24:1, n-9). Oleic acid (C18:1, n-9) was found as the most abundant MUFA in almost all samples. Myristoleic acid (C14:1) was not determined in the analyzed samples. All analyzed seed oils contain PUFAs as a majority, in the range of 61.2%–84.8% (Table 2). The highest PUFAs content (84.8% ± 0.08%) was obtained for flaxseed oil samples, followed by hempseed oil (82.9% ± 0.08%). The MUFAs content varied between 6.3%–28.7%. The highest MUFAs content was obtained from sunflower seed oils. PUFAs were more abundant than MUFAs. A high content of PUFAs in seed oil samples has a great importance for health because it can influence the fluidity and permeability of cellular membranes and can help in cardiovascular diseases and autoimmune disorders [33]. Omega-6 (n-6) and omega-3 (n-3) PUFAs are essential FAs, which cannot be produced by the human body and must be obtained from the diet. Food and Agriculture Organization and World Health Organization (FAO/WHO) recommend that trans FAs should not be more than 4% in fat consumed by humans in the diet [34]. The PUFAs/SFAs ratio is considered an important parameter for determination of nutritional value and should be equal to or greater than 1 [29]. The highest PUFAs/SFAs ratio was obtained for flaxseed (16.9), followed by hempseed (14.1), while the lowest ratio was obtained for sesame seeds (4.4), which also suggests that flax and hemp have high nutritional value. Omega-3 (n-3) is represented by α-linolenic acid (C18:3, n-3), cis-5,8,11,14,17-eicosapentenoic acid (EPA, C20:5 (n-3)) and cis-4,7,10,13, 16, 19-docosahexanoic acid (DHA, C22:6 (n-3). The group of omega-6 (n-6) is represented by linoleic acid (C18:2, n-6), γ-linolenic acid (C18:3, n-6) and arachidonic acid (C20:4 (n-6)). The content of PUFAs, omega-6 and omega-3 in the analyzed oilseeds is presented in Figure 3.
Omega-6 (n-6) FA has been found in high amounts in poppy seed (67.2% ± 0.80%), sunflower seed (61.2% ± 0.07%), sesame seed (60.2% ± 0.50%) oils and its content slowly decreases in hempseed oil (55.9% ± 0.30%). The highest amounts of omega-3 were found in flaxseed oil (73.2% ± 0.40%), followed by hempseed oil (26.5% ± 0.30%), while lower amounts were found in sesame seed, poppy seed and sunflower seed oils (below 1%). The poppy, sunflower and sesame seeds have been identified as potential sources of omega-6 and flaxseed and hempseed as potential sources of omega-3. Recent studies reported that 3 g omega-3/day can lead to a reduction of hypertension problems [35].

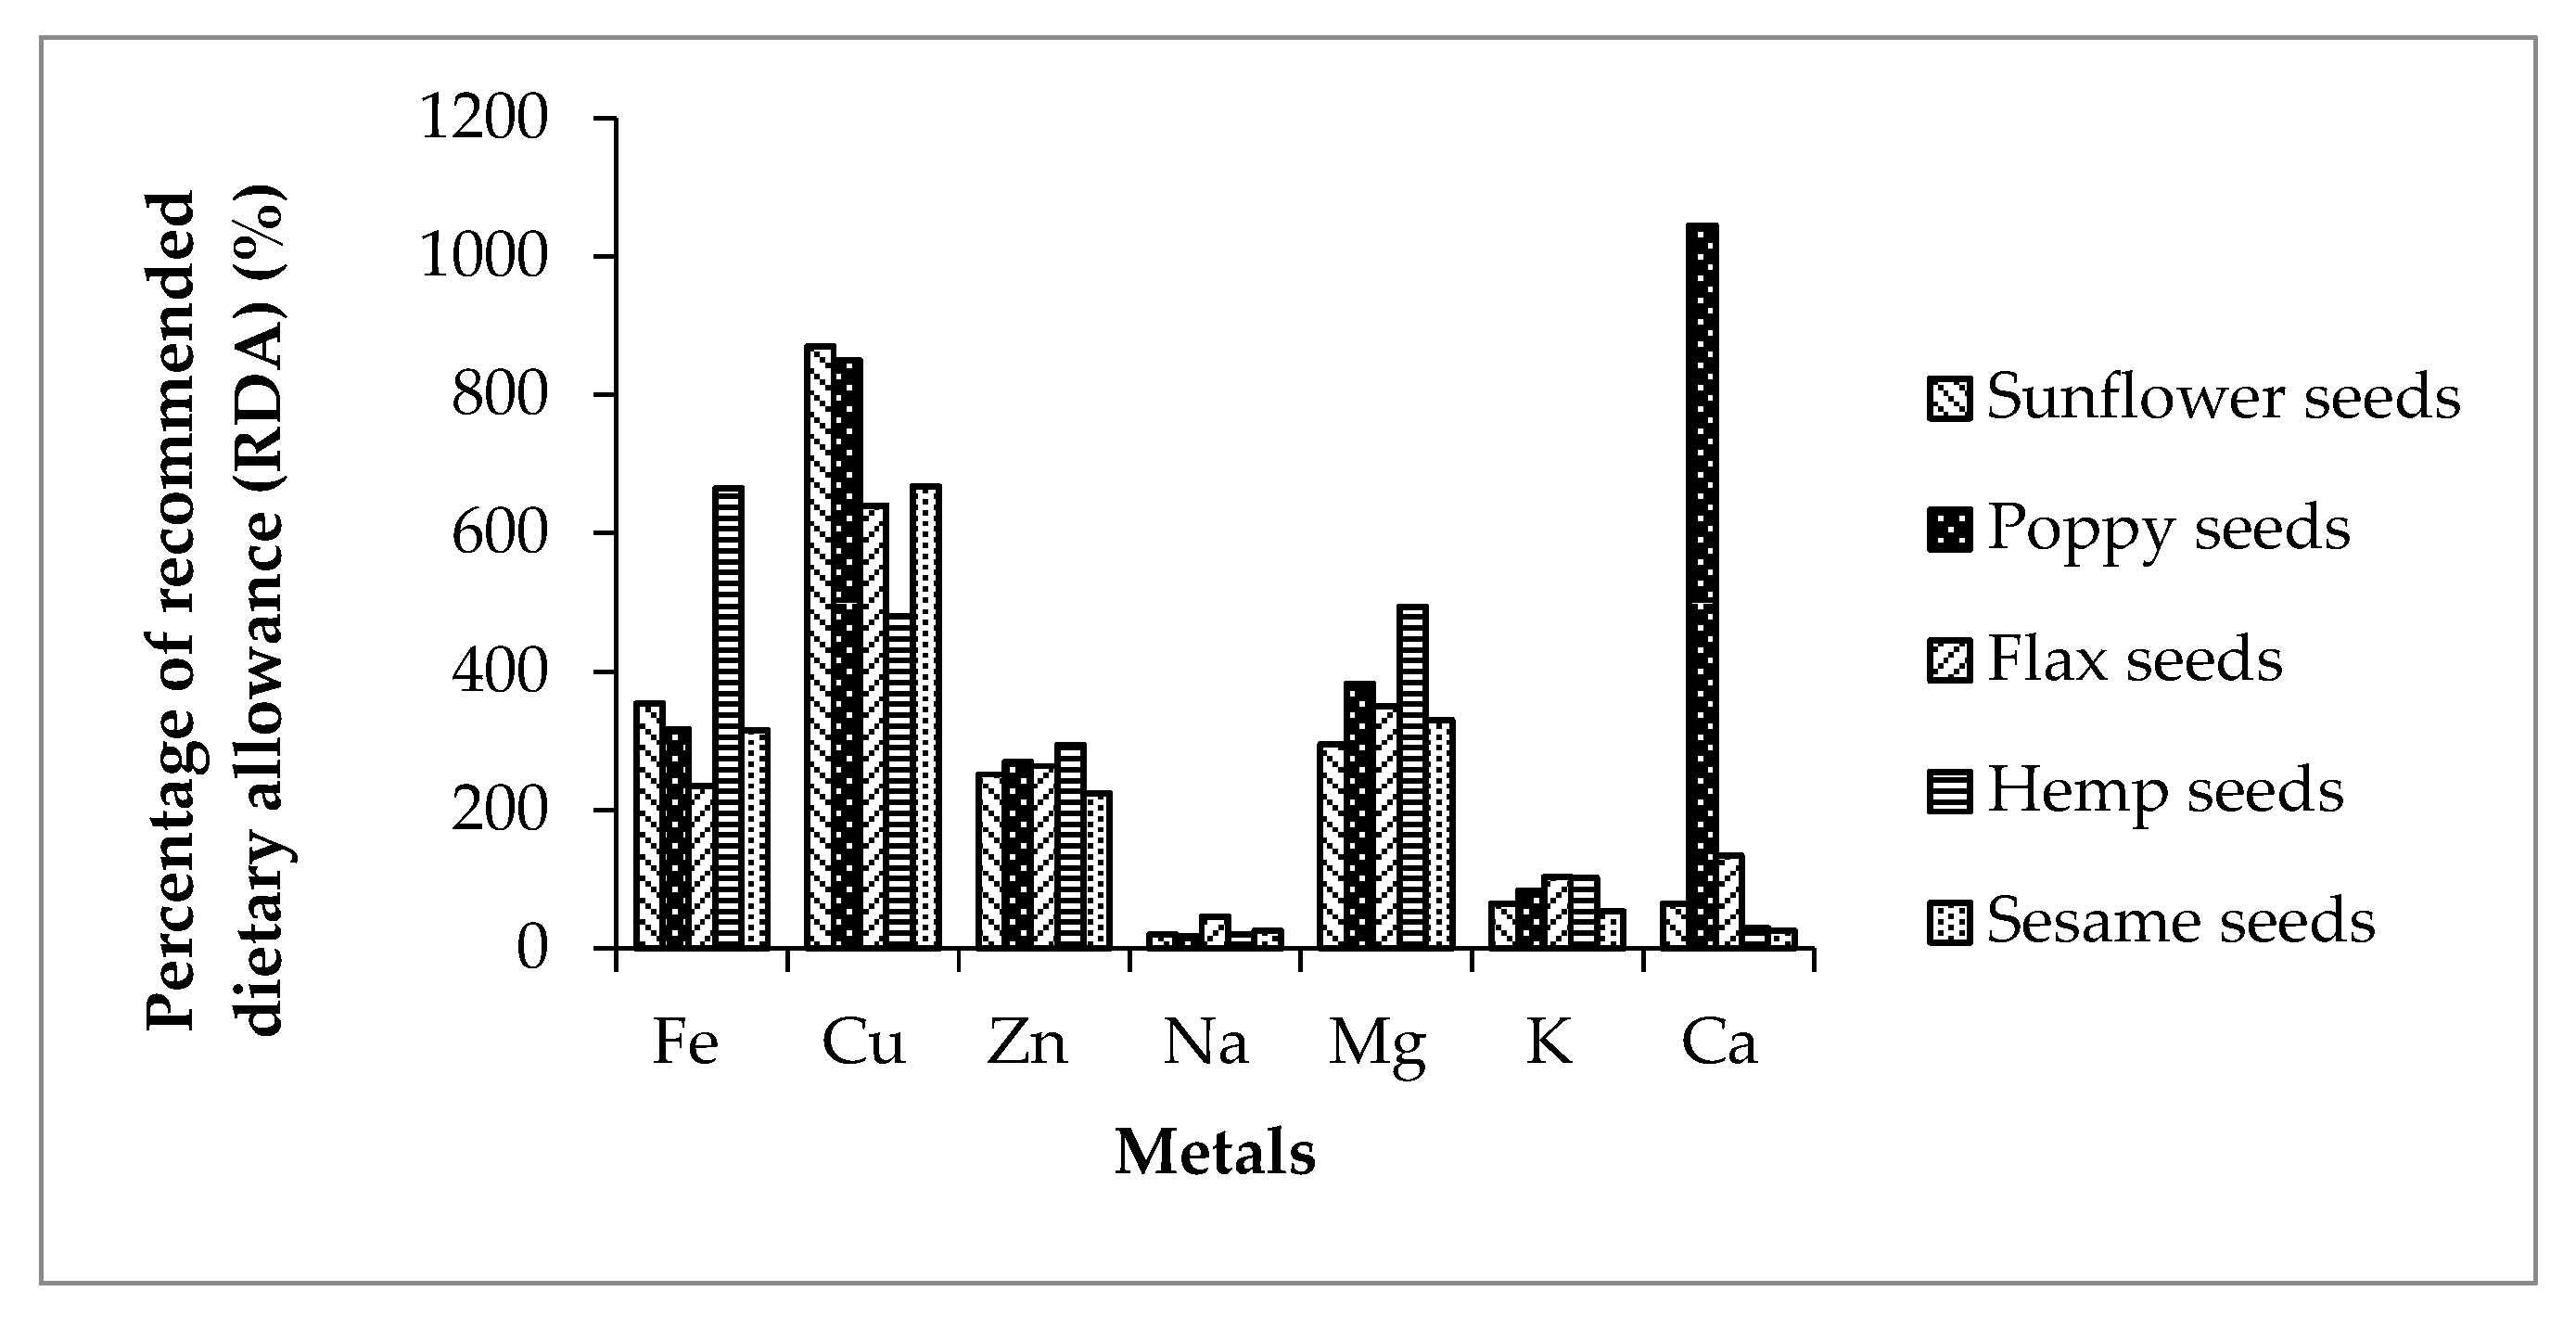
3.3. Minerals, Protein Content and Antioxidant Capacity

The minerals contribute to metabolism of FAs and protein metabolism [36]. The content of minerals, protein and antioxidant capacity is presented in Table 3.
The analyzed seeds are rich in mineral elements (Na, K, Ca and Mg). High amounts of K and Mg were found in all food seeds, but hempseed contained the highest amount. The mineral content varied in the following ranges (mg/kg): 425-1090 (Na), 1823-3509 (K), 644-10445 (Ca) and 1180-1975 (Mg). Food with high amounts of K and low contents of Na is recommended for hyperglycemic patients [35]. The highest Ca content was found for poppy seeds (10445.0 ± 1.98 mg/kg). The analyzed samples also contained Al, Cu, Fe and Zn (important for various functions in the body, such as immunity, growth and cognitive development [36]), their content varying in the ranges (mg/kg) of: 8.30–38.2 (Al), 9.60–17.4 (Cu), 35.3–99.7 (Cu) and 33.7–44.2 (Zn) [37]. The highest contents were found in hempseed (99.7 ± 0.35mg/kg and 44.2 ± 0.44 mg/kg) for Fe and Zn, sunflower seeds (17.4 mg/kg) for Cu and poppy seeds (38.2 mg/kg) for Al. Our results were comparable with Adjepong et al. [21].
The reference daily intakes (RDI) established by Food and Drug Administration (FDA) regulations are Ca (1000 mg), Na (2400 mg), Fe (15 mg), Cu (2 mg), K (3500 mg), Mg (400 mg), Mn (2 mg), and Zn (15 mg) [23]. The studied samples contain appropriate amounts of minerals to achieve an adequate diet. The content of minerals in seed samples reported to daily reference value for each mineral is presented in Figure 4.
All samples contain more than 20% protein. Hemp seeds have the highest protein content (36.6% ± 0.26%) and an appreciable amount was found in sesame seeds (28.2% ± 0.63%). The antioxidant activity of the studied food seeds was evaluated using (1) Photochem device and lipid soluble compounds kit supplied by Analytik Jena AG. The Photochem is a unique system than can quantify the antioxidant activities of lipid soluble substances and the results obtained were expressed as Trolox equivalent and (2) DPPH radical scavenging activity of oil. The antioxidant activity (µmol Trolox/mg sample) of samples varied in the following order: sunflower (0.45 ± 0.03) > flax (0.21 ± 0.04) > sesame (0.08 ± 0.04) > poppy (0.05 ± 0.03) > hemp (0.03 ± 0.02). The lowest antioxidant activities were obtained for hemp seeds; similar results were obtained by Frassineti et al. [38], which obtained the highest antioxidant capacity in young sprouts compared with seeds, because during germination phenolic acids, flavonoids and vitamins content increases. Sunflower seeds exhibited the highest antioxidant activity; similar results were reported by Pająk et al. [39]. Mohammed et al. [7] reported that the oxidative stability of sesame oil is superior compared with other vegetable oils due to its high content of unsaturated FAs, and the FAs (myristic acid and linoleate) were identified as the major antioxidants responsible for reduction of oxidative rancidity.

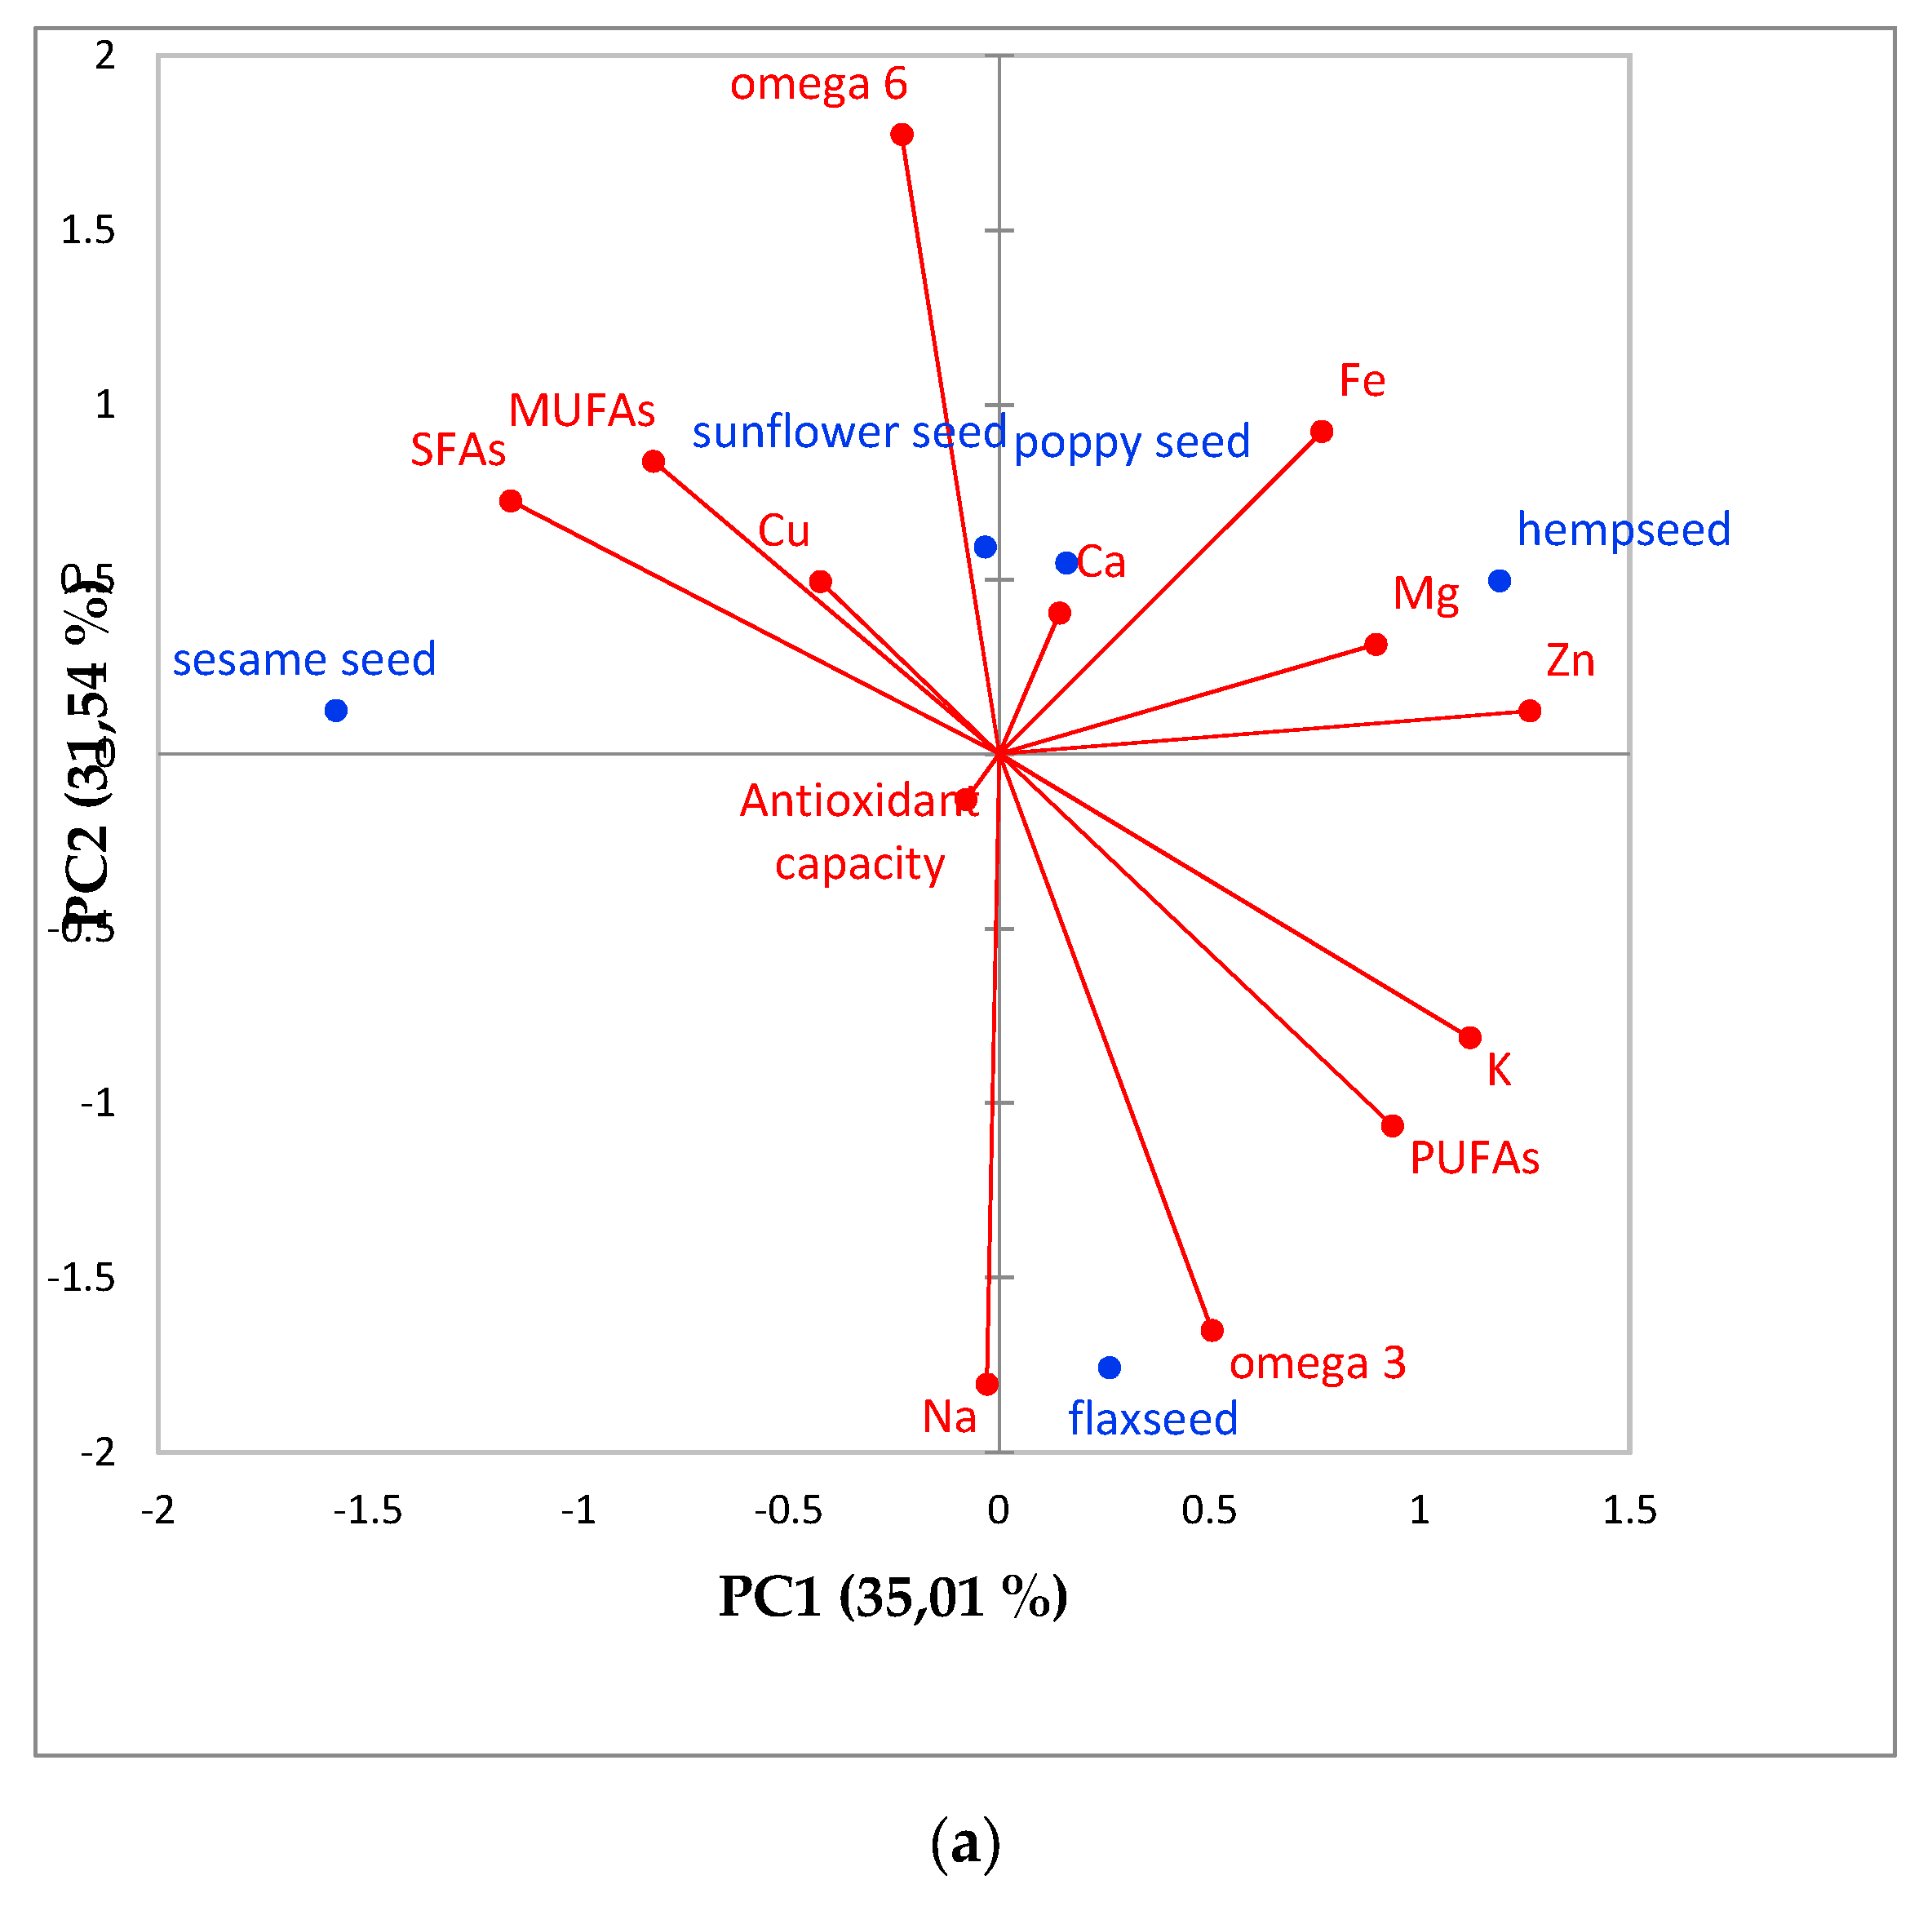
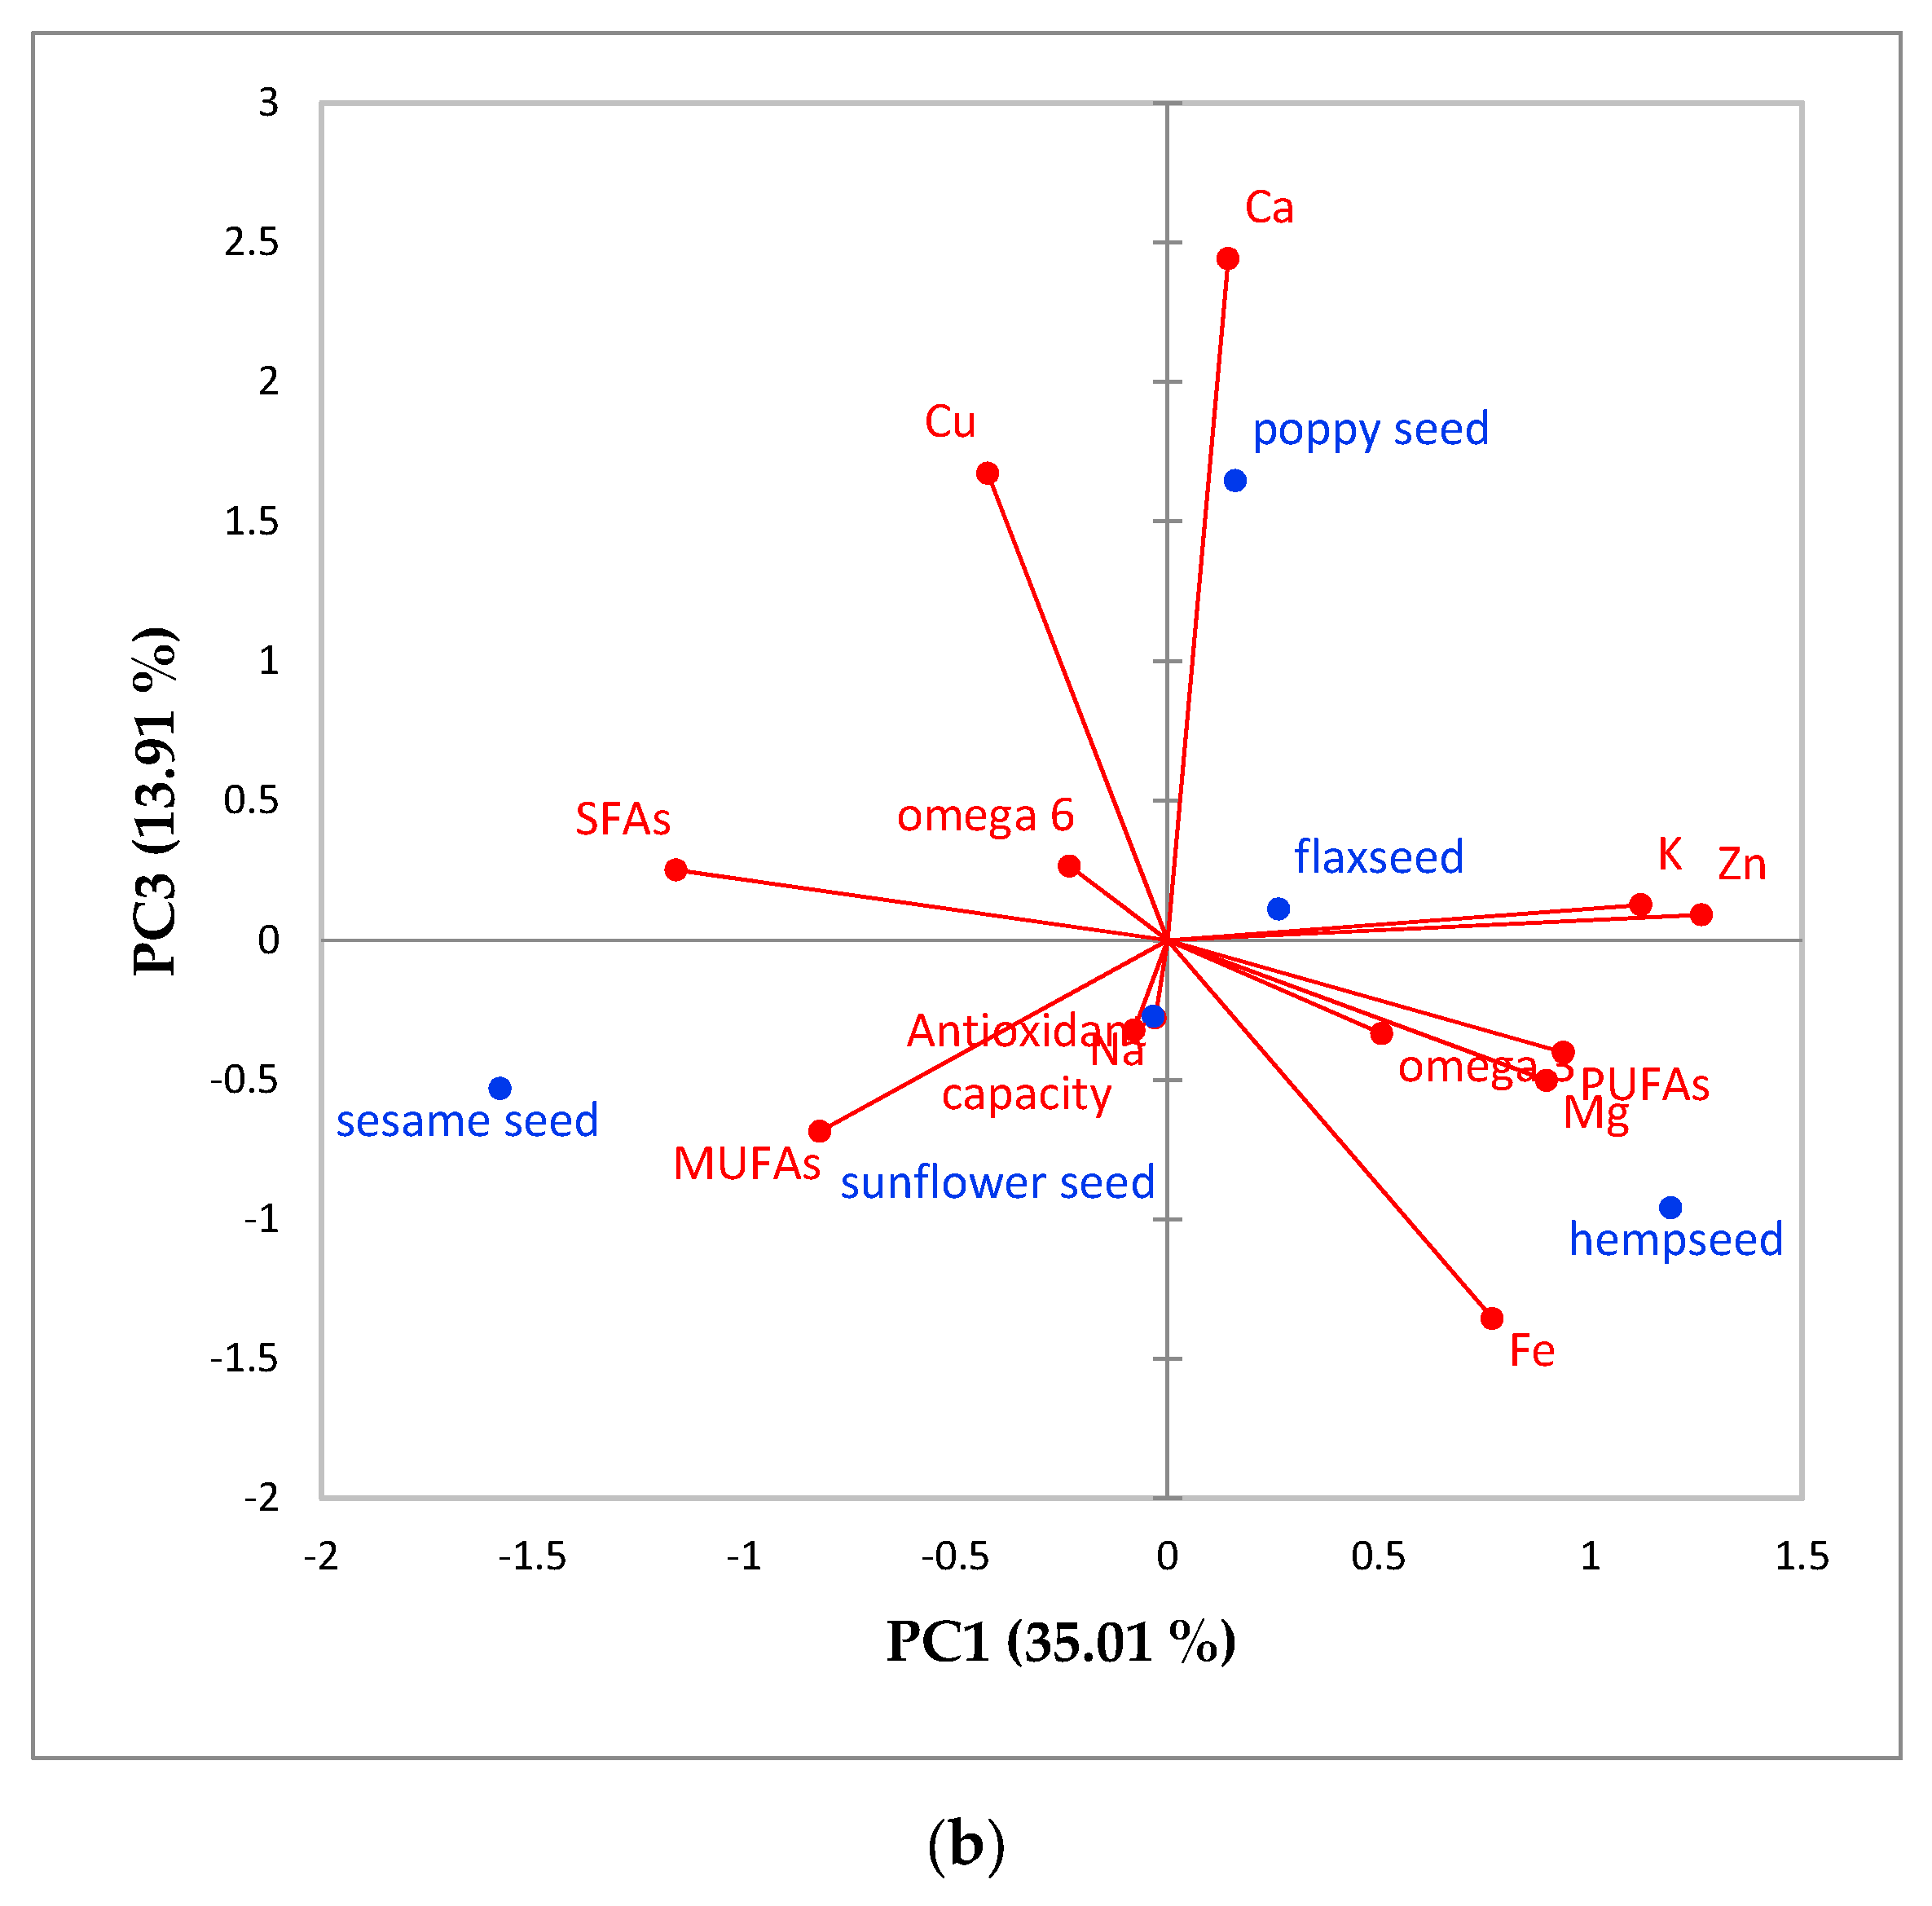
3.4. Results Characterization Using Principal Component Analysis

Multivariate statistics can be used to reveal relationships between different parameters of a dataset [40,41].
The varimax rotated factor loadings of principal components (PCs) for the different seed physicochemical properties are presented in Table 4. The loadings in bold face correspond to variables with dominant influences on the selected latent factor. Three PCs with Eigenvalues higher than 2, explains about 77.0% of the total variance of the system. The first component (PC1) reveals 51% of the total variance with positive loadings on PUFAs, Mg, K, Fe and Zn, which are negative correlated with SFAs and MUFAs. This factor indicates the strong association of metals such as Mg, K, Fe and Zn and PUFAs.
The second component (PC2) explaining 26.0% of the total variability contains omega-6 and Fe, negatively correlated with omega-3 and Na.
In Figure 5 is presented the projection of components 1 and 2, and the projection of components 1 and 3, also taking into account the type of oilseed samples.
As presented in Figure 5, similitudes were found between sesame seeds and sunflower seeds due to the contents of MUFAS, SFAs, Cu and antioxidant capacity. Similarities were also found between poppy and hempseeds, mainly due to the content of Ca, Mg, Fe and Zn, while flaxseed is different due to its content of omega-3, PUFAs and K.
To our knowledge, no complete characterization of local seeds (Cluj-Napoca city, Romania) and oil in terms of FAs content, minerals, antioxidant activity, and protein has been carried-out. Our research suggests that flaxseed and hempseed can be successfully used as source of omega 3, in order to increase the dietary essential FAs and reduce health risks, as well as micronutrient deficiencies.

4. Conclusions

Ten samples of each seed type (sunflower, poppy, hemp, flax and sesame) were analyzed in order to determine the content of SFAs, MUFAs and PUFAs regarding FAs content from lipids; the mineral, protein content and antioxidant capacity were also determined. Low amounts of stearic and palmitic acids (SFAs) were determined in the analyzed samples. The main FA found in poppy (67.2% ± 0.80%), sunflower (61.0% ± 0.70%), sesame (60.2% ± 0.50%) and hemp (55.9% ± 0.30%) seed oils was linoleic acid. Due to its high content of two essential PUFAs (linoleic acid and linolenic acid 3:1), hemp seeds can be used as functional ingredients in the food industry. The main FA identified in flaxseed oil (73.2% ± 0.40%) was α-linolenic (C18:3, n-3) acid. In addition, in all the analyzed samples, PUFAs were found in high amounts. A high amount of omega-3 (ω-3) FAs was found in flaxseed oil and a small amount in hempseed oil. All studied seeds are rich in minerals (Na, K, Ca and Mg), which are co-factors for FAs and protein metabolism. The obtained results add valuable information to the knowledge on the chemical compositions of food seeds and will be useful and of interest in nutrition.

Author Contributions

L.S. conceived and designed the experiments, O.C. performed minerals and protein analysis, E.N. performed oil extraction, M.H.K. performed fatty acids analysis, A.B. performed antioxidant capacity and M.S. wrote the paper. All authors have read and agreed to the published version of the manuscript.

Funding

This research was funded by Competitiveness Operational Programme of the Ministry of European Funds, Contract No. 7/01.09.2016, code MY SMIS 105654 and the article processing charge (APC) was funded by Romanian Research and Innovation Ministry under PROINSTITUTIO project, Contract no. 19PFE/17.10.2018.

Conflicts of Interest

The authors declare no conflict of interest. The funders had no role in the design of the study; in the collection, analyses, or interpretation of data; in the writing of the manuscript, or in the decision to publish the results.

References

  1. Petrović, M.; Kezić, N.; Bolanća, V. Optimization of the GC method for routine analysis of the fatty acid profile in several food samples. Food Chem. 2010, 122, 285–291. [Google Scholar] [CrossRef]
  2. Labdeli, A.; Zemour, K.; Simon, V.; Adda, A.; Merah, O. Pistacoa Atlantica Desf., a source of healthy vegetable oil. Appl. Sci. 2019, 9, 2552. [Google Scholar] [CrossRef] [Green Version]
  3. McClements, D.J. The biophysics of digestion: Lipids. Curr. Opin. Food Sci. 2018, 21, 1–6. [Google Scholar] [CrossRef]
  4. Béligon, V.; Christophe, G.; Fontanille, P.; Larroche, C. Microbial lipids as potential source to food supplements. Curr. Opin. Food Sci. 2016, 7, 35–42. [Google Scholar] [CrossRef]
  5. Kozlowska, M.; Gruczyńska, E.; Ścibisz, I.; Rudzińska, M. Fatty acids and sterols composition, and antioxidant activity of oils extracted from plant seed. Food Chem. 2016, 213, 450–456. [Google Scholar] [CrossRef]
  6. Orsavova, J.; Misurcova, L.; Ambrozova, J.V.; Vicha, R.; Mlcek, J. Fatty acids composition of vegetable oils and its contribution to dietary energy intake and dependence of cardiovascular mortality on dietary intake of fatty acids. Int. J. Mol. Sci. 2015, 16, 12871–12890. [Google Scholar] [CrossRef]
  7. Mohammed, F.; Abdulwali, G.D.; Tenyang, N.; Ponka, R.; Al-Gadabi, K.; Bchitou, R.; Abdullah, A.H.; Naji, K.M. Chemical composition and mineralogical residence of sesame oil from plants grown in different Yemeni environments. Microchem. J. 2018, 140, 269–277. [Google Scholar] [CrossRef]
  8. Youzbachi, N.; Elfalleh, W.; Khaldi, A.; Nasri, N.; Tlili, N. Fatty acids and triacylglycerols composition from Tunisian Acacia species seeds oil. Arab. J. Chem. 2019, 12, 3302–3308. [Google Scholar] [CrossRef] [Green Version]
  9. Bystrická, Z.; Ďuračková, Z. Gas chromatography determination of fatty acids in the human erythrocyte membranes—A review. Prostaglandins Leukotr. Essent. Fatty Acids 2016, 115, 35–40. [Google Scholar] [CrossRef] [PubMed]
  10. Mori, T.A. Marine omega-3 fatty acids in the prevention of cardiovascular disease. Fitoterapia 2017, 123, 51–58. [Google Scholar] [CrossRef] [PubMed]
  11. Lachman, J.; Hejtmánková, A.; Kotíková, Z.; Pivec, V.; Střalková, R.; Vollmannová, A.; Bojňanská, T.; Dědina, M. Evaluation of oil content and fatty acid composition in the seeds of grapevine varieties. LWT Food Sci. Technol. 2015, 63, 620–625. [Google Scholar] [CrossRef]
  12. Montserrat-de la Paz, S.; Marín-Aguilar, F.; Gimenez, D.G.; Fernandez-Arche, M.A. Hemp (Cannabis sativa L.) seeds oil: Analytical and phytochemical characterization of unsaponifiable fraction. J. Agric. Food Chem. 2014, 62, 1105–1110. [Google Scholar] [CrossRef] [PubMed]
  13. Rutusz, K.; Symoniuk, E.; Wroniak, M.; Rudzinska, M. Bioactive compounds, nutritional quality and oxidative stability of cold-pressed Camelina (Camelina sativa L.) oils. Appl. Sci. 2018, 8, 2606. [Google Scholar] [CrossRef] [Green Version]
  14. Sun, X.; Zhang, L.; Li, P.; Xu, B.; Ma, F.; Zhang, W. Fatty acid profiles based adulteration detection for flaxseed oil by gas chromatography mass spectrometry. Food Sci. Technol. 2015, 63, 430–436. [Google Scholar] [CrossRef]
  15. Quehenberger, O.; Armando, A.M.; Dennis, E.A. High sensitivity quantitative lipidomics analysis of fatty acids in biological samples by gas chromatography-mass spectrometry. Biochim Biophys. Acta 2011, 1811, 648–656. [Google Scholar] [CrossRef] [Green Version]
  16. Sousa, J.L.C.; Ramos, P.A.B.; Freire, C.S.R.; Silva, A.M.S.; Silvestre, A.J.D. Chemical composition of lipophilic bark extracts from Pinus pinaster and Pinus pinea cultivated Portugal. Appl. Sci. 2018, 8, 2575. [Google Scholar] [CrossRef] [Green Version]
  17. Xiao, L.; Mjøs, S.A.; Haugsgjerd, B.O. Efficiencies of three common lipid extraction methods evaluated by calculating mass balances of the fatty acids. J. Food Compos. Anal. 2012, 25, 198–207. [Google Scholar] [CrossRef]
  18. Nielsen, S. Food Analysis, 3rd ed.; Springer Science & Business Media, Kluwer Academic: New York, NY, USA, 2003; Volume 10, ISBN 978-0306481758. [Google Scholar]
  19. Teymouri, A.; Adams, K.J.; Dong, T.; Kumar, S. Evaluation of lipid extractability after flash hydrolysis of algae. Fuel 2018, 224, 23–31. [Google Scholar] [CrossRef]
  20. Cadar, O.; Miclean, M.; Cadar, S.; Tanaselia, C.; Senila, L.; Senila, M. Assessment of heavy metals in cows milk in Rodnei mountains area, Romania. Environ. Eng. Manag. J. 2015, 14, 2523–2528. [Google Scholar] [CrossRef]
  21. Adjepong, M.; Valentini, K.; Pickens, C.A.; Li, W.; Appaw, W.; Fenton, J. Quantification of fatty acid and mineral levels of selected seeds, nuts, and oils in Ghana. J. Food Compos. Anal. 2017, 59, 43–49. [Google Scholar] [CrossRef]
  22. Boffito, D.C.; Pirola, C.; Galli, F.; Michele, A.D.; Bianchi, C.L. Free fatty acids esterification of waste cooking oil and its mixtures with rapeseed oil and diesel. Fuel 2013, 108, 612–619. [Google Scholar] [CrossRef]
  23. Naozuka, J.; Vieira, E.C.; Nascimento, A.N.; Oliveira, P.V. Elemental analysis of nuts and seeds by axially viewed ICP OES. Food Chem. 2011, 124, 1667–1672. [Google Scholar] [CrossRef]
  24. Tang, Y.; Li, X.; Chen, P.X.; Zhang, B.; Hernandez, M.; Zhang, H.; Marcone, M.F.; Liu, R.; Tsao, R. Characterization of fatty acids, carotenoid, tocopherol/tocotrienol composition and antioxidant activities in seeds of three Chenopodium quinoa Willd. Genotypes. Food Chem. 2015, 174, 502–508. [Google Scholar] [CrossRef] [PubMed]
  25. Chouaibi, M.; Rezig, L.; Hamdi, S.; Ferrari, G. Chemical characteristics and compositions of red pepper seed oil extracted by different methods. Ind. Crop Prod. 2019, 128, 363–370. [Google Scholar] [CrossRef]
  26. Kostić, M.D.; Joković, N.M.; Stamenković, O.S.; Rajković, K.M.; Milić, P.S.; Veljković, V.B. Optimization of hempseed oil extraction by h-hexane. Ind. Crop Prod. 2013, 48, 133–143. [Google Scholar] [CrossRef]
  27. Bratfalean, D.; Cristea, V.M.; Agachi, P.S.; Irimie, D.F. Improvement of sunflower oil extraction by modelling and simulation. Rev. Roum. Chim. 2008, 53, 881–888. [Google Scholar]
  28. Rashid, U.; Ibrahim, M.; Nehdi, A.I.; IbrahimAl-Resayes, S.; Ullah, S.; Mehmood, M.A.; Shahzadi, S. Synthesis and characterization of poppy seeds oil methyl esters. Chin. J. Chem. Eng. 2016, 24, 1087–1096. [Google Scholar] [CrossRef]
  29. Zanqui, A.B.; Rodrigues de Morais, D.; Marques da Silva, C.; Santos, J.M.; Gomes, S.T.; Visentainer, J.V.; Eberlin, M.N.; Cardozo-Filho, L.; Matsushita, M. Subcritical extraction of flaxseed oil with n-propane: Composition and purity. Food Chem. 2015, 188, 452–458. [Google Scholar] [CrossRef] [Green Version]
  30. Junpeng, Y.; Qi, Z.; Xin, L.; Xinsheng, W.; Bing, L.; Wenxue, Z. Steam explosion technology based for oil extraction from sesame (Sesamum indicum L.) seeds. J Saudi Soc. Agric. Sci. 2016. [Google Scholar] [CrossRef]
  31. Chung, I.; Kim, J.-K.; Park, I.; Oh, J.-Y.; Kim, S.-H. Effects of milk type, production month, and brand on fatty acid composition: A case study in Korea. Food Chem. 2016, 196, 138–147. [Google Scholar] [CrossRef]
  32. Siri-Tarino, P.W.; Sun, Q.; Hu, F.B.; Krauss, R.M. Saturated fat, carbohydrate, and cardiovascular disease. Am. J. Clin. Nutr. 2010, 91, 502–509. [Google Scholar] [CrossRef] [PubMed] [Green Version]
  33. Salimon, J.; Omar, T.A.; Salih, N. An accurate and reliable method for identification and quantification of fatty acids and trans fatty acids in food fats samples using gas chromatography. Arab. J. Chem. 2017, 10, S1875–S1882. [Google Scholar] [CrossRef] [Green Version]
  34. Lu, J.; Wang, P.; Ke, Z.; Liu, X.; Kang, Q.; Hao, L. Effect of metal ions on the enzymatic hydrolysis of hemp seeds oil by lipase Candida sp. Int. J. Biol. Macromol. 2018, 114, 922–928. [Google Scholar] [CrossRef] [PubMed]
  35. Punia, S.; Sandhu, K.S.; Siroho, A.K.; Dhull, S.B. Omega 3-metabolism, absorption, bioavailability and health benefits—A review. Pharma Nutr. 2019, 10, 100162. [Google Scholar] [CrossRef]
  36. Todea, D.; Cadar, O.; Simedru, D.; Roman, C.; Tanaselia, C.; Suatean, I.; Naghiu, A. Determination of major- -to-trace minerals and polyphenols in different apple cultivars. Not. Bot. Horti. Agrobo. 2014, 42, 523–529. [Google Scholar] [CrossRef] [Green Version]
  37. Danhassan, M.S.; Salihu, A.; Inuwa, H.M. Effect of boiling on protein, mineral, dietary fibre and antinutrient compositions of Nymphaea lotus (Linn) seeds. J. Food Compos. Anal. 2018, 67, 184–190. [Google Scholar] [CrossRef]
  38. Frassinetti, S.; Moccia, E.; Caltavuturo, L.; Gabriele, M.; Longo, V.; Bellani, L.; Giorgi, G.; Giorgetti, L. Nutraceutical potential of hemp (Cannabis sativa L.) seeds and sprouts. Food Chem. 2018, 262, 56–66. [Google Scholar] [CrossRef]
  39. Pająk, P.; Socha, R.; Gałkowska, D.; Rožnowski, J.; Fortuna, T. Phenolic profile and antioxidant activivity in selected seeds and sprouts. Food Chem. 2014, 143, 300–306. [Google Scholar] [CrossRef]
  40. Levei, E.; Ponta, M.; Senila, M.; Miclean, M.; Frentiu, T. Assessment of contamination and origin of metals in mining affected river sediments: A case study of the Aries River catchment, Romania. J. Serb. Chem. Soc. 2014, 79, 1019–1036. [Google Scholar] [CrossRef]
  41. Senila, M.; Levei, E.A.; Senila, L.R.; Oprea, G.M.; Roman, C.M. Mercury in soil and perennial plants in a mining-affected urban area from Northwestern Romania. J. Environ. Sci. Health. Part. A 2012, 47, 614–621. [Google Scholar] [CrossRef]
Figure 1. Of (A) the 37 components fatty acid methyl esters (FAME) standard mixture; (B) hemp seeds oil sample.
Applsci 10 01589 g001
Figure 2. The content of SFAs, MUFAs and PUFAs and PUFAs/SFAs ratio in the analyzed oilseed samples.
Applsci 10 01589 g002
Figure 3. Of PUFAs, omega-6 and omega-3 in the extracted oilseeds.
Applsci 10 01589 g003
Figure 4. Content of minerals in seed samples reported to daily reference value for each mineral.
Applsci 10 01589 g004
Figure 5. Component analysis. (a) Projection of components 1 and 2, and (b) projection of components 1 and 3.
Applsci 10 01589 g005aApplsci 10 01589 g005b
Table 1. A comparison between the obtained lipid yield and those reported in other studies.
SampleLipid Yield (%)
(This Work)*
Lipid Yield (%)
(Related Studies)
Extraction MethodReference
Hemp seed30.8 ± 0.2129.6extraction with n-hexane[26]
Sunflower seed54.1 ± 0.5049.1extraction with petroleum ether in Soxhlet apparatus[27]
Poppy seed38.2 ± 0.3146.8cold press extraction[28]
Flax seed31.2 ± 0.2035.0extraction with choloroform:methanol (2:1(v/v))[29]
41.0supercritical extraction with n-propane
Sesame seed40.0 ± 0.4041.6extraction with petroleum ether in Soxhlet apparatus[30]
* Data represents mean ± standard deviation SD, n = 10.
Table 2. Fatty acids (FAs), saturated fatty acids (SFAs), monounsaturated fatty acids (MUFAs), polyunsaturated fatty acids (PUFAs) and PUFAs/SFAs ratio in the analyzed oilseed samples.
Fatty AcidSunflower Seed OilReference [6]Poppy Seed OilReference
[28]
Flaxseed OilReference [14]Hempseed OilReference [12]Sesame Seed OilReference
[30]
C8:00.21 ± 0.01ndndnd0.46 ± 0.04ndndndndnd
C10:0ndndndndndndndndndnd
C12:0nd0.02ndndnd0.00350.001 ± 0.01ndndnd
C14:00.05 ± 0.020.090.04 ± 0.02nd0.02 ± 0.010.03320.017 ± 0.01nd0.01 ± 0.010.04
C14:1ndndndndndndndndndnd
C16:03.94 ± 0.026.27.79 ± 0.078.992.51 ± 0.076.123.17 ± 0.055.626.57 ± 0.0414.2
C16:1(n-7)0.90 ± 0.010.121.47 ± 0.02nd0.41 ± 0.010.030.55 ± 0.020.310.91 ± 0.010.31
C18:02.17 ± 0.012.81.59 ± 0.082.151.93 ± 0.064.111.49 ± 0.032.683.89 ± 0.027.35
C18:1 (cis+trans) (n-9)26.0 ± 0.5028.08.34 ± 0.0913.75.28 ± 0.0915.45.75 ± 0.0811.9021.5 ± 0.6034.4
C18:2(cis+trans) (n-6)61.0 ± 0.7062.267.2 ± 0.8074.111.6 ± 0.2013.655.9 ± 0.3055.160.2 ± 0.5040.8
C18:3 (n-6)0.20 ± 0.02nd0.04 ± 0.01nd0.005 ± 0.010.180.58 ± 0.02nd0.02 ± 0.01nd
C18:3 (n-3)0.21 ± 0.020.160.77 ± 0.021.073.2 ± 0.4059.426.5 ± 0.3016.70.91 ± 0.02nd
C20:00.29 ± 0.030.210.17 ± 0.05nd0.11 ± 0.010.140.63 ± 0.032.500.71 ± 0.061.02
C20:1 (n-9)1.60 ± 0.040.180.45 ± 0.03nd0.59 ± 0.020.0961.99 ± 0.021.441.45 ± 0.020.47
C20:4 (n-6)ndndndndndndndndndnd
C20:5 (n-3)0.09 ± 0.01ndndndndndndnd0.05 ± 0.01nd
C22:0ndndndndndndnd0.40nd0.26
C22:1 (n-9)0.22 ± 0.02ndndndnd0.026ndnd0.14 ± 0.01nd
C23:01.67 ± 0.02ndndndnd0.00810.17 ± 0.02nd2.86 ± 0.03nd
C24:0ndnd0.003 ± 0.01ndnd0.04180.008 ± 0.02ndnd0.11
C24:1 (n-9)+
C22:6 (n-3)
0.03 ± 0.01nd0.08 ± 0.01ndndndndndndnd
SFAs8.33 ± 0.029.49.59 ± 0.0411.145.03 ± 0.0510.55.48 ± 0.0811.2014.0 ± 0.0725.7
MUFAs28.7 ± 0.0828.310.3 ± 0.0913.706.28 ± 0.0815.68.29 ± 0.0713.3424.0 ± 0.0535.2
PUFAs61.5 ± 0.0862.467.9 ± 0.1075.1384.8 ± 0.0873.282.9 ± 0.0975.4661.2 ± 0.0740.82
PUFAs/SFAs ratio7.4 ± 0.046.637.1 ± 0.016.7416.9 ± 0.027.0015.1 ± 0.096.74.4 ± 0.071.58
Data are expressed as percentage of total FAMEs and represents mean ± standard deviation (n = 3); nd—the FA was not determined
Table 3. Minerals, protein content and antioxidant capacity of food seeds (data represents mean ± standard deviation, n = 3).
ComponentSunflower SeedPoppy SeedFlaxseedHempseedSesame Seed
Mg (mg/kg)1180.0 ± 1.151528.0 ± 1.251403.0 ±1.521975.0 ± 1.201320.0 ± 1.20
K (mg/kg)2270.0 ± 0.572833.0 ± 1.053509.0 ± 1.503479.0 ± 1.021823.0 ± 1.31
Ca (mg/kg)644.0 ± 1.010445.0 ± 1.981337.0 ± 1.0298.0 ± 0.89257.0 ± 0.75
Na (mg/kg)485.0 ± 1.00425.0 ± 1.021090.0 ± 1.21505.0 ± 0.85610.0 ± 0.95
Fe (mg/kg)53.1 ± 0.8947.6 ± 0.6735.3 ± 0.2099.7 ± 0.3547.3 ± 0.63
Zn (mg/kg)37.7 ± 0.4440.4 ± 0.2039.5 ± 0.3044.2 ± 0.2033.7 ± 0.51
Cu (mg/kg)17.4 ± 0.5417.0 ± 0.2912.8 ± 0.129.60 ± 0.1213.4 ± 0.11
Al (mg/kg)8.30 ± 0.2038.2 ± 0.808.40 ± 0.1510.1 ± 0.5613.1 ± 0.42
Protein (%)22.0 ± 0.4023.7 ± 0.5026.6 ± 0.8036.6 ± 0.2628.2 ± 0.63
Antioxidant capacity (µmol Trolox/mg sample)0.45 ± 0.030.05 ± 0.030.21 ± 0.040.03 ± 0.020.08 ± 0.04
DPPH (µmol Trolox/mg sample)0.47 ± 0.020.06 ± 0.030.25 ± 0.020.04 ± 0.030.09 ± 0.03
Table 4. Rotated factor loadings of experimental variables of significant principal components (PCs).
VariablePC1PC2
Eigenvalue6.63.4
Variability (%)51.026.0
Cumulative51.077.0
Factor loadings after varimax rotation
SFAs−0.8960.398
MUFAs−0.6340.461
PUFAs0.721−0.586
Antioxidant capacity−0.061−0.072
Mg0.6910.172
K0.863−0.447
Ca0.1100.222
Na−0.023−0.994
Fe0.5910.508
Zn0.9730.067
Cu−0.3280.271
Omega-6−0.1790.976
Omega-30.390−0.909

