Article

Groove Formation in Glass Substrate by a UV Nanosecond Laser

Department of Mechanical and Automotive Engineering, Kongju National University, 1223-24 Cheonandaero, Seobuk-gu, Cheonan 31080, Korea
*
Author to whom correspondence should be addressed.
Appl. Sci. 2020, 10(3), 987; https://doi.org/10.3390/app10030987
Submission received: 12 January 2020 / Revised: 28 January 2020 / Accepted: 28 January 2020 / Published: 3 February 2020
(This article belongs to the Special Issue Laser Manufacturing of Advanced Materials)

Abstract

:

Featured Application

display and biomedical engineering.

Abstract

This study reports the laser grooving of glass. In this study, an ultraviolet (UV) nanosecond laser is used to produce grooves in soda lime glass by varying laser power, scan speed, pulse repetition rate, and number of scans. The threshold power density to generate damage on glass surface is found to be ~6.37 × 10⁸ W/cm2. According to the result of a single laser scan, at a high laser power and low scan speed, material removal does not nearly occur, and only volume melting underneath the glass surface and large thermal crack are induced. With the decreasing laser power and increasing scan speed, a groove with a smooth surface is formed owing to the melting-dominant material removal process. The groove of rough surface morphology is produced with the further increase of the scan speed due to shattering induced by shock wave. Under this condition, it is found that either small cracks are produced or a crack-free groove is obtained. In this study, the fabrication of the microchannel for bio-chip application is also attempted by multiple laser scans. The near rectangular-shaped and crack-free groove (width × depth: ~220 μm × ~500 μm) with quite a smooth surface is fabricated by the multiple laser scans with a non-zero scan spacing.

1. Introduction

The importance of glass as an engineering material is found in various fields of the industry. The high optical transparency and excellent dielectric property of the glass make it a suitable material for many optical and electrical applications. In addition, it has been widely used in biomedical areas owing to good chemical and thermal stability.
Commonly, the processing techniques (diamond [1], roll [2], and wheel cutting [3]) using a physical contact of tool bits were used to machine glass materials. However, these conventional methods generally produce random cracking and rough-cut surfaces in material. Moreover, the precision machining of the glass with these methods is very difficult.
A laser technique is greatly attractive in the processing of brittle glass materials because of its non-contact nature [4]. It can also provide a precise and clean process in a fast and automated way. Over the past several decades, many researchers have studied laser-based glass processing. In the early days, a CO2 laser attracted great attention in the glass cutting process because the absorption rate of the CO2 laser beam with 10.6 μm wavelength is very high in glass materials. However, in most cases, glass processing by the CO2 laser beam involves a large thermal effect that induces various defects such as cracking, chipping, and heat affected zone (HAZ) [5,6,7,8]. This may require extra time and cost for cleaning and polishing of the cut-surface after the processing.
The advent of ultra-short pulse lasers brings diverse applications to the area of glass processing [9,10,11,12,13,14]. The pulse width of an ultra-short pulse laser ranges from picoseconds to femtoseconds. This enables the ultra-short pulse process to have an extremely short characteristic time scale compared with that for thermal diffusion, generally shown in a relatively long pulse or continuous wave (CW) laser process. Therefore, in the case of the ultra-short pulse process, the thermal effect can be minimized. In addition, the interaction between the high intensity beam of the ultra-short pulse laser and material usually induces multi-photon absorption and the avalanche ionization process [15,16], which can enhance the absorption rate of the laser beam in glass materials. Because of these merits, the usage of the ultra-short pulse laser in glass processing is increasingly expanding. However, the cost per output power for the ultra-short pulse laser is still expensive.
An ultraviolet (UV) laser, which has relatively high price competitiveness, may be adoptable in some applications of glass processing instead of the ultra-short pulse laser. The UV laser beam with a photon of high energy has a similar absorption mechanism to an ultra-short pulse laser. Moreover, it can also reduce thermal effects, with the pulsed mode generating a high peak power. Glass cutting with a UV laser was reported previously [17]. The UV laser of 355 nm wavelength was successfully used to drill holes in a soda lime glass of 1 mm thick and cut borosilicate glass of 200 μm thick with no visible micro-cracks. Ozkan et al. [18] reported glass processing by a UV nanosecond and infrared (IR) femtosecond laser. It was found that the surface roughness of grooves produced by the UV (266 nm) nanosecond and IR (800 nm) femtosecond laser was similar for borosilicate glass. However, for fused silica, the UV laser generated a very rough surface morphology owing to the presence of plasma and very low absorption of the UV beam in the fused silica glass. Niino et al. [19] studied the micro structuring of silica glass surface with a UV laser at 266 nm. Well-defined micro-patterns were successfully formed on the glass surface without micro-crack and debris. Karnakis et al. [20] demonstrated micro-channel scribing in borosilicate glass with a UV (255 nm) nanosecond laser. Burr-free channel edge was obtained through the optimization of process parameters; however, micro-cracking was occasionally produced at the channel junctions.
In this study, a nanosecond UV (355 nm) laser is used for grooving of the soda lime glass. The effect of process parameters including laser power, scan speed, pulse repetition rate, and the number of scan on the morphology of glass surface is investigated, and the corresponding interaction mechanism between the UV laser and glass is also analyzed. The process window for damage threshold is defined, and the crack-free groove is successfully formed. The groove with a rectangular cross section of several hundred microns in size is also produced by multi-laser scans to check the feasibility of the groove for application as a bio-chip channel.

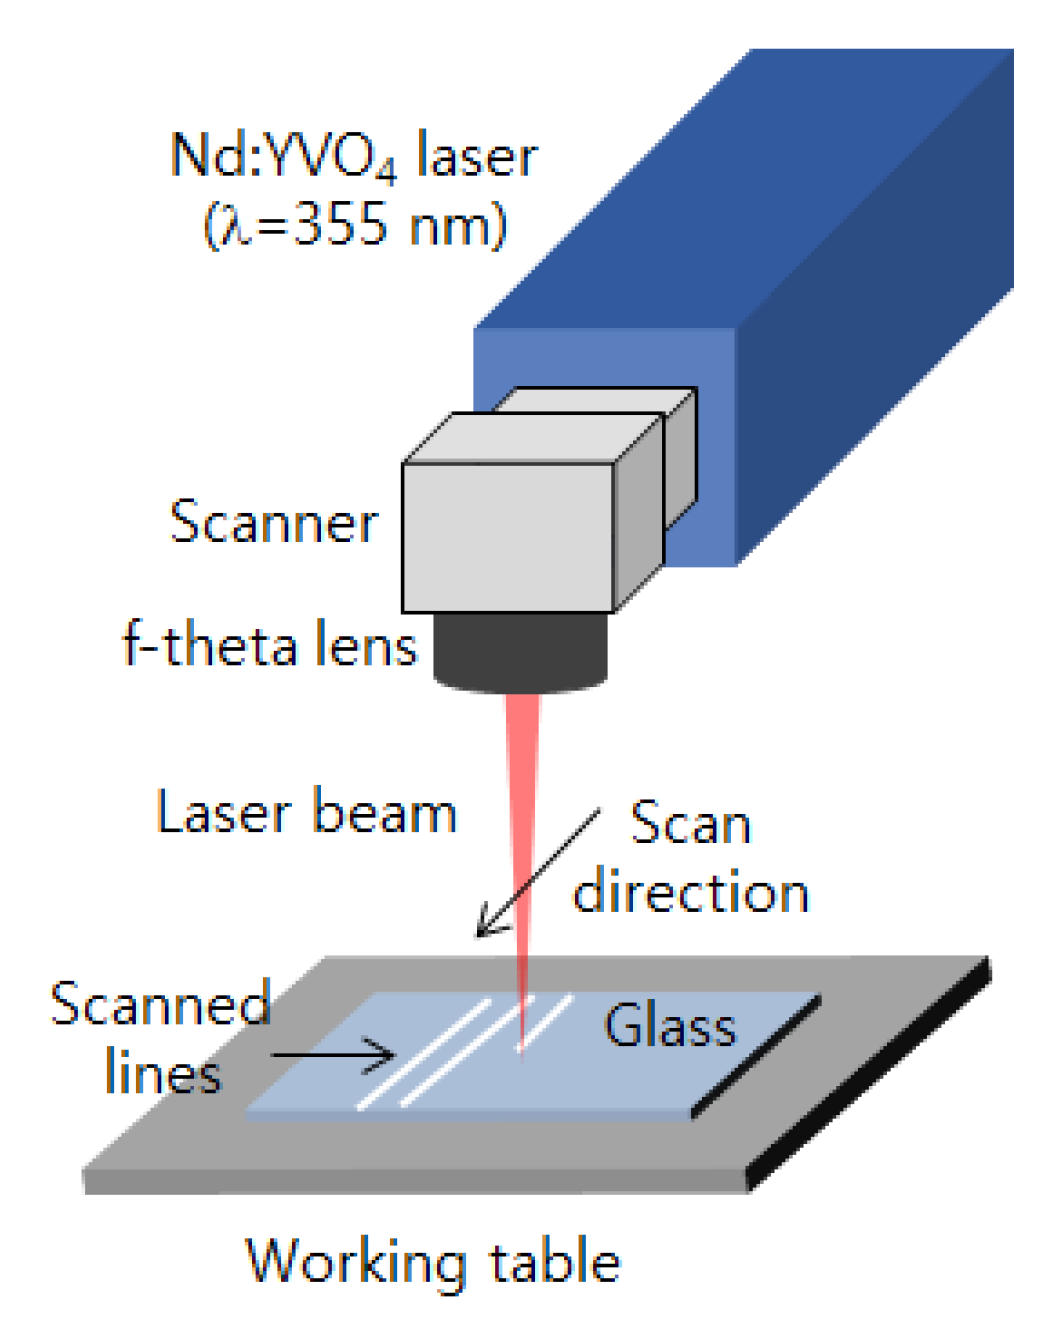
2. Experimental Details

The laser system (EVLASER Co., Ltd., Gyeonggi-do, Korea) used in this study consists of a UV (355 nm) Nd:YVO4 laser source (INNGU LASER, Pulse 355-3A) and scanner module. The fundamental wavelength of the Nd:YVO4 is 1064 nm. However, in this study, the Nd:YVO4 laser with third-harmonic generation is used to give a laser beam of 355 nm wavelength. The Nd:YVO4 laser has a pulse width of 12–22 nanoseconds and is operated at a 30–80 kHz pulse repetition rate. The pulse width information at various pulse repetition rates is shown in Table 1. A laser beam generated from the laser source is delivered onto the scanner. The laser scanner has a galvano mirror system and f-theta lens (110 mm × 110 mm scan filed), so that it can move the laser beam of uniform intensity on a workpiece in fast and precise way. The effective focal length of the f-theta lens is 160 mm, and this gives a focused beam spot size of ~20 μm on the workpiece. In this experiment, the direction of the laser beam polarization is horizontal to the surface of glass. The schematic diagram of the UV nanosecond laser processing is shown in Figure 1. In this study, the experiments using both single laser scan and multiple laser scans are carried out. The multiple laser scanning methods used in the experiment are presented in Figure 2.
Laser scans are also carried at various laser average powers. In this study, the laser average power is measured using the digital laser power meter with a thermal head detector (ADM-1000, lasermet, Bournemouth, UK) before the grooving experiment. During the measurement of the laser power, a defocused laser beam continuously moves along the circular track with a 3 mm diameter on the detector (to avoid damage of the detector) until the laser power value displayed is stabilized. The stabilized power value is used as a process condition.
In this work, soda lime glass from a local supplier is used for laser processing. The thickness of the soda lime glass used in the experiment is ~1.1 mm. The material properties and chemical composition of the soda lime glass are listed in Table 2 and Table 3, respectively. The surface morphology of the laser-irradiated glass substrates is analyzed by an optical microscope (Dino Lite, AM4013MZT) and a field emission scanning electron microscopy (FE-SEM, TESCAN MIRA LMH).

3. Results and Discussion

3.1. Result of Damage Threshold Test

The minimum laser energy to induce a visible damage on glass substrate is found through a damage threshold test. In this test, the surface of the glass is scanned with the UV laser beam of 0.33–1.76 W. The scanning speed and pulse repetition rate used for this experiment are 5 mm/s and 30 kHz, respectively. Figure 3 shows the optical scope images of the glass surface irradiated by the laser beam. As seen in the figure, below the laser power of 0.72 W, any visible damage is not observed on the surface of the glass substrate. The calculated threshold power density corresponding to this power is 6.37 × 10⁸ W/cm2. At this power density, the width of the heat affected zone (HAZ) is very narrow; however, the width of the HAZ and crack propagation significantly increase with the laser power, as shown in the figure.

3.2. Analysis of Glass Surface Morphology Produced by Single Laser Scan

The experiment using single laser scan is carried out by varying the laser power, scan speed, and pulse repetition rate. Figure 4 shows the optical images of the glass surface damaged by the single laser scan at various laser powers and scan speeds under the fixed pulse repetition rate of 30 kHz. It is seen that cracks are generated along the direction of scanning owing to the thermal stress induced by rapid heating and cooling during the process. It is clearly observed that the size of the crack increases with decreasing scan speed and increasing laser power owing to greater laser energy deposition on the glass. The size of cracks produced is several tens of microns to several hundreds of microns depending on the process condition. The crack has a seagull shape, and its one end propagates across the direction of scanning.
Figure 5 shows the glass surface damaged by the single laser scan with higher pulse repetition rate. The aspect of the crack propagation is similar up to 50 kHz pulse repetition rate; however, the significant increase of the crack size is found from the pulse repetition rate of 60 kHz, as shown in the figure. Owing to the large growth of the cracks, neighboring cracks are linked to each other like in a chain, and their size reaches several millimeters. At a very high pulse repetition rate (80 kHz), the long crack of a line shape is eventually produced along the direction of scanning.
The detailed morphology of the glass surface is investigated with SEM. Figure 6 shows SEM images of the glass surface scanned by a laser beam at a pulse repetition rate of 30 kHz. At the laser power of 3.32 W and scan speed of 5 mm/s, the glass surface irradiated by the laser beam shows a smooth wave morphology. This indicates that material removal does not nearly occur, and the interaction between the laser beam and glass only induces volume melting underneath the glass surface. The evidence of the volume melting is clearly observed at the end facet of the glass plate (the end point of the scanning path, see Figure 6i). As the laser power decreases and scan speed increases, the morphology of the glass surface is turned into a groove shape through the material removal process, as shown in the figure. It is found that the groove with a very smooth surface is obtained when a relatively low scanning speed is used. Under this process condition, the groove with thermal cracks is generated as seen in Figure 6b,e,f,j. With the further increase of the scanning speed, the groove produced has a very rough morphology; however, this process condition does not nearly induce cracks around the groove.
In the high power density laser–matter interaction, physical phenomena such as melting, vaporization, and plasma formation are involved, and material removal is mostly achieved through vaporization and melt ejection driven by high vapor pressure [24,25]. According to Figure 7a,b, it is seen that molten materials removed from the irradiation regions splash out on the surface near grooves. This indicates that melting is the dominant material removal mechanism. At a relatively high scanning speed (see Figure 7c,d), many molten glass powders not ejected are observed inside the groove owing to less laser energy deposition on the glass surface, which in turn makes a rough surface morphology at the irradiation zone. Under a relatively high scanning speed, the shattering of the surface is also seen at the edge region of the groove. This is attributable to the shock wave induced by plasma breakdown during the process. The sharp and non-melt glass pieces found around the groove in Figure 7d are the outcome of shattering. Therefore, in this case, high temperature vaporization inducing the shock wave as well as the melting contributes to material removal. The generation of micron bubbles is seen in HAZ (see Figure 8). During the interaction between the laser beam and glass, thermal energy inside the glass could induce thermal dissociation and other chemical reactions of the components shown in Table 3. This may generate the oxygen gas to be the source of the bubbles inside the glass.
On the basis of the results for single laser scan tests, some important findings could be described as follows. The interaction between the UV laser and material at a high laser power and low scan speed just induces volume melting underneath glass surface and large thermal crack without material removal. With the decreasing laser power and increasing scan speed, a groove with a smooth surface starts to form owing to the melting-dominant material removal process. A crack-free groove is only obtained at a relatively low laser power and high scanning speed. Under this process condition, both shattering induced by shock wave and melting contribute to the material removal. Process characteristics depending on the laser scanning condition are summarized in Table 4.

3.3. Groove Formation by Multiple Laser Scans

In order to produce the groove or channel structures with various widths and depths in the glass substrate, multiple laser scans are necessary. In this section, the groove formation by the multiple laser scans is described. One of the process conditions to produce the crack-free groove is used in the experiment for multiple laser scans. The process condition selected for the experiment is a laser power of 2.28 W, scan speed of 25 mm/s, and pulse repetition rate of 30 kHz. Figure 9 shows the result of multiple laser scans with zero scan spacing. In this experiment, a laser beam scans the same scan track several times. From Figure 9, it is confirmed that the increase of the scan number does not induce cracking around the irradiation region.
Figure 10 shows the measured depth and width of the groove as a function of the number of scans. The optical images (cross sectional view of the grooves) used to measure the depth and width of the groove are shown in Figure 11. The width of the groove does not nearly change as the scan number increases, whereas the depth of the groove tends to increase with the scan number, as seen in the figure. In high power density laser–material interaction, the absorption of the laser beam in the material dramatically increases once a laser-induced crater is produced as a result of the multiple reflection of the laser beam in the crater [24]. This could help the material removal in multiple laser scans, although the intensity of the laser beam decreases owing to continuous beam defocusing with the depth of the groove.
The multiple laser scans with a non-zero scan spacing is also tested to produce a wide groove. Two different scanning schemes are tested to evaluate the efficiency in material removal (see Figure 2). Figure 12 shows the cross section of the groove produced with two different scanning schemes using the same laser parameters. It is found that more material can be removed with method 3. In method 3, a rough surface morphology is uniformly produced for the whole scanned area after the first set of the laser scan is finished. This contributes to the acceleration of material removal owing to more laser energy absorption through the multiple reflection of the laser beam from the second set of the laser scan.
Figure 13 shows the groove produced by multiple laser scans using method 3. A near rectangular-shaped groove is produced to imitate the microchannel of a bio-chip. It is seen that the groove has a quite smooth inner surface. The width and depth of the groove are ~220 μm and ~500 μm, respectively. No visible crack is observed around the groove wall along the direction of scanning. This result may suggest that a UV nanosecond laser could be one of the potential tools for the fabrication of bio-chip channels.

4. Conclusions

In this study, the UV nanosecond laser grooving process for glass substrate is carried out, and the process characteristics including surface morphology, crack, and material removal mechanism are investigated. The important conclusions of this work are as follows.
(1) The damage threshold power density of the UV laser beam for soda lime glass surface is ~6.37 × 10⁸ W/cm2 (at 5 mm/s scan speed and 30 kHz pulse repetition rate).
(2) The groove produced by the single laser scan process can be categorized as two types based on the morphology of the groove. The first type of the groove has a smooth surface owing to the melting-dominant material removal process, and the cracks of several tens to hundreds of microns in size are usually produced along the groove of this type. The second type of the groove has a rough surface morphology due to shattering and non-ejected molten glass powders; however, in this case, the crack-free groove can be obtained when a relatively high scan speed is used. The process conditions producing the crack-free groove are shown in Table 5.
(3) The near rectangular-shaped groove, imitating the microchannel for a bio-chip application, of several hundred micrometers in size and with smooth surface is successfully fabricated by multiple laser scans without crack. This result shows the feasibility of a UV nanosecond laser as a potential tool for the fabrication of bio-chip channels.

Author Contributions

J.S., conceptualization, data curation, formal analysis, funding acquisition, methodology, project administration, supervision, visualization, writing—original draft, writing—review & editing. K.N., data curation, investigation, methodology, visualization. All authors have read and agreed to the published version of the manuscript.

Funding

This research was supported by Basic Science Research Program through the National Research Foundation of Korea (NRF) funded by the Ministry of Education (NRF-2018R1D1A1B07040563).

Conflicts of Interest

The authors declare no conflict of interest.

References

  1. Zhou, M.; Ngoi, B.K.A.; Yusoff, M.N.; Wang, X.J. Tool wear and surface finish in diamond cutting of optical glass. J. Mater. Process. Technol. 2006, 174, 29–33. [Google Scholar] [CrossRef]
  2. Kondrashov, V.I.; Shitova, L.A.; Litvinov, V.A.; Surkov, V.V. Characteristics of cutting parameters and their effect on the glass edge quality. Glass Ceram. 2001, 58, 303–305. [Google Scholar] [CrossRef]
  3. Pan, C.T.; Hsieh, C.C.; Su, C.Y.; Liu, Z.S. Study of cutting quality for TFT-LCD glass substrate. Int. J. Adv. Manuf. Technol. 2008, 39, 1071–1079. [Google Scholar] [CrossRef]
  4. Steen, W.M.; Mazumder, J. Laser Material Processing, 4th ed.; Springer: London, UK, 2010. [Google Scholar]
  5. Allcock, G.; Dyer, P.E.; Elliner, G.; Snelling, H.V. Experimental observations and analysis of CO2 laser induced microcracking of glass. J. Appl. Phys. 1995, 78, 7295–7303. [Google Scholar] [CrossRef]
  6. Finucane, M.A.; Black, I. CO2 laser cutting of stained glass. Int. J. Adv. Manuf. Technol. 1996, 12, 47–59. [Google Scholar] [CrossRef]
  7. Guignard, F.; Autric, M.; Baudinaud, V. Temperature and residual stress evolution in CO2 Laser irradiated glass. Proc. SPIE 1998, 3343, 534–545. [Google Scholar]
  8. Hermanns, C. Laser cutting of glass. Proc. SPIE 2000, 4102, 219–226. [Google Scholar]
  9. Vanagas, E.; Kawai, J.; Tuzhilin, D.; Kudryashov, I.; Mizuyama, A.; Nakamura, K. Glass cutting by femtosecond pulsed irradiation. J. Microlithogr. Microfabr. Microsyst. 2004, 3, 358–363. [Google Scholar] [CrossRef]
  10. Nikumb, S.; Chen, Q.; Li, C.; Reshef, H.; Zheng, H.Y.; Qiu, H.; Low, D. Precision glass machining, drilling and profile cutting by short pulse lasers. Thin Solid Films 2005, 477, 216–221. [Google Scholar] [CrossRef] [Green Version]
  11. Richter, S.; Nolte, S.; Tünnermann, A. Ultrashort pulse laser welding—A new approach for high-stability bonding of different glasses. Phys. Procedia 2012, 39, 556–562. [Google Scholar] [CrossRef]
  12. Sugioka, K.; Cheng, Y. Ultrafast laser-reliable tools for advanced materials processing. Light Sci. Appl. 2014, 3, 1–12. [Google Scholar] [CrossRef]
  13. Wlodarczyk, K.L.; Brunton, A.; Rumsby, P.; Hand, D.P. Picosecond laser cutting and drilling of thin flex glass. Opt. Lasers Eng. 2016, 78, 64–74. [Google Scholar] [CrossRef] [Green Version]
  14. Shin, J. Investigation of the surface morphology in glass scribing with a UV picosecond laser. Opt. Laser Technol. 2019, 111, 307–314. [Google Scholar] [CrossRef]
  15. Cho, S.H.; Chang, W.S.; Kim, J.G.; Kim, K.R.; Hong, J.W. Fabrication of internal diffraction gratings in planar fluoride glass using low-density plasma formation induced by a femtosecond laser. Appl. Surf. Sci. 2008, 255, 2069–2074. [Google Scholar] [CrossRef]
  16. Ahn, S.; Choi, J.; Noh, J.; Cho, S.H. High aspect ratio nanoholes in glass generated by femtosecond laser pulses with picosecond intervals. Opt. Laser Eng. 2018, 101, 85–88. [Google Scholar] [CrossRef]
  17. Industrial Report. Available online: https://www.spectra-physics.com/assets/client_files/files/documents/Laser_Glass_Cutting_SP.pdf (accessed on 10 January 2020).
  18. Ozkan, A.; Migliore, L.R.; Dunsky, C.M.; Phaneuf, M.W. Glass processing using microsecond, nanosecond and femtosecond pulsed lasers. Proc. SPIE 2003, 5063, 108–112. [Google Scholar]
  19. Niino, H.; Kawaguchi, Y.; Sato, T.; Narazaki, A.; Gumpenberger, T.; Kurosaki, R. Surface Micro-Structuring of Silica Glass by Laser-Induced Backside Wet Etching with ns-Pulsed UV Laser at a High Repetition Rate. JLMN-J. Laser Micro/Nanoen. 2006, 1, 39–43. [Google Scholar] [CrossRef]
  20. Karnakis, D.M.; Knowles, M.R.H.; Alty, K.T.; Schlaf, M.; Snelling, H.V. Comparison of glass processing using high-repetition femtosecond (800 nm) and UV (255 nm) nanosecond pulsed lasers. Proc. SPIE 2005, 5718, 216–227. [Google Scholar]
  21. Data Sheet Downloaded. Available online: https://www.continentaltrade.com.pl/soda-lime-glass (accessed on 23 January 2020).
  22. Data for Soda-Lime Glass-Green. Available online: https://refractiveindex.info/?shelf=3d&book=glass&page=soda-lime-green (accessed on 23 January 2020).
  23. Data for Soda-Lime Glass-Typical Float Glass. Available online: https://glassproperties.com/glasses/ (accessed on 23 January 2020).
  24. Shin, J.; Mazumder, J. Numerical and experimental study on the effect of the pulse format in laser drilling. J. Laser Appl. 2016, 28, 012008. [Google Scholar] [CrossRef]
  25. Shin, J.; Mazumder, J. Plasma diagnostics using optical emission spectroscopy in laser drilling process. J. Laser Appl. 2016, 28, 022008. [Google Scholar] [CrossRef]
Figure 1. Schematic diagram of the laser grooving experiment.
Applsci 10 00987 g001
Figure 2. Multiple scanning methods. Method 1 indicates multiple laser scans with zero-scan spacing. Methods 2 and 3 are for multiple laser scans with non-zero scan spacing. In methods 2 and 3, ① and ② denote a scan sequence (① is the first part of the scan sequence).
Applsci 10 00987 g002
Figure 3. Result of damage threshold test for the soda-lime glass substrate. Laser power: (a) 0.33 W, (b) 0.72 W, (c) 1.22 W, and (d) 1.76 W. The circle in the figure denotes a crack.
Applsci 10 00987 g003
Figure 4. Optical images of the glass surface damaged by a single laser scan. Laser power: (ad) 2.28 W, (eh) 2.8 W, and (il) 3.32 W. Scan speed: (a,e,i) 5 mm/s; (b), (f,j) 15 mm/s; (c,g,k) 25 mm/s; and (d,h), and (l) 35 mm/s. The circle in the figure denotes a crack.
Applsci 10 00987 g004
Figure 5. Optical images of the glass surface damaged by a single laser scan with a higher pulse repetition rate. Scan speed: (ad) 5 mm/s and (eh) 15 mm/s. Laser power and pulse repetition rate: (a,e) 2.48 W and 50 kHz, (b,f) 2.65 W and 60 kHz, (c,g) 2.39 W and 70 kHz and (d,h) 2.12 W and 80 kHz. The circle in the figure denotes a crack.
Applsci 10 00987 g005
Figure 6. SEM images of the glass surface damaged by a single laser scan. Laser power: (ad) 2.2 W, (eh) 2.8 W, and (il) 3.32 W. Scan speed: (a,e,i) 5 mm/s; (b,f,j) 15 mm/s; (c,g,k) 25 mm/s; and (d,h,l) 35 mm/s. The circle in the figure denotes a crack.
Applsci 10 00987 g006
Figure 7. SEM images of the glass surface damaged by single laser scan. Laser power: (a,c) 2.28 W and (b,d) 2.8 W. Scan speed: (a,b) 15 mm/s and (c,d) 35 mm/s.
Applsci 10 00987 g007
Figure 8. Micron bubbles seen in the heat affected zone (HAZ) (laser power: 2.8 W, scan speed: 20 mm/s, and pulse repetition rate: 30 kHz).
Applsci 10 00987 g008
Figure 9. SEM images of the grooves produced by multiple laser scans with zero scan spacing (laser power: 2.28 W, scan speed: 25 mm/s, and pulse repetition rate: 30 kHz). Number of scans: (a) 1, (b) 5, (c) 10, and (d) 20.
Applsci 10 00987 g009
Figure 10. Depth and width of the groove as a function of the number of scans.
Applsci 10 00987 g010
Figure 11. Optical images of the grooves (cross-sectional view) produced by multiple laser scans with a zero scan spacing (laser power: 2.28 W, scan speed: 25 mm/s, and pulse repetition rate: 30 kHz). Number of scans: (a) 1, (b) 2, (c) 3, (d) 4, (e) 5, (f) 6, (g) 7, (h) 8, (i) 9, (j) 10, and (k) 20.
Applsci 10 00987 g011
Figure 12. Cross section of the grooves produced by multiple laser scans with a non-zero scan spacing (laser power: 2.28 W, scan speed: 25 mm/s, pulse repetition rate: 30 kHz, and scan spacing: 30 μm). Scanning scheme: (a) method 2 in Figure 2 and (b) method 3 in Figure 2 (number of scans per scan track: 5 and number of scan tracks: 130).
Applsci 10 00987 g012
Figure 13. SEM image of the groove produced by multiple laser scans (number of scans per scan track: 5 and number of scan tracks: 17) using method 3 (laser power: 2.28 W, scan speed: 25 mm/s, pulse repetition rate: 30 kHz, and scan spacing: 30 μm). (a) Low magnification and (b) high magnification.
Applsci 10 00987 g013
Table 1. Pulse width of the Nd:YVO4 (355 nm) laser at different pulse repetition rates (data from INNGU LASER).
Pulse Repetition Rate (kHz)Average Power (W)Pulse Width (ns)
304.0612
403.8714
503.5816
603.3818
703.1820
802.9722
Table 2. Thermophysical and optical properties of the soda lime glass.
PropertyValue
Thermal conductivity0.94 W/(m K) [21]
Specific heat0.88 kJ/(kg K) [21]
Coefficient of linear expansion8.3 × 10−6 °C [21]
Refractive index1.54 (at 355 nm) [22]
Absorption coefficient1.58 cm-1 (at 355 nm) [22]
Transmittance0.85 (at 355 nm) [22]
Table 3. Chemical composition of the soda lime glass [23].
MaterialSiO2Al2O3MgOCaONa2OK2OFe2O3TiO2
Composition, mol. %71.860.085.649.2313.130.020.040.01
Table 4. Process characteristics depending on the laser scanning condition.
Laser Power (W)Scan Speed (mm/s)Groove FormationSurface Condition of GrooveCrack GenerationMaterial Removal Characteristic
2.285×-Type I
10–15SmoothType II
20RoughType III
25–40Rough×Type III
2.85–20SmoothType II
25RoughType III
30–40Rough×Type III
3.325×-Type I
10–20SmoothType II
25–30RoughType III
35–40Rough×Type III
a Type I: material removal does not nearly occur. b Type II: material removal mostly occurs through melt ejection. c Type III: material removal occurs through both melt ejection and shattering induced by shock wave.
Table 5. Process condition for the crack-free groove.
Pule repetition Rate (kHz)Laser Power (W)Scan Speed (mm/s)
302.2825–40
2.830–40
3.3235–40

