Featured Application
Mechanical grinding of microparticle to nanosize.
Abstract
The interest in the utilization of palm oil ash is high, mainly due to their renewable material, opportunity to enhance the properties and possibility to use in a wide range of applications. Palm oil ash is the by-product of the palm oil mill boilers and locally available in the form of micro-size particles. In this research, optimization of the milling process was designed using the Taguchi method to find the most influencing parameters for the preparation of palm oil ash (POA) nanoparticles using a ball milling technique. The experiment was applied using a L9 orthogonal array and signal to noise ratio to investigate the performance of parameters, which are milling time, milling speed, and balls size. The results from signal to noise ratio reveal that to produce POA nanoparticles in optimum parameters, the size of balls shows the highest significant effect on the production of POA nanoparticles, followed by milling time and speed. The results of the parameters optimization experiment were validated by a confirmation test of milling machine operations.
1. Introduction
Palm oil ash (POA) is an abundant agricultural solid waste in Malaysia. The ash is produced after the combustion of oil palm fiber and shell as boiler fuel to produce steam for electricity generation and palm oil extraction. Around 200 palm oil mills are in operation in Malaysia, where thousands of tons of POA are produced annually and disposed of without any commercial return [1]. The generation of palm oil ash (POA) and boiler ash (BA) in Malaysia were estimated to be over 4 million tons per year [2]. The generated waste could lead to health-related issues, environmental problems, and also financial loss [3,4,5]. Although there are some studies on the utilization of POA such as a partial replacement of cement in concrete [6], as an adsorbent for the removal of heavy metal from aqueous solution [7], flue gas desulphurization [8], and recently as a nano-structured material in polymer [9], most of the ash is still disposed of in landfill that requires a lot of land area. The utilization of POA in advance or conventional composites to reduce the cost, appearance, and properties of final products, has gained the attention of many researchers. Therefore, the utilization of POA becomes an essential topic to be further investigated.
In order to obtain high-quality POA with fine particle size, homogenous size distribution, and unique morphology, various preparation techniques have been used to synthesize ultrafine POA, including ball milling and grinding technique [10,11]. There has been an abundance of investigation dedicated to the production and characterization of nanoparticles due to their distinct characteristics, which are unavailable in conventional macroscopic materials. The mechanical ball milling technique is one of the well-known as a simple and low-cost method for the production of nano-structured materials [12]. This technique has proved to be an effective way to fracture and reduce the size of particles with the possibility of obtaining large quantities of nanomaterials. The process inside the ball mill involved mechanical energy transfer between the balls and the substrate was assured by continuous impact [13,14].
Over the past decade, there have been several investigations to simulate the dynamics of the ball milling technique process in addition to analyse the parameters to produce nano-structured materials and to create the process more efficiently. The ball milling system consists of two rollers and one mill jar. The rollers rotate in one direction while the mill jar rotates in the opposite direction. During the rotation of the mill jar around its axis, the centrifugal force was created and helped the mixture of milling balls and powder. Thus, the impact energy of milling balls assists the friction of the powder into a smaller size. Many parameters have been tested to optimize the ball milling process, such as milling speed [15], milling time [16], balls size [17], and a ball to powder weight ratio [18]. Although many researchers have combined the parameters to determine the most influential parameter to produce nanoparticles, the results vary from one another. Therefore, there is no conclusive method on the best parameter applied to the ball milling process to transform macro size materials to nano-scale particles.
The objective of this research is to design a process of transforming natural palm oil ash (POA) to POA nanoparticles by applying a set of parameter combinations in the ball milling technique. The traditional experimental design methods are too complex, time-consuming, and complicated to apply. Many experiments must be carried out when the number of process parameters is more. To solve this problem, the Taguchi method uses a special design of orthogonal arrays to study the entire parameter space with a minimum number of experiments [19]. This technique was used to produce a high content of POA nanoparticles, which is less than 100 nm (0.1 µm) with optimization process from the Taguchi method analysis. The orthogonal array and signal to noise ratio (S/N) in the Taguchi experimental design was used to find the optimal level and to analyze the effect of parameters on the size of POA particles.
2. Materials and Methods
Palm oil ash (POA) was obtained from United Oil Palm Mill, Penang. More than 10 kg of palm oil ash was taken from this mill. The bio waste from the boiler particularly from the hopper outlet has been chosen to be converted to nanomaterial due to its small particle size. The small particle makes it effortless to grind to nanoparticle size in the ball milling process. Figure 1 showed that the raw palm oil ash (POA) in greyish colour, consists of irregularly shaped particles and a median size of about 20 µm.
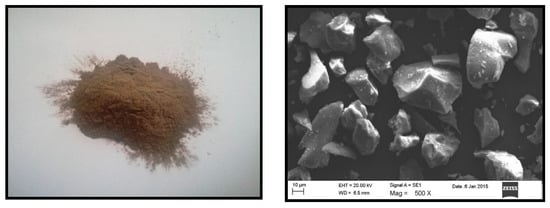
Figure 1.
Raw palm oil ash from the hopper outlet of boiler.
The POA from the hopper outlet was dried at 70 °C for 24 h in the oven to remove the excess water content. Then, the dried POA was sieved using a 60 mesh size sieve to separate micro-sized particles such as sands, stones, and macroparticles. The fine dried palm oil ash was further ground to smaller particle size, followed by an optimization process using a ball milling technique. The mechanical milling process was done using a horizontal ball mill at the following conditions: Ball to powder weight ratio was 10:1, three control factors (milling time, milling speed, and balls size), and was performed at room temperature. The POA nanoparticles obtained from the ball milling process was kept at a high temperature condition around 110 °C in the drying oven for 24 h to prevent agglomeration and was kept in a dry place to avoid contact with moisture. Characterization of the particle size was done using particle size distribution analyzer. Then, the optimization of the ball milling process was calculated by using the Taguchi method to obtain optimum parameters in producing POA nanoparticles. Results obtained from the optimization process by the Taguchi method was further conducted with a confirmation test to validate the most significant parameters in the preparation of palm oil ash nanoparticles. Figure 2 depicts the process optimization through the ball milling technique.
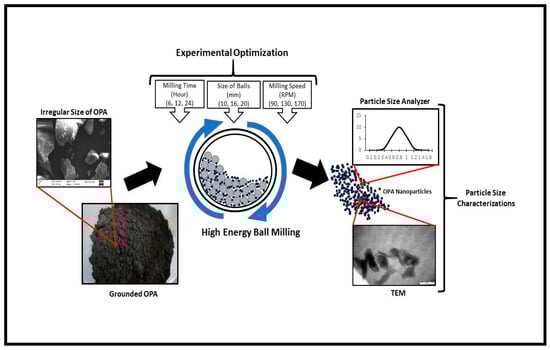
Figure 2.
Diagram depicting the preparation of palm oil ash (POA) nanoparticle by design optimization.
2.1. Design of Experiment
The Taguchi method provides a simple, efficient, and systematic approach to determine the optimum parameters. In addition, the Taguchi method provides a more simplified way to setup the combination of experiment parameters compared to the factorial method, instead of testing all possible combinations of parameters available. The parameters tested in this experiment are milling time, size of stainless-steel ball, and milling speed. These parameters were used to produce homogenous and high purity nanoparticles of less than 100 nm consistently. Table 1 shows the parameters selected and the levels for each parameter. In the preparation of palm oil ash nanoparticles by the ball milling technique, the Taguchi proposed to use the orthogonal array to screen the experimental conditions and means. Furthermore, by using this method, the least of the experimental process could be developed based on the number of factors and levels. In addition, the advantage of this method was to achieve the best combination of design parameters and optimal results. Corresponding to the main factors namely milling time, milling speed, size of balls, and each has three levels shown in Table 1, an orthogonal array L9 of Taguchi design was established for numerical experiments. Due to the orthogonal array, the analysis and calculation time reduce significantly, hence becomes more efficient. A combination of structured parameters in nine experiments each with three replications with the obtained results of the L9 array is shown in Table 2.

Table 1.
Parameters selected and levels for each parameter.
Table 2.
Experimental results for the particle size (mean ± SD, replicated three times).
In the Taguchi method, to determine the effect of each parameter on the production of nanoparticle of palm oil ash (POA), the signal to noise ratio based on mean value needs to be calculated for each of the parameter combinations, respectively. The S/N ratio was used to measure the quality characteristic deviating from the desired value. The value of S/N from each experiment was used to determine the optimum parameters and the most influential parameters to the results. The term ‘signal’ represents the desirable value (mean) for the output characteristic and the term ‘noise’ represents the undesirable value (SD) for the output characteristic [20]. The S/N ratio formula for the static design was divided into three categories, viz. ‘nominal is the best’, ‘larger the better’, and ‘smaller the better’. In this experimental design, the ‘smaller the better’ formula was chosen to analyze the production of POA nanoparticle. The S/N ratio was calculated for each factor level combination. The formula (Equation (1)) for the ‘smaller-is-better’ S/N ratio can be expressed as:
where
Y is a response to the given factor level combination
n is a number of responses in the factor level combination.
2.2. Materials Characterization
2.2.1. Particle Size Measurement
The palm oil ash (POA) particle size of the initial materials and milled powders were measured with a Malvern Mastersizer (Malvern Instruments Ltd, Gravewood Malvern, UK) Scirocco 2000 by dynamic light scattering measurements. In each measurement, the detector and laser were aligned, and the background calibrated. Size distribution was quantified as the relative volume of particles in size bands presented as size distribution curves (Malvern MasterSizer Software v 5.60, Gravewood Malvern UK). The particle size distribution was described according to D-values (D0.1, D0.5, and D0.9), which are corresponding to 10%, 50%, and 90% of the cumulative mass [21]. The measurement was repeated three times and the average value would be analyzed by Taguchi method to predict the optimum parameters and desirable performance.
2.2.2. Morphology Studies
Transmission electron microscopy (TEM) was carried out with an energy-filtered transmission electron microscopy EFTEM Libra—Carl Zeiss instrument to study the palm oil ash POA nanoparticle morphology. The POA nanoparticles were oven dried at 60 °C for 1 h before using the TEM. The POA nanoparticles were prepared in acetone and dispersed with an ultrasonicator for 10 min. The samples for TEM analysis were prepared by placing a drop of colloidal dispersion containing POA nanoparticles onto a carbon-coated copper grid. Embedded POA nanoparticles were air dried at room temperature before being examined under TEM instrument under control condition.
3. Results and Discussion
3.1. Parameters Optimization
The results of the Taguchi experiments according to L9 orthogonal array were analyzed and the response values of mean particle size distribution obtained from particle size analyzer are shown in Table 2. All the responses with three repetitions from each experiment were evaluated individually. The results showed that each experiment exhibited a various range of particle sizes. The finest size of POA particles was obtained in experiment number nine with 0.09 (± 0.07) µm of mean particle size. Meanwhile, experiment number one obtained a greater size with 0.48 (± 0.06) µm of mean particle size.
The TEM images of the POA nanoparticles obtained in nine experiments (Table 2) are shown from Figure 3, Figure 4 and Figure 5. The particle size distribution histogram Figure 3A–C and TEM image of POA nanoparticles from experiment one to three (E1–E3) are shown in Figure 3. The TEM images only reveal the lateral dimension of the nanoparticle but no information on the nanoparticle height. Though, with the dimension of the width particles from the TEM images, the lateral particle size distribution can be obtained [22]. From the histogram, the size distribution is narrow, and the major peak is centered at 480, 410, and 230 nm. The TEM image of experiment one (E1) illustrated the identical of the POA shape which is spherical. However, The TEM image significantly reveals that the smaller the particle size distribution, POA tends to agglomerate, and identification of particle shape and size becomes more complicated.
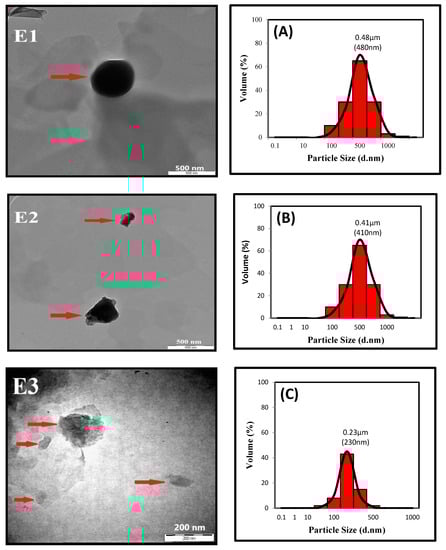
Figure 3.
TEM image (E1–E3) and POA nanoparticle distribution (A–C) from experiment one, two, and three of the Taguchi optimization processes.
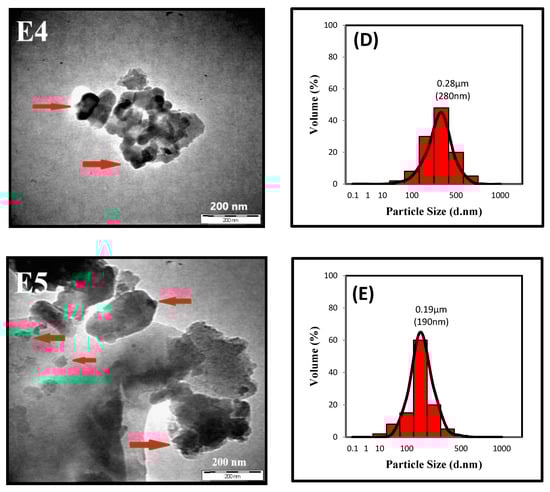
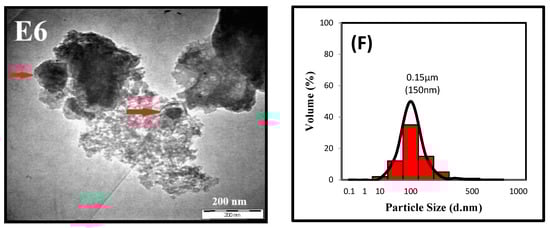
Figure 4.
TEM image (E4–E6) and POA nanoparticle distribution (D–F) from the experiment four, five, and six of the Taguchi optimization processes.
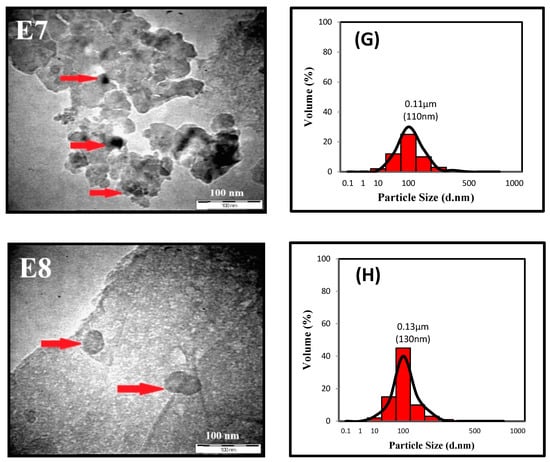
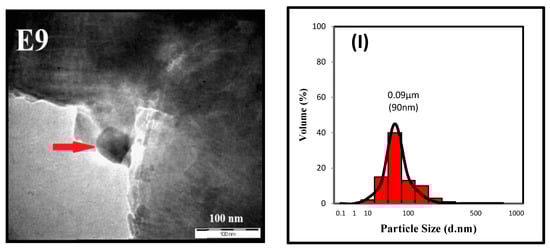
Figure 5.
TEM image (E7–E9) and POA nanoparticle distribution (H–I) from experiments seven, eight, and nine of the Taguchi optimization processes.
Meanwhile, a distribution curve for particle size histograms in Figure 4D,E and TEM images from experiment four to six (E4–E6) are shown in Figure 4. It can be observed that the TEM images illustrated the irregular shape and size of POA nanoparticles with a wide range of distribution. The morphology showed the irregular shape of POA nanoparticles probably due to rigorous impact and forces during the ball milling process. For the particle size distribution according to the experiments, a major peak is centered at 280, 190, and 150 nm, respectively. The last three experiments of L9 orthogonal array with the TEM image and distribution of particle size histograms are shown in Figure 5. The TEM images from experiment seven to experiment nine (E7–E9) showed that the POA nanoparticles still retain the spherical morphology although through the different ball milling process parameters. This behaviour could increase the interest of POA utilization in a wide range of applications. In the meantime, the lower peak of distribution in experiment 7 Figure 5G may be due to the agglomeration of POA nanoparticles compared to experiment eight Figure 5H and nine Figure 5I. Furthermore, the smaller POA nanoparticles tend to adhere to each other due to growing of inter-particle bonding. It is significant to mention that there is a great possibility the aggregation of the nanoparticles occurred and leads to the declining volume of POA nanoparticles. Nevertheless, the distribution particle analysis still obtained the major peak at 110, 130, and 90 nm of each experiment, respectively, as presented in Figure 5.
Although experiment number nine resulted in a higher distribution of POA nanoparticles, to determine the optimum parameters and most influential parameter, the signal to noise (S/N) needs to be calculated. In this experiment, the signal to noise ratio was used to identify the control factors that reduce the variability of the results by minimizing the effects of uncontrollable factors. The S/N value was used to determine the most significant parameters and which level is highly contributing to the output [23]. The S/N output was calculated according to the “smaller is better” equation for static design. The Taguchi method provided by commercial software Minitab 16 was used to calculate the signal to noise ratio of each experiment. The computed signal to noise ratio value was presented in Table 3. As shown in Equation (1), from the objective of the-lower-the-better quality characteristic which is to minimize the response, a greater S/N ratio corresponds to a smaller variance of the output characteristic around the desired value.
Table 3.
Signal to noise ratio (S/N) for each experiment.
The S/N response table by factor level for the milling time, milling speed, and size of balls was created in an integrated way and the results are tabulated in Table 4. The delta (∆) value was calculated using (highest S/N–lowest S/N) for each parameter and compared. From the point of the “smaller is better” quality characteristic, the size of the ball’s performance showed the larger delta (∆) value compared to other parameters. This is evidence that the size of balls showed the greatest influential parameter in the ball milling process followed by milling time and milling speed. The greater delta (∆) values for a parameter, the effect of the parameter on the process will correspond to a smaller variance of the output and generate better performance of the experiment [24,25]. Therefore, the size of the ball’s performance was the most significant parameter for producing POA nanoparticles.
Table 4.
Signal to noise ratio for each parameter and level.
3.2. The Influence of the Studied Parameters on the Responses
The unpredictable effects of the processing parameters on POA particle size are shown in Figure 6. According to the main effect of the S/N ratio presented in Figure 6, the effects on the production of POA nanoparticles increase with higher milling time. Despite the milling time considered as an influential parameter in this process, nevertheless with longer milling time, the POA particles tend to agglomerate due to the rapid reduction of POA size and would be challenging to analyze by particle size analyzer. This is also supported by Goya [26], where nanoparticles tend to agglomerate and are challenging to disperse even though using the ultrasonic treatment. Moreover, there is a possibility of powder contamination due to chipping or breakage from the stainless steel ball and the inner wall of the milling jar. As tested by Kumar and Kumar [27], an increase of milling time will affect mineralogy and physicochemical of POA due to the creation of new surface and particle breakage, which undergoes structural changes and mechanical activation.
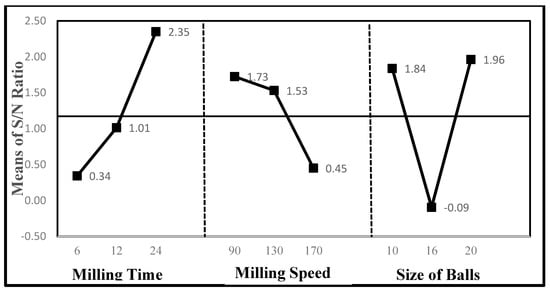
Figure 6.
Main effects of S/N ratio for POA particles size versus the level of input parameters.
Lower milling speed, as illustrated in Figure 6, showed a higher impact on the production of POA nanoparticles. In the ball milling process, rotational at higher speed could affect the particle size distribution and particle characteristics. Findings from [16] revealed that heat would be produced due to impact and abrasion between balls and milling jar walls. Hence, the energy input into the powders will increase and could deform the properties of particles. Additionally, the high temperatures generated may also contaminate the transformations of powders. As reported by Suryanarayana [28], higher milling intensities could increase the average crystal size due to the enhanced dynamical recrystallization. However, there are certain limitations to the maximum speed that could be engaged depending on the design of the mill and milling jar. In fact, almost all researchers applied more than 100 rpm even higher up to 2000 rpm to produce nanoparticles [29]. Though, the ball milling practice beyond the maximum speed limit will cause the balls to pin to the inner wall of the milling jar and could not produce any impact force.
In the meantime, an increase in the size of balls in the ball milling process, as illustrated in Figure 6, showed a significant effect in producing POA nanoparticles. The ball size is a critical parameter influencing the performance of a ball milling process. It is well known that to produce effective breakage of large particles, larger balls are needed, whereas smaller balls are needed for the effective breakage of fine particles. The optimization of balls size was very limited due to variables data obtained from the previous experiment. Nevertheless, research by Nkwanyana and Loveday [30] found out that using a larger size of balls would contribute minimal impact on the rate production of particles. Based on the effect of product fineness study by Fuerstenau, Lutch [31], to produce the finer particle distribution, the higher quantity of smaller balls are needed. This was due to the total expended energy between balls and particles that assist the deagglomeration of the fine particles. According to Cho and Kwon [32], to ensure the milling efficiency of materials, a comprehensive investigation should be carried out to delineate the potential optimum parameters influencing the distribution of particles such as mill rotational speed, mill speed, mill diameter, and powder filling.
3.3. Analysis of Variance (ANOVA) Approach
ANOVA is one of the statistical models approach by using computational techniques to detect the performance of factors and their interactions by comparing the percentage of contribution of each parameter to the response [33]. The primary purpose of applying ANOVA is to investigate which design parameters significantly affect the quality characteristic. Thus, it can be decided which independent factor dominates over the other and the percentage contribution of that particular independent variable. This analysis is measured by the sum of the squared deviations from the total mean signal to noise ratios (S/N) to obtain which parameters significantly affect the preparation of POA nanoparticles. Statistically, there is a tool called the F-test, which was named in honour of Sir Ronald Fisher. The F-test was conducted to see which design parameters have a significant effect on the quality characteristic. In this analysis, the F-ratio is a ratio of the mean square error to the residual error and is traditionally applied to determine the significance of a factor [34].
From the results of ANOVA, the last column in Table 5 illustrated the percentage contribution of each parameter. Percentage (%) contribution is defined as the significant rate of the process parameters and larger values represent a more significant effect on the preparation of POA nanoparticles. It can be observed that the size of balls has the most significant effect with 43.42% contribution, followed by milling time (34.08%) contribution, and milling speed (15.39%) contribution. However, the significant effect of the relationship between parameters could be seen in contributing factors (%). It is observed that contributing factors (%) reveal there was an interaction effect of process parameters. Moreover, this theory supported by Sharma and Chattopadhyaya [35] found out that the more significant the contributions of a particular factor to the total sum of squares, the larger the ability is of that factor to influence process parameters.
Table 5.
Results of ANOVA approach to prepare POA nanoparticles.
The optimization results from the combination of parameters, which were predicted as 20 mm of ball’s size, 24 h milling time, and 100 rpm on milling speed, must be supported through the confirmation test. The confirmation experiments were conducted to validate the optimal parameters obtained by the Taguchi method. This test aims to validate the optimal process parameters and to show how close the respective prediction with the real experiment is. Moreover, the confirmation test is highly recommended by Taguchi to verify the accuracy of the optimal process parameters that have been selected. Under these conditions, to validate the palm oil ash (POA) properties, the particle size distribution and morphology characteristics were carried out by particle size analyzer and TEM micrograph, respectively.
3.4. Characteristic of Palm Oil Ash Morphology and Particle Size Distribution
The particle size distribution of the POA nanoparticles under predicted optimal condition from the Taguchi method was illustrated in the histogram graph in Figure 7. A study by Akbari and Tavandashti [36] proposed that to obtain reliable and valid frequency versus particle size curve, hundreds of particles should be measured for an optimum sample size. The histogram graph for particle size distribution shows the intensity or frequency versus the size range typically. It was observed that the majority of the POA particle size distributed between 70–110 nm of particle sizes. From the histogram profile, the average diameter of the POA nanoparticles was estimated to be 80 nm. The smallest particles were obtained with the lowest intensity and were estimated to be eight (8) nm. Meanwhile, the largest particles exhibited at 0.2% intensity were estimated to be 200 nm. Although the histogram reveals the POA nanoparticle’s distribution, the information is still inadequate to characterize the behaviour of the POA nanoparticles. Moreover, the distribution of the POA nanoparticles probably influences by the agglomeration resulting in variation of POA nanoparticles sizes. This behaviour occurred because of the robust and attractive interaction between nanoparticles derived from strong Van Der Waals force. A recent study by Aqeel Ashraf and Peng [37] revealed that a high concentration of nanoparticles with extraordinary surface area commonly aggregated more rapidly, hence formed larger nanoparticles. Therefore, the preparation of POA nanoparticles mainly depends on the optimal parameters that could increase the number of nanoparticles and significantly decrease the agglomeration of nanoparticles. Thus, transmission electron microscope will be used to view the image of POA nanoparticles individually.
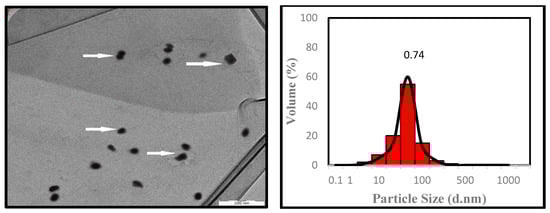
Figure 7.
TEM micrograph (200 nm) and particle size distribution graph of palm oil ash nanoparticles.
Transmission electron microscope (TEM) micrograph visualized the morphology and distribution of POA nanoparticles. Moreover, the TEM image supplies quantitative information about the shape, size, and distribution of particles on a very local scale. Figure 7 showed the TEM image of POA nanoparticles, which is in accordance with the particle size distribution, which is evaluated by laser diffraction particle size analyzer. From the TEM image, the POA nanoparticles appear in black colour. The black colour was probably due to that less transparent towards electron beam and electronic density of POA nanoparticles element as reported by Pishvaei, Farshchi [38], Yazdimamaghani, and Pourvala [39]. The TEM micrograph reveals that the POA nanoparticles possess an irregular size and uniformly distributed within 70 to 200 nm range without having agglomeration. This similar finding also reported by Abdul Khalil and Rus Mahayuni [11] that ground POA particles had an irregular shape and the size was measured less than 50 nm. In addition, within that nanometric range, there was slightly an agglomeration that occurred between POA nanoparticles. It was assumed that the agglomeration occurred between POA nanoparticles due to the increase in surface area and energy of POA nanoparticles. In this study, the ball milling process involved complex mechanical forces such as particles that are repeatedly fractured and flattened. In the case of the spherical shape of POA nanoparticles that can be observed in the TEM image, it is probably due to the balanced formation of milling force between balls, milling jar, and POA particles. Hence, the POA particles resist being fractured and flattened, causing particles to obtain a size more than 100 nm. Therefore, the confirmation test indicated that the results obtained from the selection of optimal parameters could produce a significant size of palm oil ash (POA) nanoparticles. The results confirming the success of Taguchi statistical analysis in obtaining optimal parameters to produce POA nanoparticles were presented in Table 6.
Table 6.
Optimum parameters.
4. Conclusions
The design of the experiment by the Taguchi method has been applied to obtain optimum process parameters to produce palm oil ash (POA) nanoparticles using a horizontal ball milling technique and analyzed with the Taguchi L9 orthogonal array. From the statistical design experiment, the results were analyzed using a signal to noise (S/N) ratio to identify the optimum parameters. The most significant parameter on the production of POA nanoparticle is the size of balls followed by the milling time and milling speed, respectively. The optimum size of balls in this experiment is 20 mm, while the optimum milling time is 24 h, followed by 100 rpm on milling speed parameter. The analysis of the experimental design was conducted to verify the optimal ball milling parameters. The percentage contributions of the size of balls, milling speed, and milling time are 43.42%, 34.08%, and 15.39%, respectively. In addition, the confirmation test using predicted optimum parameters by the Taguchi method show the evidence of POA nanoparticles in particle size distribution and morphology analysis. Hence, significant improvements in the preparation of POA nanoparticles performed by the Taguchi method bring out the best process parameters. It can be a beneficial practice for use in the industries to optimize productivity performance with minimum cost and loss of time.
Author Contributions
Conceptualization, S.R., H.P.S.A.K., and C.K.A.; Methodology, C.K.A. and S.R.; Software, N.G.O.; Validation, S.R. and N.A.S.A.; Formal analysis, C.K.A.; Investigation, C.K.A., S.R., and I.Z.; Data curation, C.K.A.; Writing—original draft preparation, C.K.A. and H.P.S.A.K.; Writing—review and editing, I.S.; Supervision, H.P.S.A.K.; Project administration, C.K.A. and H.P.S.A.K.; Funding acquisition, H.P.S.A.K. All authors have read and agree to the published version of the manuscript.
Funding
This research was funded by Universiti Sains Malaysia Grant, RUI: 1001/PTEKIND/8014119 and WCP 294 T/46/D2.3/KK.04.05/2019.
Acknowledgments
This work was financially supported by the Ministry Research, Technology and Higher 293 Education of Republic of Indonesia by World Class Professor (WCP), Programme scheme No 294 T/46/D2.3/KK.04.05/2019. The researchers would like to thank the collaboration between the Department of Mechanical Engineering and Department of Chemical Engineering, Universitas Syiah Kuala, Banda Aceh 23111, Indonesia; Department of Chemical Engineering, Universitas Sumatera Utara, Medan 20155, Indonesia, Department of Industrial Engineering, Universitas Serambi Mekkah Banda Aceh 23245, Indonesia and School of Industrial Technology, Universiti Sains Malaysia, Penang, Malaysia that has made this work possible.
Conflicts of Interest
The authors declare no conflict of interest.
References
- Hameed, B.H.; Ahmad, A.A.; Aziz, N. Isotherms, kinetics and thermodynamics of acid dye adsorption on activated palm ash. Chem. Eng. J. 2007, 133, 195–203. [Google Scholar] [CrossRef]
- Ismail, M.; Ismail, M.E.; Muhammad, B. Influence of elevated temperatures on physical and compressive strength properties of concrete containing palm oil fuel ash. Constr. Build. Mater. 2011, 25, 2358–2364. [Google Scholar] [CrossRef]
- Boey, P.-L.; Ganesan, S.; Lim, S.-X.; Lim, S.-L.; Maniam, G.P.; Khairuddean, M. Utilization of BA (boiler ash) as catalyst for transesterification of palm olein. Energy 2011, 36, 5791–5796. [Google Scholar] [CrossRef]
- Khankhaje, E.; Hussin, M.W.; Mirza, J.; Rafieizonooz, M.; Salim, M.R.; Siong, H.C.; Warid, M.N.M. On blended cement and geopolymer concretes containing palm oil fuel ash. Mater. Des. 2016, 89, 385–398. [Google Scholar] [CrossRef]
- Ul Islam, M.M.; Mo, K.H.; Alengaram, U.J.; Jumaat, M.Z. Durability properties of sustainable concrete containing high volume palm oil waste materials. J. Clean. Prod. 2016, 137, 167–177. [Google Scholar] [CrossRef]
- Khankhaje, E.; Rafieizonooz, M.; Salim, M.R.; Khan, R.; Mirza, J.; Siong, H.C. Sustainable clean pervious concrete pavement production incorporating palm oil fuel ash as cement replacement. J. Clean. Prod. 2018, 172, 1476–1485. [Google Scholar] [CrossRef]
- Chu, K.H.; Hashim, M.A. Adsorption and desorption characteristics of zinc on ash particles derived from oil palm waste. J. Chem. Technol. Biotechnol. 2002, 77, 685–693. [Google Scholar] [CrossRef]
- Zainudin, N.F.; Lee, K.T.; Kamaruddin, A.H.; Bhatia, S.; Mohamed, A.R. Study of adsorbent prepared from oil palm ash (OPA) for flue gas desulfurization. Sep. Purif. Technol. 2005, 45, 50–60. [Google Scholar] [CrossRef]
- Abdul Khalil, H.P.S.; Fizree, H.M.; Bhat, A.H.; Jawaid, M.; Abdullah, C.K. Development and characterization of epoxy nanocomposites based on nano-structured oil palm ash. Compos. Part B Eng. 2013, 53, 324–333. [Google Scholar] [CrossRef]
- Abdul Khalil, H.P.S.; Fizree, H.M.; Jawaid, M.; Alattas, O.S. Preparation and characterization of nano structured materials from oil palm ash: A bio-agricultural waste from oil palm mill. BioResources 2011, 6, 4537–4546. [Google Scholar]
- Abdul Khalil, H.P.S.; Rus Mahayuni, A.R.; Rudi, D.; Almulali, M.Z.; Abdullah, C.K. Characterization of various organic waste nanofillers obtained from oil palm ash. BioResources 2012, 7, 5771–5780. [Google Scholar]
- Muñoz, J.E.; Cervantes, J.; Esparza, R.; Rosas, G. Iron nanoparticles produced by high-energy ball milling. J. Nanopart. Res. 2007, 9, 945–950. [Google Scholar] [CrossRef]
- Russo, L.; Colangelo, F.; Cioffi, R.; Rea, I.; Stefano, L.D. A Mechanochemical Approach to Porous Silicon Nanoparticles Fabrication. Materials 2011, 4, 1023–1033. [Google Scholar] [CrossRef] [PubMed]
- Salah, N.; Habib, S.S.; Khan, Z.H.; Memic, A.; Azam, A.; Alarfaj, E.; Zahed, N.; Al-Hamedi, S. High-energy ball milling technique for ZnO nanoparticles as antibacterial material. Int. J. Nanomed. 2011, 6, 863–869. [Google Scholar] [CrossRef] [PubMed]
- Watanabe, H. Critical rotation speed for ball-milling. Powder Technol. 1999, 104, 95–99. [Google Scholar] [CrossRef]
- Enqvist, E.; Ramanenka, D.; Marques, P.A.; Gracio, J.; Emami, N. The effect of ball milling time and rotational speed on ultra high molecular weight polyethylene reinforced with multiwalled carbon nanotubes. Polym. Compos. 2016, 37, 1128–1136. [Google Scholar] [CrossRef]
- Kutuk, S. Influence of milling parameters on particle size of ulexite material. Powder Technol. 2016, 301, 421–428. [Google Scholar] [CrossRef]
- Patil, A.G.; Anandhan, S. Influence of planetary ball milling parameters on the mechano-chemical activation of fly ash. Powder Technol. 2015, 281, 151–158. [Google Scholar] [CrossRef]
- Gaitonde, V.; Karnik, S.; Davim, J.P. Taguchi multiple-performance characteristics optimization in drilling of medium density fibreboard (MDF) to minimize delamination using utility concept. J. Mater. Process. Technol. 2008, 196, 73–78. [Google Scholar] [CrossRef]
- Yang, W.p.; Tarng, Y. Design optimization of cutting parameters for turning operations based on the Taguchi method. J. Mater. Process. Technol. 1998, 84, 122–129. [Google Scholar] [CrossRef]
- Li, C.; Fan, Z.; Wu, S.; Li, Y.; Gan, Y.; Zhang, A. Effect of carbon black nanoparticles from the pyrolysis of discarded tires on the performance of asphalt and its mixtures. Appl. Sci. 2018, 8, 624. [Google Scholar] [CrossRef]
- Hubenthal, F.; Blázquez Sánchez, D.; Träger, F. Determination of morphological parameters of supported gold nanoparticles: Comparison of AFM combined with optical spectroscopy and theoretical modeling versus TEM. Appl. Sci. 2012, 2, 566–583. [Google Scholar] [CrossRef]
- Akcay, K.; Sirkecioğlu, A.; Tatlıer, M.; Savaşçı, Ö.T.; Erdem-Şenatalar, A. Wet ball milling of zeolite HY. Powder Technol. 2004, 142, 121–128. [Google Scholar] [CrossRef]
- John, O.; Pamtoks, H.; Omolayo, M.P.; Adelana, R.A. Taguchi Optimization of Process Parameters on the Hardness and Impact Energy of Aluminium Alloy Sand Castings. Leonardo J. Sci. 2013, 12, 1–12. [Google Scholar]
- Külekcı, M.K. Analysis of process parameters for a surface-grinding process based on the Taguchi method. Mater. Tehnol. 2013, 47, 105–109. [Google Scholar]
- Goya, G.F. Handling the particle size and distribution of Fe3O4 nanoparticles through ball milling. Solid State Commun. 2004, 130, 783–787. [Google Scholar] [CrossRef]
- Kumar, S.; Kumar, R. Mechanical activation of fly ash: Effect on reaction, structure and properties of resulting geopolymer. Ceram. Int. 2011, 37, 533–541. [Google Scholar] [CrossRef]
- Suryanarayana, C. Mechanical alloying and milling. Prog. Mater. Sci. 2001, 46, 1–184. [Google Scholar] [CrossRef]
- Bilgili, E.; Hamey, R.; Scarlett, B. Production of pigment nanoparticles using a wet stirred mill with polymeric media. China Particuol. 2004, 2, 93–100. [Google Scholar] [CrossRef]
- Nkwanyana, S.; Loveday, B. Addition of pebbles to a ball-mill to improve grinding efficiency—Part 2. Miner. Eng. 2018, 128, 115–122. [Google Scholar] [CrossRef]
- Fuerstenau, D.W.; Lutch, J.J.; De, A. The effect of ball size on the energy efficiency of hybrid high-pressure roll mill/ball mill grinding. Powder Technol. 1999, 105, 199–204. [Google Scholar] [CrossRef]
- Cho, H.; Kwon, J.; Kim, K.; Mun, M. Optimum choice of the make-up ball sizes for maximum throughput in tumbling ball mills. Powder Technol. 2013, 246, 625–634. [Google Scholar] [CrossRef]
- Kharisma, A.; Murphiyanto, R.D.J.; Perdana, M.K.; Kasih, T.P. Application of Taguchi method and ANOVA in the optimization of dyeing process on cotton knit fabric to reduce re-dyeing process. In IOP Conference Series: Earth and Environmental Science; IOP Publishing: Bristol, UK, 2017; p. 012023. [Google Scholar]
- Kowalczyk, M. Application of Taguchi and Anova methods in selection of process parameters for surface roughness in precision turning of titanium. Adv. Manuf. Sci. Technol. 2014, 38, 2. [Google Scholar] [CrossRef]
- Sharma, V.; Chattopadhyaya, S.; Hloch, S. Multi response optimization of process parameters based on Taguchi—Fuzzy model for coal cutting by water jet technology. Int. J. Adv. Manuf. Technol. 2011, 56, 1019–1025. [Google Scholar] [CrossRef]
- Akbari, B.; Tavandashti, M.P.; Zandrahimi, M. Particle size characterization of nanoparticles–A practicalapproach. Iran. J. Mater. Sci. Eng. 2011, 8, 48–56. [Google Scholar]
- Aqeel Ashraf, M.; Peng, W.; Zare, Y.; Rhee, K.Y. Effects of Size and Aggregation/Agglomeration of Nanoparticles on the Interfacial/Interphase Properties and Tensile Strength of Polymer Nanocomposites. Nanoscale Res. Lett. 2018, 13, 214. [Google Scholar] [CrossRef] [PubMed]
- Pishvaei, M.; Farshchi, T.F. Synthesis of high solid content polyacrylate/nanosilica latexes via miniemulsion polymerization. Iran. Polym. J. 2010, 19, 707–716. [Google Scholar]
- Yazdimamaghani, M.; Pourvala, T.; Motamedi, E.; Fathi, B.; Vashaee, D.; Tayebi, L. Synthesis and characterization of encapsulated nanosilica particles with an acrylic copolymer by in situ emulsion polymerization using thermoresponsive nonionic surfactant. Materials 2013, 6, 3727–3741. [Google Scholar] [CrossRef]
© 2020 by the authors. Licensee MDPI, Basel, Switzerland. This article is an open access article distributed under the terms and conditions of the Creative Commons Attribution (CC BY) license (http://creativecommons.org/licenses/by/4.0/).