An Optimal Genetic Algorithm for Fatigue Life Control of Medium Carbon Steel in Laser Hardening Process


Abstract
Featured Application
Abstract
1. Introduction
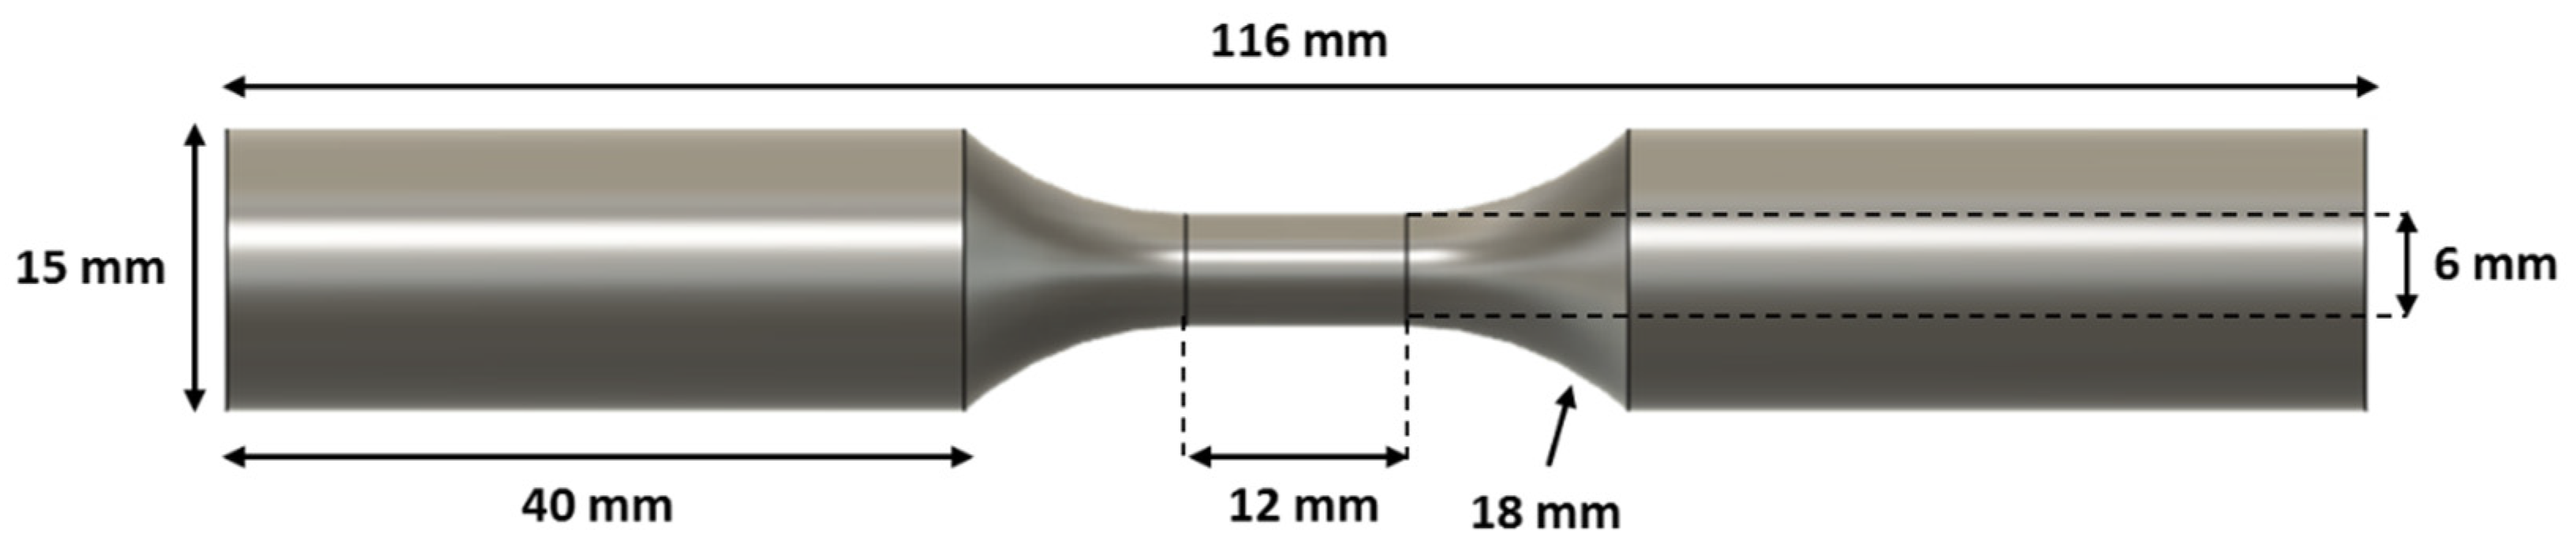
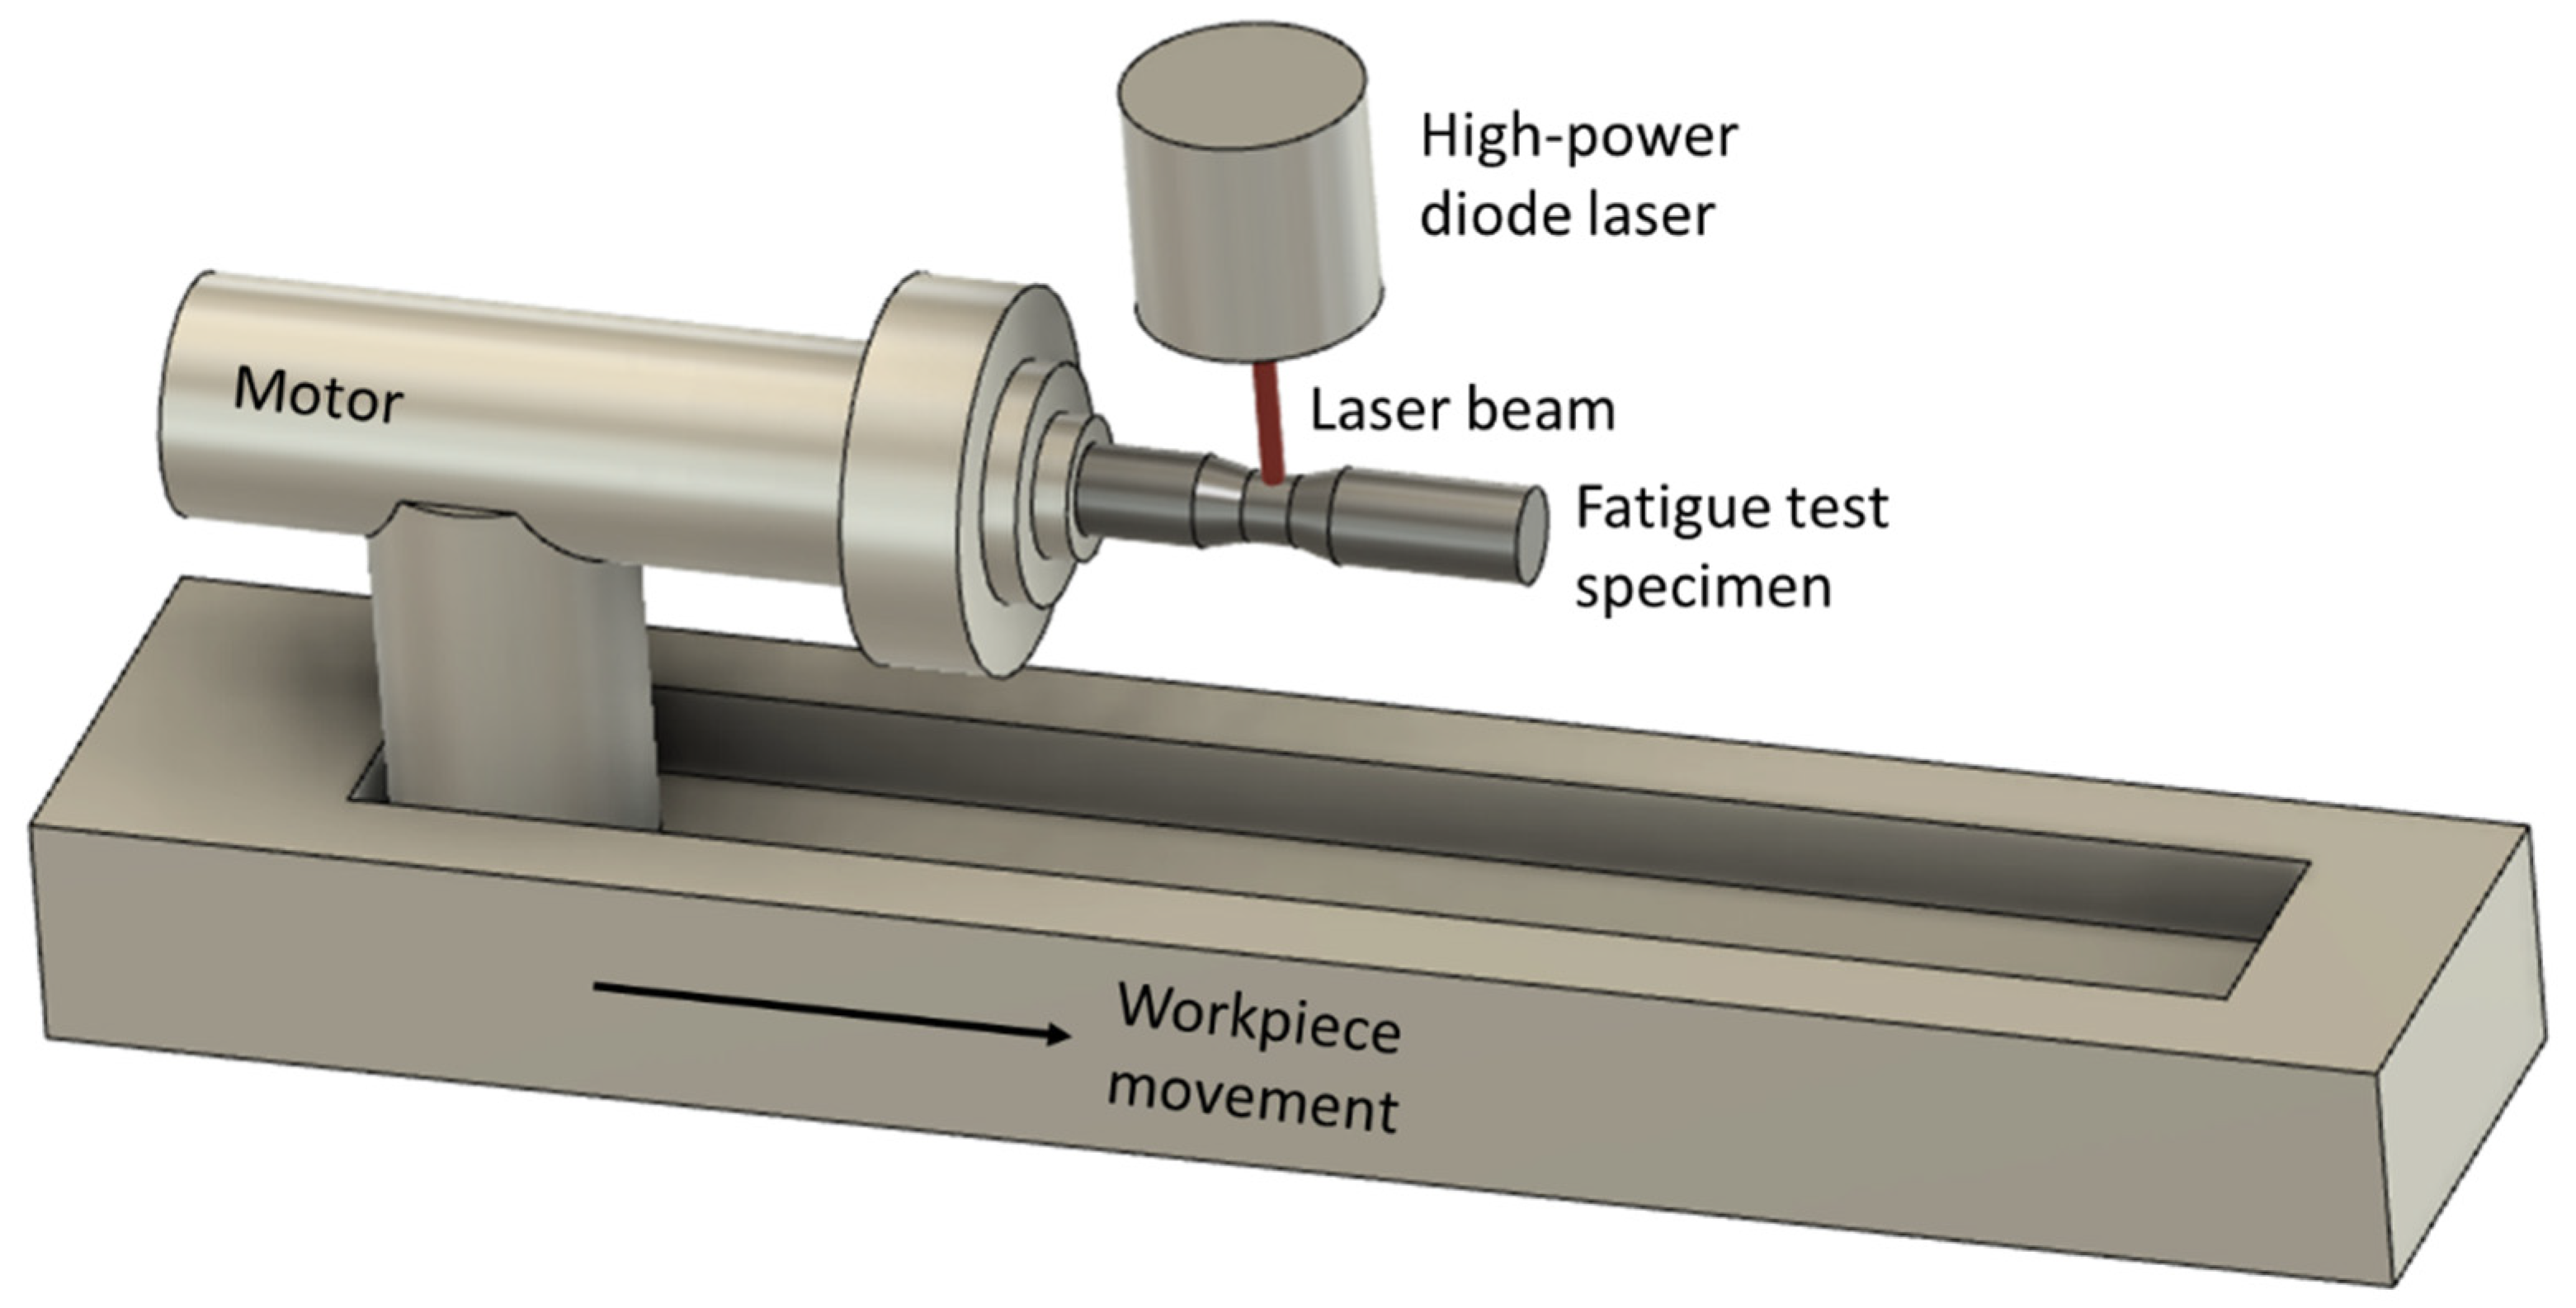
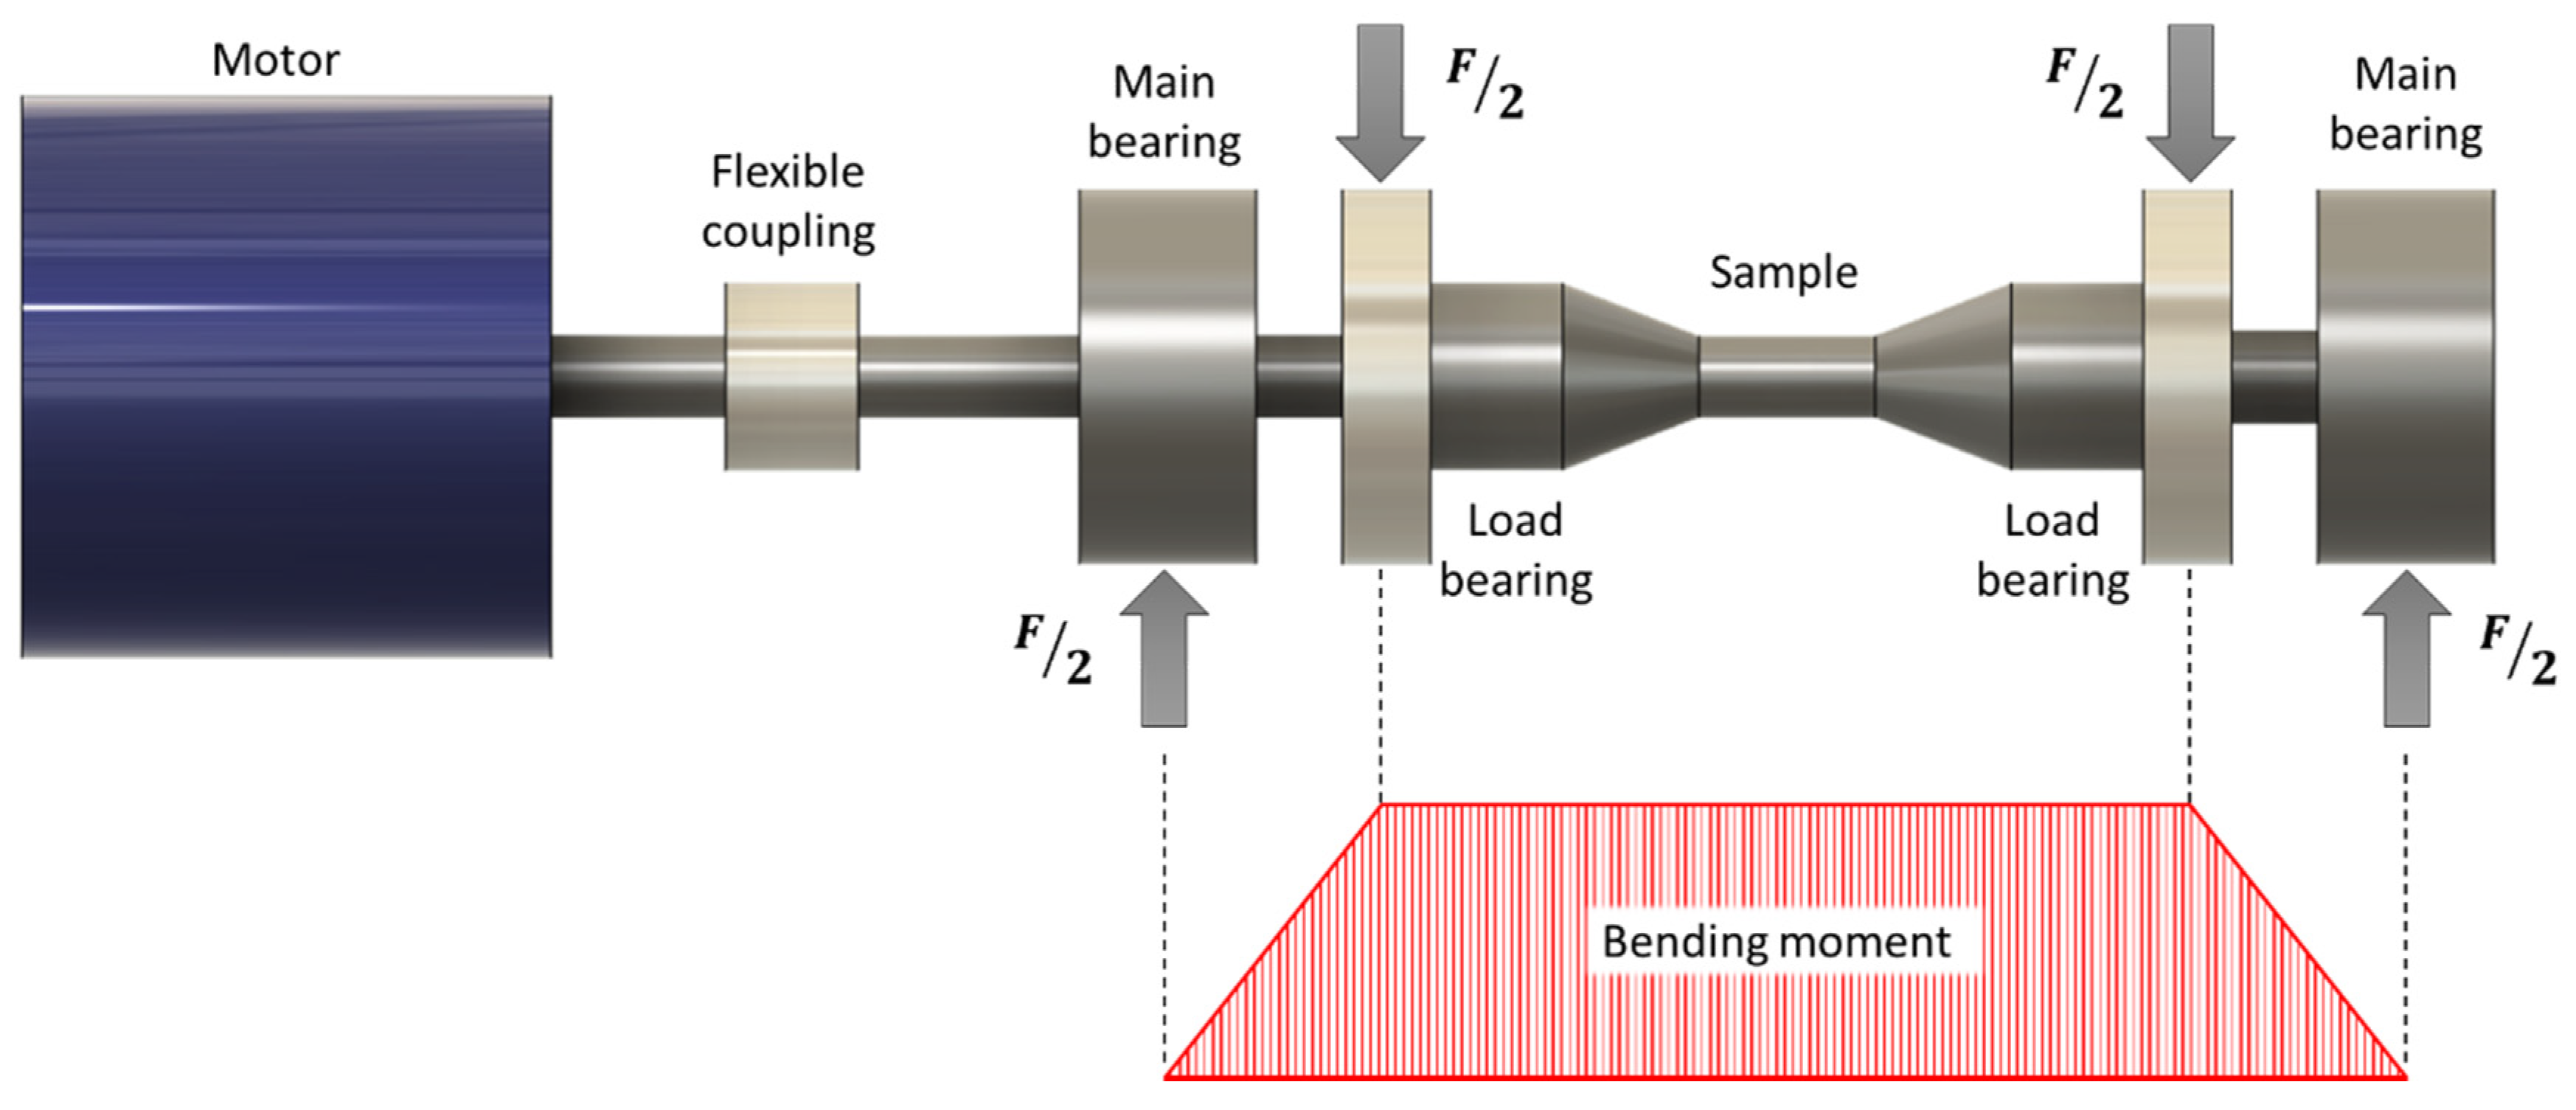
2. Materials and Methods
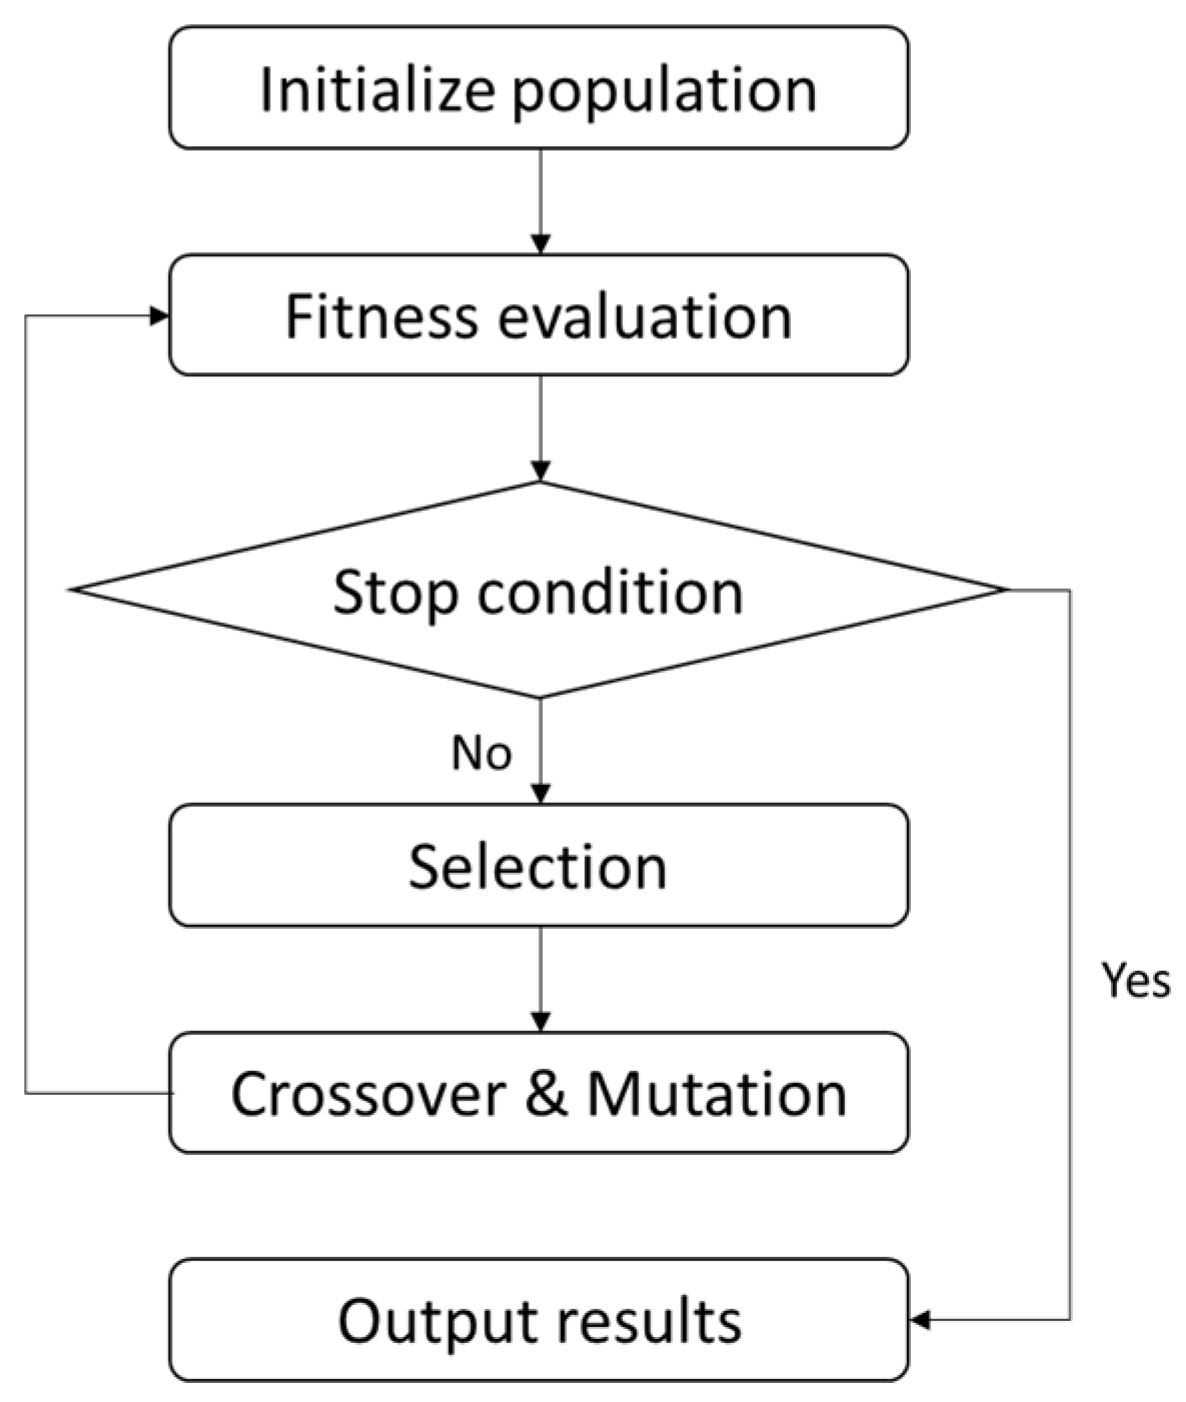
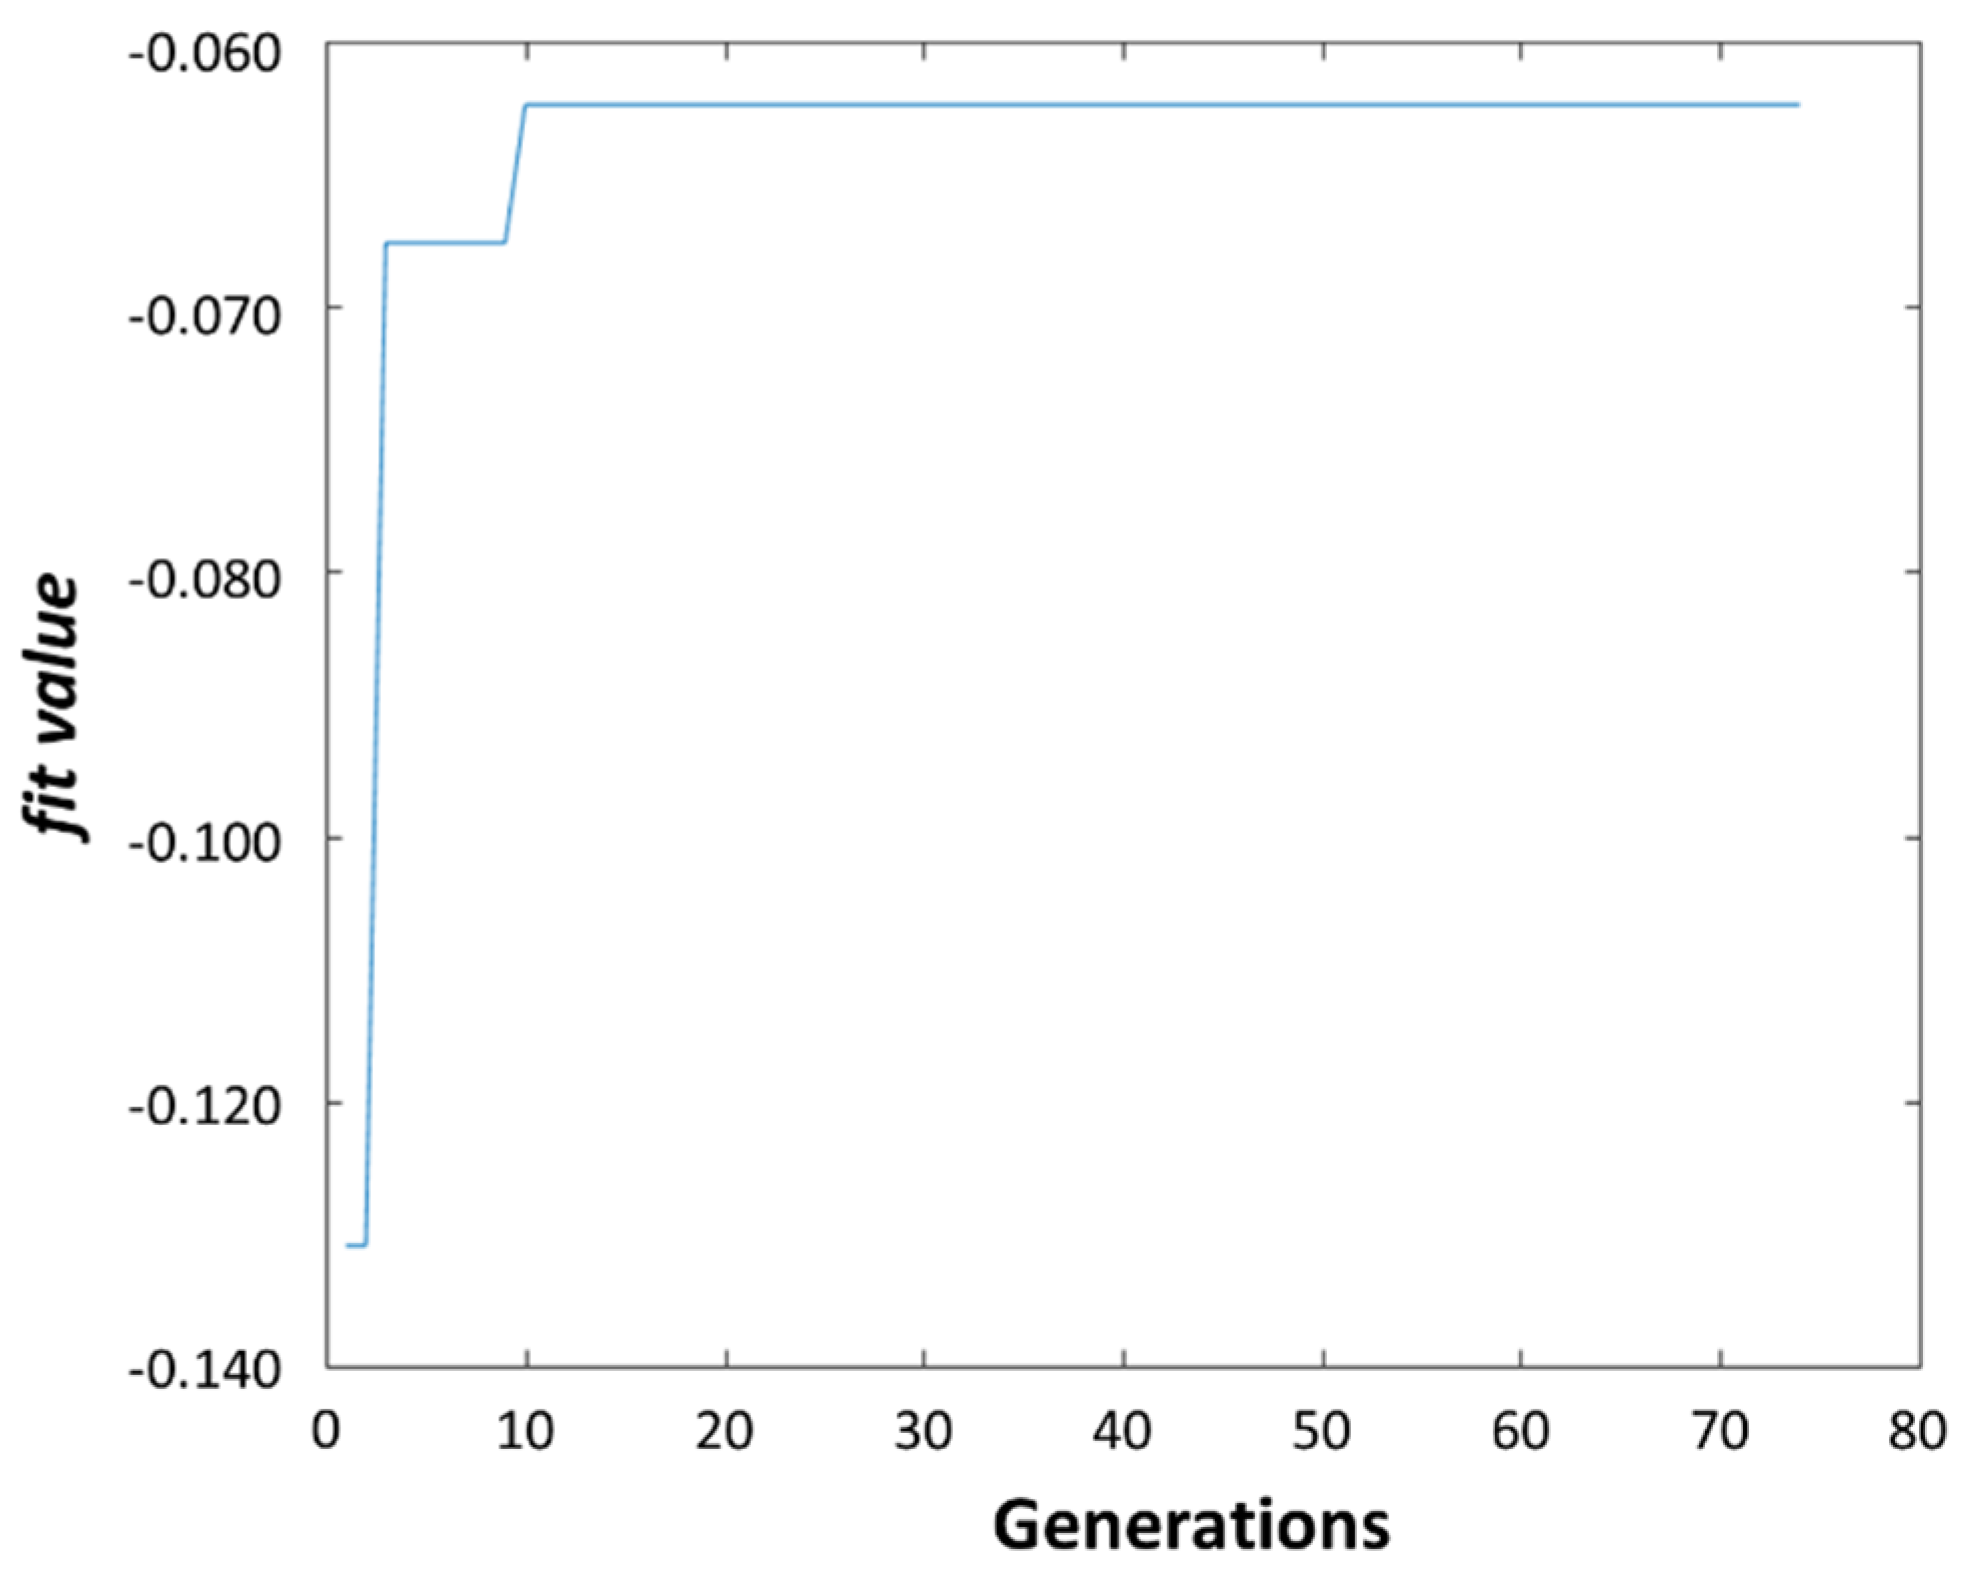
2.1. Computational Procedure
- during new generation, the selection operator decides which chromosomes in the population are transferred to the next one, while eliminating some of them. In this case, the decision is made using the ranking method. In particular, it implies the selection of the individuals by sorting them accordingly to their fitness values (see Equation (3)). Then, the best 50% individuals are chosen to mate, while the remaining 50% are eliminated. In order to maintain a constant number of individuals in the population, 50% new individuals are generated by applying either crossover or mutation operators to the best ones;
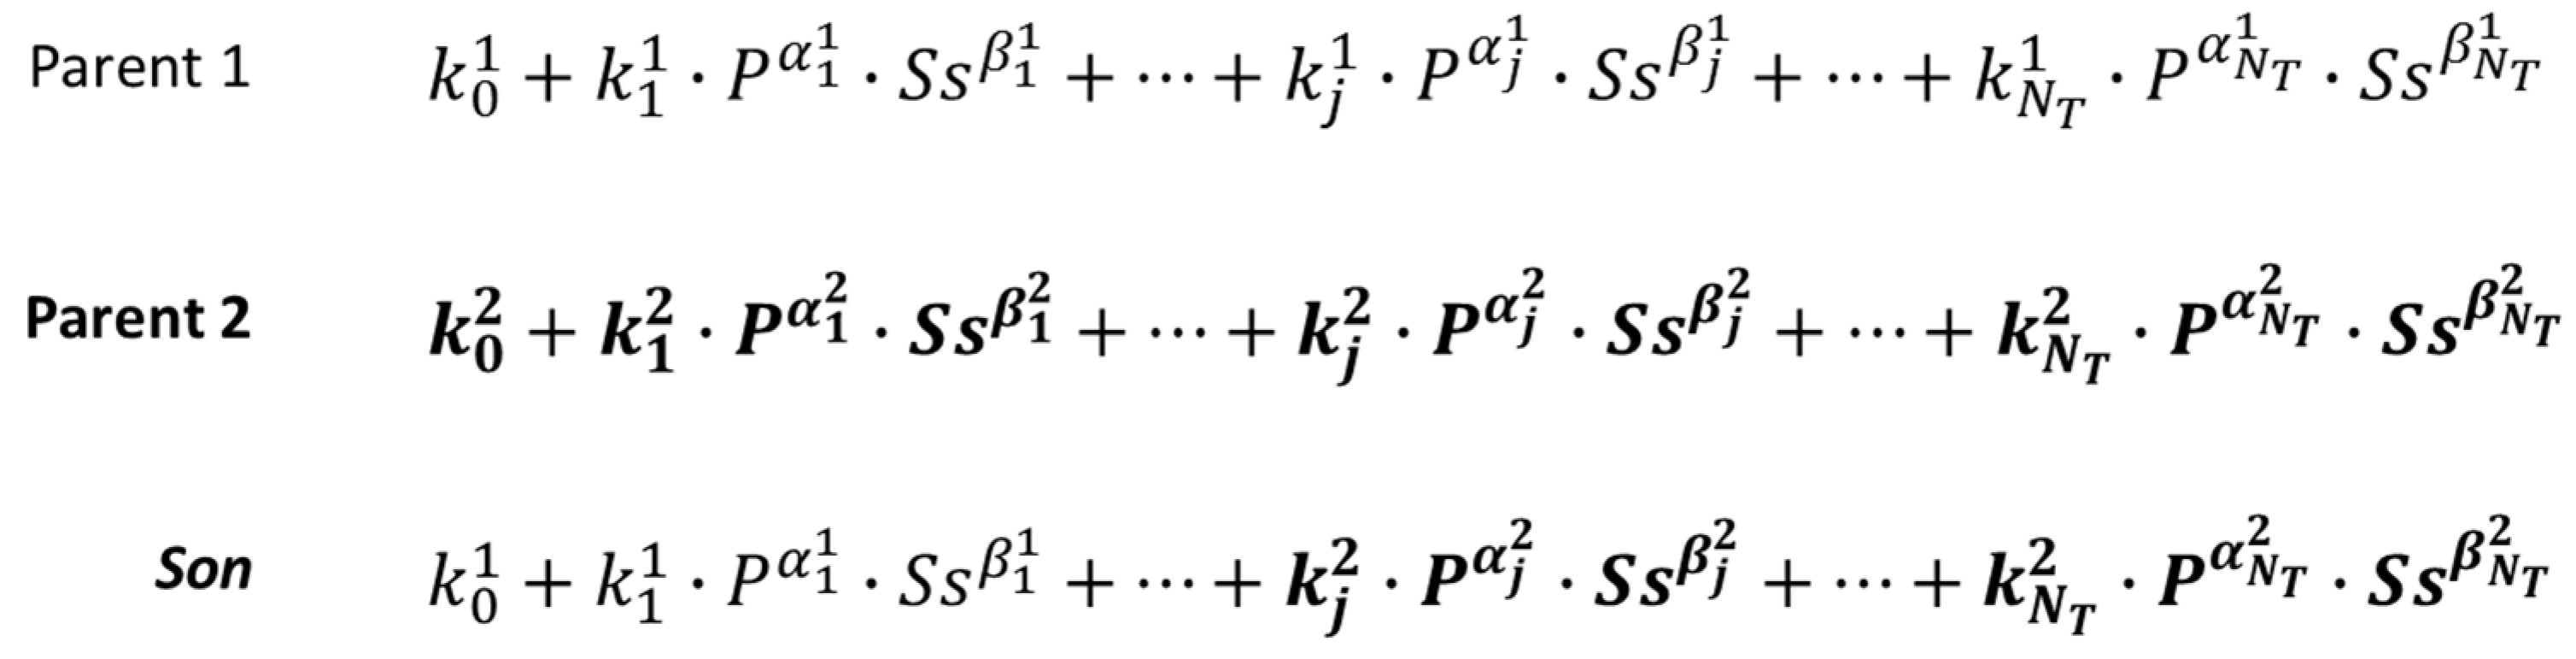
- the crossover operator increases the variability of the population by letting two random chromosomes, i.e., parents, to exchange genes between themselves, therefore producing a more powerful individual. Here, the random single-point crossover is considered and applied to every chromosome, as shown in Figure 6;
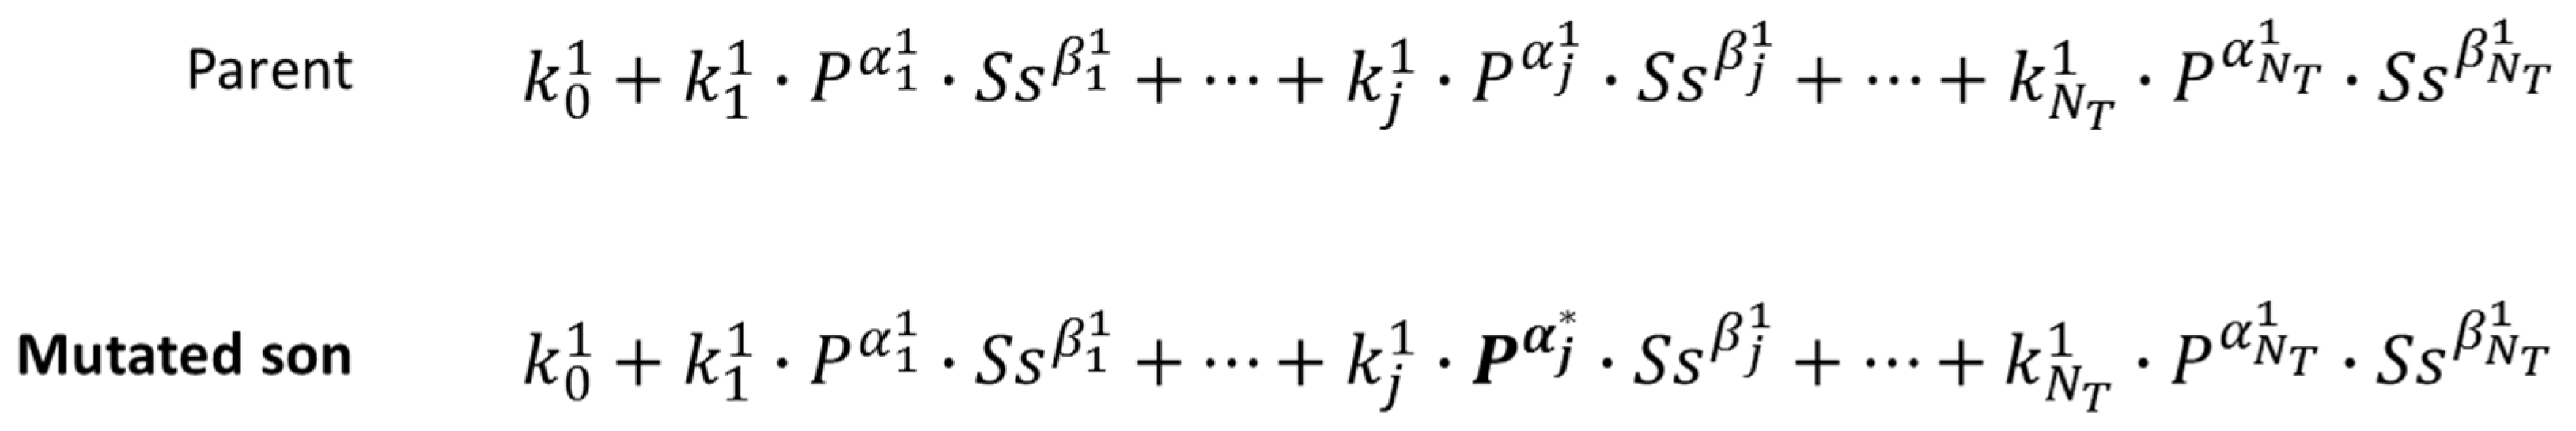
- the mutation operator is used to avoid local convergence of the genetic algorithm by introducing random variation in the genome of some individuals [32,39]. In fact, while increasing the number of generations, even if the crossover rate is high, chromosomes become more and more similar to each other, therefore blocking diversity and preventing the occurrence of more powerful generations [36]. In particular, the mutation operator only starts after some new generations with a fixed probability of occurrence. As in the case of the crossover, a random single-point mutation is considered (see Figure 7).
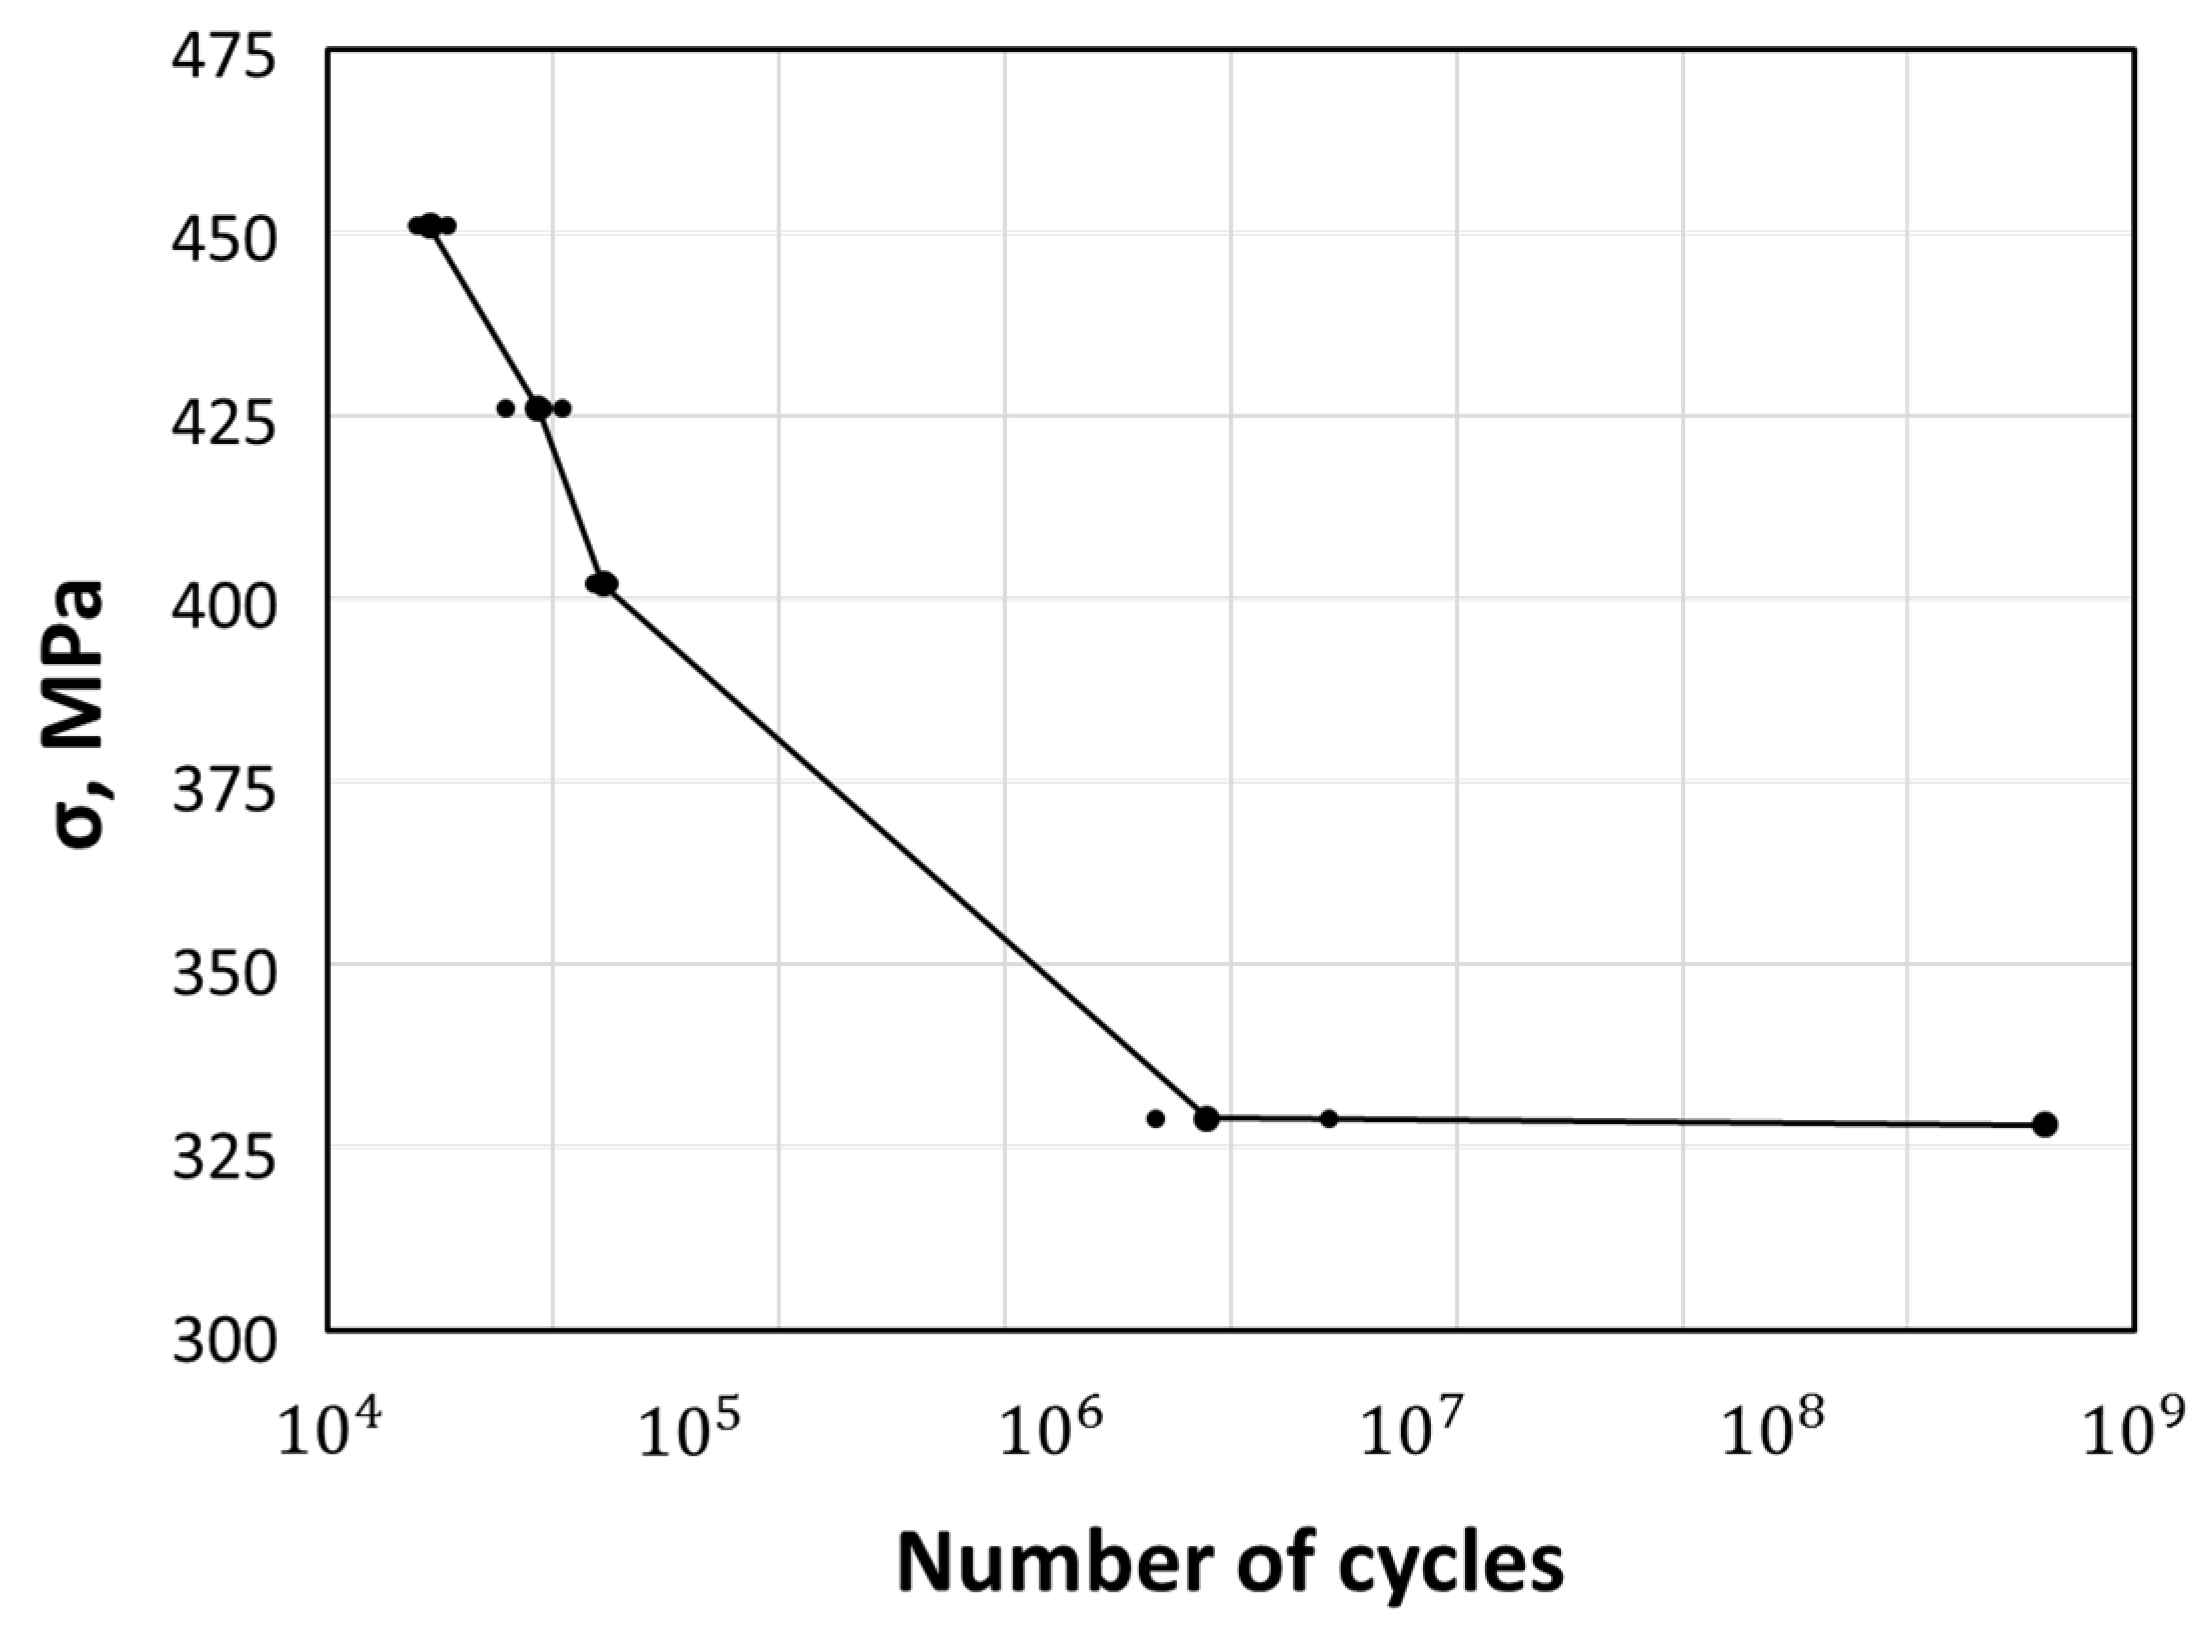
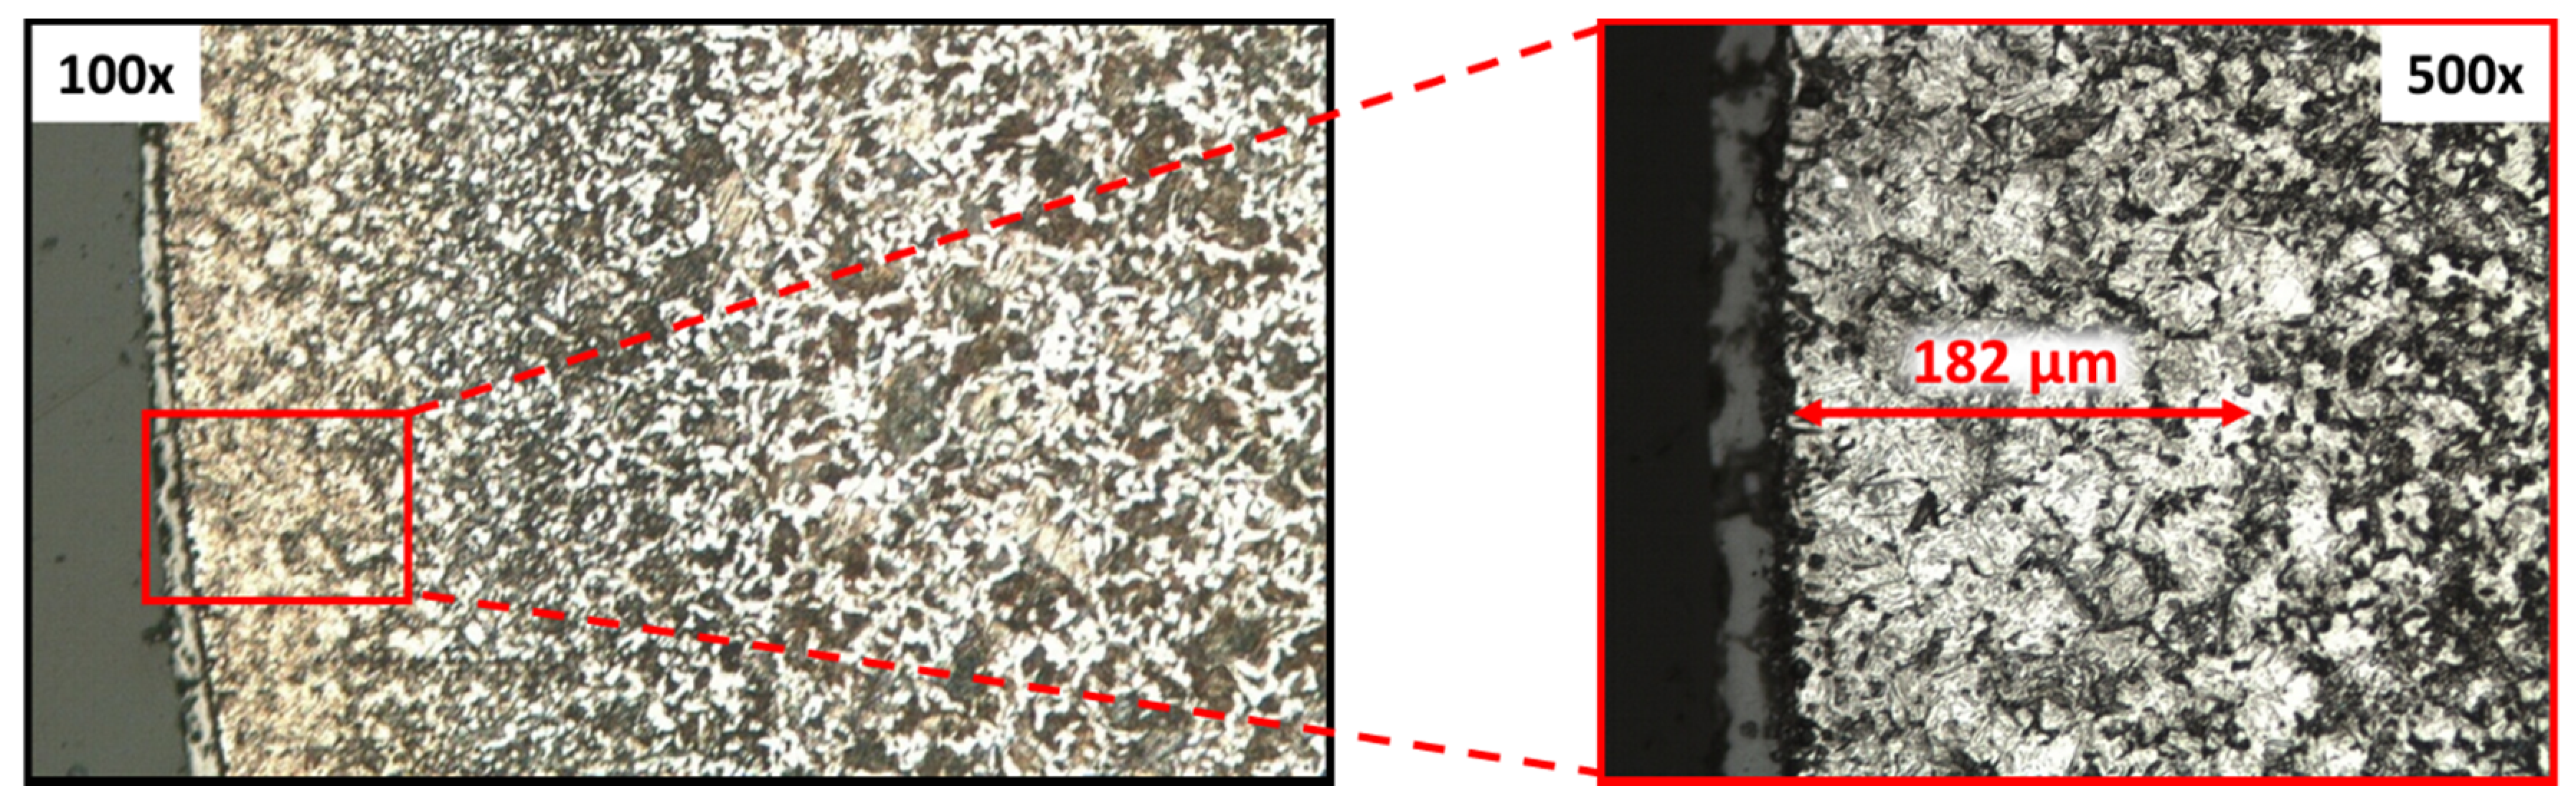
3. Results and Discussion
- laser treatments carried out at laser power lower than 150 W did not lead to significant changes in the substrates’ morphology and any grain structure modification was observed;
- the treatments at 150 and 200 W ensured the best performances. In fact, these process conditions led to a change in substrate properties without melting phenomena, especially with scan speed in the range 16 to 20 mm/s;
- when increasing the laser power to 250 or 300 W, surface melting was observed regardless of the scanning speed.
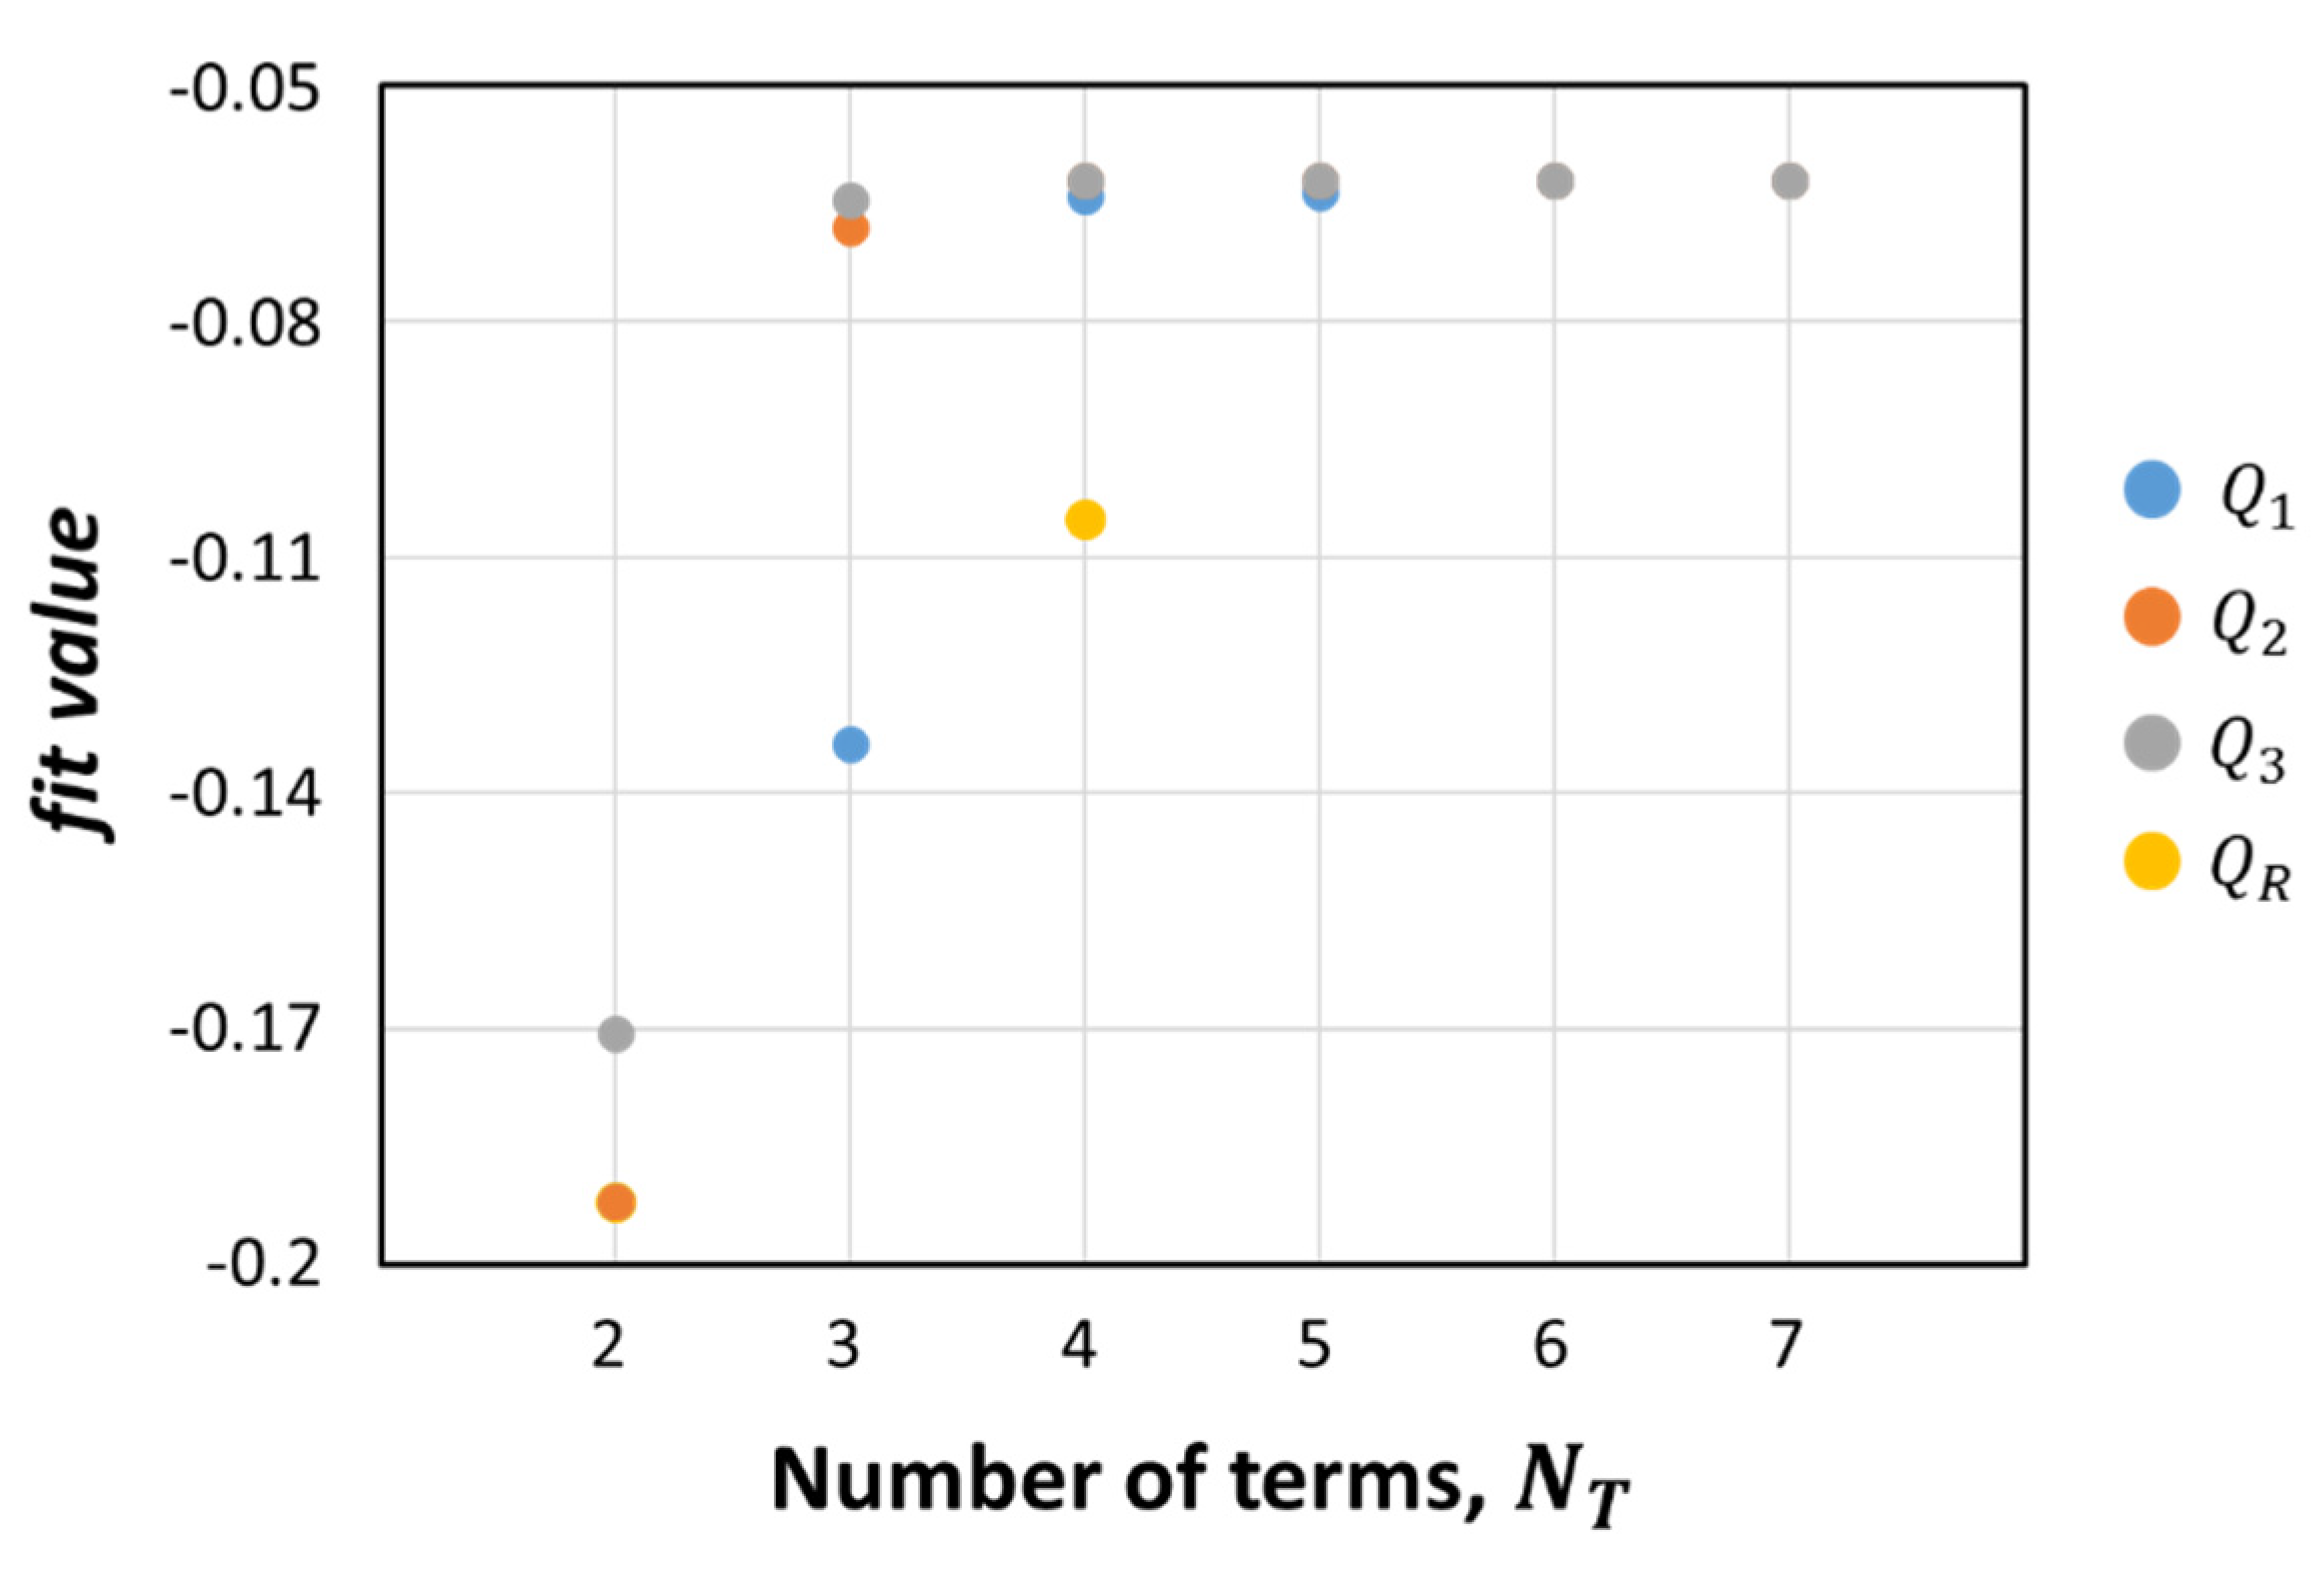
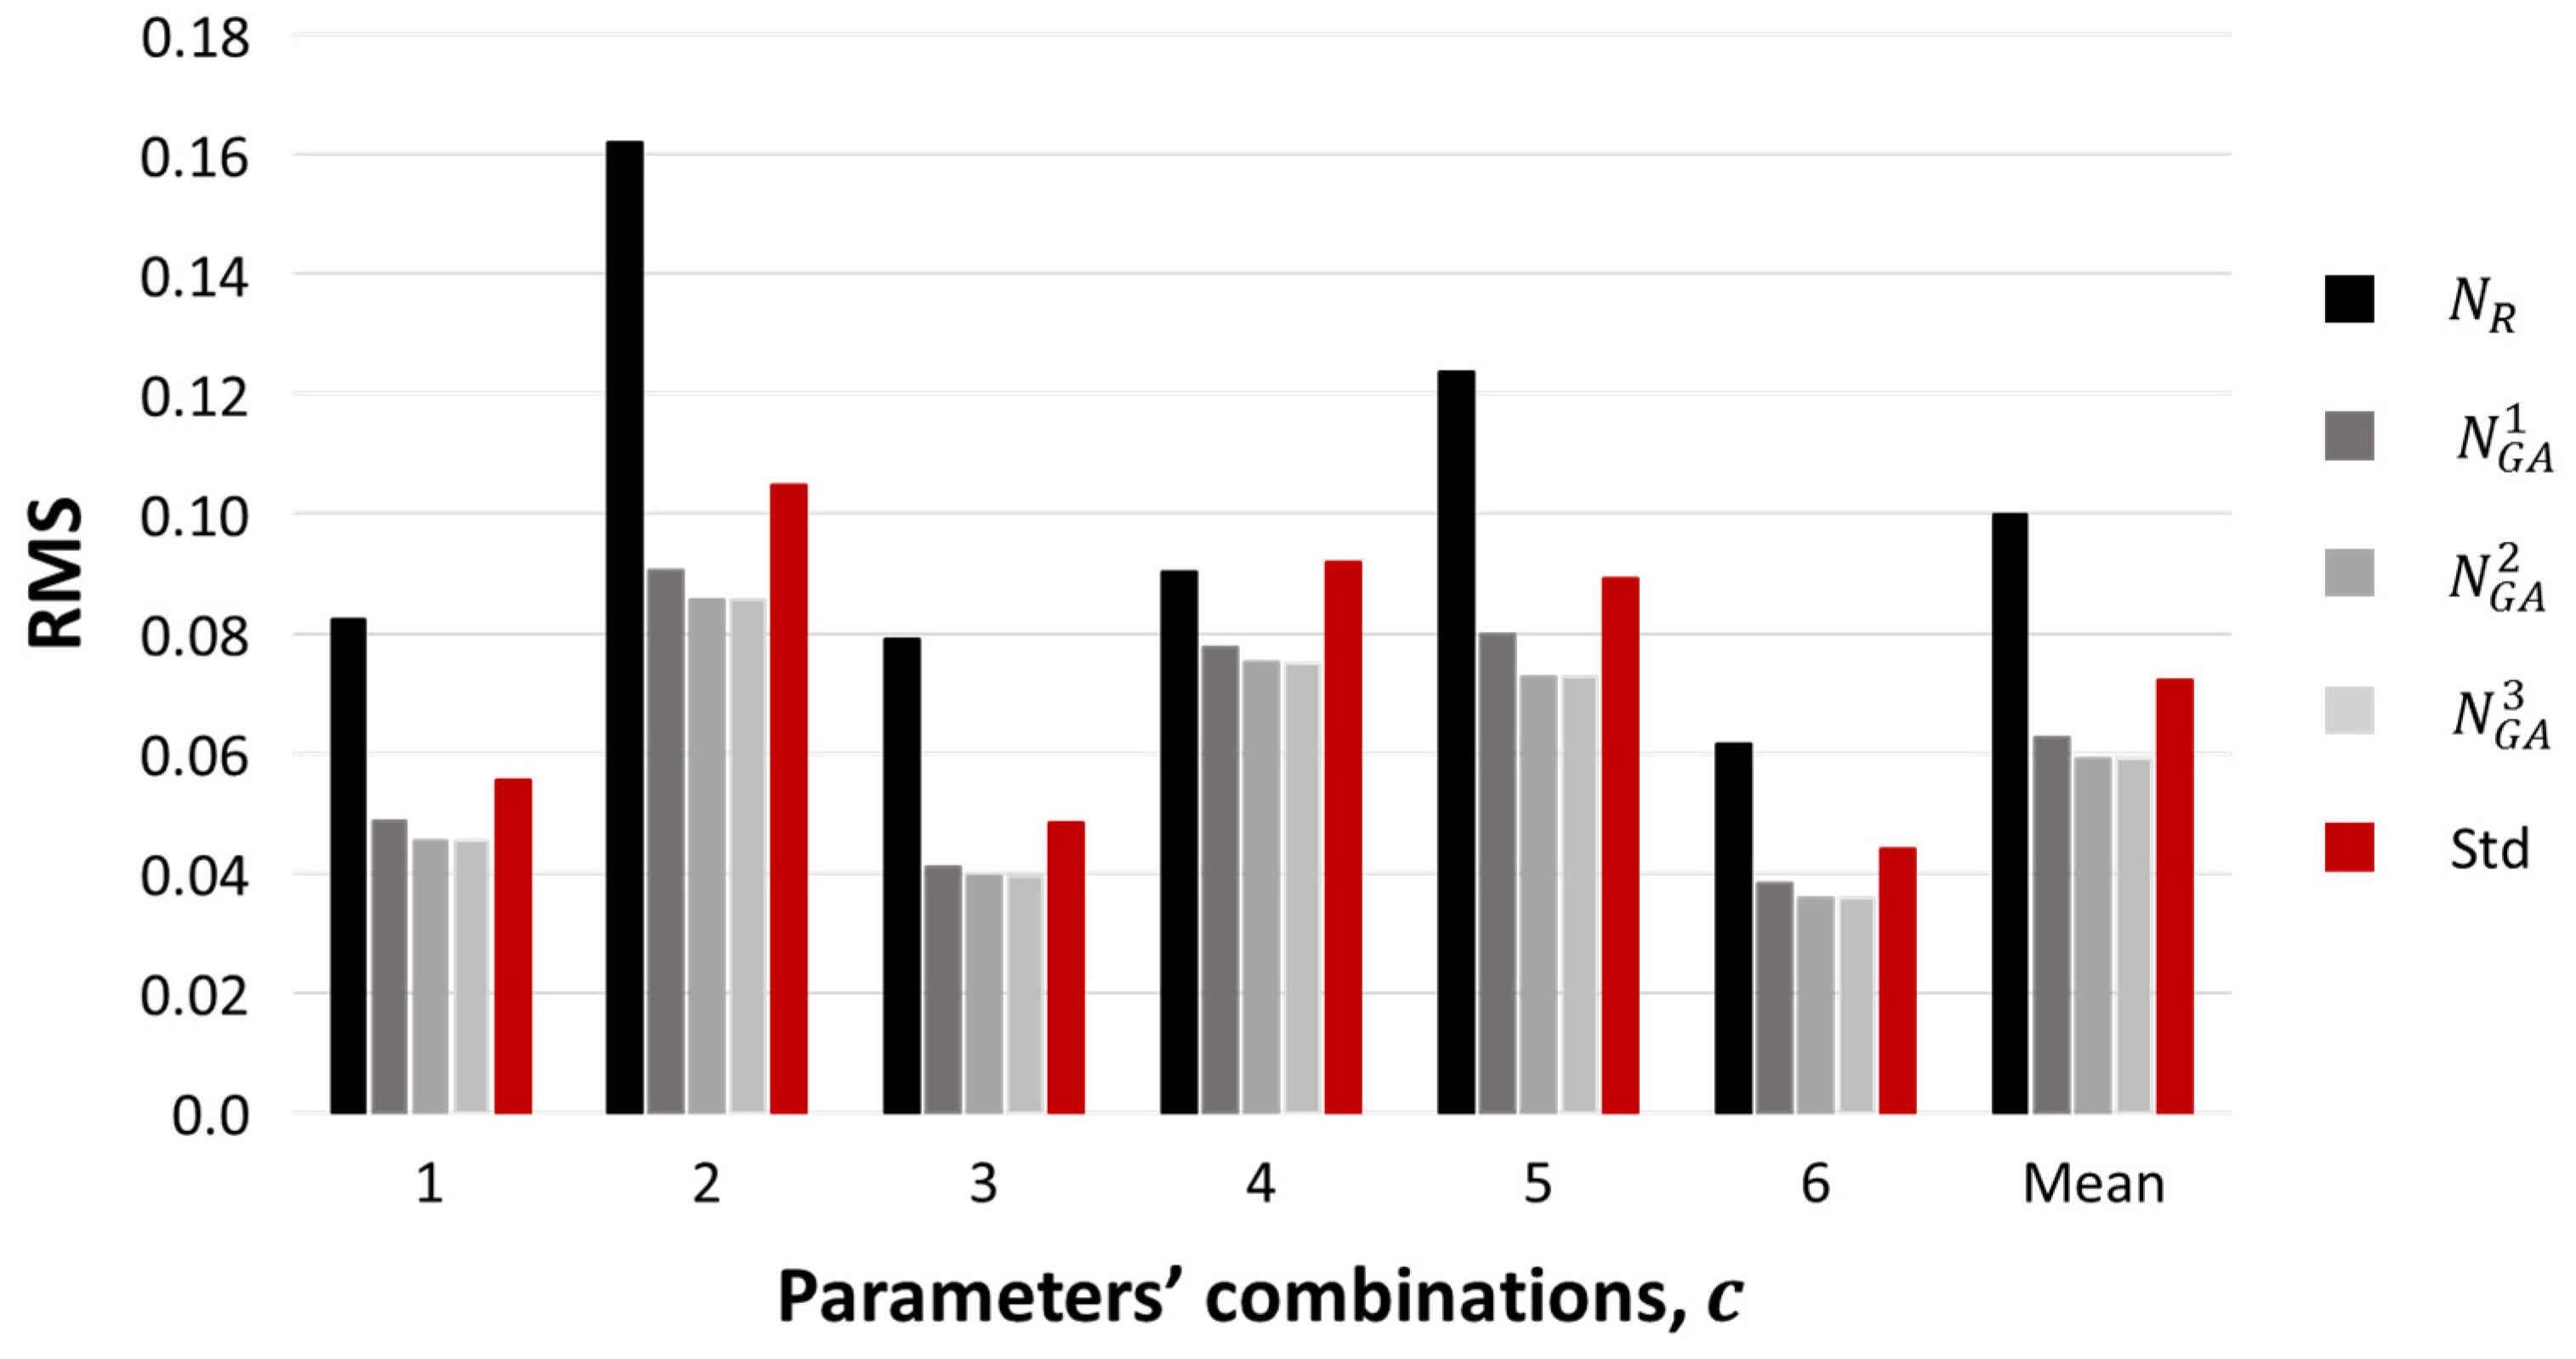
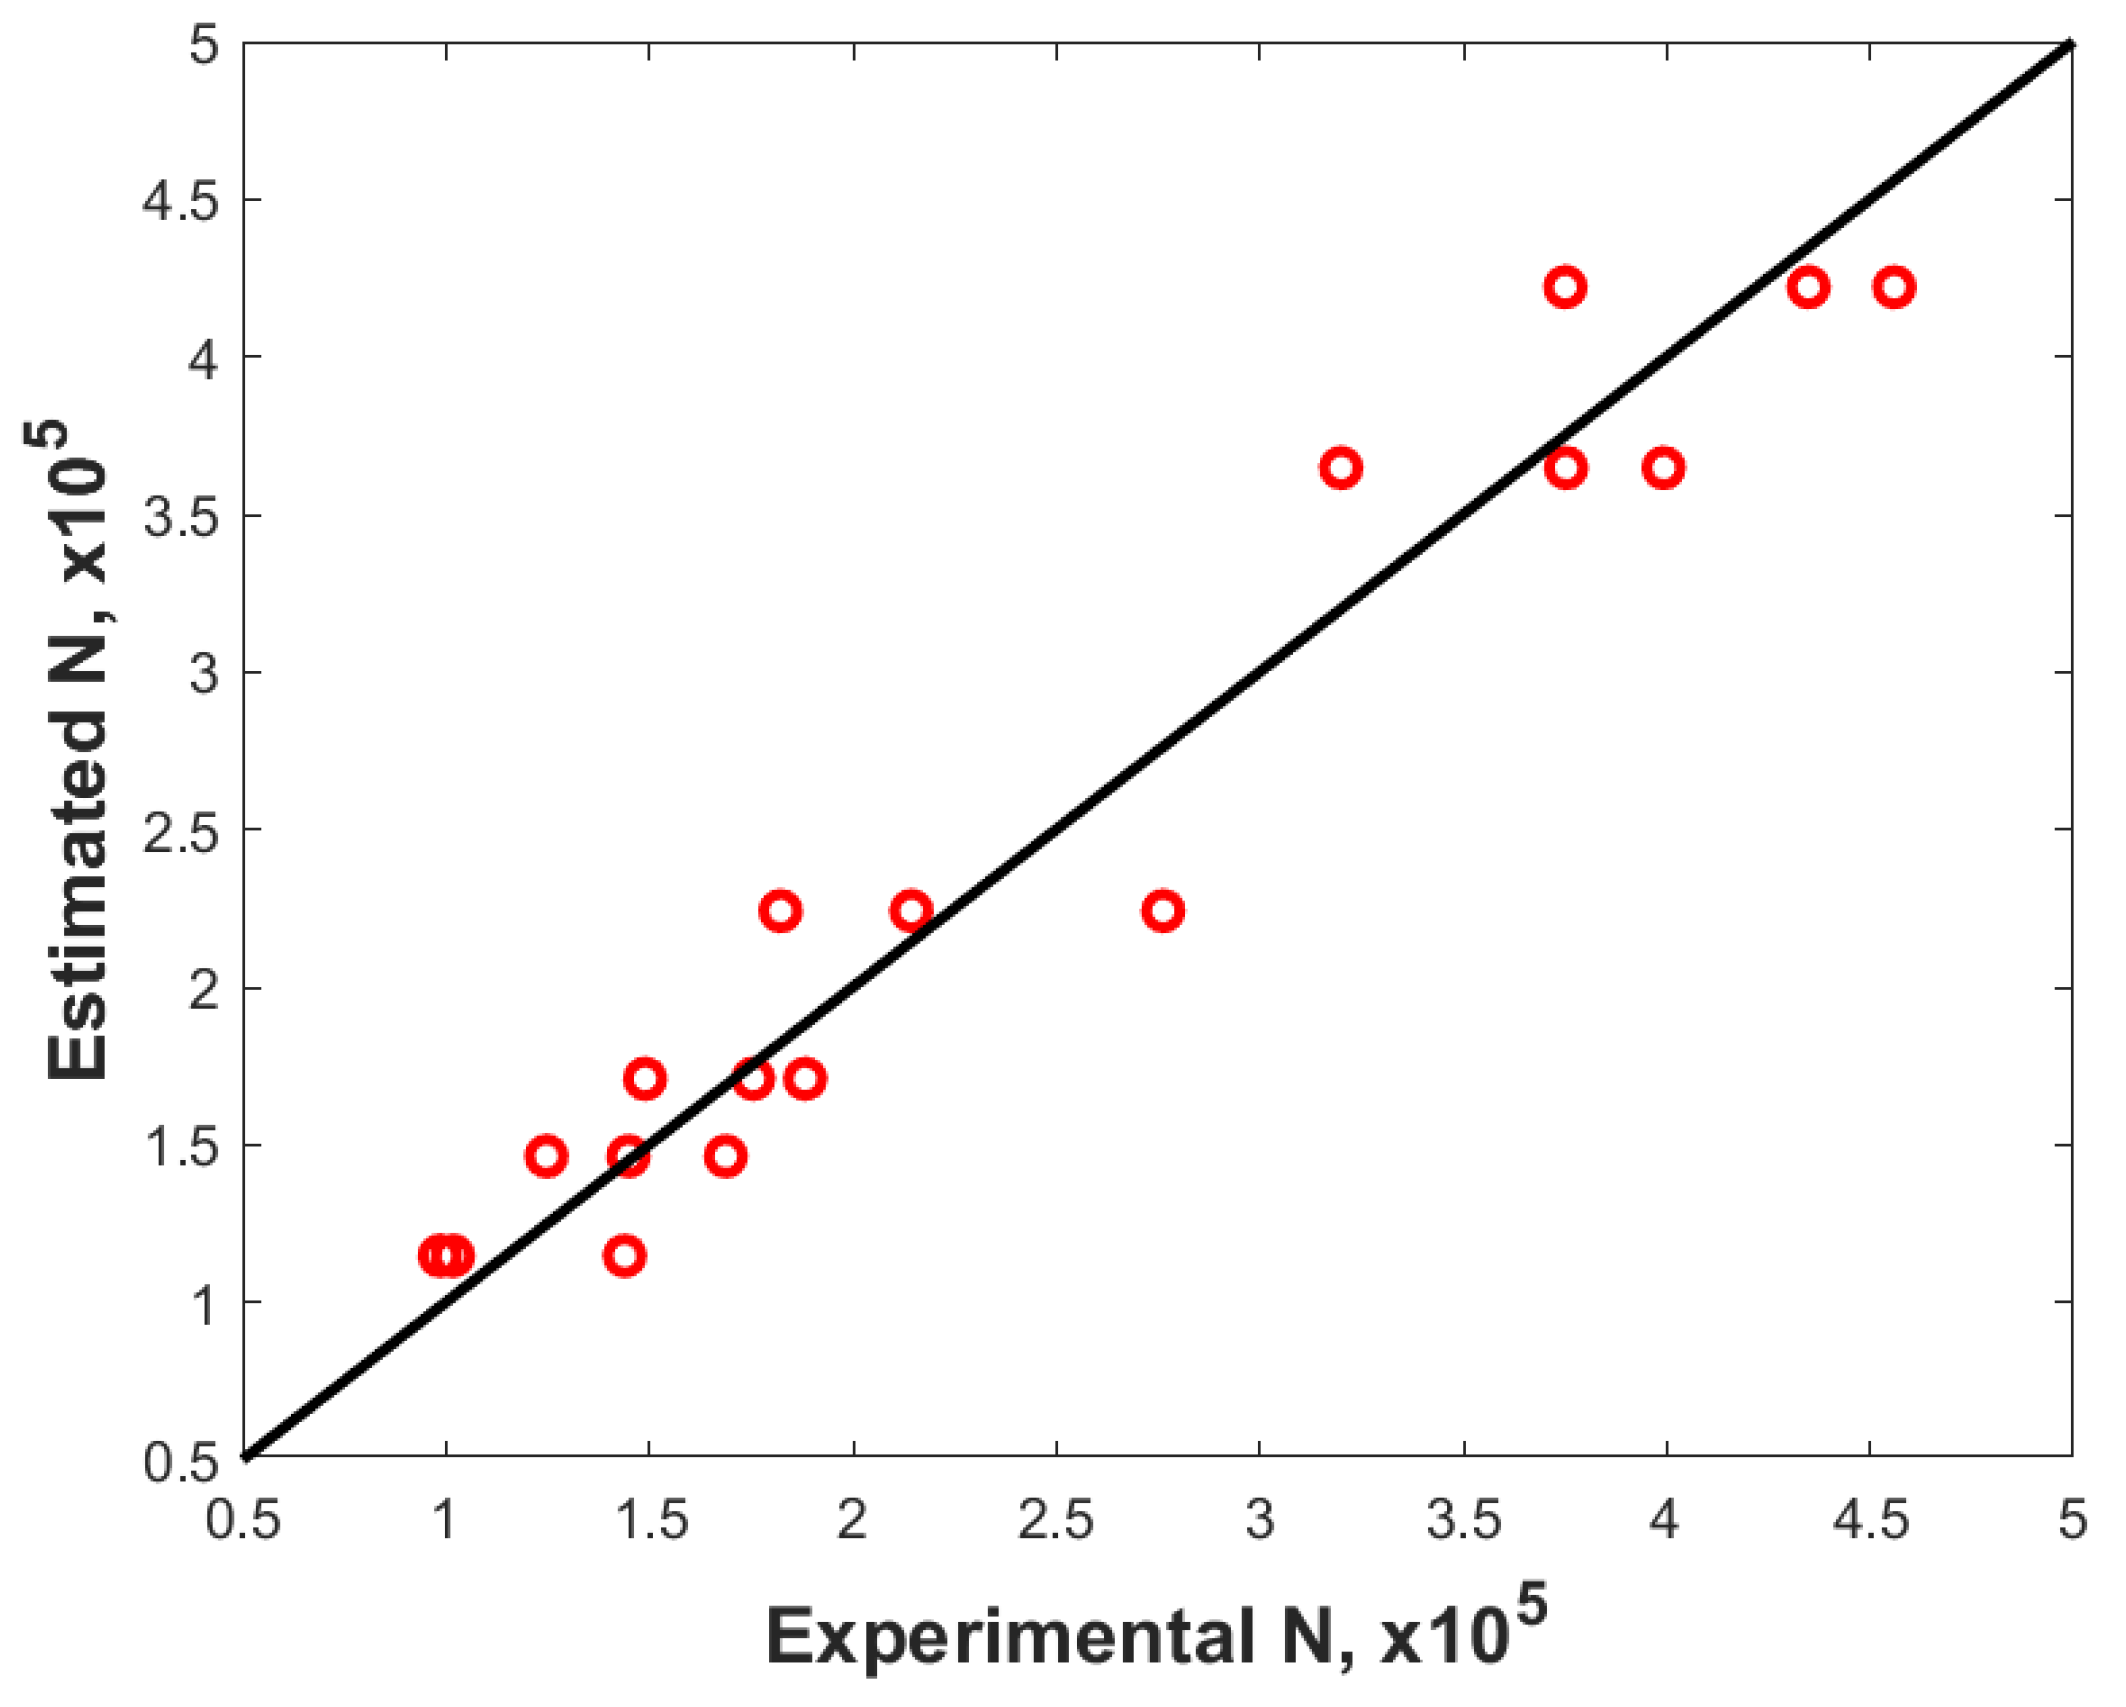
Genetic Algorithm-Based Optimization
4. Conclusions
Author Contributions
Funding
Acknowledgments
Conflicts of Interest
References
- Santos, L.M.S.; Ferreira, J.A.M.; Jesus, J.S.; Costa, J.M.; Capela, C. Fatigue behaviour of selective laser melting steel components. Theor. Appl. Fract. Mech. 2016, 85, 9–15. [Google Scholar] [CrossRef]
- Yıldırım, H.C. Recent results on fatigue strength improvement of high-strength steel welded joints. Int. J. Fatigue 2017, 101, 408–420. [Google Scholar] [CrossRef]
- Maharjan, N.; Zhou, W.; Zhou, Y.; Guan, Y.; Wu, N. Comparative study of laser surface hardening of 50CrMo4 steel using continuous-wave laser and pulsed lasers with ms, ns, ps and fs pulse duration. Surf. Coat. Technol. 2019, 366, 311–320. [Google Scholar] [CrossRef]
- Nath, A.K.; Sarkar, S. Laser Transformation Hardening of Steel. In Advances in Laser Materials Processing; Elsevier: Cambridge, UK, 2018; pp. 257–298. ISBN 9780081012529. [Google Scholar]
- Vollertsen, F.; Partes, K.; Meijer, J. State of the Art of Laser Hardening and Cladding. In Proceedings of the Third International WLT-Conference Lasers Manufacturing, Munich, Germany, 13–16 June 2005. [Google Scholar]
- Lakhkar, R.S.; Shin, Y.C.; Krane, M.J.M. Predictive modeling of multi-track laser hardening of AISI 4140 steel. Mater. Sci. Eng. A 2008, 480, 209–217. [Google Scholar] [CrossRef]
- Jiang, J.; Xue, L.; Wang, S. Discrete laser spot transformation hardening of AISI O1 tool steel using pulsed Nd:YAG laser. Surf. Coat. Technol. 2011, 205, 5156–5164. [Google Scholar] [CrossRef]
- Khorram, A.; Davoodi Jamaloei, A.; Jafari, A.; Moradi, M. Nd:YAG laser surface hardening of AISI 431 stainless steel; mechanical and metallurgical investigation. Opt. Laser Technol. 2019, 119, 105617. [Google Scholar] [CrossRef]
- Nath, A.K.; Gupta, A.; Benny, F. Theoretical and experimental study on laser surface hardening by repetitive laser pulses. Surf. Coat. Technol. 2012, 206, 2602–2615. [Google Scholar] [CrossRef]
- Sancho, P.; Montealegre, M.A.; Dominguez, J.; Alvarez, P.; Isaza, J. Dynamic control of laser beam shape for heat treatment. J. Laser Appl. 2018, 30, 032507. [Google Scholar] [CrossRef]
- Moradi, M.; Arabi, H.; Karami Moghadam, M.; Benyounis, K.Y. Enhancement of surface hardness and metallurgical properties of AISI 410 by laser hardening process; diode and Nd:YAG lasers. Optik 2019, 188, 277–286. [Google Scholar] [CrossRef]
- Filep, A.; Benke, M.; Mertinger, V.; Buza, G. Residual Stress Distribution Caused by Laser Hardening and Conventional Quenching in Plain Carbon Steel. Adv. Mater. Res. 2014, 996, 538–543. [Google Scholar] [CrossRef]
- Liverani, E.; Lutey, A.H.A.; Ascari, A.; Fortunato, A.; Tomesani, L. A complete residual stress model for laser surface hardening of complex medium carbon steel components. Surf. Coat. Technol. 2016, 302, 100–106. [Google Scholar] [CrossRef]
- Pashby, I.R.; Barnes, S.; Bryden, B.G. Surface hardening of steel using a high power diode laser. J. Mater. Process. Technol. 2003, 139, 585–588. [Google Scholar] [CrossRef]
- Liu, A.; Previtali, B. Laser surface treatment of grey cast iron by high power diode laser. Phys. Procedia 2010, 5, 439–448. [Google Scholar] [CrossRef]
- Lambiase, F.; Di Ilio, A.M.; Paoletti, A. Prediction of Laser Hardening by Means of Neural Network. Procedia CIRP 2013, 12, 181–186. [Google Scholar] [CrossRef]
- Skvarenina, S.; Shin, Y.C. Predictive modeling and experimental results for laser hardening of AISI 1536 steel with complex geometric features by a high power diode laser. Surf. Coat. Technol. 2006, 201, 2256–2269. [Google Scholar] [CrossRef]
- Ion, J.C. Laser Transformation Hardening. Surf. Eng. 2002, 18, 14–31. [Google Scholar] [CrossRef]
- Moradi, M.; KaramiMoghadam, M. High power diode laser surface hardening of AISI 4130; statistical modelling and optimization. Opt. Laser Technol. 2019, 111, 554–570. [Google Scholar] [CrossRef]
- Anusha, E.; Kumar, A.; Shariff, S. Diode Laser Surface Treatment of Bearing Steel for Improved Sliding Wear Performance. Optik 2019, 163357. [Google Scholar] [CrossRef]
- Oh, S.; Ki, H. Prediction of hardness and deformation using a 3-D thermal analysis in laser hardening of AISI H13 tool steel. Appl. Therm. Eng. 2017, 121, 951–962. [Google Scholar] [CrossRef]
- Liverani, E.; Sorgente, D.; Ascari, A.; Scintilla, L.D.; Palumbo, G.; Fortunato, A. Development of a model for the simulation of laser surface heat treatments with use of a physical simulator. J. Manuf. Process. 2017, 26, 262–268. [Google Scholar] [CrossRef]
- Guarino, S.; Ponticelli, G.S. High Power Diode Laser (HPDL) for Fatigue Life Improvement of Steel: Numerical Modelling. Metals 2017, 7, 447. [Google Scholar] [CrossRef]
- Rao, R.V. Decision Making in the Manufacturing Environment: Using Graph Theory and Fuzzy Multiple Attribute Decision Making Methods; Springer: London, UK, 2007; ISBN 9781849966535. [Google Scholar]
- Kennedy, E.; Byrne, G.; Collins, D.N. A review of the use of high power diode lasers in surface hardening. J. Mater. Process. Technol. 2004, 155–156, 1855–1860. [Google Scholar] [CrossRef]
- Guarino, S.; Barletta, M.; Afilal, A. High Power Diode Laser (HPDL) surface hardening of low carbon steel: Fatigue life improvement analysis. J. Manuf. Process. 2017, 28, 266–271. [Google Scholar] [CrossRef]
- Bauccio, M. ASM Metals Reference Book, 3rd ed.; ASM International: Russell Township, OH, USA, 1993; ISBN 9780871704788. [Google Scholar]
- Shin, H.J.; Yoo, Y.T.; Ahn, D.G.; Im, K. Laser surface hardening of S45C medium carbon steel using ND:YAG laser with a continuous wave. J. Mater. Process. Technol. 2007, 187–188, 467–470. [Google Scholar] [CrossRef]
- Goia, F.A.; De Lima, M.S.F. Surface hardening of an AISI D6 cold work steel using a fiber laser. J. ASTM Int. 2011, 8, 103210. [Google Scholar] [CrossRef]
- Parida, B.K. Fatigue Testing. In Encyclopedia of Materials: Science and Technology; Elsevier: London, UK, 2001; pp. 2994–2999. [Google Scholar]
- Sarkar, A.; Okazaki, M.; Nagesha, A.; Parameswaran, P.; Sandhya, R.; Laha, K. Mechanisms of failure under low cycle fatigue, high cycle fatigue and creep interactions in combined cycling in a type 316LN stainless steel. Mater. Sci. Eng. A 2017, 683, 24–36. [Google Scholar] [CrossRef]
- Verotti, M.; Di Giamberardino, P.; Belfiore, N.P.; Giannini, O. A genetic algorithm-based method for the mechanical characterization of biosamples using a MEMS microgripper: Numerical simulations. J. Mech. Behav. Biomed. Mater. 2019, 96, 88–95. [Google Scholar] [CrossRef]
- Dumont-Fillon, D.; Hannebelle, M.; Van Lintel, H.; Chappel, E. Design of a Passive Flow Regulator Using a Genetic Algorithm. Procedia Eng. 2016, 168, 1016–1019. [Google Scholar] [CrossRef]
- Alberdi, R.; Khandelwal, K. Comparison of robustness of metaheuristic algorithms for steel frame optimization. Eng. Struct. 2015, 102, 40–60. [Google Scholar] [CrossRef]
- Ponticelli, G.S.; Guarino, S.; Tagliaferri, V.; Giannini, O. An optimized fuzzy-genetic algorithm for metal foam manufacturing process control. Int. J. Adv. Manuf. Technol. 2019, 101, 603–614. [Google Scholar] [CrossRef]
- Dao, S.D.; Abhary, K.; Marian, R. A bibliometric analysis of Genetic Algorithms throughout the history. Comput. Ind. Eng. 2017, 110, 395–403. [Google Scholar] [CrossRef]
- Aguirre, H.; Tanaka, K.; Aguirre, H.; Tanaka, K. A Model for Parallel Operators in Genetic Algorithms. In Parallel Evolutionary Computations; Springer: Berlin/Heidelberg, Germany, 2006; pp. 3–31. [Google Scholar]
- Kumar, A. Encoding schemes in genetic algorithm. Int. J. Adv. Res. IT Eng. 2013, 3, 1–7. [Google Scholar]
- Esen, İ.; Koç, M.A. Optimization of a passive vibration absorber for a barrel using the genetic algorithm. Expert Syst. Appl. 2015, 42, 894–905. [Google Scholar] [CrossRef]
- Lusquiños, F.; Conde, J.C.; Bonss, S.; Riveiro, A.; Quintero, F.; Comesaña, R.; Pou, J. Theoretical and experimental analysis of high power diode laser (HPDL) hardening of AISI 1045 steel. Appl. Surf. Sci. 2007, 254, 948–954. [Google Scholar] [CrossRef]
- Gisario, A.; Barletta, M.; Boschetto, A. Characterization of laser treated steels using instrumented indentation by cylindrical flat punch. Surf. Coat. Technol. 2008, 202, 2557–2569. [Google Scholar] [CrossRef]
- Gisario, A.; Barletta, M.; Conti, C.; Guarino, S. Springback control in sheet metal bending by laser-assisted bending: Experimental analysis, empirical and neural network modelling. Opt. Lasers Eng. 2011. [Google Scholar] [CrossRef]
- Vilar, R. Laser surface modification of steel and cast iron for corrosion resistance. In Laser Surface Modification of Alloys for Corrosion and Erosion Resistance; Elsevier: Cambridge, UK, 2012; pp. 3–40. ISBN 9780857090157. [Google Scholar]
- Miller, R.G.; Brown, B.W. Beyond ANOVA: Basics of Applied Statistics; Chapman & Hall: London, UK, 1997; ISBN 9780412070112. [Google Scholar]


| Property | Value(s) | Unit |
|---|---|---|
| Tensile strength | 500 | MPa |
| Yield strength | 415 | MPa |
| Young’s Modulus | 200 | GPa |
| Poisson coefficient | 0.3 | - |
| Hardness Rockwell | 13 | - |
| Heat capacity * | 486–770 | J/kgK |
| Thermal conductivity * | 30.1–50.7 | W/mK |
| Element | Wt% |
|---|---|
| C | 0.37–0.44 |
| Mn | 0.50–0.80 |
| Si | 0.15–0.40 |
| P | ≤0.035 |
| S | ≤0.035 |
| Factor | Values | Unit | ||||
|---|---|---|---|---|---|---|
| Laser power (P) | 100 | 150 | 200 | 250 | 300 | W |
| Scan speed (Ss) | 12 | 14 | 16 | 18 | 20 | mm/s |
| Ss, mm/s | HAZ, μm |
|---|---|
| 12 | 67 |
| 16 | 127 |
| 20 | 182 |
| N | |||
|---|---|---|---|
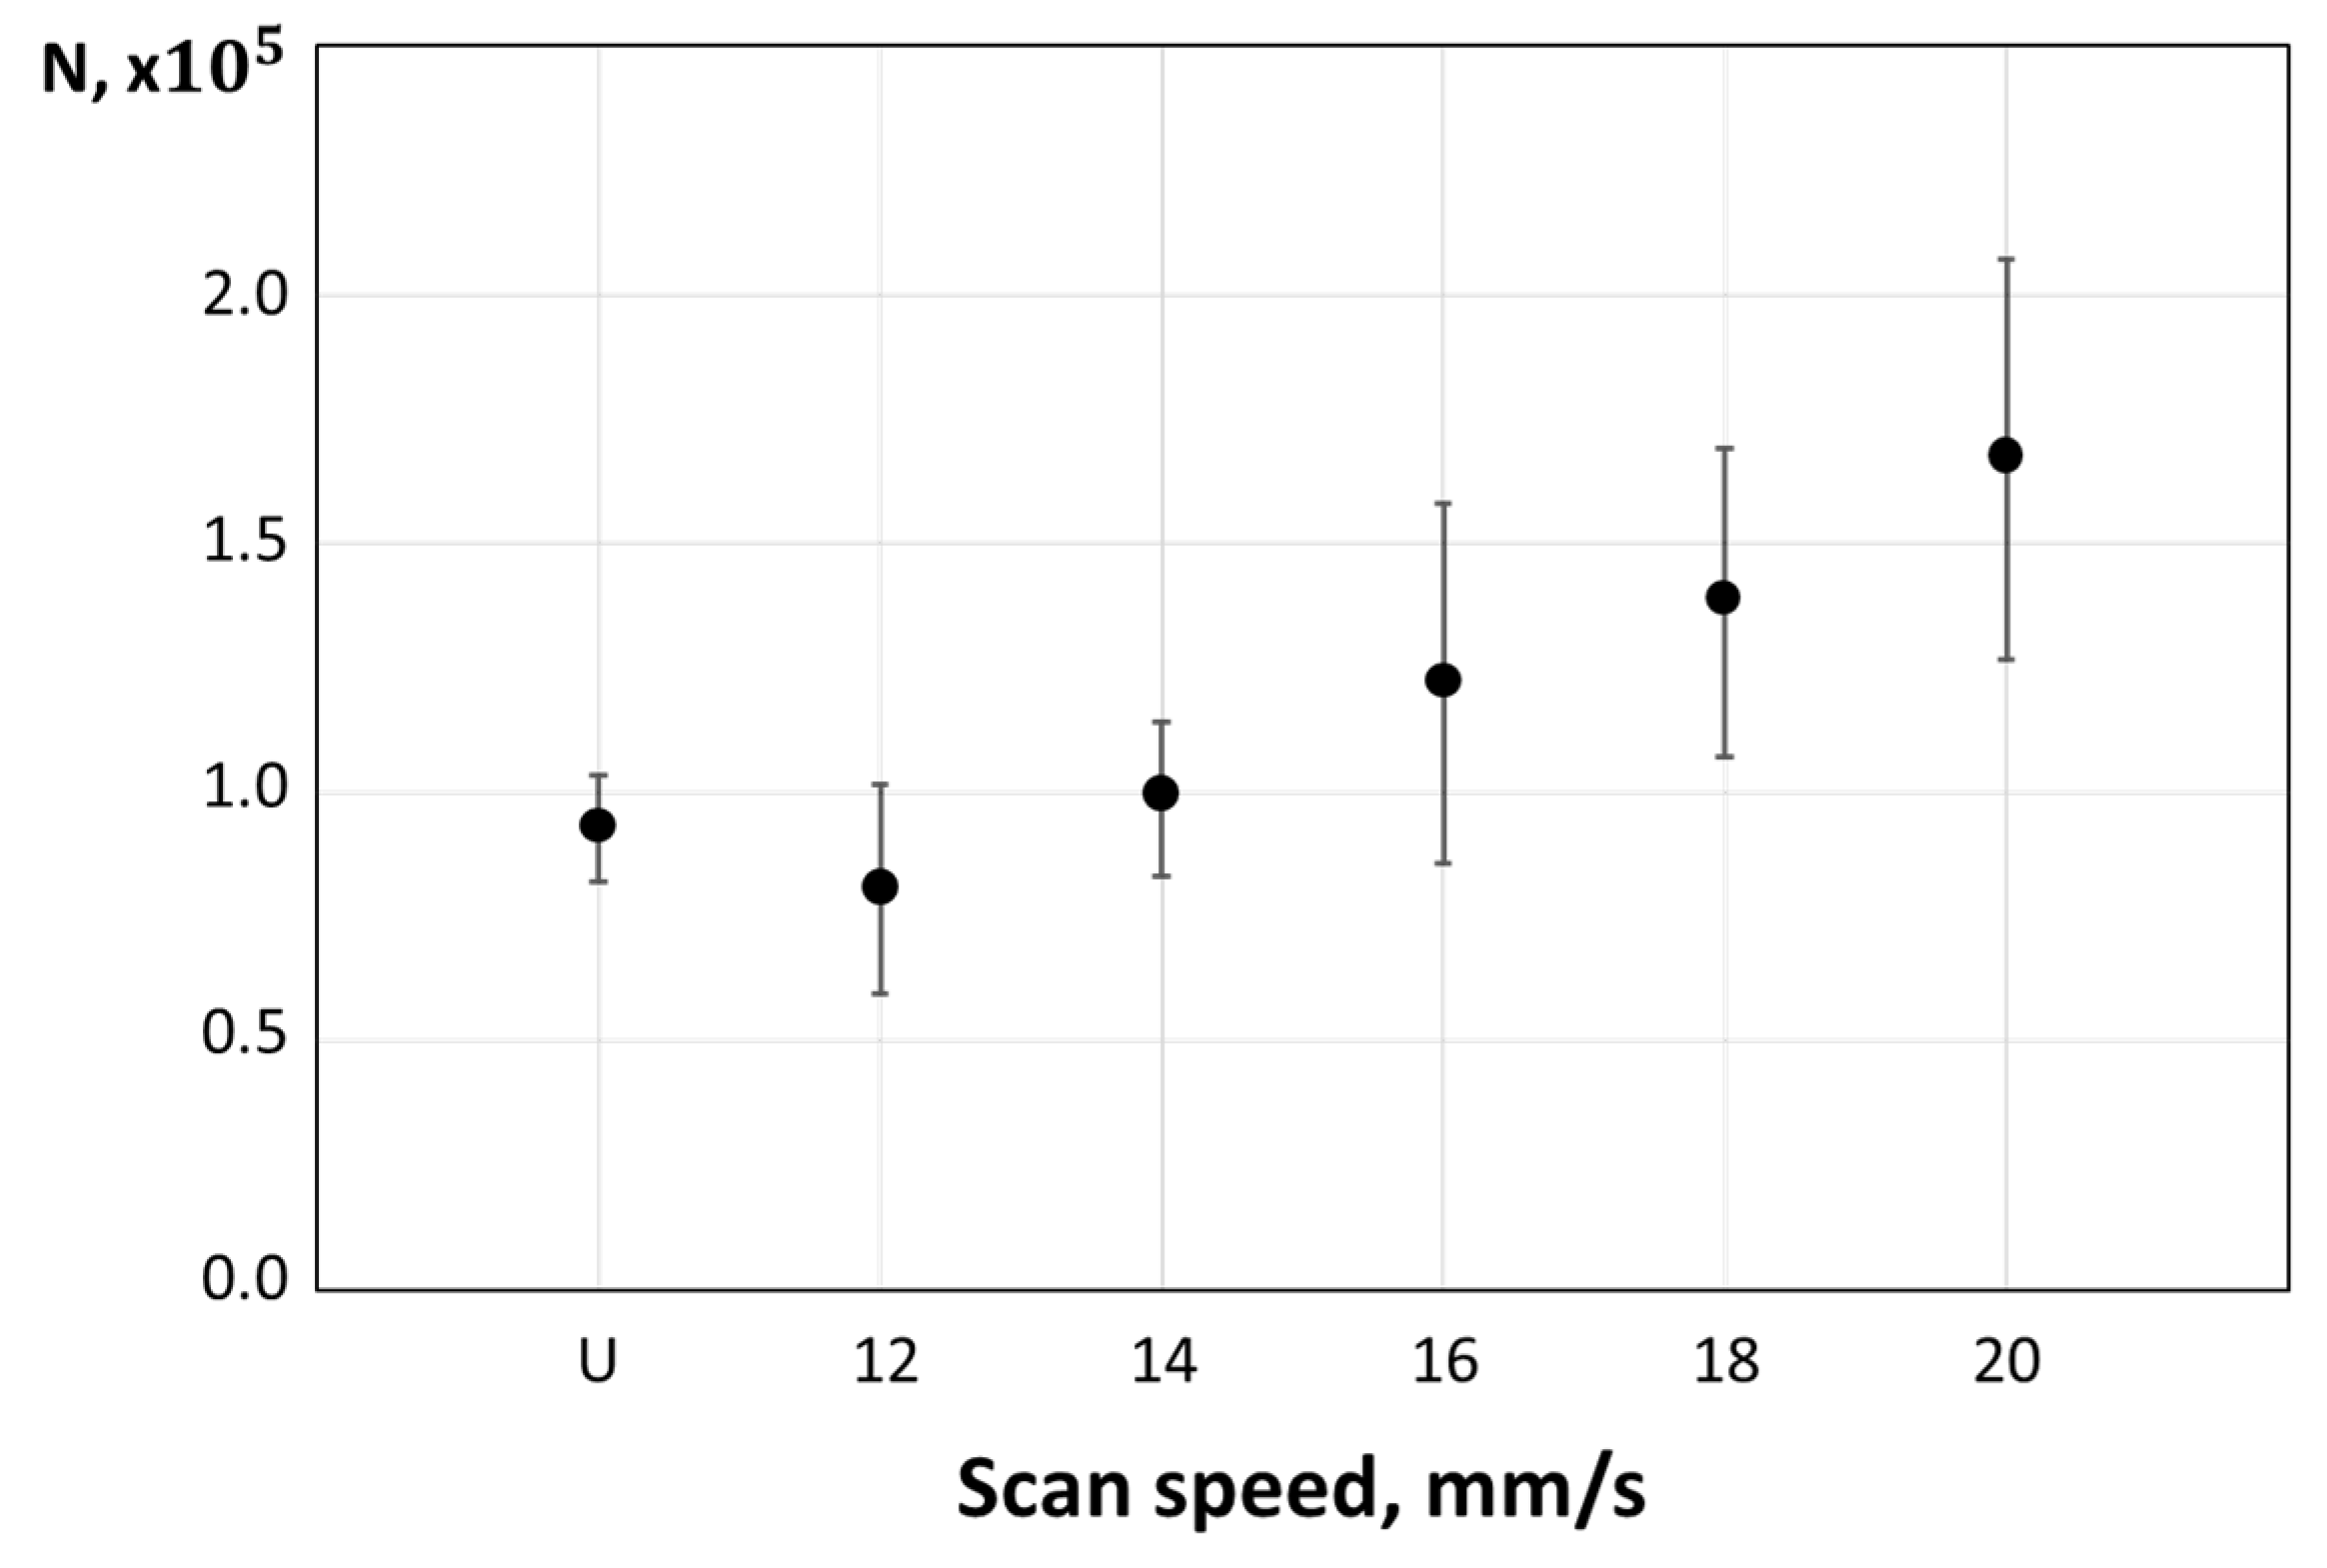
| 1 | 18 | 150 | 114,754 ± 20,695 |
| 2 | 18 | 200 | 224,327 ± 39,017 |
| 3 | 18 | 250 | 146,136 ± 18,011 |
| 4 | 20 | 150 | 421,982 ± 34,238 |
| 5 | 20 | 200 | 364,860 ± 33,197 |
| 6 | 20 | 250 | 170949 ± 16,390 |
| U | - | - | 92,608 ± 10,698 |
| Set | Exponents |
|---|---|
| {0, 1, 2} | |
| {−2, −1, 0, 1, 2} | |
| {−2, −1, −0.5, 0, 0.5, 1, 2} |
| Coefficients * | Set | ||
|---|---|---|---|
| −6.420 | 1.587 | 8.314 | |
| 6.628 | −0.959 | −4.016 | |
| 5.147 | 2.019 | 4.539 | |
| −4.993 | −2.271 | −8.462 | |
© 2020 by the authors. Licensee MDPI, Basel, Switzerland. This article is an open access article distributed under the terms and conditions of the Creative Commons Attribution (CC BY) license (http://creativecommons.org/licenses/by/4.0/).
Share and Cite
Ponticelli, G.S.; Guarino, S.; Giannini, O. An Optimal Genetic Algorithm for Fatigue Life Control of Medium Carbon Steel in Laser Hardening Process. Appl. Sci. 2020, 10, 1401. https://doi.org/10.3390/app10041401
Ponticelli GS, Guarino S, Giannini O. An Optimal Genetic Algorithm for Fatigue Life Control of Medium Carbon Steel in Laser Hardening Process. Applied Sciences. 2020; 10(4):1401. https://doi.org/10.3390/app10041401
Chicago/Turabian StylePonticelli, Gennaro Salvatore, Stefano Guarino, and Oliviero Giannini. 2020. "An Optimal Genetic Algorithm for Fatigue Life Control of Medium Carbon Steel in Laser Hardening Process" Applied Sciences 10, no. 4: 1401. https://doi.org/10.3390/app10041401
APA StylePonticelli, G. S., Guarino, S., & Giannini, O. (2020). An Optimal Genetic Algorithm for Fatigue Life Control of Medium Carbon Steel in Laser Hardening Process. Applied Sciences, 10(4), 1401. https://doi.org/10.3390/app10041401