Abstract
This paper proposes a novel control method for enhancing transient stability by using renewable energy sources (RES). The kinetic energy accumulated in a rotor of variable speed wind generator (VSWG) is proactively used as the active power source, which is controlled according to the frequency measured at the wind farm. In addition, coordinated reactive power control according to the grid voltage is also carried out to more effectively use the kinetic energy of the VSWG. The effects of the proposed control system were evaluated by simulation analyses performed using a modified IEEE nine-bus power system network made up of synchronous generators (SGs), a photovoltaic (PV) system and a VSWG-based wind farm. Furthermore, the coordinated reactive power control between the VSWG and PV system was also demonstrated.
1. Introduction
As a result of the need to minimize environmental impacts and diversify the electricity mix, the number of grid-connected renewable energy sources (RES), such as wind generators (WGs) and photovoltaic (PV) systems, has been steadily growing. The global cumulative capacity of installed WGs reached 651 GW at the end of 2019, of which 60 GW were installed in 2019 [1]. On the other hand, the global cumulative capacity of installed PV systems reached 627 GW [2]. In Japan, the cumulative capacities of WGs and PV systems reached 3.9 GW and 63 GW, respectively. In particular, the PV market has been growing at a rapid rate. The annual installed PV capacity in 2019 reached 7 GW.
With the increase in the number of the grid-connected RES, the number of thermal units composed of synchronous generators (SGs) needs to be reduced to maintain the electricity demand–supply balance. This leads to lower synchronizing power and power system inertia, and thus the transient stability may be negatively affected [3,4,5]. In addition, when disturbances occur in the grid, some parts of the power sources without implemented fault ride through (FRT) capability may be disconnected from the grid owing to the voltage drop. The disconnection of the power sources causes a decline of power generation, and thus a further voltage drop may be induced. Ultimately, a large number of power sources may be disconnected from the grid. In this case, due to the decline of power supply caused by the disconnection of many power sources, the conventional SGs may go out-of-step in the decelerating direction [6,7,8].
Therefore, this paper proposes a novel control method for enhancing the power system transient stability by using a variable speed wind generator (VSWG). The power converter of a VSWG can individually control the active power and the reactive power. If the active power reference is set to larger value than the mechanical power from the wind turbine, the active power injected from the generator to the grid is compensated for by rotational energy (i.e., kinetic energy). As the response of the energy conversion from the kinetic energy into the electric power is fast, the control strategy using the kinetic energy of the VSWG may be effective for enhancing the stability. On the other hand, the reactive power injected from the VSWG to the grid increases the load voltage and thus the power demand. This leads to enhanced transient stability and reduced release of the kinetic energy of the VSWG.
Several control schemes for transient stability enhancement using the active power or both the active and reactive power of a fixed speed WG (FSWG) or VSWG have been suggested [8,9,10,11]. In [8], coordinated control of the active power of doubly fed induction generator (DFIG)-based wind farms and SG tripping was demonstrated. In [9], possible improvements in voltage stability and transient stability resulting from active and reactive power control were investigated. However, a VSWG modeled as a negative load was used for the simulation analysis, and hence the dynamics in the VSWG may have been neglected. In [10], wide area control using both a DFIG and SG to enhance the transient stability was demonstrated. In [11], the active and reactive power of an FSWG were controlled based on a unified inter-phase power controller (UIPC), which was installed between the FSWG and the grid.
In this study, the kinetic energy of a VSWG equipped with a full power converter was actively used for transient stability enhancement. Although the rotational speed was adjusted over a large range by using the full power converter, as mentioned above, the speed variation during the control mode could be reduced by the reactive power support. This means that the proposed method can handle more severe disturbances and offer increased reliability as a power system stabilization device. As the proposed control works based on local information, power producers can easily use the proposed control as an ancillary service. The kinetic energy accumulated in the rotor of VSWG is used as the active power source, which is controlled according to the frequency measured in the wind farm. As the frequency response is equivalent to the collective dynamic response of all generators in the power system, the dynamic stability of SGs can be controlled effectively by using the frequency response as the input signal for the control system. On the other hand, the reactive power of the VSWG is controlled according to the response of the grid voltage. To decide the appropriate value of reactive power, we referred a reactive power characteristic of the static VAR compensator (SVC). As the disconnection of many power sources owing to the voltage drop may cause the SGs to be out-of-step and thus a blackout, we gave the reactive power control higher priority than the kinetic energy control. Therefore, if the residual capacity of the power converter is insufficient, the active power delivered from the VSWG to the grid is regulated.
To verify the effectiveness of the proposed control method, simulation analyses were carried out by using a modified IEEE nine-bus power system network with a VSWG-based wind farm and PV system. Furthermore, the effect of the coordinated reactive power control with the VSWG and PV system on transient stability enhancement was also demonstrated. PSCAD/EMTDC software was used for the simulation analyses.
2. Scheme of Proposed Control Model
Figure 1 illustrates the proposed control scheme of the VSWG used to enhance the transient stability. The permanent magnet synchronous generator (PMSG) is connected to the grid through a power converter and a transformer. The power converter has a general control structure through which the active power and the reactive power are controlled according to each corresponding reference value. When the absolute value of deviation of the grid frequency, |Δf|, becomes less than or equal to 0.2 Hz, which is the target value of the frequency deviation limit in Japan, ΔPref is set to 0, and hence the active power reference, Pref, is equal to Pmppt, which is calculated according to the maximum power point tracking (MPPT) algorithm. When |Δf| becomes greater than 0.2 Hz, Pref is equal to the sum of –ΔPref and Pmppt. ΔPref is determined by multiplying Δf by two variable proportional gains Kp1 and Kp2 as shown in Figure 2. To prevent the VSWG operation from stopping due to the extreme release of the kinetic energy, Kp1 is set to 0 when the rotor speed, ωr, is less than 0.5 pu.
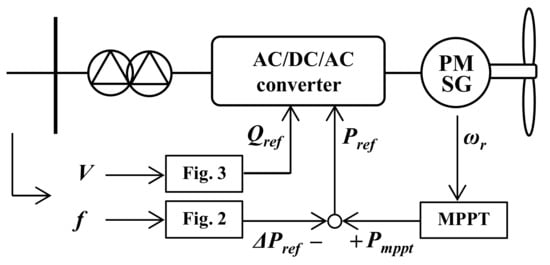
Figure 1.
Control scheme of the VSWG used to enhance transient stability.
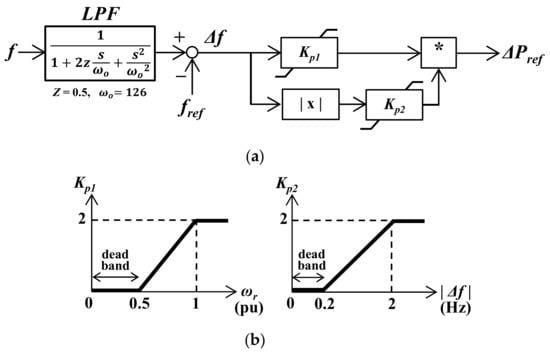
Figure 2.
Active power control model: (a) control block of ΔPref; (b) characteristics of Kp1 and Kp2.
When the absolute value of deviation of grid voltage, |ΔV |, becomes less than or equal to 1% of pre-fault voltage (the appropriate value for the voltage fluctuation in an extra-high-voltage system in Japan is within 1–2%), the reactive power reference, Qref, is set to 0. When |ΔV | becomes greater than 1 %, Qref is calculated as follows [12]:
where is the rated apparent power of the VSWG and is pre-fault voltage (1.04 pu). The voltage–reactive power characteristic drawn based on Equation (1) and considering the dead band is shown in Figure 3.
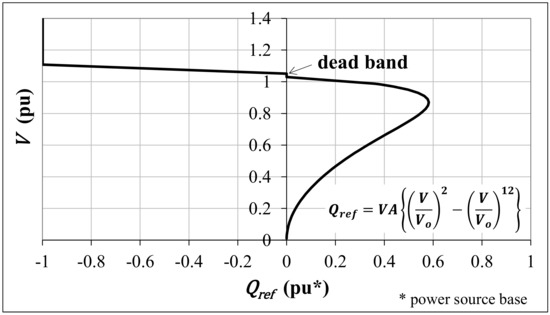
Figure 3.
Reactive power control model (voltage–reactive power characteristic).
As described above, the reactive power control has higher priority than the active power control. Therefore, the maximum value of Pref is calculated by the following equation:
3. Simulation Model
3.1. Power System Model and Simulation Conditions
Figure 4 illustrates the power system model [13] used for the simulation analysis. It consists of the power sources of the VSWG and three conventional SGs (SG1, SG2 and SG3). Simulation analysis using the power system model with the PV system installed instead of SG3 was also carried out. The line impedances (R + jX (jB/2)) and the initial power flows are described in per unit values on the system base (1000 MVA). The static load models with the constant impedance characteristic were used as the power demand load. The parameters of each SG are listed in Table 1. Figure 5 illustrates the models of the automatic voltage regulator (AVR) [14] and governor system, which are included in each SG model.
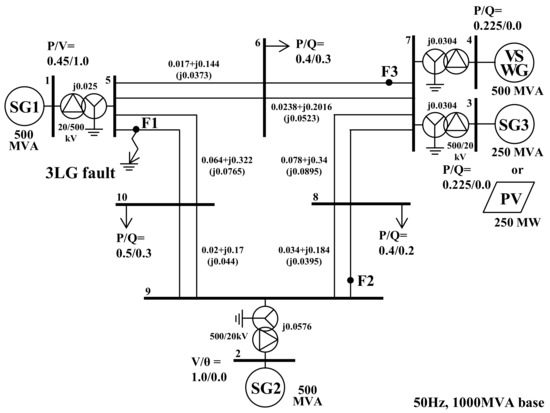
Figure 4.
Power system model.

Table 1.
SG parameters.
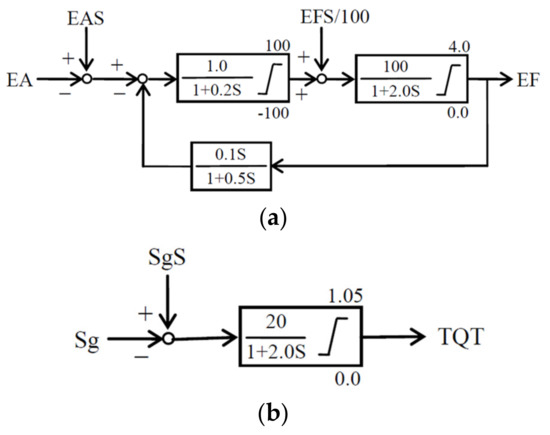
Figure 5.
Generator control model: (a) automatic voltage regulator (AVR); (b) governor. EA: terminal voltage, EAS: terminal voltage reference; EF: field voltage; EFS: field voltage reference; Sg: generator speed; SgS: generator speed reference; TQT: turbine torque.
We assumed that a symmetrical three-line-to-ground (3LG) fault occurs at each fault location (F1, F2 and F3) in the grid model. After the 3LG fault occurs at 0.1s, the circuit breakers on the faulted lines are opened at 0.17 s and then reclosed at 1.17 s.
In these simulations, the effects of three control methods shown below on the transient stability enhancement are demonstrated.
- Case 1: Active power control of the VSWG;
- Case 2: Active and reactive power control of the VSWG;
- Case 3: Active and reactive power control of the VSWG and reactive power control of the PV system.
3.2. PV System Model
Figure 6 illustrates the model of the 250 MW PV system made up of an inverter and a PV module. The voltage source converter is used as a PV inverter. The active power and the reactive power injected to the grid are controlled by the inverter at the reference set points (Cases 1 and 2: ; Case 3: , in the equation is the rated apparent power of the PV system). We assumed that the active and reactive power are constant under the steady state, based on the assumption that irradiation and PV cell temperature do not change dramatically within the simulation period. We also assumed that the PV inverter has FRT capability and hence that the PV inverter maintains connection to the grid after the fault.
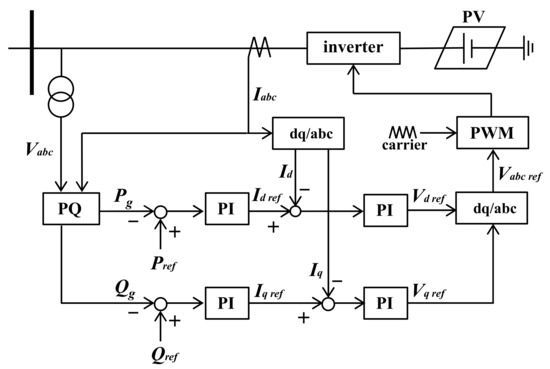
Figure 6.
Control model of the PV system.
The time constants of the control system are set to slightly larger values than those of the control system of the VSWG in order to avoid the instability (hunting) of the reactive power injected to the grid [15,16].
3.3. VSWG Model
A VSWG model made up of a three-phase current source [17], as shown in Figure 7, was used in this work. The current source model has sufficient accuracy in the analysis of the power system with a great number of WGs, which cannot be simulated by using the detailed generator model. In this work, the wind farm is composed of 100 VSWGs each rated at 5 MW. The VSWG parameters [17] are listed in Table 2.
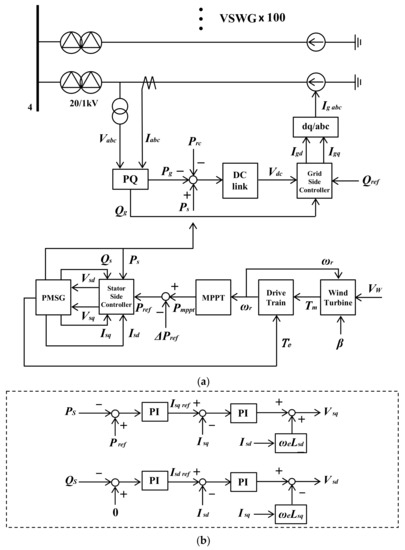

Figure 7.
Control model of the VSWG: (a) overall; (b) stator side controller; (c) grid side controller; (d) protection circuit of DC-link.

Table 2.
VSWG parameters.
The wind turbine power output, , can be calculated as follows [18]:
where is the air density, is the radius of rotor blade, is the wind speed, is the performance coefficient, is tip speed ratio and is blade pitch angle.
From Equation (3), the maximum power point, which changes according to the rotor speed, is calculated as follows [18]:
where and are the optimal values of the tip speed ratio and the power coefficient, respectively. The wind turbine parameters are also listed in Table 2. In this case study, we assumed that is kept constant at 8.8 (m/s) at which the active power reference of the VSWG is 0.45 pu (VSWG capacity base) within the simulation period.
The equation of motion of the drive train is expressed as follows:
where and are mechanical torque, electrical torque, moment of inertia and rotor speed of the wind turbine, respectively.
The dynamic model of the PMSG in the d-q rotating reference frame is expressed as follows:
where and are stator voltages, is the stator winding resistance, and are stator currents, is the rotor speed, and are the synchronous inductances of stator winding and is the flux of permanent magnet.
Active and reactive power of the PMSG are expressed as follows:
The electrical torque of the PMSG can be expressed as follows;
where is the number of pole pairs. The dynamic behavior of DC capacitor voltage is expressed as follows:
where is the DC-link capacitance, is the active power injected to the grid and is the consumed power in the resistance, , which is installed in the DC-link circuit in order to protect the circuit during the fault as illustrated in Figure 7d [19]. When the DC-link voltage becomes larger than or equal to the pre-defined limit (1.05 pu), the DC-link voltage is applied to .
4. Simulation Results
4.1. Transient Stability Analysis in the Case with SG3 Installed
First, the simulation results for the power system model with SG3 installed, in which it is assumed that 3LG fault occurs at F1, are presented. Figure 8 shows the deviation of the kinetic energy of each SG, , which is the per unit value on the summation of the steady state kinetic energy of each SG. It can be seen that the oscillations of all of SGs in Cases 1 and 2 are restrained compared with those of “No control”. In particular, the oscillations in Case 2 are greatly restrained.
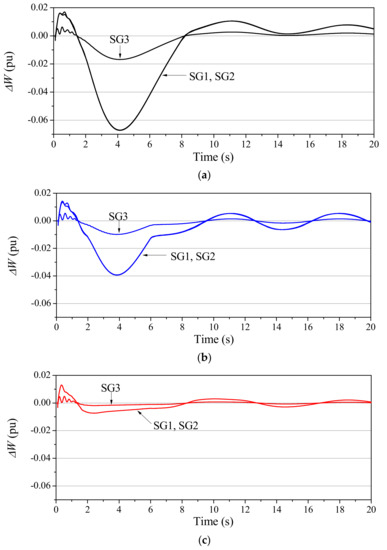
Figure 8.
: deviation of kinetic energy of each SG: (a) No control; (b) Case 1; (c) Case 2.
Figure 9 shows the deviation of the summation of the kinetic energy of each SG, . As is the collective dynamic response of all generators, we can evaluate the stability of the overall power system from the response of . It can be seen from the figure that the oscillation of in Case 2 is restrained, hence the enhanced transient stability.
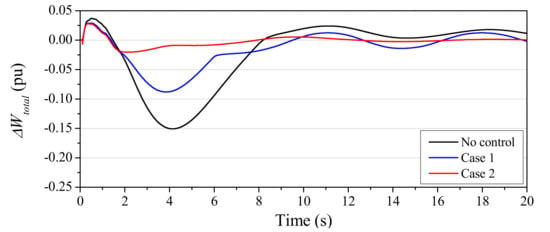
Figure 9.
: deviation of summation of kinetic energy of each SG (with SG3 installed).
Figure 10 shows the power system frequency. It can be seen from the figure that the frequency fluctuations are smaller in Cases 1 and 2, and hence the frequency fluctuations are restrained in these cases. In Case 2, |Δf| becomes less than or equal to 0.2 Hz after 6.13 s, and hence Pref of the VSWG is equal to Pmppt after this time. In other words, the active power control of the VSWG is returned to the steady state mode at 6.13 s. The control mode in Case 1 is not returned to the steady state mode within 20 s.
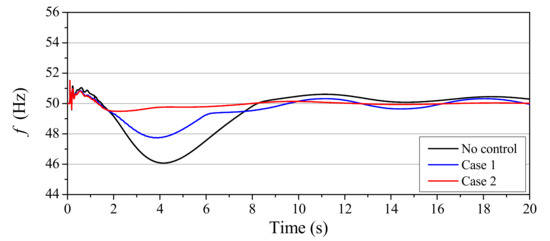
Figure 10.
Power system frequency (with SG3 installed).
Figure 11 shows the grid voltage at bus 7. As the VSWG has FRT capability, the grid voltage is gradually returned to the pre-fault value after the fault clearing. It can be seen that the voltages in Cases 1 and 2 after the fault clearing rise up slightly faster than that in “No control”. In Case 1, however, a larger overshoot occurs. The overshoot in Case 2 is suppressed more than that in Case 1, and the subsequent fluctuation is also suppressed more than those in other cases. In Case 2, |ΔV| becomes less than or equal to 1% of pre-fault voltage after 11.2 s, and hence the reactive power control is also returned to the steady state mode at this time.
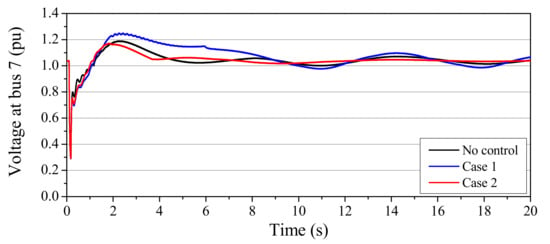
Figure 11.
Voltage at bus 7 (with SG3 installed).
Figure 12, Figure 13 and Figure 14 show the active power, the reactive power and the apparent power of the VSWG, respectively. As the power capacity of the VSWG is 0.5 pu (power system base), it can be seen from Figure 14 that the apparent power of the VSWG is controlled in the range of 0 to about 0.5 pu. As can be seen from Figure 12, the active power of the VSWG in Cases 1 and 2 decreases due to the increase in frequency when the fault occurs. As a result, in these cases, the power loads of SGs increase, and thus the accelerating power acting on rotors of SGs is decreased. On the other hand, when the frequency decreases, the decelerating powers acting on the rotors are decreased because the active power of the VSWG increases. Thus, as the power loads of the SGs are controlled by the active power of the VSWG, the rotor speed variations of the SGs can be restrained. Furthermore, the effect of the active power control on transient stability enhancement may be improved by the grid voltage control. This is because the voltage control changes the power demands in the grid loads. As can be seen from Figure 13, the reactive power in Case 2 rises up quickly more than that in Case 1 after the fault clearing. After that, the reactive power drops down significantly to suppress the overshoot voltage. As a result, as the power demand–supply balance in the grid is improved more than that in Case 1, and the kinetic energy released from the rotor of the VSWG becomes smaller than that in Case 1. The kinetic energy released from the rotor to the grid in each case is depicted in Table 3 (e.g., 1.31 s in the table means the released energy is 1.31 × 1000 MVA, the system base power).
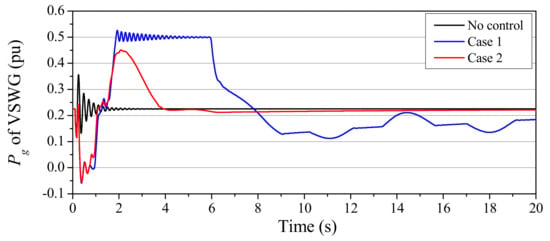
Figure 12.
Active power of the VSWG (with SG3 installed).
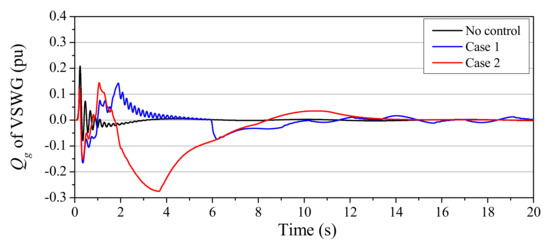
Figure 13.
Reactive power of the VSWG (with SG3 installed).
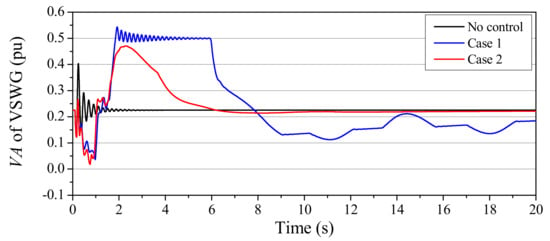
Figure 14.
Apparent power of the VSWG (with SG3 installed).

Table 3.
Released energy from the rotor of the VSWG in case with SG3 installed.
Figure 15 shows the rotor speed of the VSWG. It can be seen that the deceleration of the rotor in Case 2 is far less than that in Case 1. However, the rotor speed in Case 1 also certainly increases toward to the pre-fault value.
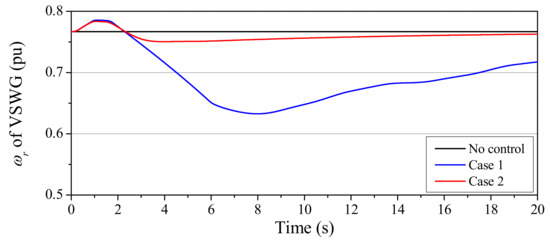
Figure 15.
Rotor speed of the VSWG (with SG3 installed).
Figure 16 shows the DC-link voltage of the VSWG. The maximum values of the DC-link voltages in Cases 1 and 2 are suppressed more than that in “No control”.
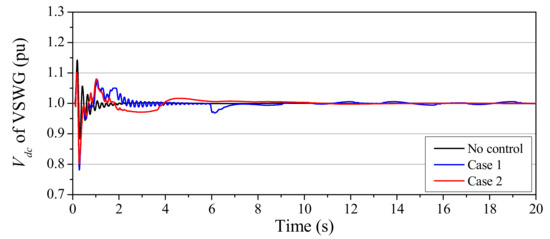
Figure 16.
DC-link voltage of the VSWG (with SG3 installed).
4.2. Transient Stability Analysis in the Case with PV System Installed
This section represents the simulation results for the power system model with the PV system installed instead of SG3. As described above, the PV system also has FRT capability, the same as the VSWG. The results of Case 3, the coordinated reactive power control with the VSWG and PV system, are also shown in this section.
Figure 17 shows . It can be seen that the oscillations of in Cases 2 and 3 are significantly restrained. In particular, the oscillation in Case 3 is greatly restrained and quickly converged.
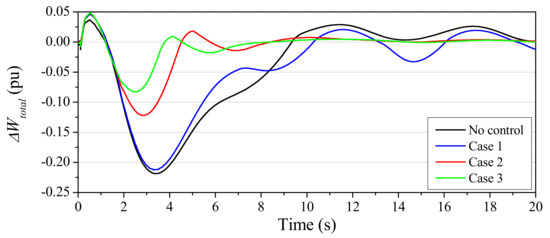
Figure 17.
: deviation of summation of kinetic energy of each SG (with PV system installed).
Figure 18 shows the power system frequency. It is clear that the frequency fluctuations are smaller in Cases 2 and 3. In these cases, each value of |Δf| is maintained less than or equal to 0.2 Hz after 10.0 and 6.8 s, respectively.
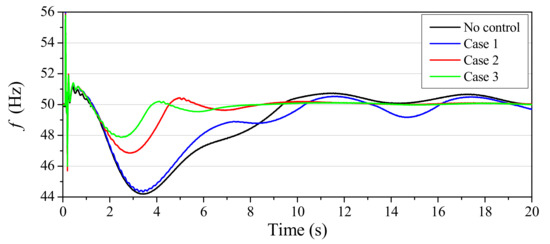
Figure 18.
Power system frequency (with PV system installed).
Figure 19 shows the grid voltage at bus 7. It can be seen that the voltage fluctuations in Cases 2 and 3 are effectively restrained. In particular, the overshoot voltage in Case 3 is suppressed. Each value of |ΔV| in Cases 2 and 3 is maintained less than or equal to 1% of pre-fault voltage after 11.1 and 8.3 s, respectively.
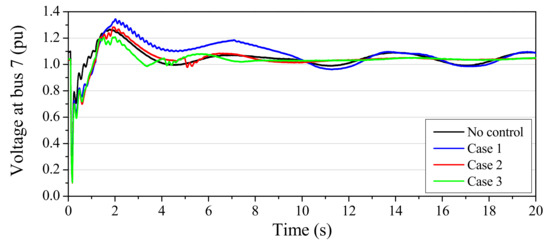
Figure 19.
Voltage at bus 7 (with PV system installed).
Figure 20, Figure 21 and Figure 22 show the active power, the reactive power and the apparent power of the VSWG, respectively. In Case 1, although the kinetic energy released from the rotor of the VSWG to the grid increases more than that in case with SG3 installed, both oscillations of and Δf are not sufficiently restrained as shown in Figure 17 and Figure 18. On the other hand, in Cases 2 and 3, both oscillations of and Δf are sufficiently restrained in spite of the smaller release of the active power than that in Case 1. The kinetic energy released from the rotor of the VSWG to the grid in each case is depicted in Table 4. As can be seen from Figure 21, the amount of reactive power absorbed by the VSWG in Case 3 is less than that in Case 2. This is because the PV system also absorbs the reactive power to suppress the overshoot voltage after the fault clearing.
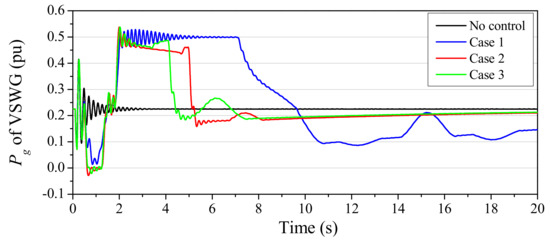
Figure 20.
Active power of the VSWG (with PV system installed).
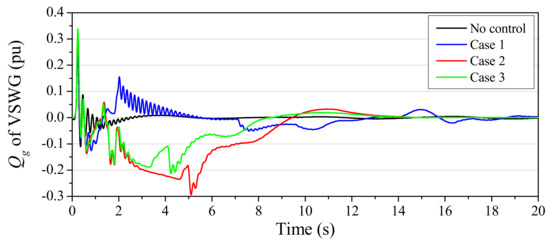
Figure 21.
Reactive power of the VSWG (with PV system installed).
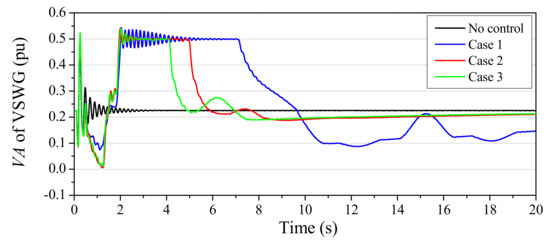
Figure 22.
Apparent power of the VSWG (with PV system installed).

Table 4.
Released energy from rotor of the VSWG in case with PV system installed.
Figure 23 shows the rotor speed of the VSWG. It can be seen that the deceleration of the rotors in Cases 2 and 3 is far less than that in Case 1. This is because, as can be clearly seen from Table 4, the kinetic energy released from the rotor in Cases 2 and 3 is smaller than that in Case 1.
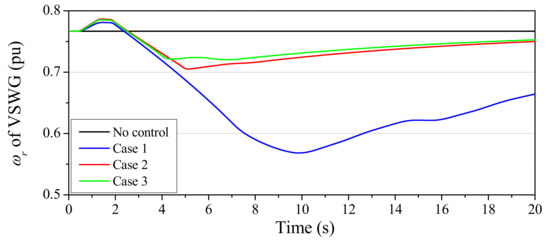
Figure 23.
Rotor speed of the VSWG (with PV system installed).
Figure 24 shows the DC-link voltage of the VSWG. The DC-link voltage fluctuation in Case 3 converges relatively faster than those in other cases.
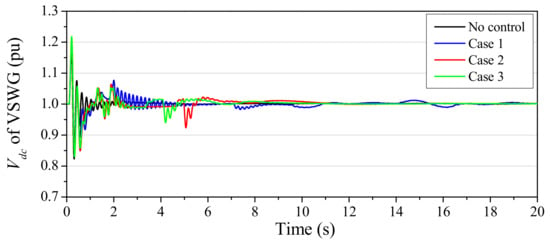
Figure 24.
DC-link voltage of the VSWG (with PV system installed).
Figure 25 and Figure 26 show the active and reactive power outputs of the PV system. It can be seen that the reactive power in Case 3 is controlled based on the voltage–reactive power characteristic as shown in Figure 3. However, as described above, as the time constants of the control system of the PV system were set to larger values than those of the VSWG to avoid the hunting of the reactive power output, the response of the reactive power of the PV system in Case 3 is slower than that of the VSWG. Therefore, as can be seen from Figure 19 and Figure 26, the reactive power control of the PV system mainly contributes to the suppression of the overshoot and the fluctuation of the voltage after the fault clearing.
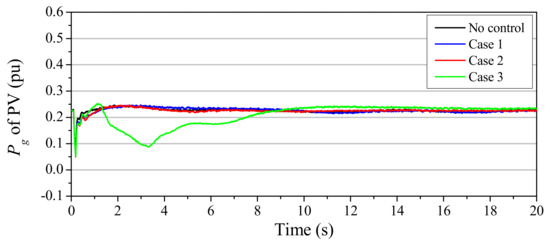
Figure 25.
Active power of PV (with PV system installed).
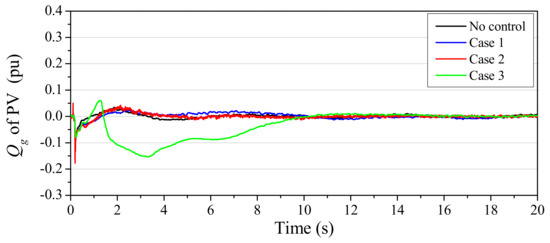
Figure 26.
Reactive PV power (with PV system installed).
Finally, the results of the simulations performed under the various conditions are summarized. Table 5 shows the integrated value from 0 to 20 s of the absolute value of , divided by pre-fault value. A low value represents small oscillation and hence better transient stability [20]. It is clear that the transient stability can be enhanced in all of the simulation cases by using the proposed method. In particular, the control methods of Cases 2 and 3 effectively enhance the transient stability.

Table 5.
Integrated value of absolute value of .
5. Conclusions
In this paper, a novel control method for transient stability enhancement using the active and reactive power control of a VSWG is presented. In addition, the effect of the coordinated reactive power control between the PV system and the VSWG on the stability enhancement is demonstrated. The effects of the control methods were evaluated by transient simulations performed using a modified IEEE nine-bus power system network. The conclusions obtained through the case studies can be summarized as follows:
- The transient stability can be enhanced by releasing the kinetic energy accumulated in the rotor of the VSWG. In this work, the kinetic energy injected to the grid is controlled according to the frequency measured in the local area.
- The transient stability can be further enhanced by combining the reactive power control of the VSWG. In this work, the reactive power injected to the grid was controlled according to the grid voltage. As the frequency fluctuations are restrained, the kinetic energy released to the grid can be reduced, and hence the deceleration of the rotor of the VSWG can be suppressed.
- The transient stability can be further enhanced by combining the reactive power control of the PV system with the VSWG control. In this work, the reactive power output of the PV system was also controlled based on the same control scheme as that of the VSWG.
As the proposed method is based on the local control strategy, it is not optimized as a closed-loop system. As the proposed method does not require wide-area measurement technologies such as a phasor measurement unit (PMU), however, power producers can easily use it as an ancillary service. As the system frequency is used as the control input, the effect of the control method on the transient stability enhancement may, in principle, be significant as use of VSWG systems implemented with control units increases. Further analysis of the proposed method considering the capacity and the location of the VSWG and PV system in a more realistic grid model (IEEJ standard model possessing the distinctive characteristics of the Japanese power system [21]) will be conducted in future work.
Author Contributions
Conceptualization, M.Y. and J.T.; methodology, M.Y. and J.T.; software, M.Y.; validation, M.Y.; formal analysis, M.Y. and J.T.; investigation, M.Y., M.I. and J.T.; resources, M.Y.; data curation, M.Y.; writing—original draft preparation, M.Y.; writing—review and editing, M.Y., M.I. and J.T.; visualization, M.Y.; supervision, M.Y.; project administration, M.Y.; funding acquisition, M.Y. All authors have read and agreed to the published version of the manuscript.
Funding
This work was supported by JSPS KAKENHI Grant Number JP20K04448.
Conflicts of Interest
The authors declare no conflict of interest. The funders had no role in the design of the study; in the collection, analyses or interpretation of data; in the writing of the manuscript; or in the decision to publish the results.
References
- Global Wind Energy Council, Global Wind Report 2019. 2020. Available online: https://gwec.net/ (accessed on 27 October 2020).
- Photovoltaic Power Systems Technology Collaboration Programme, 2020 Snapshot of Global PV Markets, Report IEA PVPS T1-37. 2020. Available online: https://iea-pvps.org/ (accessed on 27 October 2020).
- Xia, S.; Zhang, Q.; Hussain, S.T.; Hong, B.; Zou, W. Impacts of Integration of Wind Farms on Power System Transient Stability. Appl. Sci. 2018, 8, 1289. [Google Scholar] [CrossRef]
- Eftekharnejad, S.; Vittal, V.; Heydt, G.T.; Keel, B.; Loehr, J. Impact of Increased Penetration of Photovoltaic Generation on Power Systems. IEEE Trans. Power Syst. 2013, 28, 893–901. [Google Scholar] [CrossRef]
- Kumar, D.S.; Sharma, A.; Srinivasan, D.; Reindl, T. Impact Analysis of Large Power Networks with High Share of Renewables in Transient Conditions. IET Renew. Power Gener. 2020, 14, 1349–1358. [Google Scholar] [CrossRef]
- Yagami, M.; Ishikawa, S.; Ichinohe, Y.; Misawa, K.; Tamura, J. Power System Transient Stability Analysis in the Case of High-penetration Photovoltaics (part 2). In Proceedings of the 2015 IEEE PowerTech Conference, Eindhoven, The Netherlands, 29 June–2 July 2015. No. 457168. [Google Scholar]
- Hazari, M.R.; Mannan, M.A.; Muyeen, S.M.; Umemura, A.; Takahashi, R.; Tamura, J. Fuzzy Logic based Virtual Inertia Control of DFIG based Wind Generator for Stability Improvement of Hybrid Power System. IEEJ Trans. PE 2018, 138, 733–744. [Google Scholar] [CrossRef]
- Zhou, M.; Dong, Z.; Li, H.; Gan, C.; Li, G.; Liu, Y. Coordinated Control of DFIG Based Wind Farms and SGs for Improving Transient Stability. IEEE Access 2018, 6, 46844–46855. [Google Scholar] [CrossRef]
- Ullah, N.R.; Thiringer, T. Variable Speed Wind Turbines for Power System Stability Enhancement. IEEE Trans. Energy Convers. 2007, 22, 52–60. [Google Scholar] [CrossRef]
- Yousefian, R.; Bhattarai, R.; Kamalasadan, S. Transient Stability Enhancement of Power Grid with Integrated Wide Area Control of Wind Farms and Synchronous Generators. IEEE Trans. Power Syst. 2017, 32, 4818–4831. [Google Scholar] [CrossRef]
- Firouzi, M.; Gharehpetian, G.B.; Salami, Y. Active and Reactive Power Control of Wind Farm for Enhancement Transient Stability of Multi-machine Power System using UIPC. IET Renew. Power Gener. 2017, 11, 1246–1252. [Google Scholar] [CrossRef]
- Jozuka, T.; Iriguchi, T.; Komami, S. Value Comparison Between FRT and DVS Functions on Renewable Energy. Electr. Eng. Jpn. 2018, 205, 33–40. [Google Scholar] [CrossRef]
- Anderson, P.M.; Fouad, A.A. Power System Control and Stability, 2nd ed.; John Wiley & Sons, Inc.: Hoboken, NJ, USA, 2003; p. 38. [Google Scholar]
- The Institute of Electrical Engineers of Japan (IEEJ). Electrical Power System Standard Models; Technical Report No. 754; IEEJ: Tokyo, Japan, November 1999. [Google Scholar]
- Shirasaki, K.; Amano, H. Impacts of Dynamic Reactive Current Control with Renewable Energy Sources on Power System Stability in large disturbance. Proceedings of IEEJ Power and Energy Conference (online), 9–11 September 2020; p. 191. (In Japanese). [Google Scholar]
- Sano, K.; Okada, N.; Shirasaki, K.; Iwatsuki, H. Criterion for Continuous Oscillation of Reactive Power caused by the Frequency Feedback Method with Step Injection of Reactive Power. IEEJ Trans. PE 2018, 138, 659–670. (In Japanese) [Google Scholar] [CrossRef]
- Rosyadi, M.; Umemura, A.; Takahashi, R.; Tamura, J.; Park, M. Dynamic Analysis of Offshore Wind Farm with PM Wind Generators using Simplified Model. In Proceedings of the 2013 IEEE PowerTech Conference, Grenoble, France, 16–20 June 2013. No. A5240MR. [Google Scholar]
- Muyeen, S.M.; Tamura, J.; Murata, T. Stability Augmentation of a Grid-Connected Wind Farm; Springer: London, UK, 2009; p. 64. [Google Scholar]
- Rosyadi, M.; Umemura, A.; Takahashi, R.; Tamura, J.; Uchiyama, N.; Ide, K. Simplified Model of Variable SpeedWind Turbine Generator for Dynamic Simulation Analysis. IEEJ Trans. Power Energy 2015, 135, 538–549. [Google Scholar] [CrossRef]
- Yagami, M.; Murata, T.; Tamura, J. An Analysis of Optimal Reclosing for Enhancement of Transient Stability. Electr. Eng. Jpn. 2004, 147, 32–39. [Google Scholar] [CrossRef]
- IEEJ Power and Energy, Japanese Power System Models. Available online: http://denki.iee.jp/pes/?page_id=141 (accessed on 24 November 2020).
Publisher’s Note: MDPI stays neutral with regard to jurisdictional claims in published maps and institutional affiliations. |
© 2020 by the authors. Licensee MDPI, Basel, Switzerland. This article is an open access article distributed under the terms and conditions of the Creative Commons Attribution (CC BY) license (http://creativecommons.org/licenses/by/4.0/).