3.1. Process Parameter Development
For the processing of MMC materials, suitable process parameters need to be developed. In order to investigate the impact of different process parameters, a randomized full factorial DoE (Design of Experiment) experimental plan was created based on the starting parameters. The main factors—laser power and exposure speed—were varied on two levels by ca. ± 10% relative to the central point of the experimental plan. The hatching distance as the third common main factor was not adapted [
11]. Tungsten content started at 40 vol%. This value is found to be one of the highest particle volume contents investigated in L-PBF studies regarding steel-based MMCs [
7]. The central point of the 40 vol% experimental plan presents the starting parameters developed for MS1 by the methodology of Pfaff et al. [
11]. In each experimental plan, three control points were used for the center. Each sample was measured three times by the Archimedean principle. Each plan was executed once. All experimental plans are listed in
Table 1. The hatch distance was set as 0.09 mm. However, the final experimental plan (W, 60 vol% 2nd adaption) was repeated with different hatch distances of 0.07 mm and 0.05 mm to check its influence. As the overall picture regarding density does not change, only the measurements for 0.07 mm are depicted in
Figure 1. Slim experimental plans were chosen in order to keep the number of samples within one build cycle low. This can prevent cross-contaminations by side products, faulty recoating or unsuitable positioning in the building volume (e.g., side positions).
The theoretical density (ρ
theo) that can be expected from the corresponding tungsten content (V
Tungsten) is calculated by the ideal linear rule of mixtures
with ρ
Tungsten = 19.25 g/cm
3 and ρ
MS1 = 8.1 g/cm
3.
Figure 1 presents the measured Archimedean density in comparison to the theoretical value. With an increase in tungsten content from 40 to 50 and 60 vol% (black data points), a descending trend in density was observed. This behavior can be explained by the fact that the tungsten particles had an influence on process-relevant properties such as thermal conductivity or absorptivity of the laser energy. Therefore, the boundary conditions in the powder bed changed. This leads to the necessity of adapting the process parameters in order to counteract the descending densities with increasing tungsten content. Consequently, adapted DoE matrices were applied to shift and expand the process parameter variations. Additionally, the powder bed, which was not heated for the starting parameters, was heated to ca. 90 °C. These measures led to an improvement in the overall density level in the case of 60 vol% tungsten. However, a further descending density from 60 to 70 vol% tungsten was monitored (red data points). Concentrating on the 60 vol% tungsten volume content, another optimization iteration of the process parameters resulted in densities close to the theoretical density (green data points).
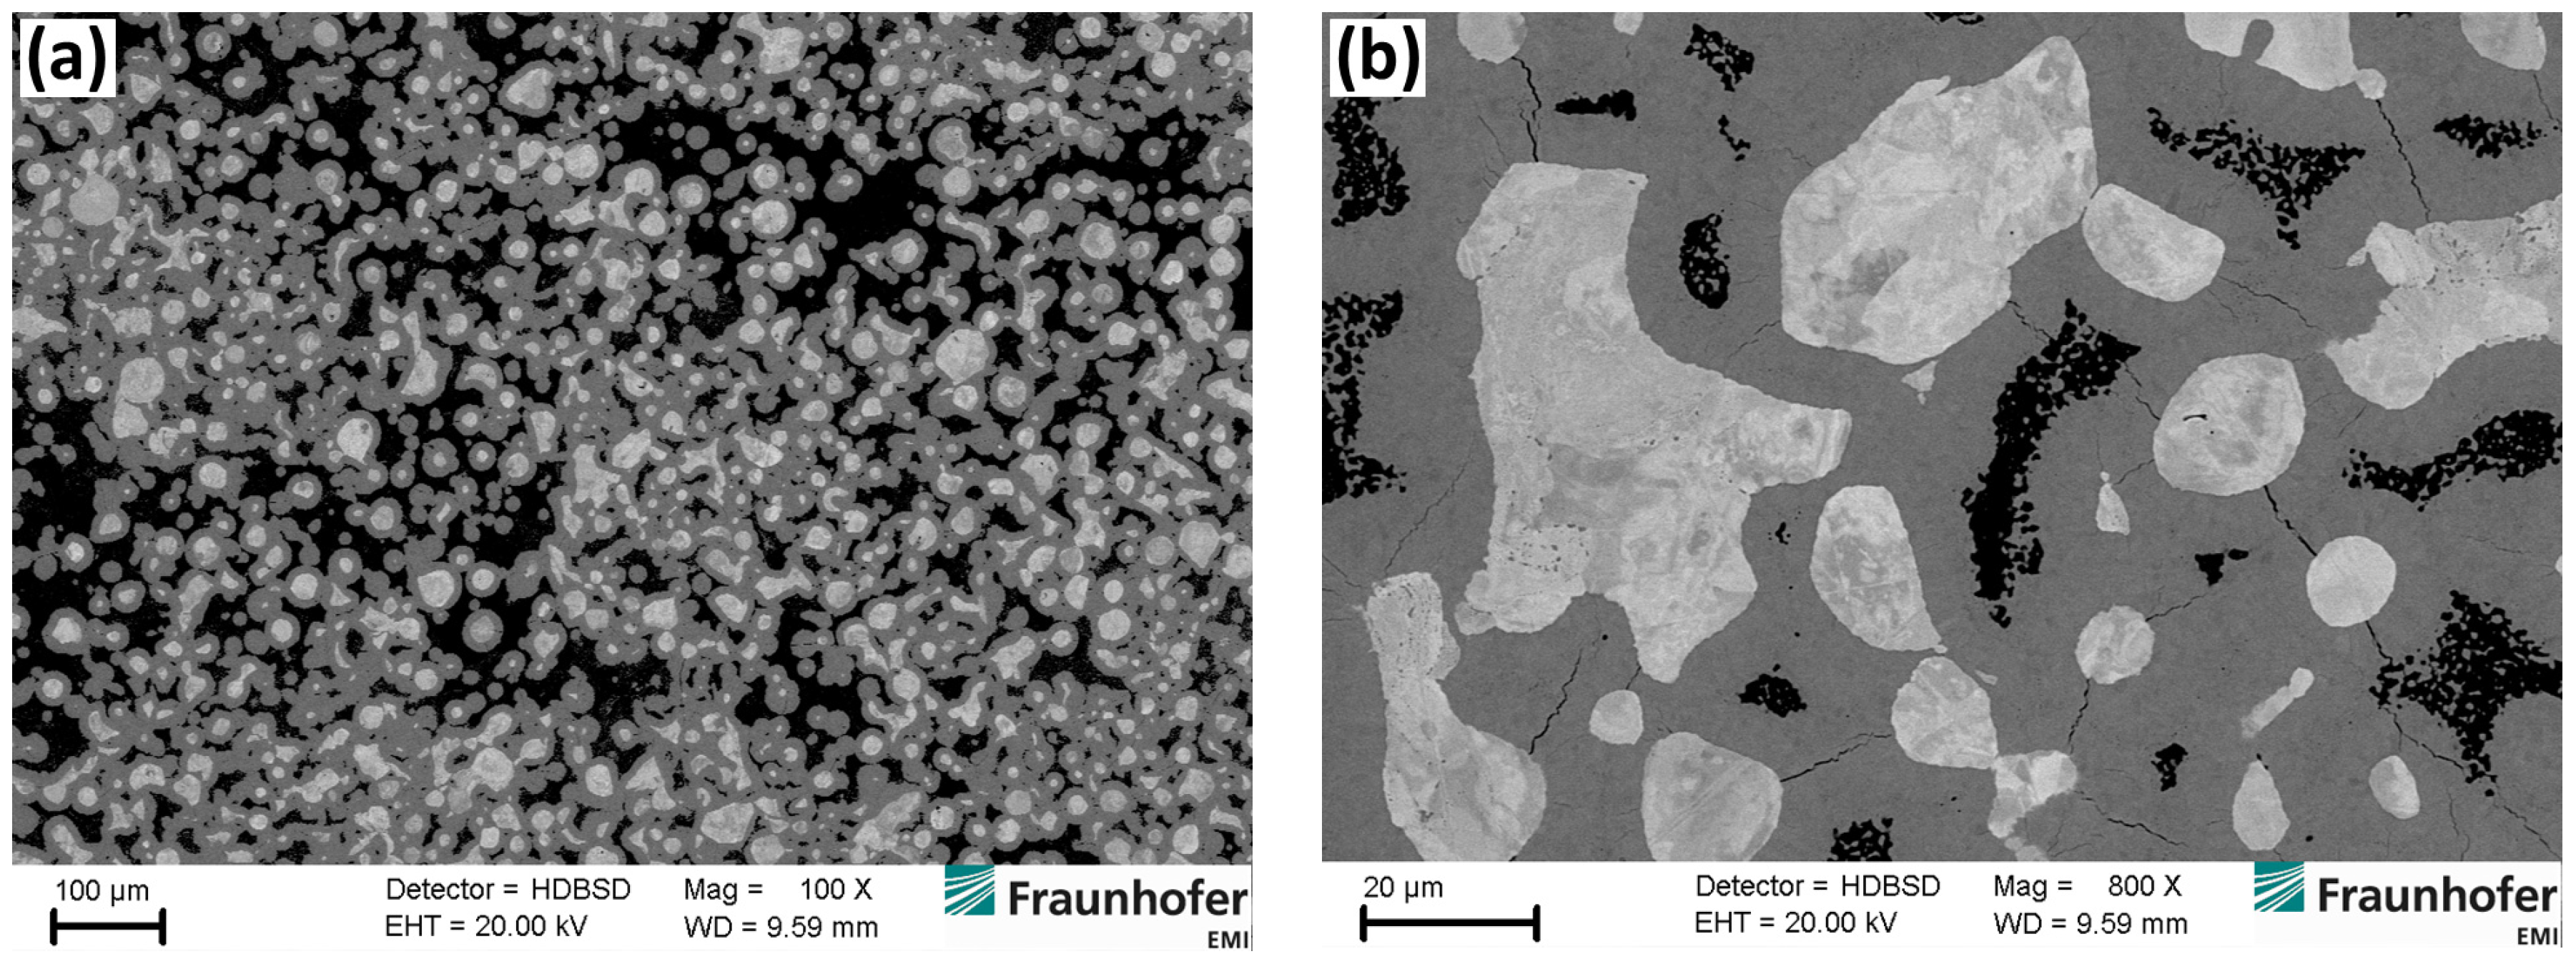
The measured density is influenced by porosities as well as the actual tungsten volume content. Thus, low porosity leads to high densities, whereas high porosity results in lower densities.
Figure 2a,b highlights these two cases. The tungsten volume content can differ from the nominal value. Illustrative images of corresponding microstructures are presented in
Figure 2c,d, respectively. This phenomenon can arise because of inhomogeneity originating in the mixing process or because of the mechanical interaction of the recoater blade of the L-PBF machine with the powder bed. Another reason for this phenomenon can be the application of an excessive energy density. This can lead to temporary, high local temperatures above the melting point of tungsten, allowing single tungsten particles to fuse or deform during a short period. The resulting change in morphology is shown in
Figure 2c. The change in tungsten content explains why positive deviations of the expected relative densities can be observed.
The observed characteristics “porosity”, “tungsten content“ and “particle morphology” proved to be challenging for an analysis of the experimental plans in
Table 1. Density measurements by the Archimedean principle, as they are common for the development of L-PBF process parameters, are insufficient because all characteristics mentioned above impact the result. The use of µCT measurements has been tested within this work. However, because of the high X-ray absorption of tungsten, the quality of the results was insufficient for an evaluation (not presented within this publication). While the tungsten content and the porosity can be quantified based on microscopical images, there is no approach to quantify the particle morphology. DoE approaches, as they are used for the development of process parameters for monomaterials, should therefore be adapted for MMCs. This could be done by moving the process window of the experimental plans into an area where no or low fusion of filling particles can be observed. Single laser track experiments, as shown by Pfaff [
11], could be used to define a suitable process window. Because of the time-consuming sample preparation and analysis by microscopy, it is advisable to keep the experimental design as lean as possible (e.g., fractional designs). Because of the described challenges, a thorough analysis of the experimental designs in
Table 1 was not possible. However, because the process parameter variation should mainly serve to fabricate a material of sufficient quality for a proof-of-concept of the material combination, the parameter combination resulting in the lowest porosity was picked out of all samples showing no excessive deformation or fusing of the tungsten particles. All following investigations were based on the main process parameters of 90 W, 500 mm/s, 0.07 mm and W 60% vol%, resulting in the following characteristics: ~1.1% porosity, ~58% tungsten content and “spherical” morphology.
Energy-dispersive X-ray spectroscopy (EDS) measurements confirmed the presence of tungsten particles surrounded by an iron-based matrix. In
Figure 3a, the measured EDS profile of the matrix is shown, exhibiting all major constituting elements of the matrix as well as tungsten in the background. Part (b) shows the corresponding profile measured on a tungsten particle.
3.2. Tensile Test
In order to obtain first information on the mechanical behavior of the generated MMC material, three tensile test specimens with 60 vol% tungsten content were built with the same processing parameters (90 W, 500 mm/s, 0.07 mm and W 60% vol%, see
Section 3.1) and tested afterwards. The resulting stress–strain curves are shown in
Figure 4a. The corresponding microstructure is depicted in (b) and (c).
Ultimate tensile strengths (UTS) of 758, 833 and 836 MPa were measured at strains between 0.5 and 1.0%. It can be stated that all samples exhibited similar failure behavior, pointing out a homogenous and stable building process. Moreover, the results showed that the material tolerated some plastic deformation. However, the ultimate tensile strength was below the UTS of about 1100 MPa of pure MS1 [
12]. The corresponding microstructure revealed some porosity, which might affect the mechanical performance. This indicates a possible improvement of the MMC, e.g., by further adjusting the process parameters.
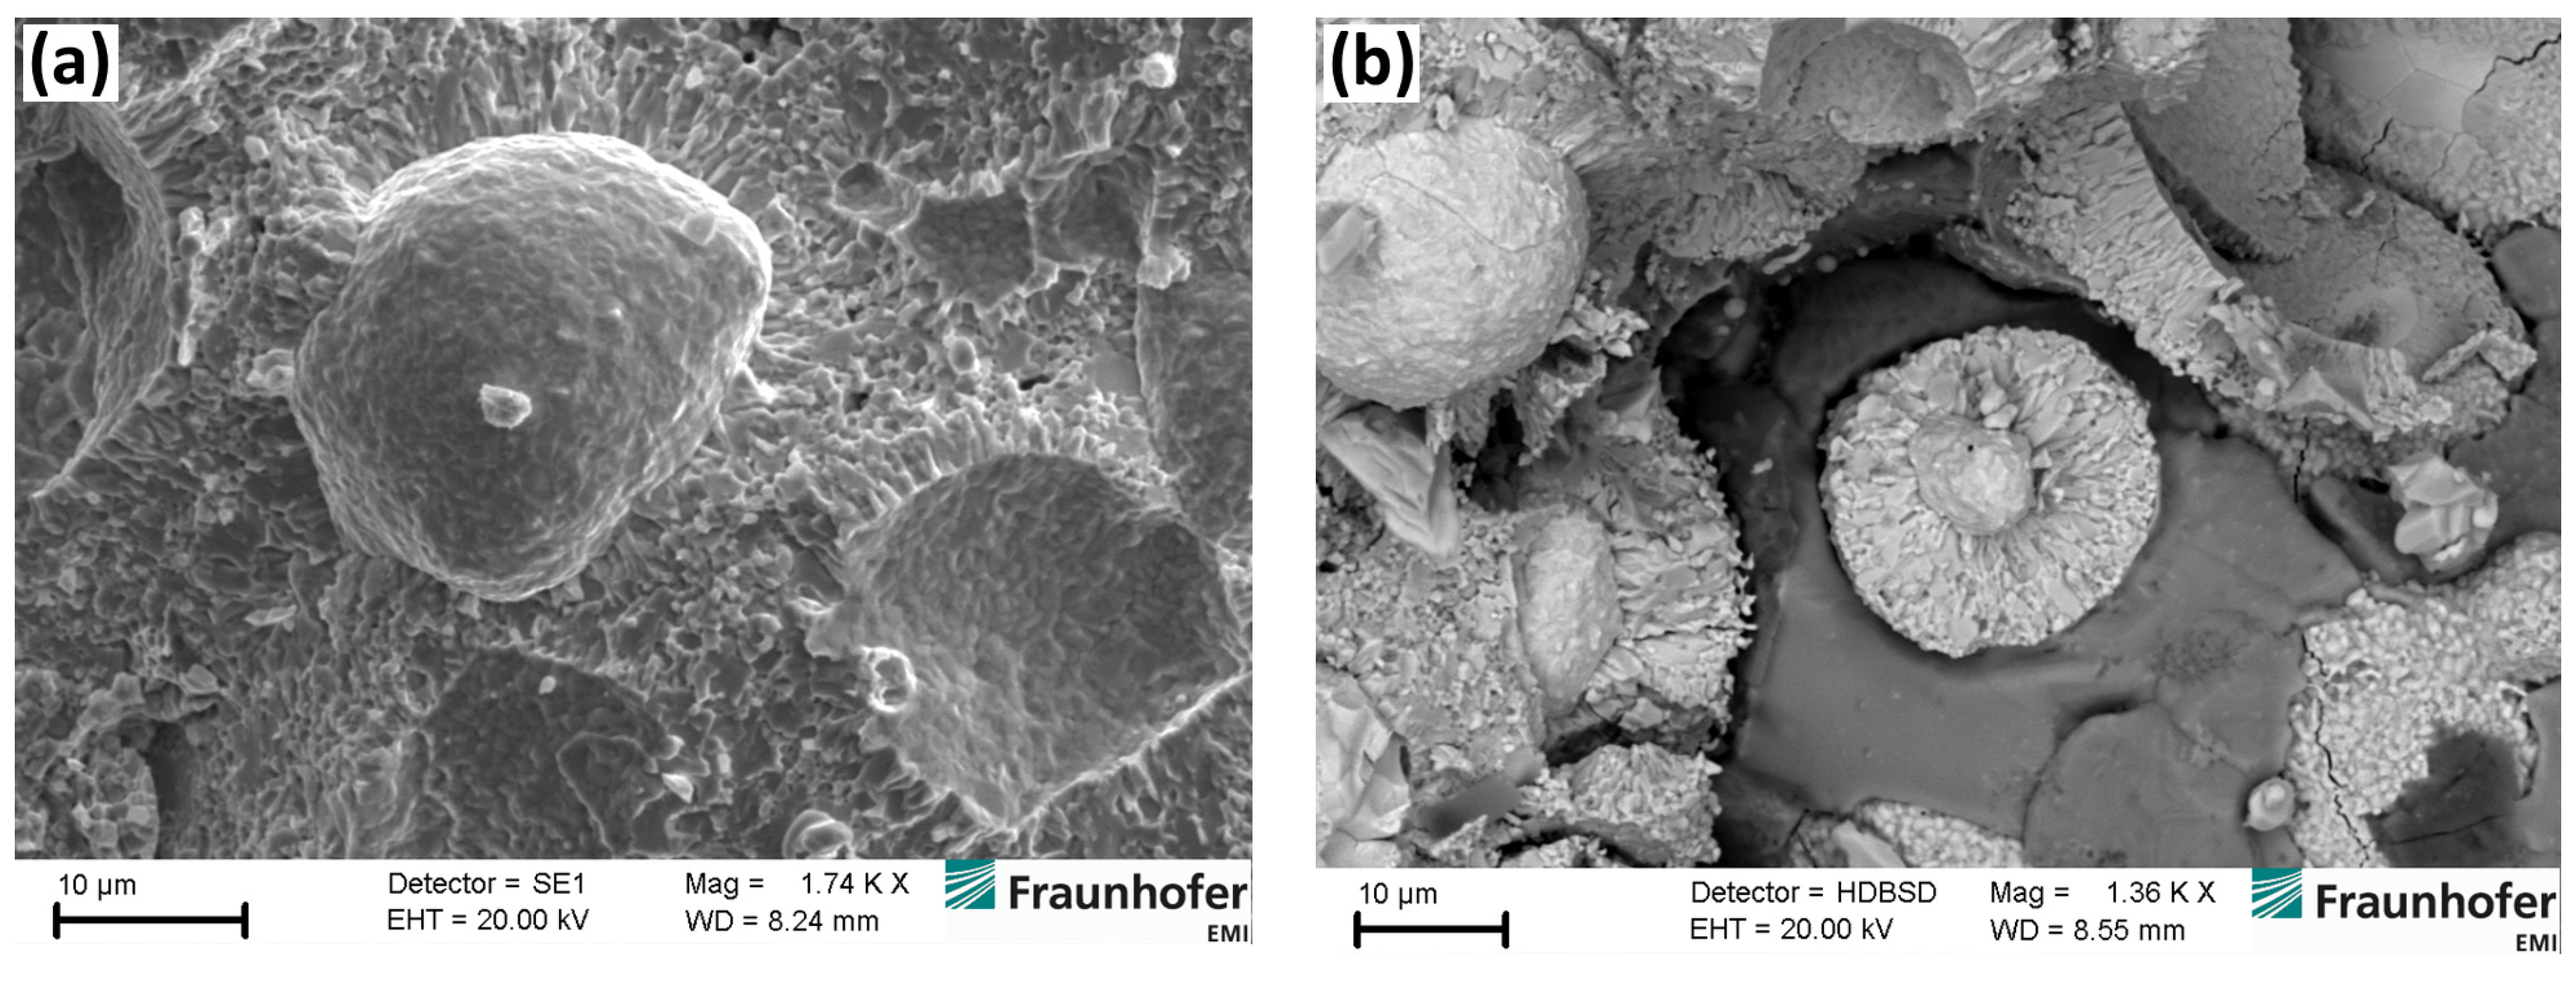
3.3. SEM Analysis of Failure Surface
A scanning electron microscopy (SEM) analysis of the failure surface of one tensile test specimen is shown in
Figure 5.
In the backscatter image (a), it can be seen that the heavy tungsten particles (bright grey) were distributed over the whole sample surface. The dark areas represent the lighter steel matrix phase. However, porosity was clearly visible, e.g., the dark hole at the right side of the image. Regarding the failure behavior, tungsten intraphase failure and a few cracks in the steel matrix can be stated (indicated by red arrows). Having a closer look at the failure surface (b), it can be observed that the tungsten particles were thoroughly embedded in the steel matrix. Thus, the tungsten particles were not ripped off the matrix during the tensile test, but cleavage planes of the particles dominated the failure surface. This indicates that the contact between the matrix and reinforcing particles was strong enough to withstand the applied tensile forces.
3.4. Heat Treatment
The pure matrix material MS1 is supposed to be heat treated at 490 °C for 6 h [
12] to reach higher UTS and hardness. However, this heat treatment was not considered to be expedient, as it would possibly promote the formation of intermetallic phases. Because of the nickel-rich MS1, the growth of Ni-W precipitates at the interface between the tungsten particles and steel matrix would be most likely. Such intermetallic precipitates are known to embrittle the interface and reduce the toughness of the material [
13]. In contrast to this, a dissolution of potential Ni-W precipitates is desirable. According to Ellinger and Sykes [
14] and Walsh and Donachie [
15], the dissolution of N-W phases takes place at temperatures above 1093 °C. Therefore, heat treatment at a sufficiently high temperature of 1200 °C and a shorter duration of 1 h, followed by quenching in water, was attempted. The SEM analysis of a metallographic specimen (60 vol% tungsten) after this heat treatment is presented in
Figure 6.
After a look at the backscatter image of the metallographic specimen, it can be stated that the heat treatment led to the formation of a pronounced interphase (medium grey). The tungsten particles (bright grey) dissolved into the steel matrix (black). The fact that the medium grey areas exhibited no transition from a brighter to a darker grey underlines the formation of an interphase. Moreover, cracks in the interphase were visible. Thermal stress due to heat treatment might be the reason for this phenomenon. This also indicates a brittle behavior of the interphase. EDS measurements (see
Figure 7) revealed that the interphase contained all measurable elements of the matrix and the reinforcement particles.
Additionally, a fracture surface of a heat-treated sample was analyzed in the SEM. From
Figure 8a, it can be concluded that the interface between tungsten particles and steel matrix was weakened due to heat treatment. A ripping-off of the particles at the fracture surface can be stated. Moreover, a radial pattern around the particles can be observed, indicating diffusion processes taking place during the heat treatment. In the backscatter image (b), a cracked tungsten particle can be seen. A core-shell-like structure was formed because of the diffusion processes started by the heat treatment.
This attempt effectively shows that MMCs can be modified by applying heat treatment steps. This might be used for the design of specific material properties. However, the combination of more than one material enhances the complexity of heat treatments themselves. Therefore, for shorter developing times it might be more expedient to generate MMCs by employing starting materials not necessary to be heat-treated after the building process.


