Article

Artificial Intelligence, Accelerated in Parallel Computing and Applied to Nonintrusive Appliance Load Monitoring for Residential Demand-Side Management in a Smart Grid: A Comparative Study

1
Department of Computer Science and Information Management, Providence University, Taichung City 43301, Taiwan
2
Department of Electrical Engineering, Ming Chi University of Technology, New Taipei City 243303, Taiwan
*
Author to whom correspondence should be addressed.
Appl. Sci. 2020, 10(22), 8114; https://doi.org/10.3390/app10228114
Submission received: 23 October 2020 / Revised: 13 November 2020 / Accepted: 13 November 2020 / Published: 16 November 2020

Abstract

:
A smart grid is a promising use-case of AIoT (AI (artificial intelligence) across IoT (internet of things)) that enables bidirectional communication among utilities that arises with demand response (DR) schemes for demand-side management (DSM) and consumers that manage their power demands according to received DR signals. Disaggregating composite electric energy consumption data from a single minimal set of plug-panel current and voltage sensors installed at the electric panel in a practical field of interest, nonintrusive appliance load monitoring (NIALM), a cost-effective load disaggregation approach for (residential) DSM, is able to discern individual electrical appliances concerned without accessing each of them by individual plug-load power meters (smart plugs) deployed intrusively. The most common load disaggregation approaches are based on machine learning algorithms such as artificial neural networks, while approaches based on evolutionary computing, metaheuristic algorithms considered as global optimization and search techniques, have recently caught the attention of researchers. This paper presents a genetic algorithm, developed in consideration of parallel evolutionary computing, and aims to address NIALM, whereby load disaggregation from composite electric energy consumption data is declared as a combinatorial optimization problem and is solved by the algorithm. The algorithm is accelerated in parallel, as it would involve large amounts of NIALM data disaggregated through evolutionary computing, chromosomes, and/or evolutionary cycles to dominate its performance in load disaggregation and excessively cost its execution time. Moreover, the evolutionary computing implementation based on parallel computing, a feed-forward, multilayer artificial neural network that can learn from training data across all available workers of a parallel pool on a machine (in parallel computing) addresses the same NIALM/load disaggregation. Where, a comparative study is made in this paper. The presented methodology is experimentally validated by and applied on a publicly available reference dataset.

1. Introduction

Nonintrusive appliance load monitoring (NIALM), also called nonintrusive load monitoring, was first investigated by George W. Hart et al. [1] at the Massachusetts Institute of Technology with funding from the Electric Power Research Institute in the early 1980s. It has been considered as a cost-effective alternative against intrusive load monitoring approaches that involve the deployment of plug-load power meters (smart plugs) for individual concerned electrical appliances in a practical field of interest (it cannot be costed down for the realization of load management) [2], and has been developed for (residential) demand-side management (DSM) in a smart grid [3,4]. With DSM implemented in a smart grid, consumers have the opportunity to improve their awareness of what and when their monitored electrical appliances should operate for use in response to demand response (DR) schemes [5]. Thus, power utilities coming up with DR schemes plan to address ever-increasing electric demand in an optimal way [6].
NIALM, load disaggregation by estimating appliance-by-appliance energy consumption from composite electric energy consumption data, is becoming mature with the improvement of advanced metering infrastructure for DSM in a smart grid [7,8], where load disaggregation is performed with/applied on smart meter data.
NIALM can be built upon signal processing [9], machine learning [4,9,10,11,12,13,14,15,16,17,18,19,20], and deep learning [20,21,22,23,24]. Not much attention has been paid to evolutionary computing, wherein load disaggregation is considered as a combinatorial optimization problem [1]. As a result, in this paper, load disaggregation is declared as a combinatorial optimization problem, and is solved by a genetic algorithm (GA) accelerated in parallel computing. GA used to solve NIALM that is declared as a combinatorial optimization problem would involve large amounts of electric energy consumption data gathered from smart meters deployed in practical fields of interest in a smart grid, population-based candidate solutions evaluated, and/or evolutionary cycles executed from iteration to iteration, which is a highly demanding task in terms of performance in load disaggregation and computational time in evolutionary computation. Hence, GA conducted in this paper for NIALM is parallelized during evolution. The GA-based NIALM in this paper is processed and accelerated in consideration of parallel computing. It has been experimentally validated by and applied on a publicly-available reference dataset considered in this paper. Besides the GA-based NIALM, a feed-forward, multilayer artificial neural network (ANN)-based NIALM against other different types of ANNs (deep NNs)-based NIALM addresses the same NIALM data from the considered publicly available reference dataset. A comparative study is made in this paper. ANNs used in this paper to address NIALM can learn from NIALM data across parallel workers on a machine supporting parallel computing.
The remainder of this paper is structured below. The investigated methodology is presented in Section 2. Section 3 gives the experimentation and results. Conclusions are drawn in Section 4, where future work is also anticipated.

2. Methodology

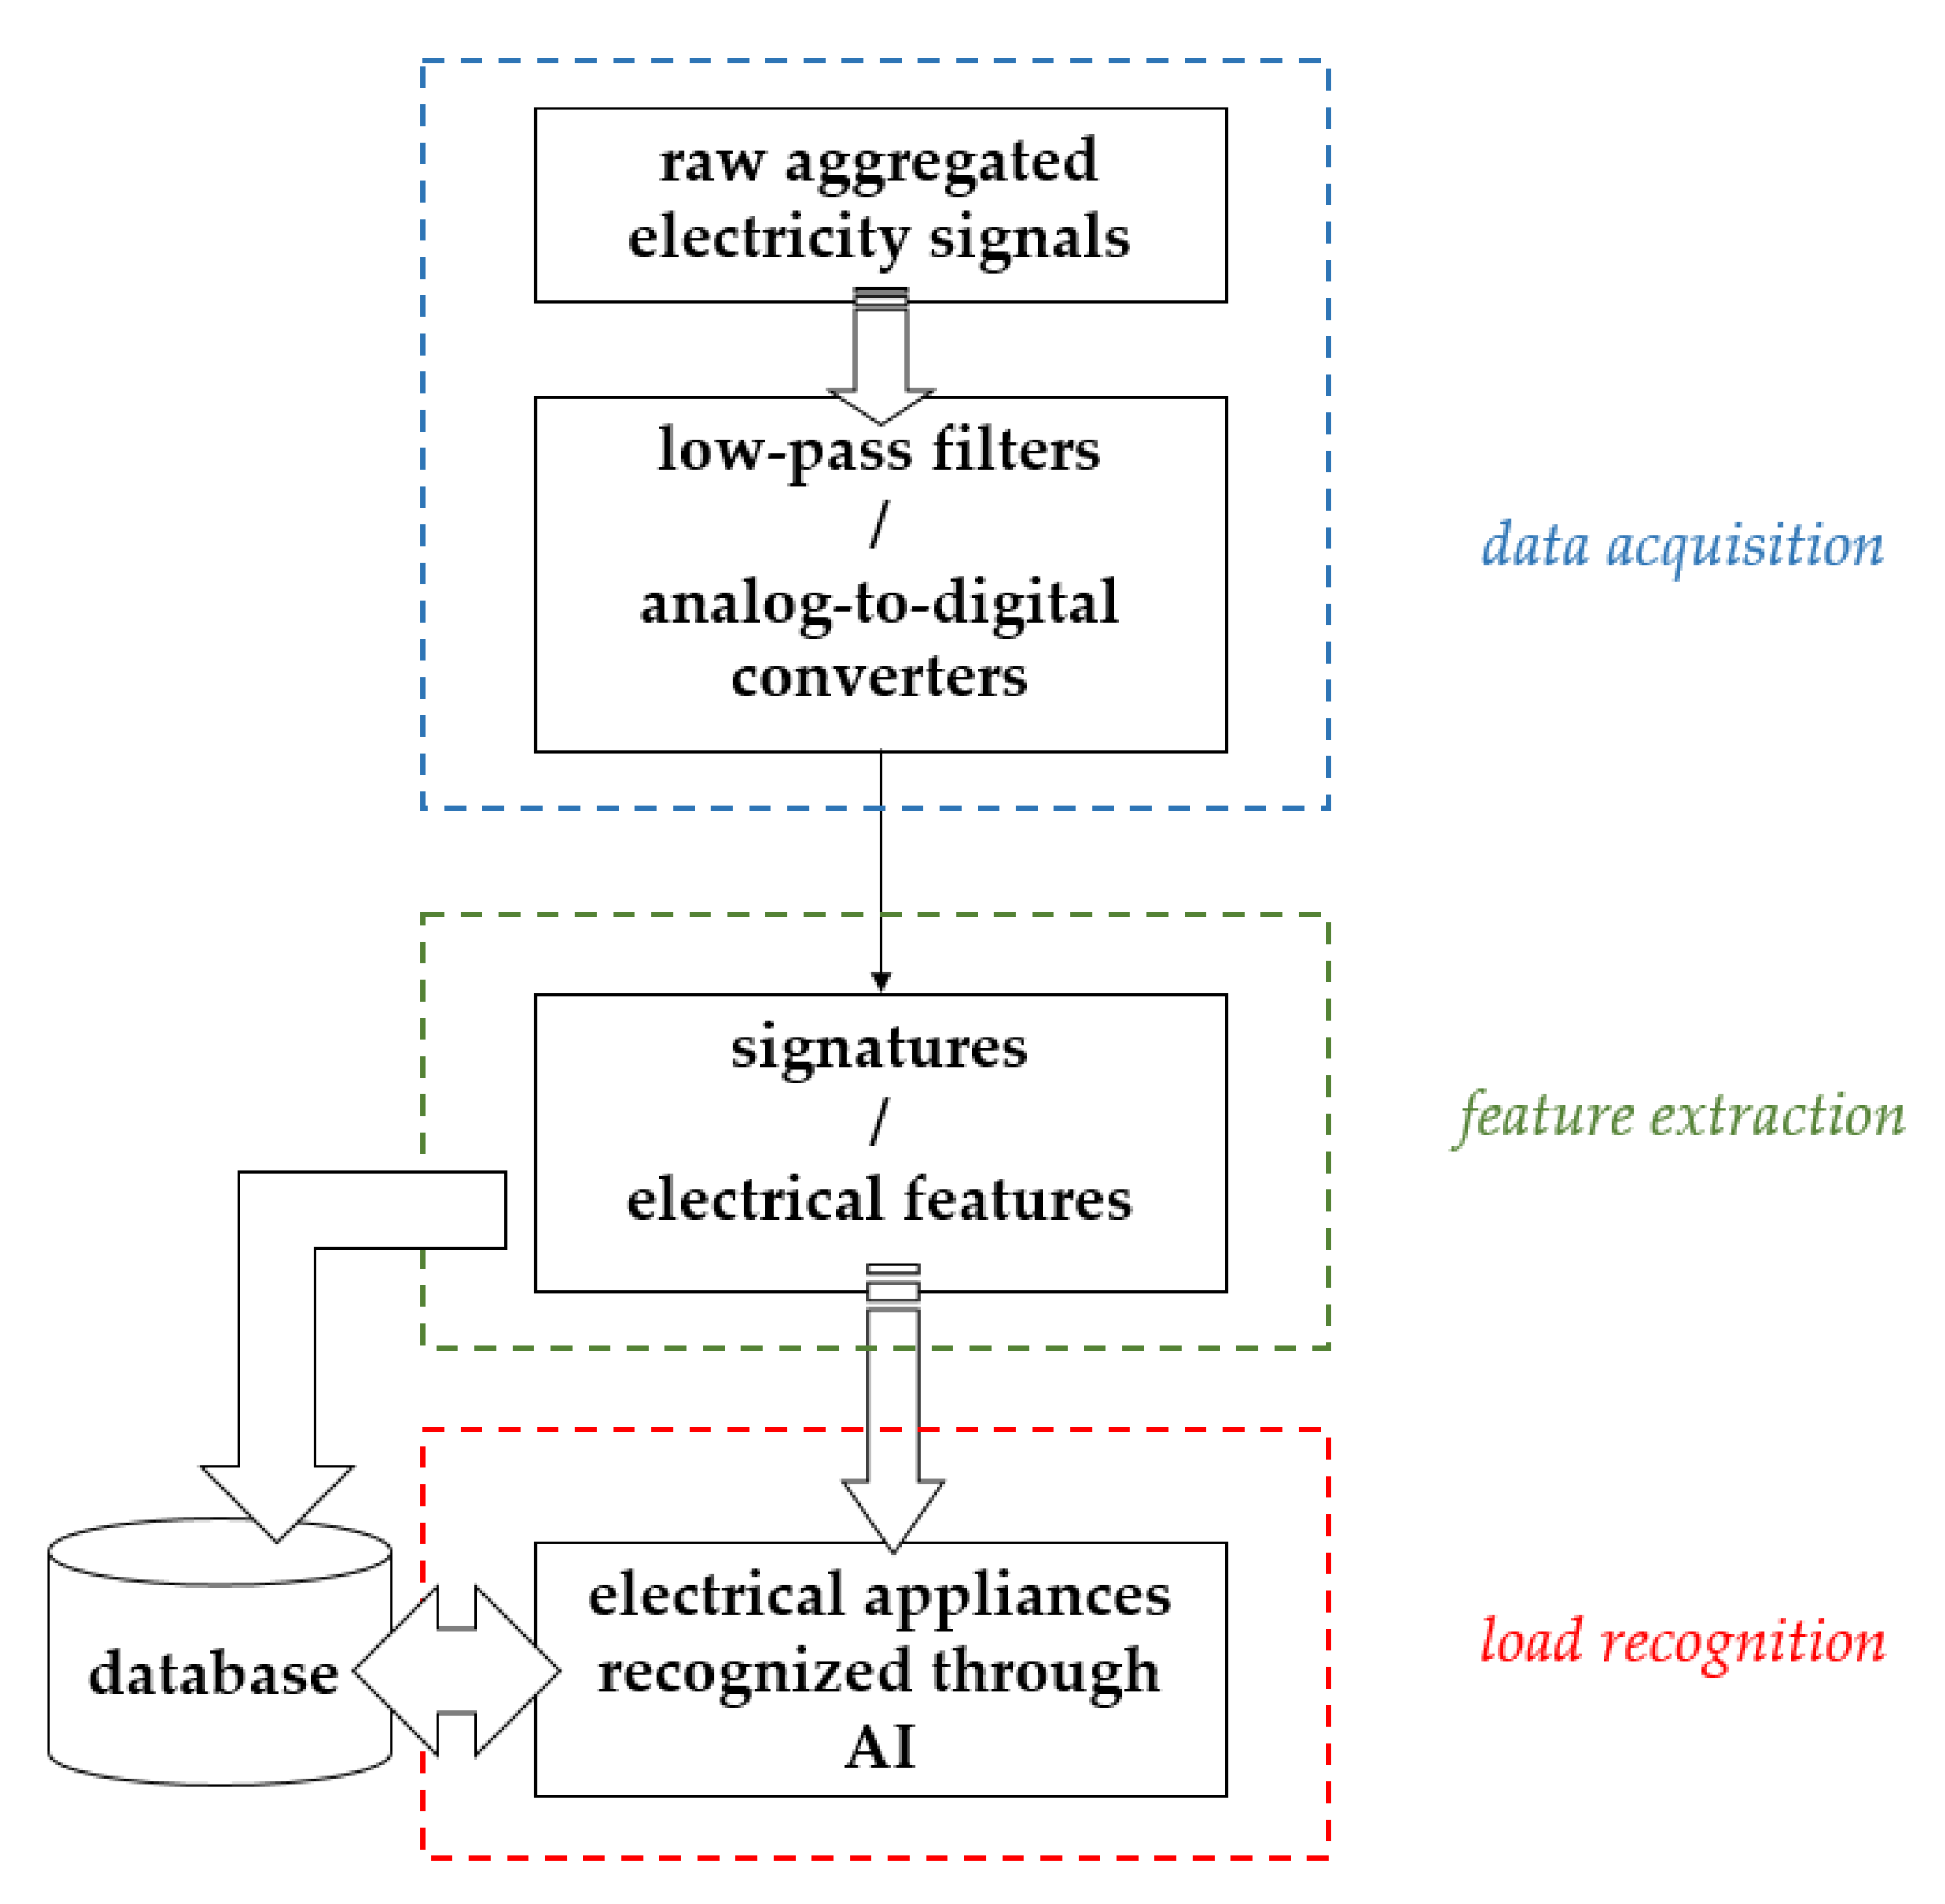
Figure 1 describes a basic (eventless) NIALM process consisting of (1) data acquisition: composite electric energy consumption data are measured by a single minimal set of plug-panel current and voltage sensors and digitized for further analysis of load disaggregation; (2) feature extraction: electrical features are extracted as feature data from digitized composite electric energy consumption data for concerned electrical appliances; and (3) load recognition: artificial intelligence (AI) is utilized to recognize extracted electrical features for concerned electrical appliances—their electric demand based on past trends can be predicted. The NIALM investigated in this paper is an eventless NIALM approach. AI conducted in the NIALM is parallel computing accelerated evolutionary computing. The basic NIALM problem can be formulated as follows:
If (1) P(t) stands for used composite power consumption acquired at time t and (2) Pi(t) accounts for real power absorbed by concerned electrical appliance i (profiling concerned electrical appliances and base load is done in advance), the total power consumption, P(t) (=y(t)), in an electric power distribution system can be expressed as Equation (1). In Equation (1), the summation of superimposed absorptions Σxi(t)Pi(t) with an unmonitored base load Pbase(t) is made. In Equation (1), N is the total number of concerned electrical appliances and xi(t), a unit value from {0, 1}, is the on/off operational status of electrical appliance i at time t. NIALM is used to recognize the unknown (possible) operational status of concerned electrical appliances xi(t)|i = 1, 2, ..., N at time t when P(t) (=y(t)) acquired and given with Pbase(t) is known: [x1(t), x2(t), ..., xi(t), ..., xN(t)] = F(y(t)) where F is a function that returns the best N estimates of xi(t) at time t for concerned individual N electrical appliances. F above can be any AI algorithm. In this paper, we conduct evolutionary computing, GA, to metaheuristically search for the optimal load combinations xi(t) of concerned electrical appliances when acquired total power consumption P(t) with base load Pbase(t) is given at time t (in Equation (1), profiling concerned electrical appliances to get Pi(t) and statistically computing base load for Pbase(t) from unmonitored electrical appliances is done prior.
P ( t ) = i = 1 N x i ( t ) P i ( t ) + P b a s e ( t )
In this paper, NIALM is declared as a combinatorial optimization problem, which is formulated as the objective metric in Equation (2) and solved by a parallel computing accelerated GA.
e r r ( t ) = arg min | [ P ( t ) P b a s e ( t ) ] i = 1 N x i ( t ) [ P i ( t ) + τ i ] |
where τ i = c i s t d ( P i ( t ) ) .
In Equation (2), Pi (=mean(Pi(t))) obtained in advance involves profiling each of concerned electrical appliances based on historical data. That is, Pi(t), in Equation (1), or Pi, in Equation (2), accounts for the real power that was absorbed by electrical appliance i and statistically computed for load disaggregation. Pbase, in Equation (2), from Pbase(t), in Equation (1), is defined in a similar sense, and its standard deviation can be considered. In Equation (2), τi, a tolerance term for Pi, is considered, where std(Pi(t)) is a function that returns the standard deviation of its input elements Pi(t) from historical data and ci is a constant that can be designed as a time-dependent parameter.
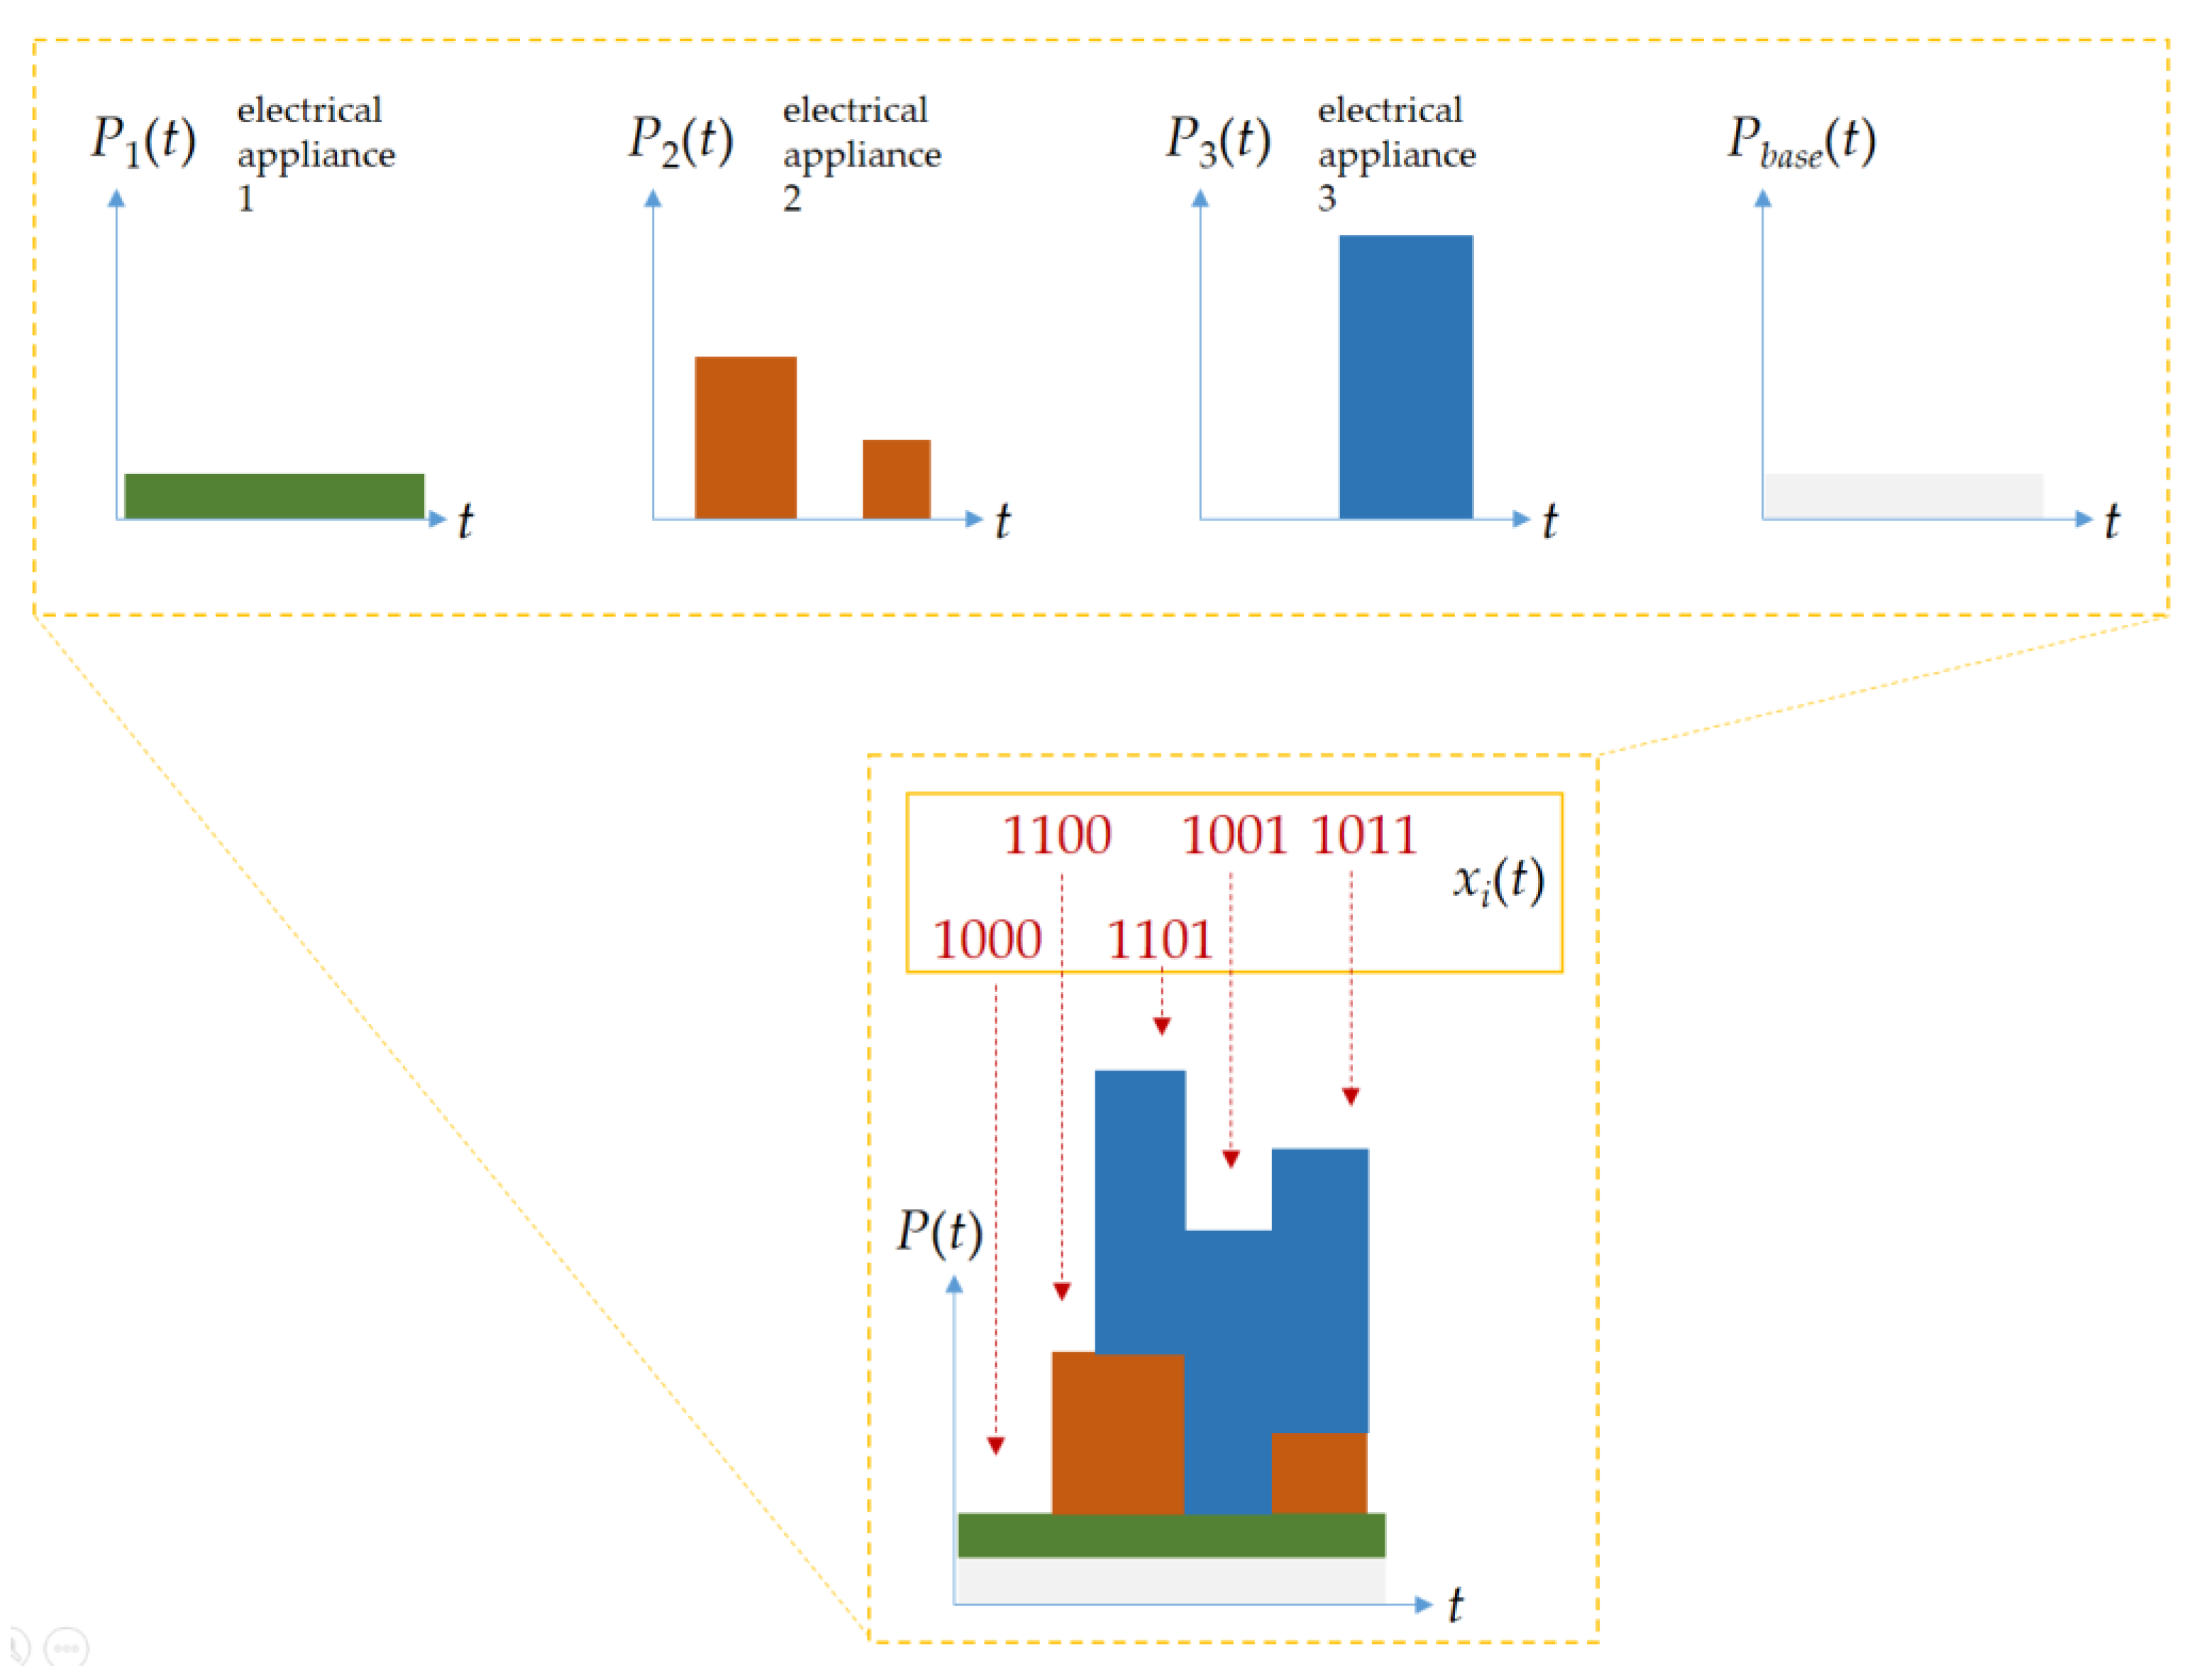
Figure 2 illustrates the principle of combinatorial search for load combinations with xi(t) in Equation (2) for load disaggregation, which aims to optimize load combinations by xi(t). In Figure 2, Pi(t) represents the assumed power demand of the i-th electrical appliance. xi(t) associated with Pi(t) is represented as a binary vector, evolved through metaheuristics, and used to minimize Equation (2) (the minimal error, err(t), to be obtained for load disaggregation) between the summation of superimposed absorptions Σxi(t)Pi(t) with an unmonitored base load Pbase(t) and the total load P(t) (P(t) to be approximated from a pack of Pi(t) with Pbase(t)). A metaheuristic algorithm, GA, is suitable for load disaggregation formulated in Equation (2) (the objective metric is the metric we are trying to optimize and the fitness metric is the algorithm’s guide to doing so), where concerned electrical appliances are recognized by parallel computing accelerated GA for the declared objective metric. Concerned electrical appliances are constant or time-varying resistive, inductive, or capacitive loads.
The NIALM investigated in this paper has the main objective of recognizing concerned electrical appliances for (residential) DSM according to a composition of appliance-level real power consumption, which is disaggregated from total real power consumption acquired apart for load disaggregation. That is, with the minimum in Equation (2), acquired total real power consumption is the total of real power consumption by all individual electrical appliances concerned and operated where a base load should be considered. To Equation (2), a parallel computing accelerated GA as a load recognizer for load recognition of the NIALM in this paper is used to recognize the correct xi(t) to gain the minimum between the acquired total real power consumption and the sum of superimposed real power consumption by concerned electrical appliances. In this paper, real power consumption, P, is extracted, as the electrical feature for load recognition in Figure 1, from acquired total real power consumption, which is disaggregated into appliance-level real power consumption through the parallel computing accelerated GA-based NIALM of Equation (2). Concerned electrical appliances to be recognized can be constant or time-varying resistive, inductive, and capacitive loads [4,25].

2.1. GA-Based NIALM

GAs are a stochastic, population-based metaheuristic optimization (search) algorithm that can search for the global (quasi-)optimal solution metaheuristically to both constrained and unconstrained, NP-hard/NP-complete discrete or continuous optimization problems addressed, through (natural) selection operations that select current chromosomes for further gene recombination and through genetic operations involving (1) crossover operations that combine genetic information from selected parents’ chromosomes to produce new offspring and (2) mutation operations that provide genetic diversity among population members. The evolutionary cycle is based on the principle of biological evolution. GAs that operate based on the principle of biological evolution have been proven to be an effective metaheuristics technique in many optimization problems.
In GAs, genetic operations, comprising crossover and mutation operations, and evolutionary operations, implementing the driving force of evolution (natural selection/Darwinism), are involved. See [26] for more details about a standard GA. In a GA addressing an optimization problem, a population of chromosomes as candidate solutions in a search space is evolved, from generation to generation, through genetic operations and evolutionary operations towards a global (quasi-)optimal solution. In an evolutionary cycle in a GA, a proportion of an existing population in its current generation is reproduced through selection operations and is used through crossover and mutation operations to breed a new population for the next generation. Selection operations select chromosomes based on a fitness-based selection procedure where chromosomes as candidate solutions are evaluated by a fitness function, and chromosomes with relatively high fitness are typically more likely to be selected. Also, crossover operations exchange subparts of two chromosomes, roughly mimicking the biological recombination between two haploid organisms. Finally, mutation operations randomly alter genes in some chromosomes, where an arbitrary bit of a chromosome is changed from its original state. In a GA, the population size depends on the nature of the problem addressed, but, typically, the population contains several hundreds or thousands of chromosomes/candidate solutions. Chromosomes are generated at random in the initial population. The evolutionary cycle is repeated, from generation to generation, until a termination condition such as a maximum of generations prespecified and reached has been met.
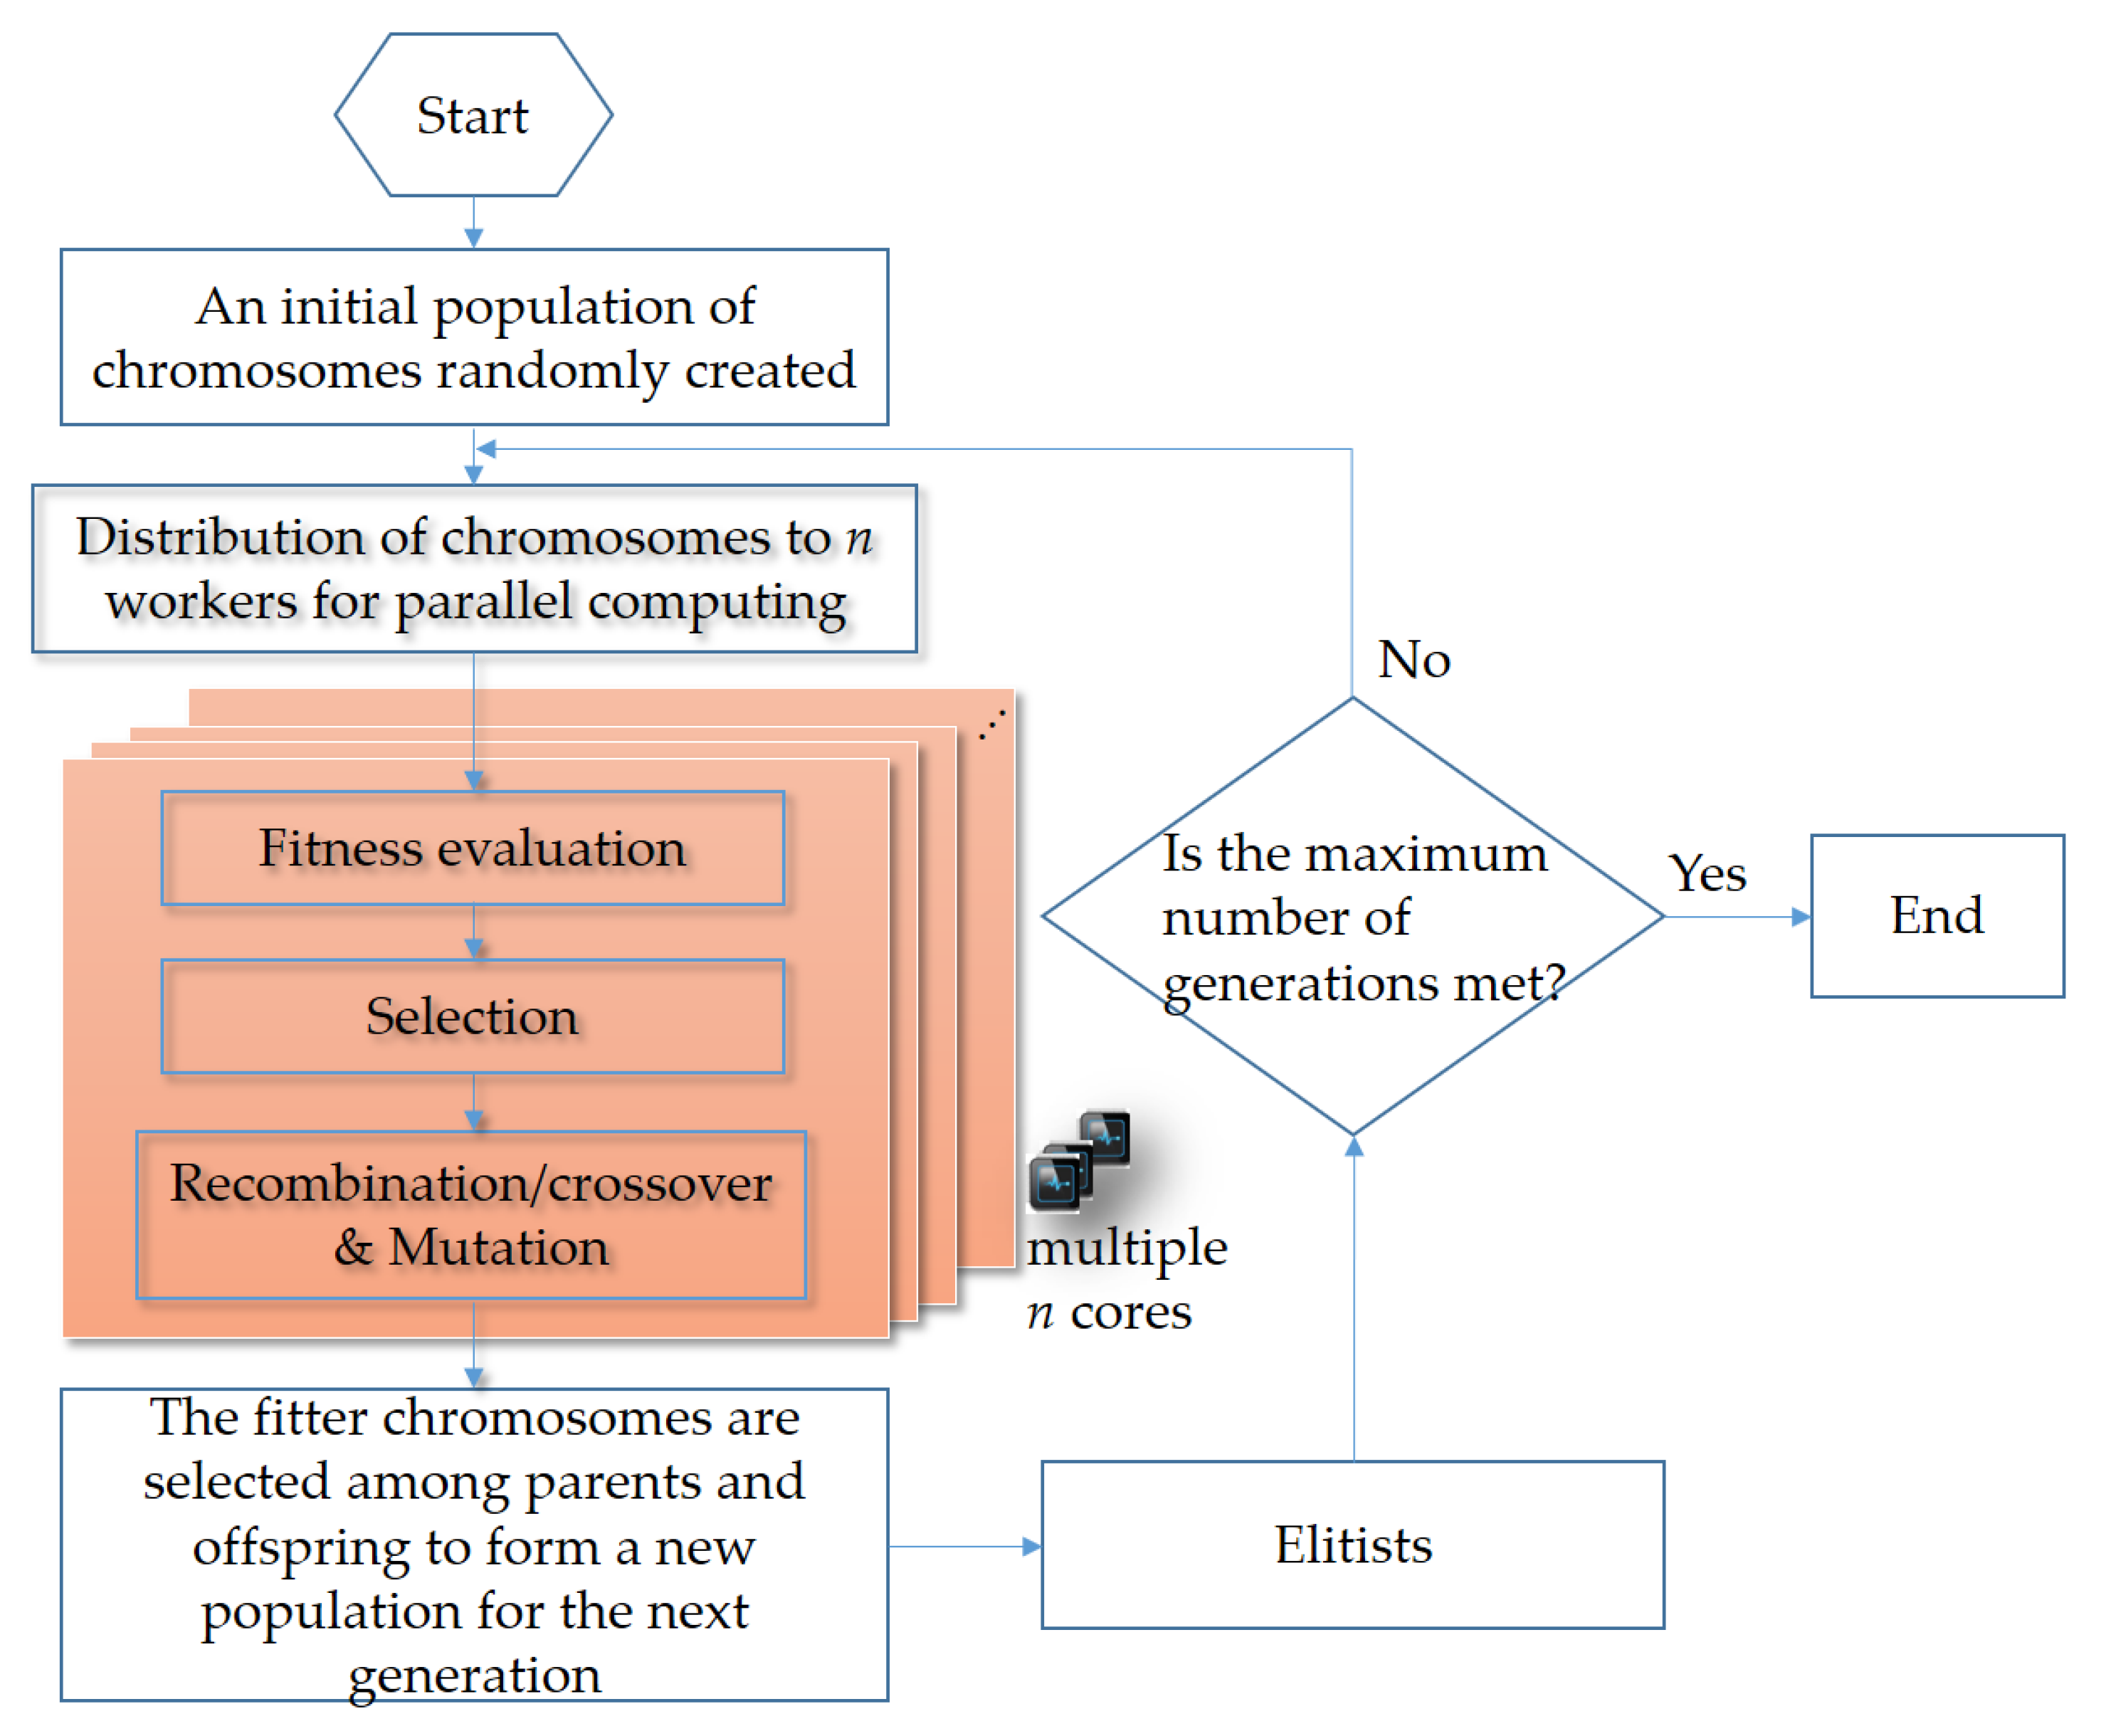
A GA used to address optimization problems is innately a parallel algorithm that can be run on a multicore processor. The workflow depicting the parallel computing accelerated GA used to solve Equation (2) for load recognition in the NIALM in this paper is shown in Figure 3. In the GA, function evaluations are farmed out to different processors on a multicore processor; they are executed in parallel.
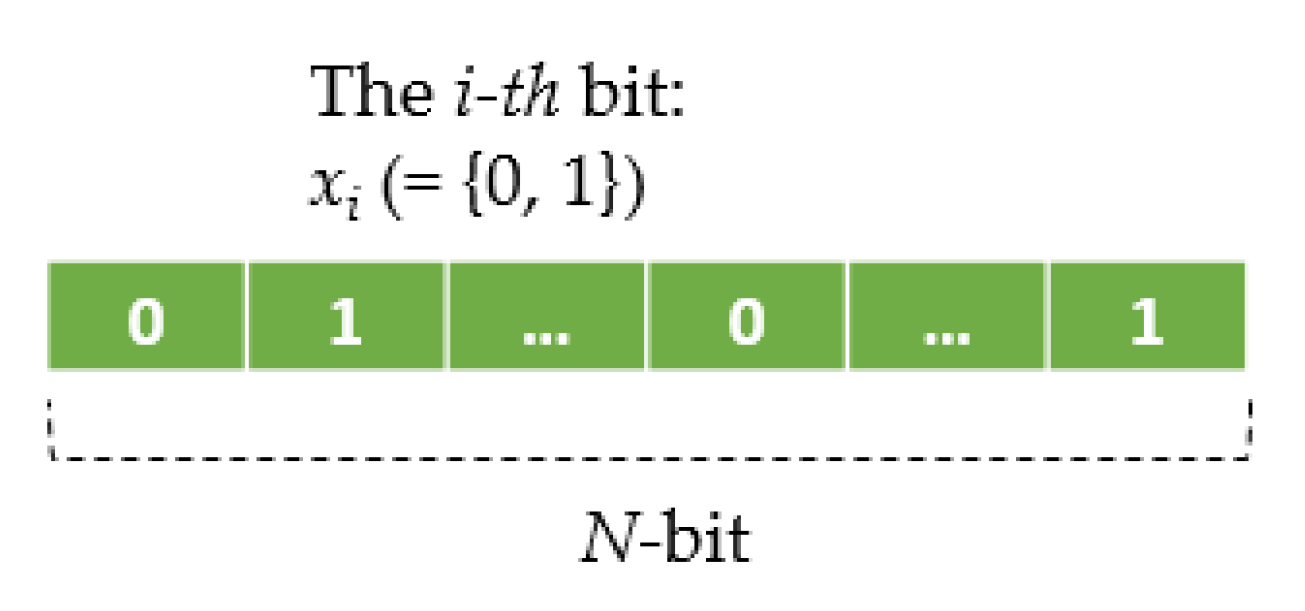
 Figure 4 shows that xi(t) (at time t) in Equation (2) are encoded as a chromosome for an evolutionary cycle of the GA. To evaluate a chromosome with Equation (2), the GA decodes it as a computed summation of superimposed absorptions Σxi(t)Pi(t). With an initial population of randomly generated chromosomes that are started in the parallel computing accelerated GA in Figure 3, successive generations are constructed through evolution. Fitter chromosomes are more likely to survive, based on selection, and to participate in genetic operations [27]. Here, (1) a roulette selection strategy choosing parents by simulating a roulette wheel in which the area of the section of the wheel corresponding to an individual is proportional to the individual’s expectation associated with its scaled fitness value is conducted (a ranking method that scales raw fitness values based on the rank of each individual rather than its raw fitness value is used for fitness scaling), (2) a single-point crossover operator is used, (3) a bit-wise mutation operator is utilized, and (4) an elitist strategy guaranteeing that the solution quality does not decrease during evolution is also conducted.

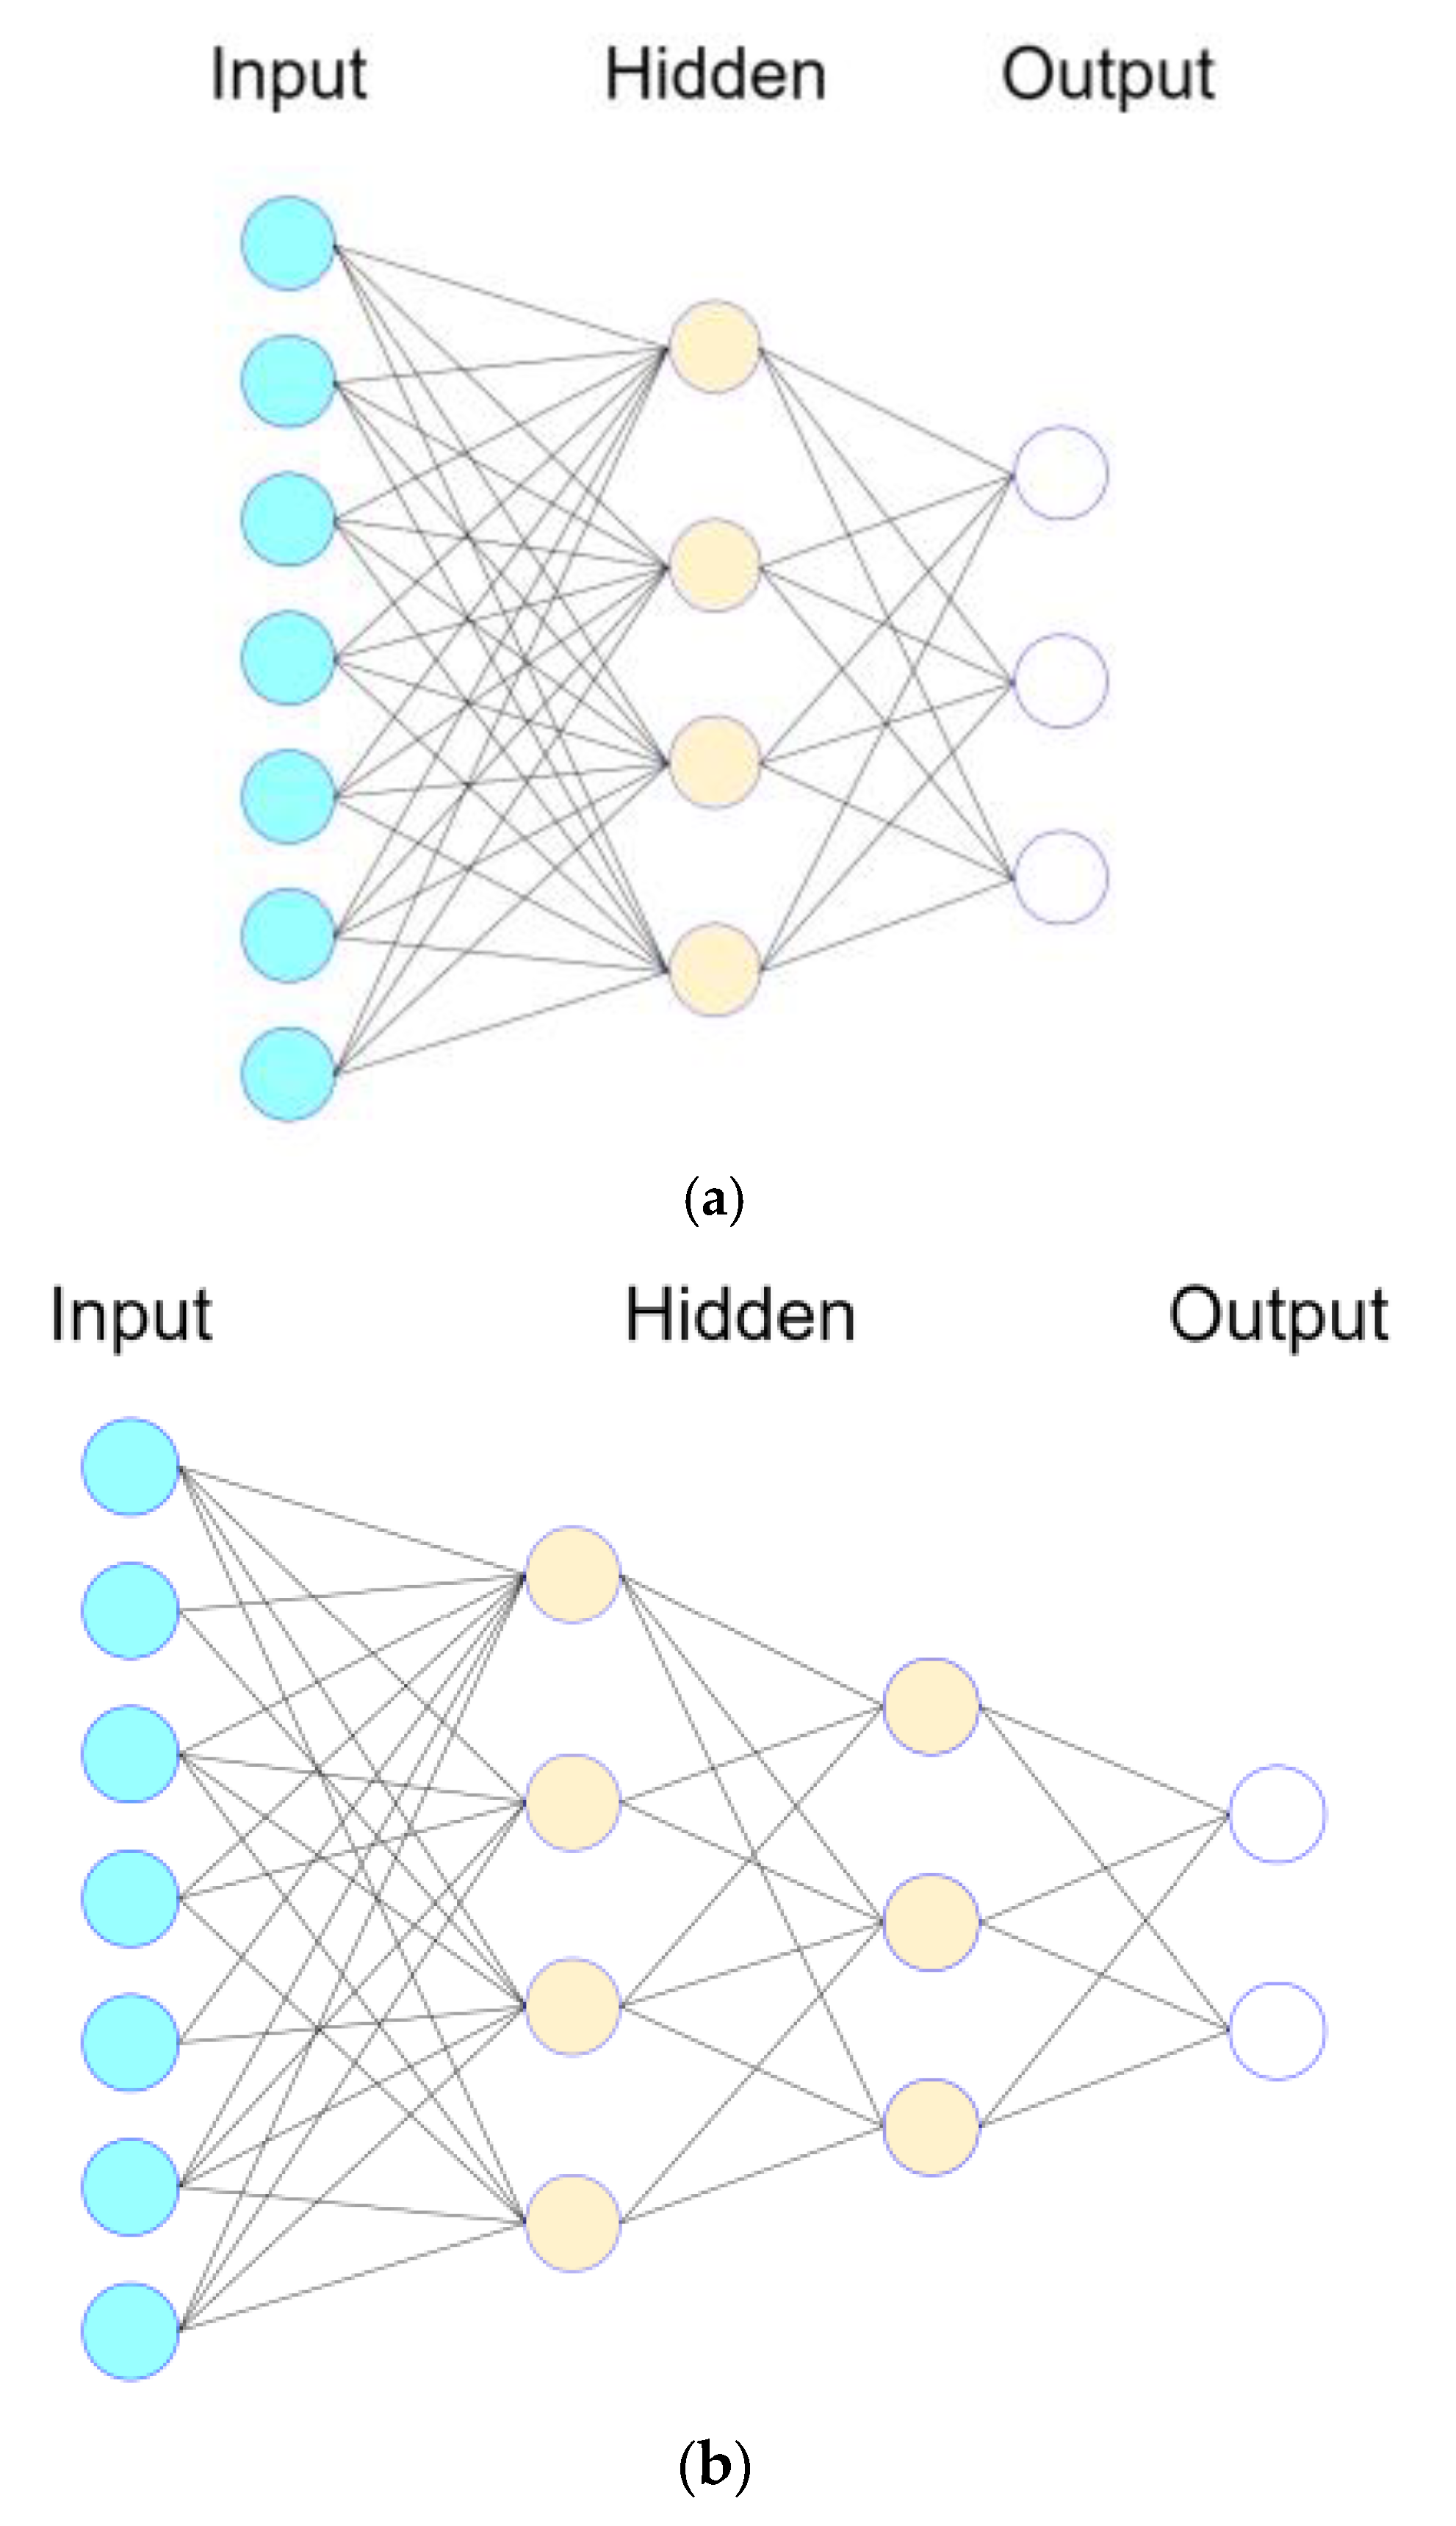
2.2. Feed-Forward, Multilayer ANN-Based NIALM

A feed-forward, multilayer ANN can be used to learn and distinguish from aggregated, extracted NIALM feature data for load disaggregation. In this paper, a comparative study where a feed-forward, multilayer ANN against the GA described in the previous subsection is used to address the same NIALM/load disaggregation problem, Equation (1), is conducted. As seen in Figure 5, a feed-forward, multilayer ANN contains an input layer, a number of intermediate hidden layers, and an output layer. The size of the input layer depends on the number of independent variables (extracted representative features) of considered feature data to be learned. The number of intermediate hidden layers with their size (the number of hidden neurons) specified in each hidden layer, can be determined experimentally through hyperparameter tuning where hyperparameters including the learning algorithm and the number of epochs for iterative rounds of learning affect how well the connectionism can represent the considered feature data (the hyperparameters are a set of parameters whose value is specified and used to control the learning process). The size of the output layer depends on the number of dependent variables (mutually exclusive classes) of considered feature data to be fitted.
In this paper, F1 score described in detail in the following subsection is conducted and used as the performance metric to indicate the effectiveness of the two parallel computing-accelerated AI approaches in load recognition for load disaggregation.

2.3. Performance Evaluation of Load Recognition by F1 Score

In this paper, as shown in Equation (3), F1 score [29] is used to evaluate the performance of the two parallel computing-accelerated AI approaches in load recognition for load disaggregation.
F 1 s c o r e = 2 P r e c i s i o n R e c a l l P r e c i s i o n + R e c a l l
In Equation (3), precision is a ratio of the total number of correctly recognized positives to the total number of predicted positives. Recall (i.e., sensitivity or hit rate) is a ratio of the total number of correctly recognized positives to the total number of actual positives. See ref. [29] for more details about precision and recall. To summarize, F1 score is the harmonic mean of precision and recall. A recognizer that produces no false positives has a precision of 1.0. A recognizer that produces no false negatives has a recall of 1.0. In Equation (3), an F1 score reaches its best value at 1.0 (perfect precision and recall). The higher the score, the better the recognition performance. Besides F1 score, we also use receiver operating characteristic (ROC) curves [29] to evaluate the performance of the two parallel computing-accelerated AI approaches in load recognition for load disaggregation. An ROC curve considering false positive rate (FPR) and true positive rate (TPR) is a graph showing the recognition performance of a recognizer examined at all recognition thresholds (or with different configuration settings) [29]. In an ROC curve, an error to a trained and validated recognizer can be computed by the Euclidean distance, from the perfect identification (FPR = 0, TPR = 1) til a resulting (FPR, TPR) [30,31] where FPR and TPR are defined as Equations (4) and (5), respectively. TPR is referred to as recall. As seen in Equations (4) and (5), ROC curves [29] are also used to evaluate the performance of the investigated methodology in load recognition, where TPR (a synonym for recall) defined in Equation (4) and FPR defined in Equation (5) are considered. See ref. [29] for more details about precision and recall.
TPR = TP TP + FN
FPR = FP FP + TN
In Equations (4) and (5), TP (true positives) means the data instances are recognized, and fit with reality. TN (true negatives) means the data instances are recognized, and the nonexistence fits with reality. FP (false positives) means the data instances are erroneously recognized as positives. Finally, FN (false negatives) means the data instances are incorrectly recognized as negatives.

3. Experimentation and Results

In this section, experiments are carried out to verify the validity of the investigated NIALM, by a publicly available UK-DALE (UK Domestic Appliance-Level Electricity) dataset [32]. The UK-DALE dataset contains records of power consumption measured and collected from five different households in the UK. In each house, the authors in [32] recorded both whole-house power consumption (power demand) from the mains every 6 s and power consumption by concerned individual electrical appliances every 6 s. 
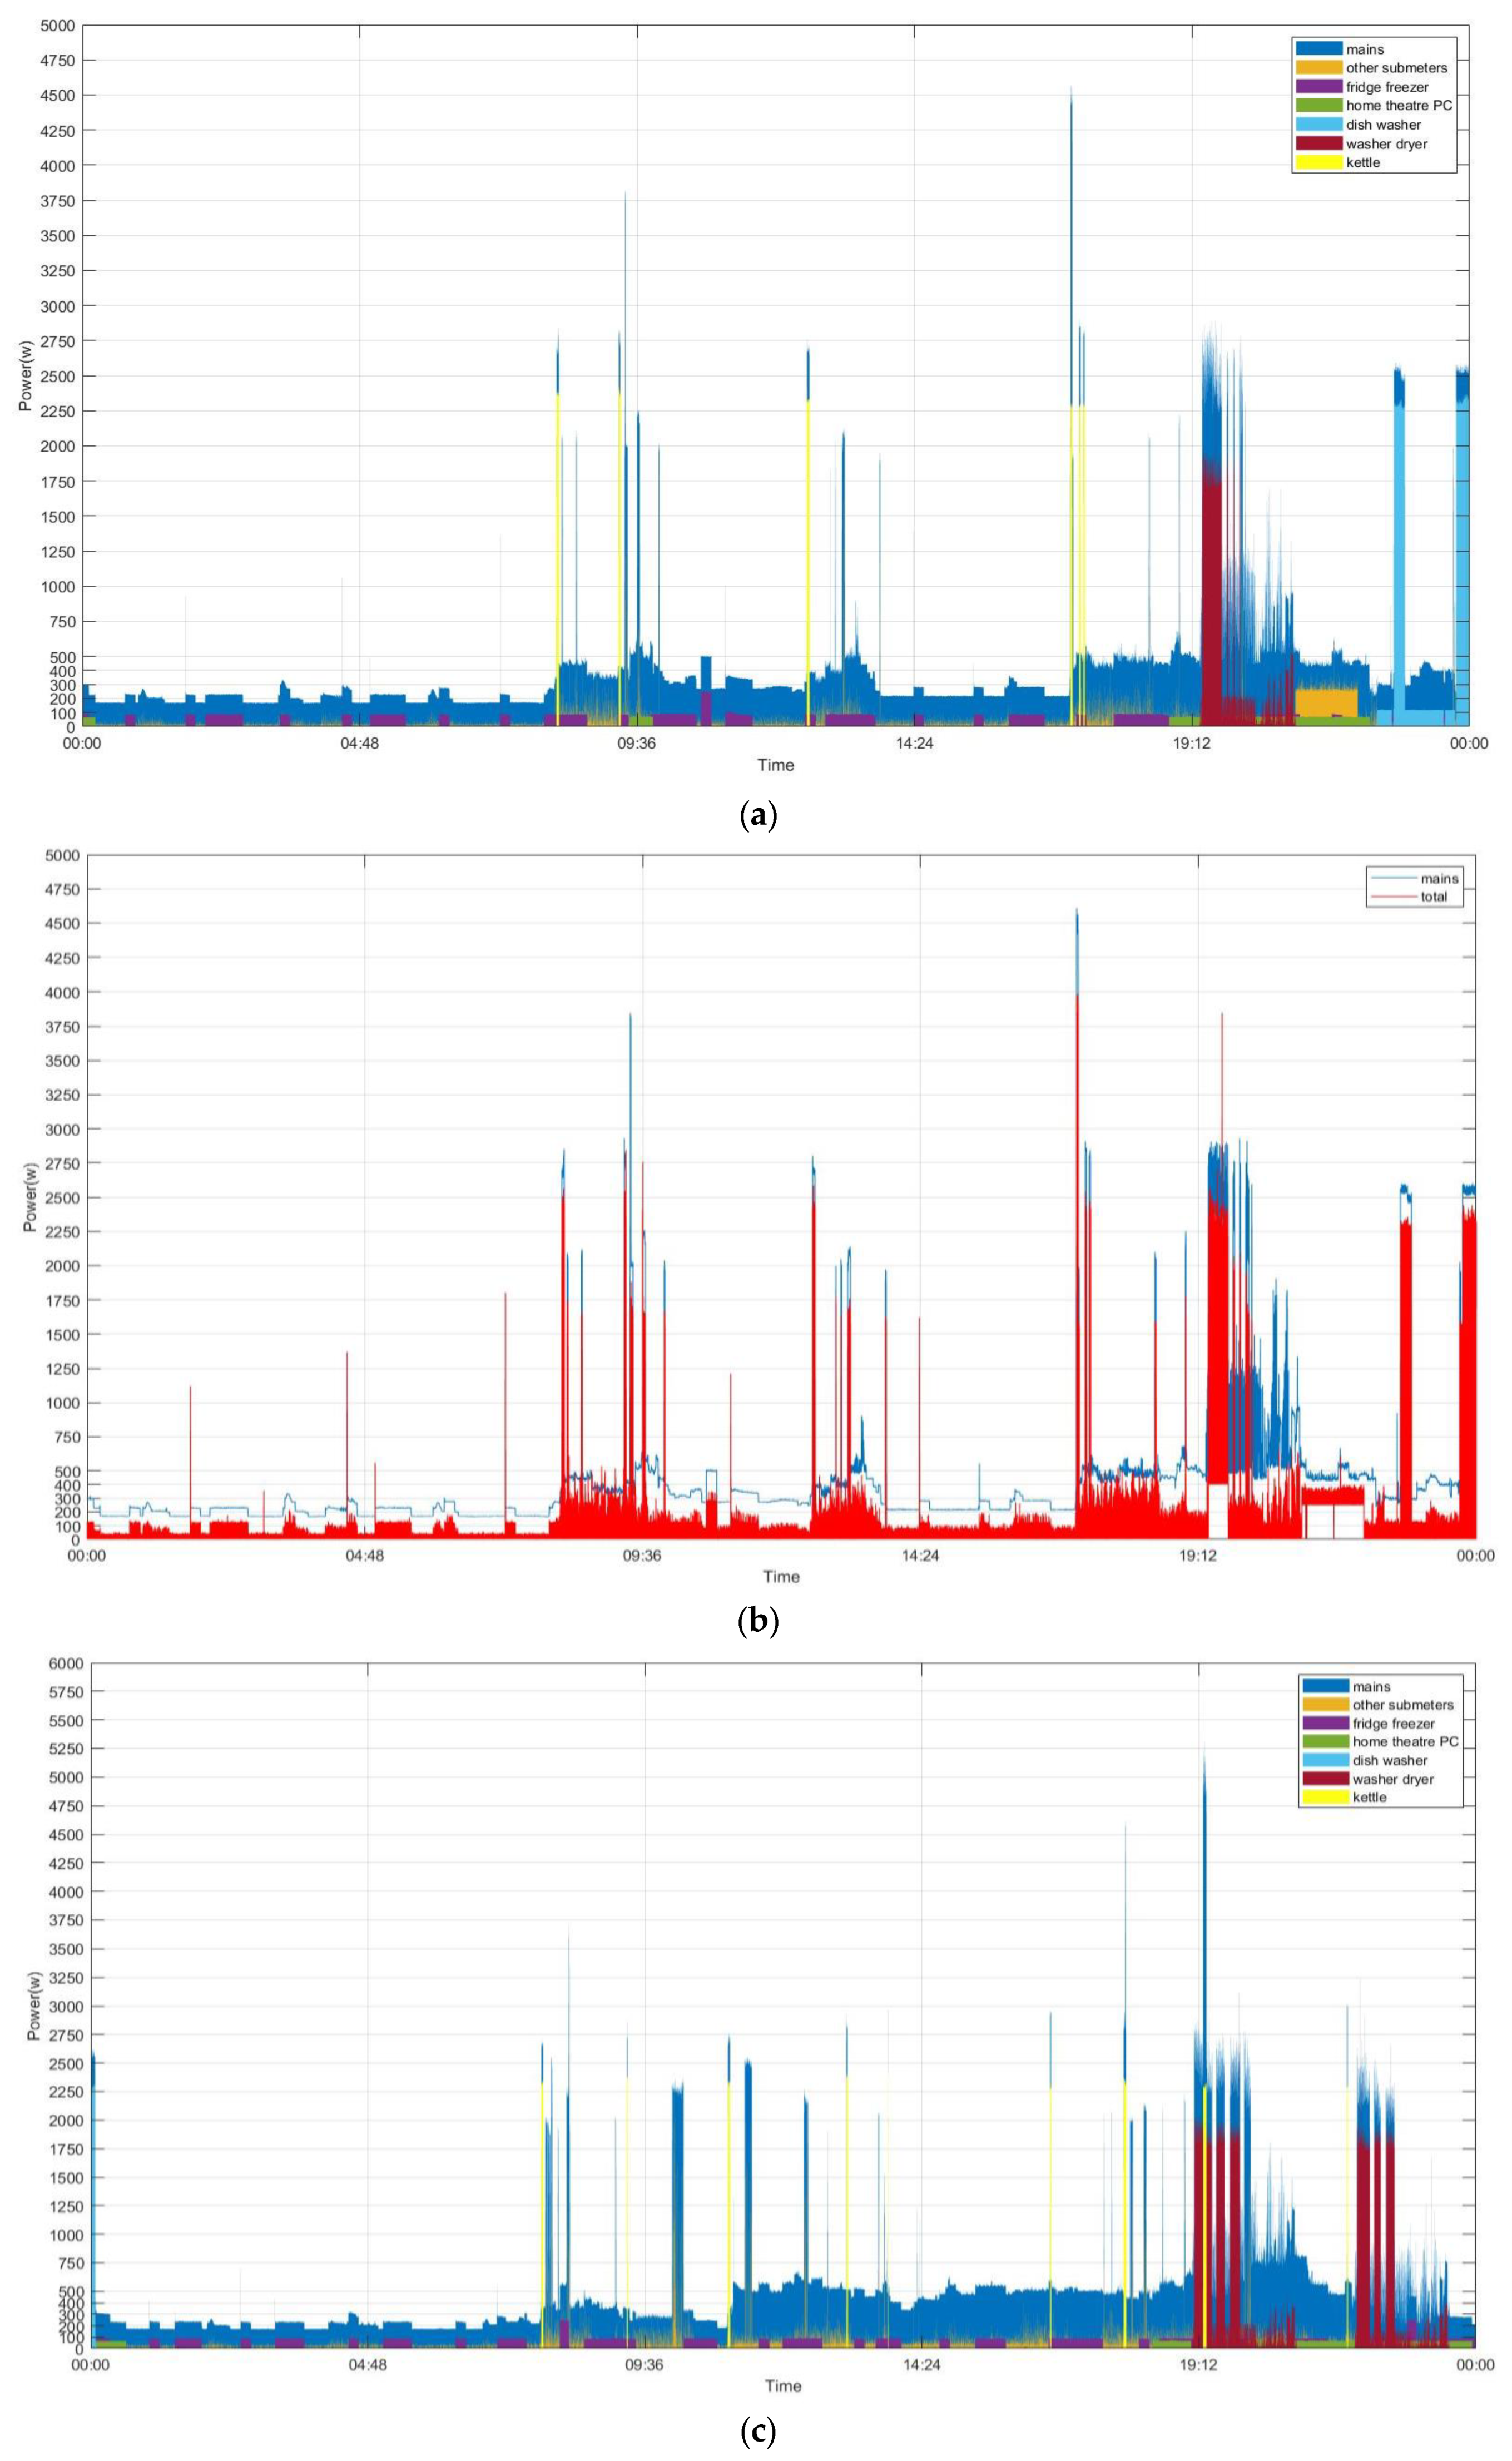
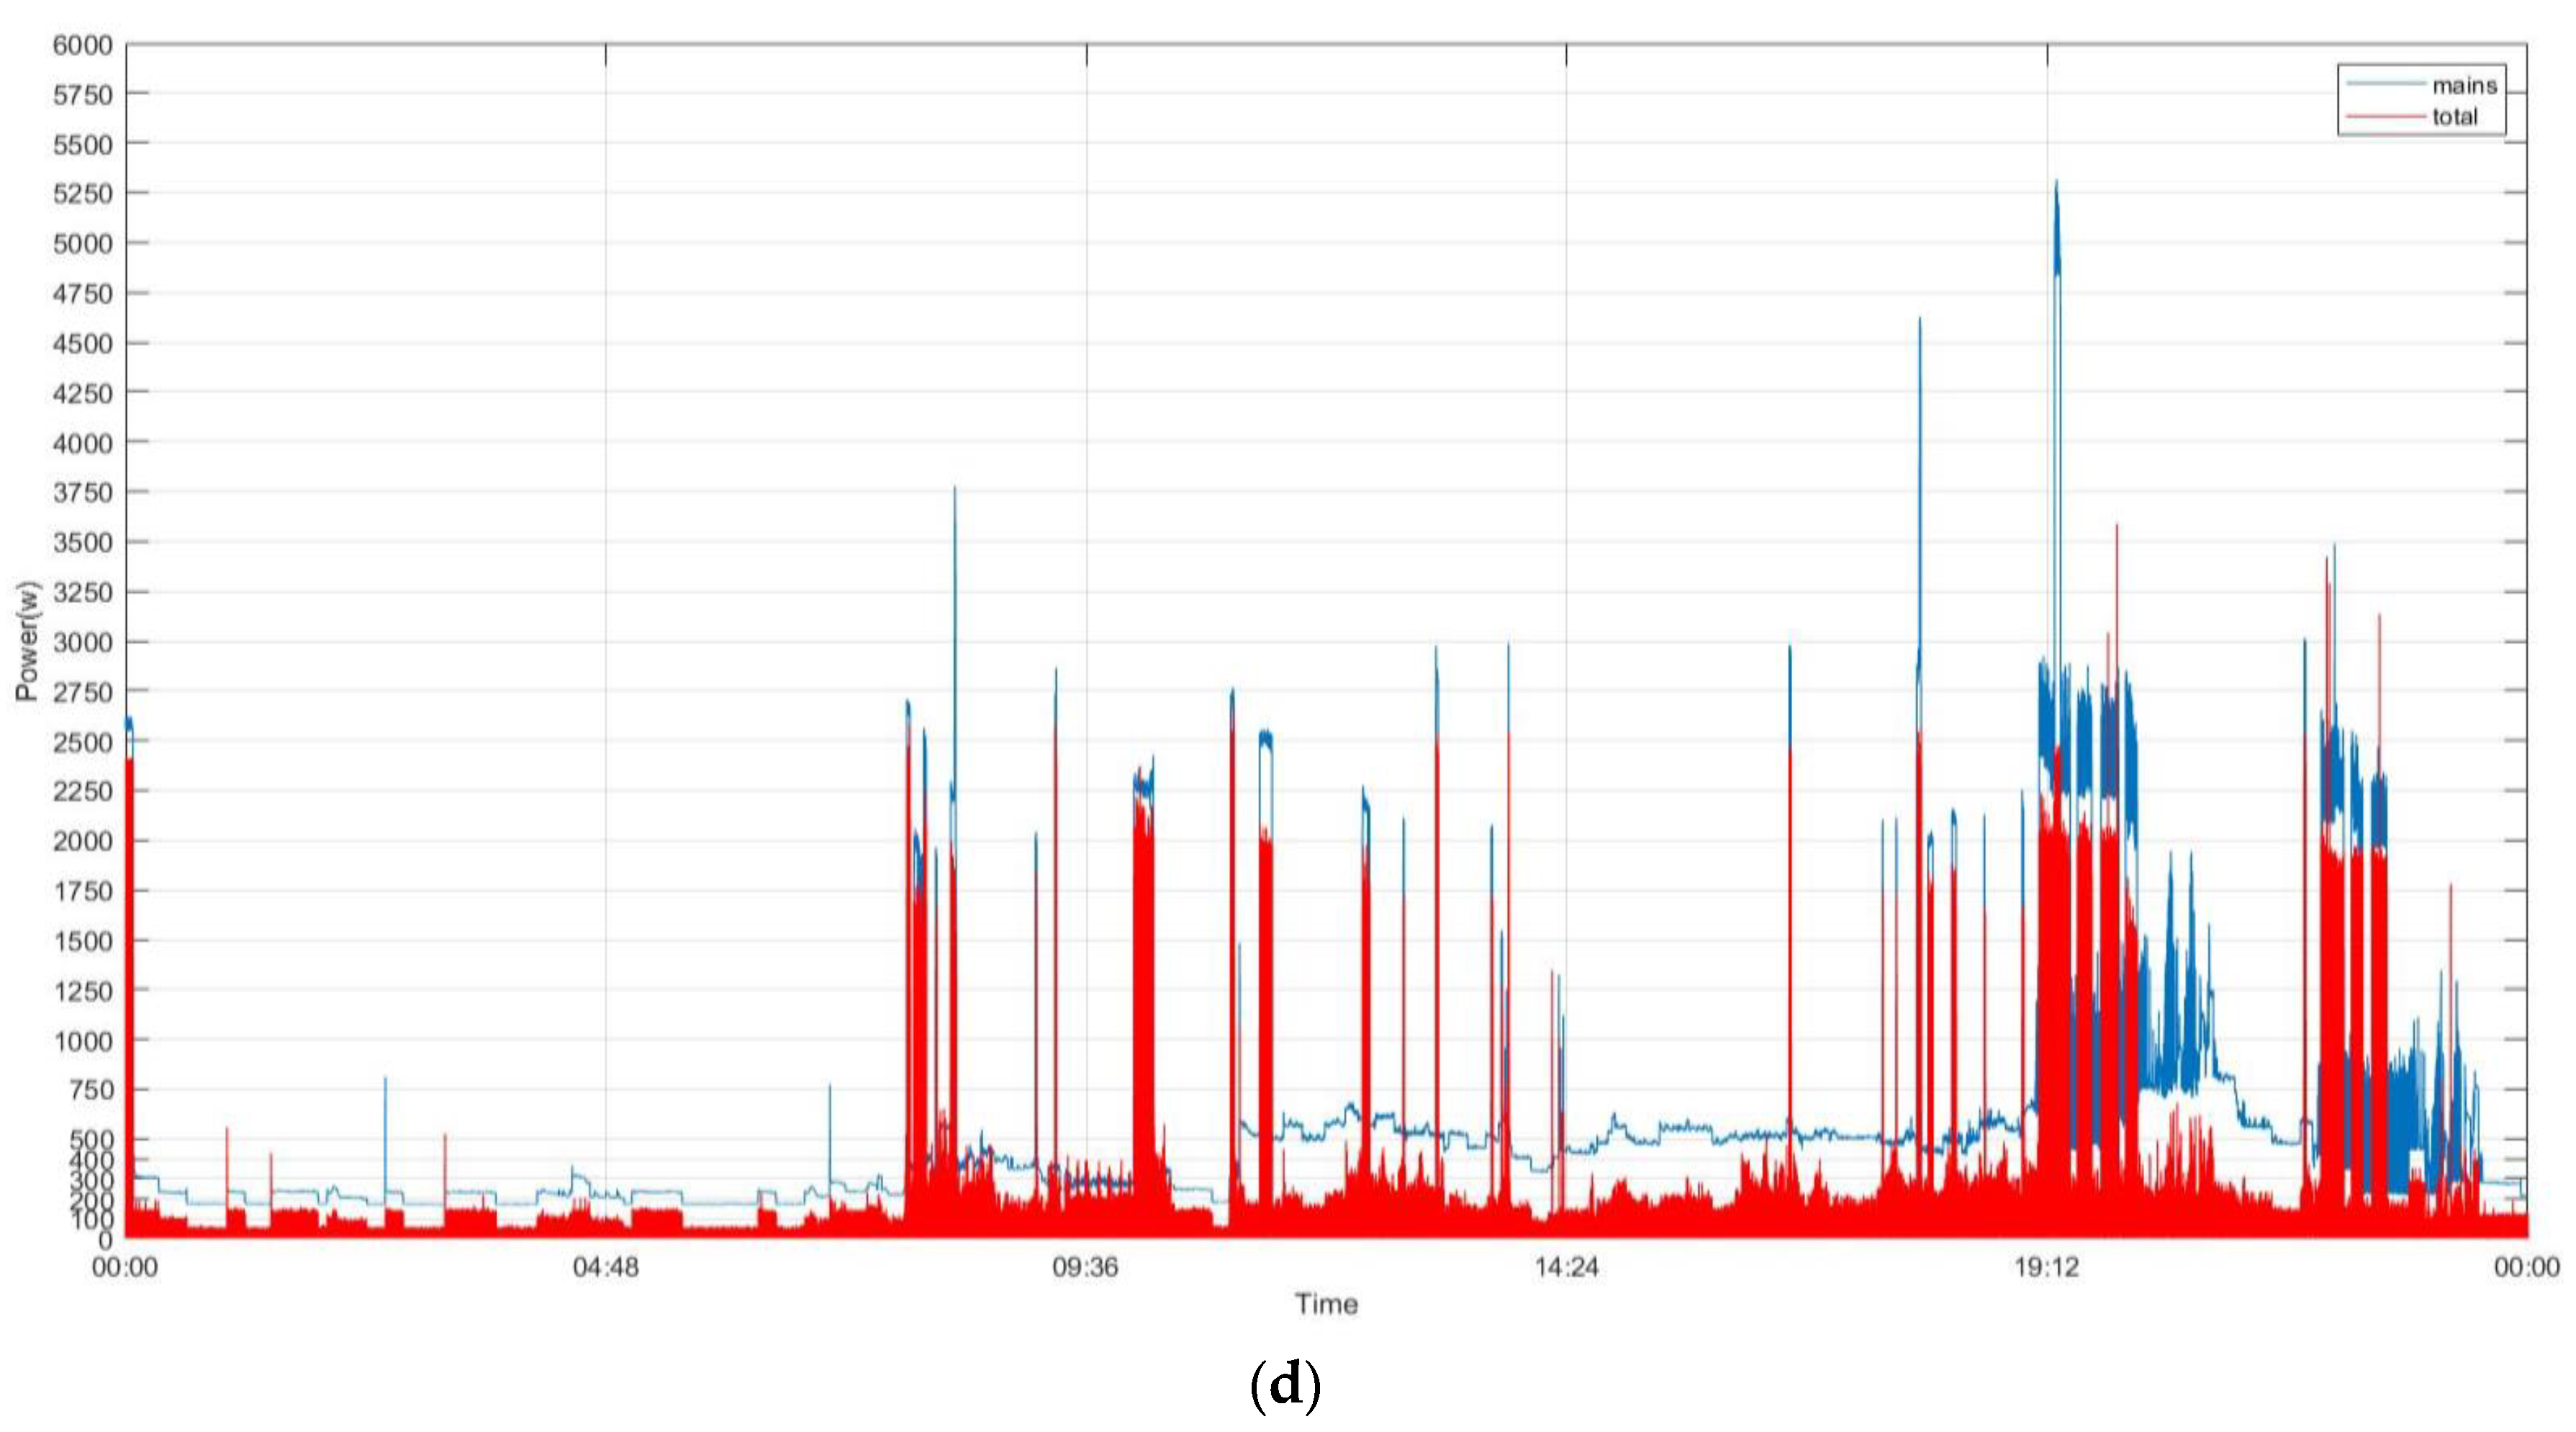
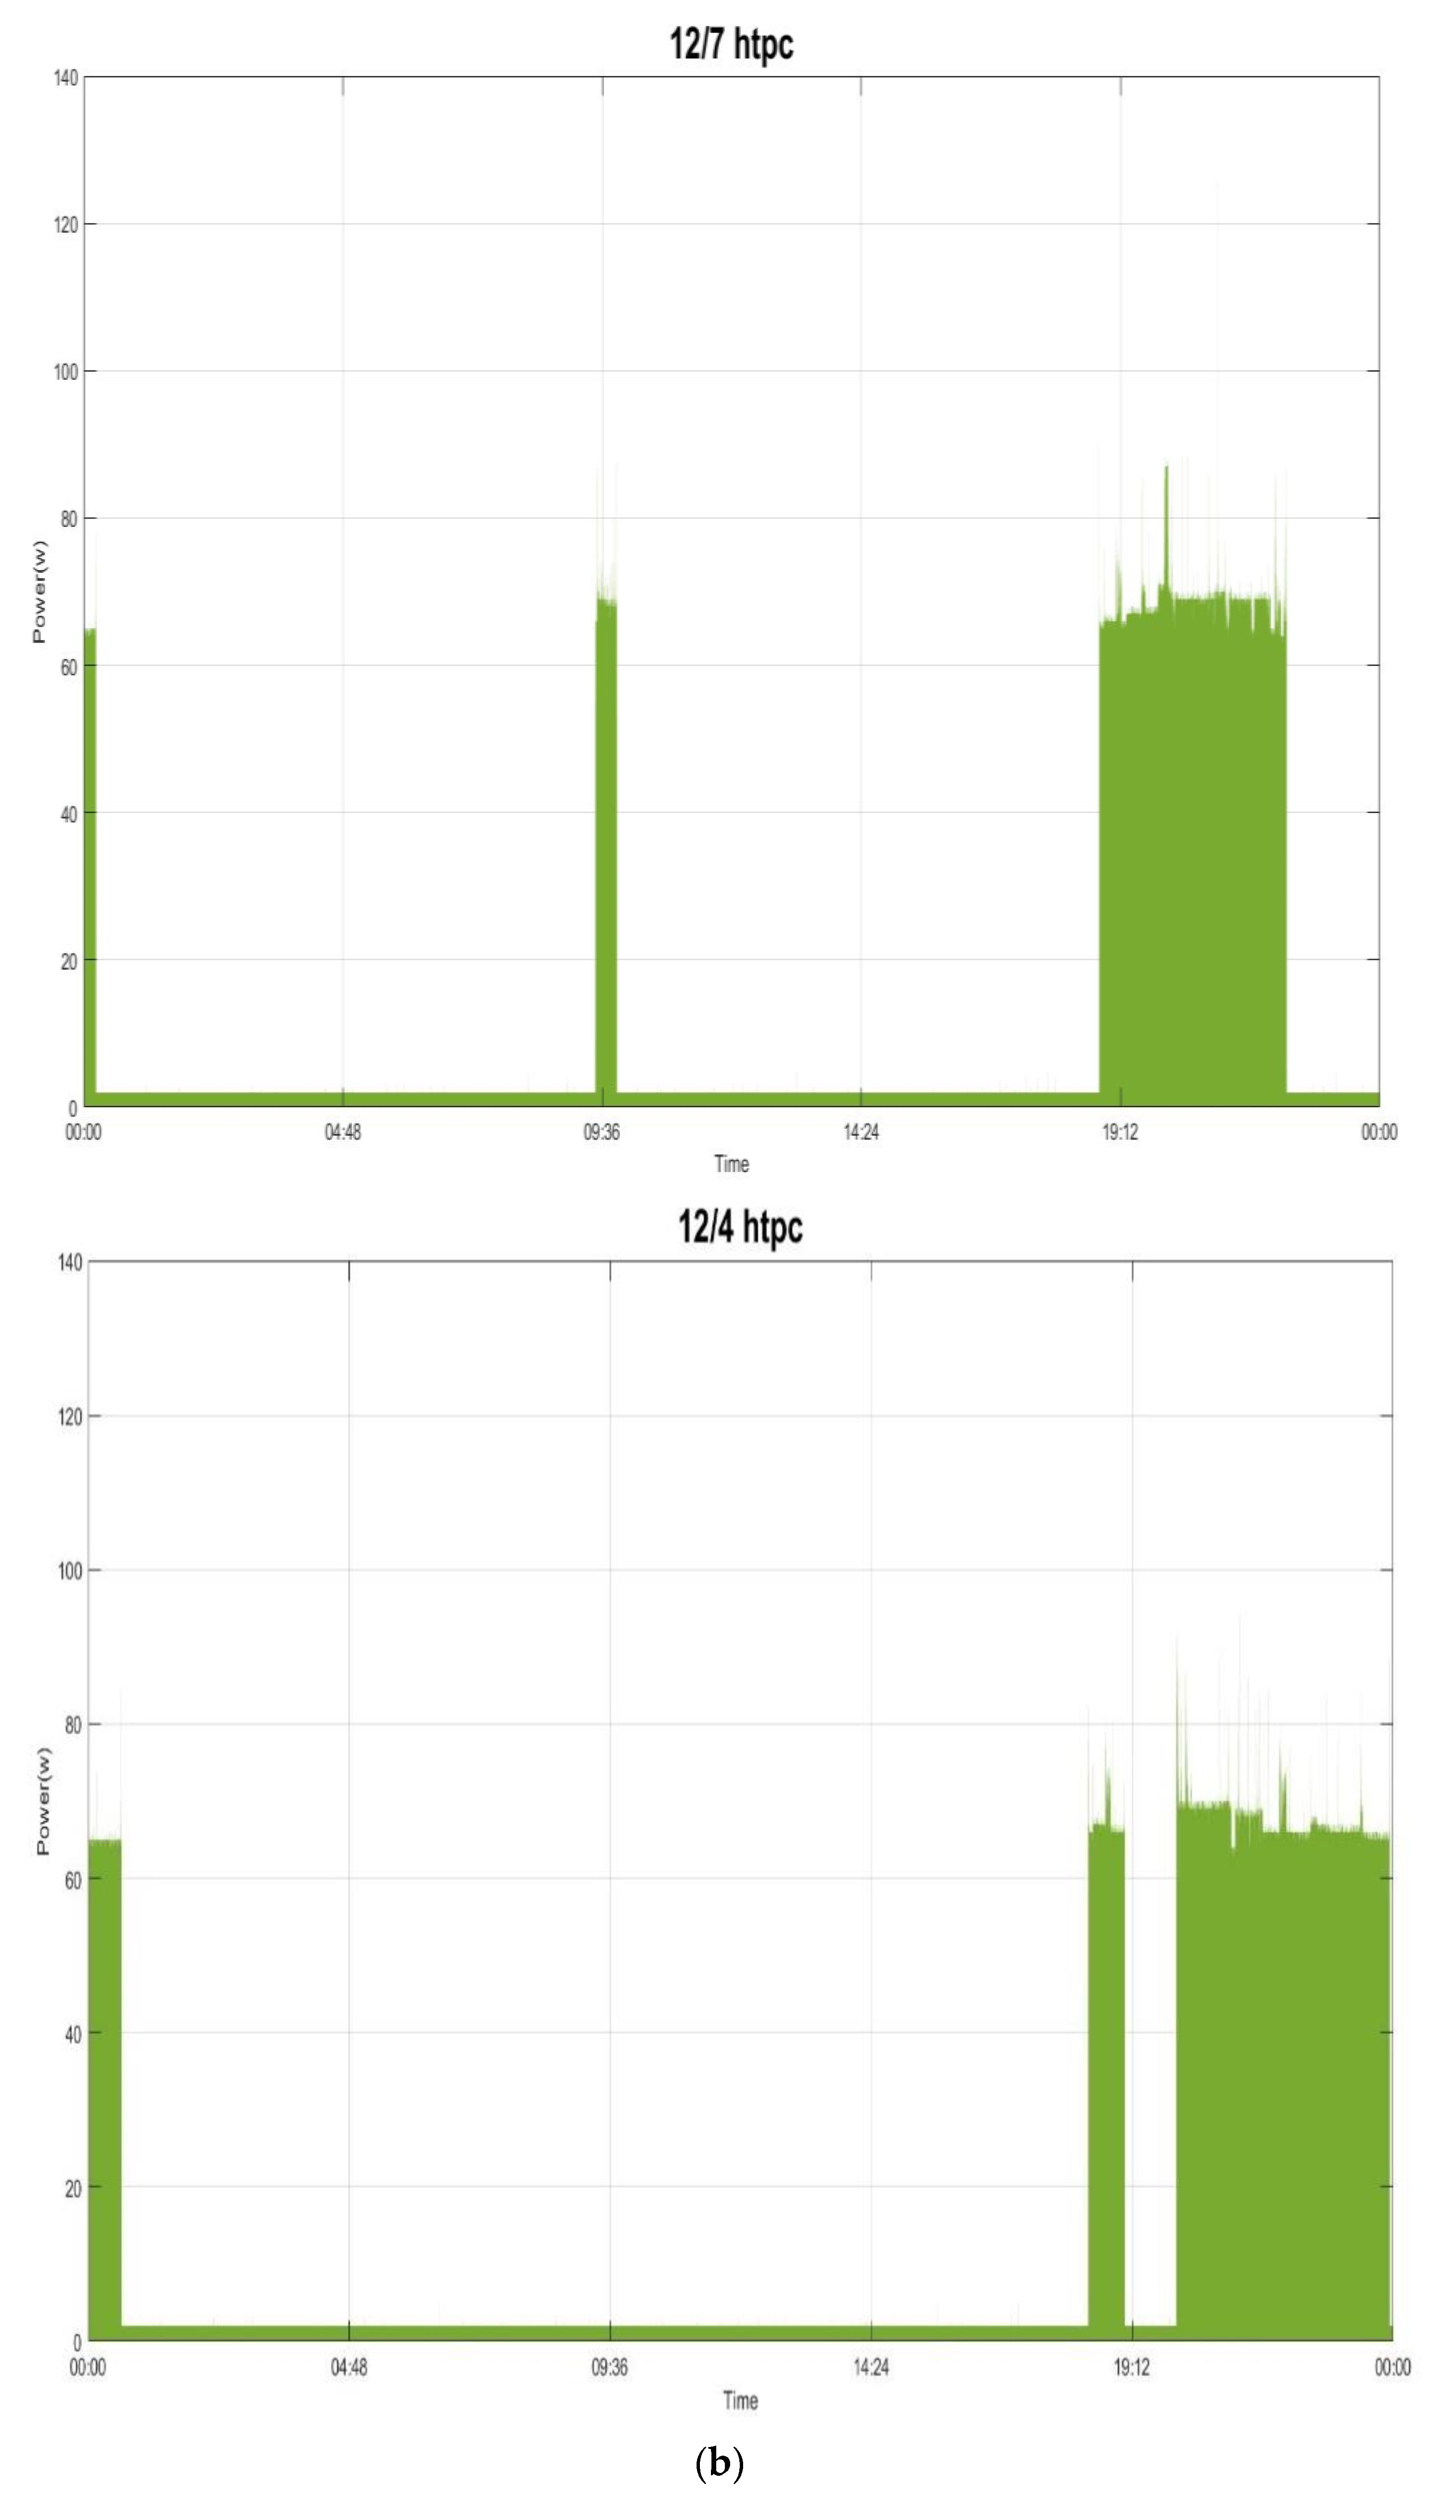
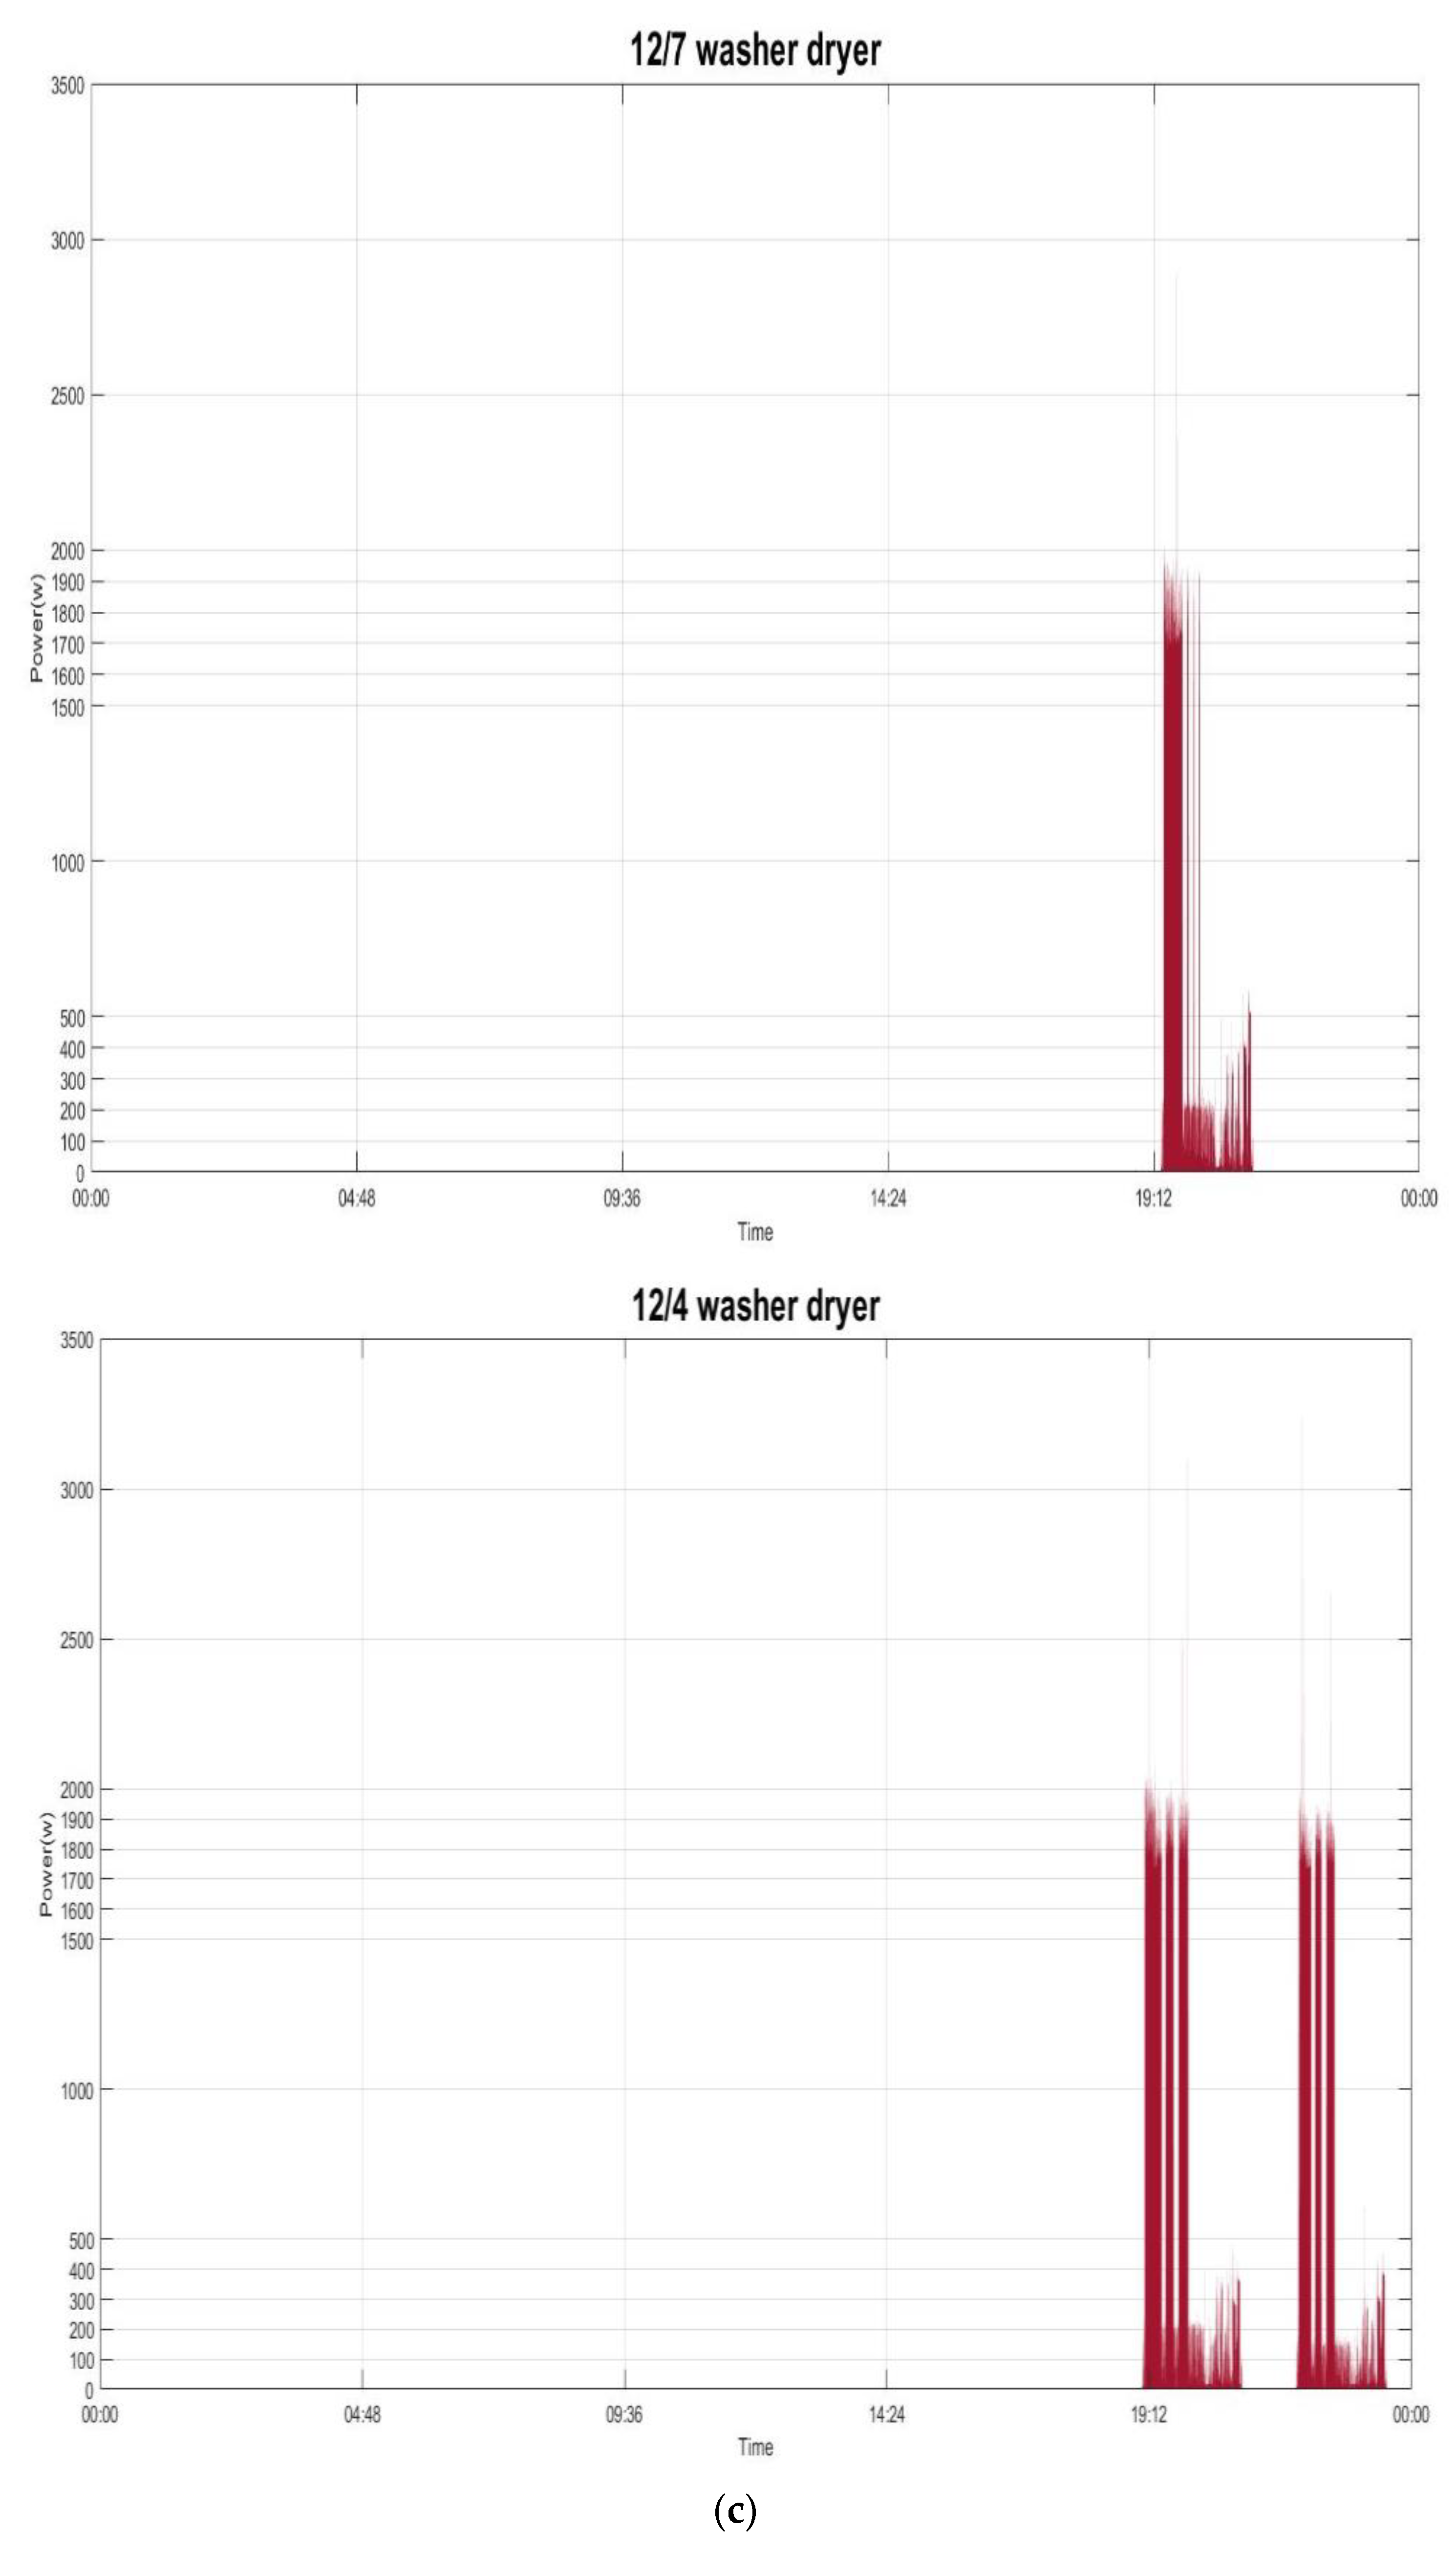
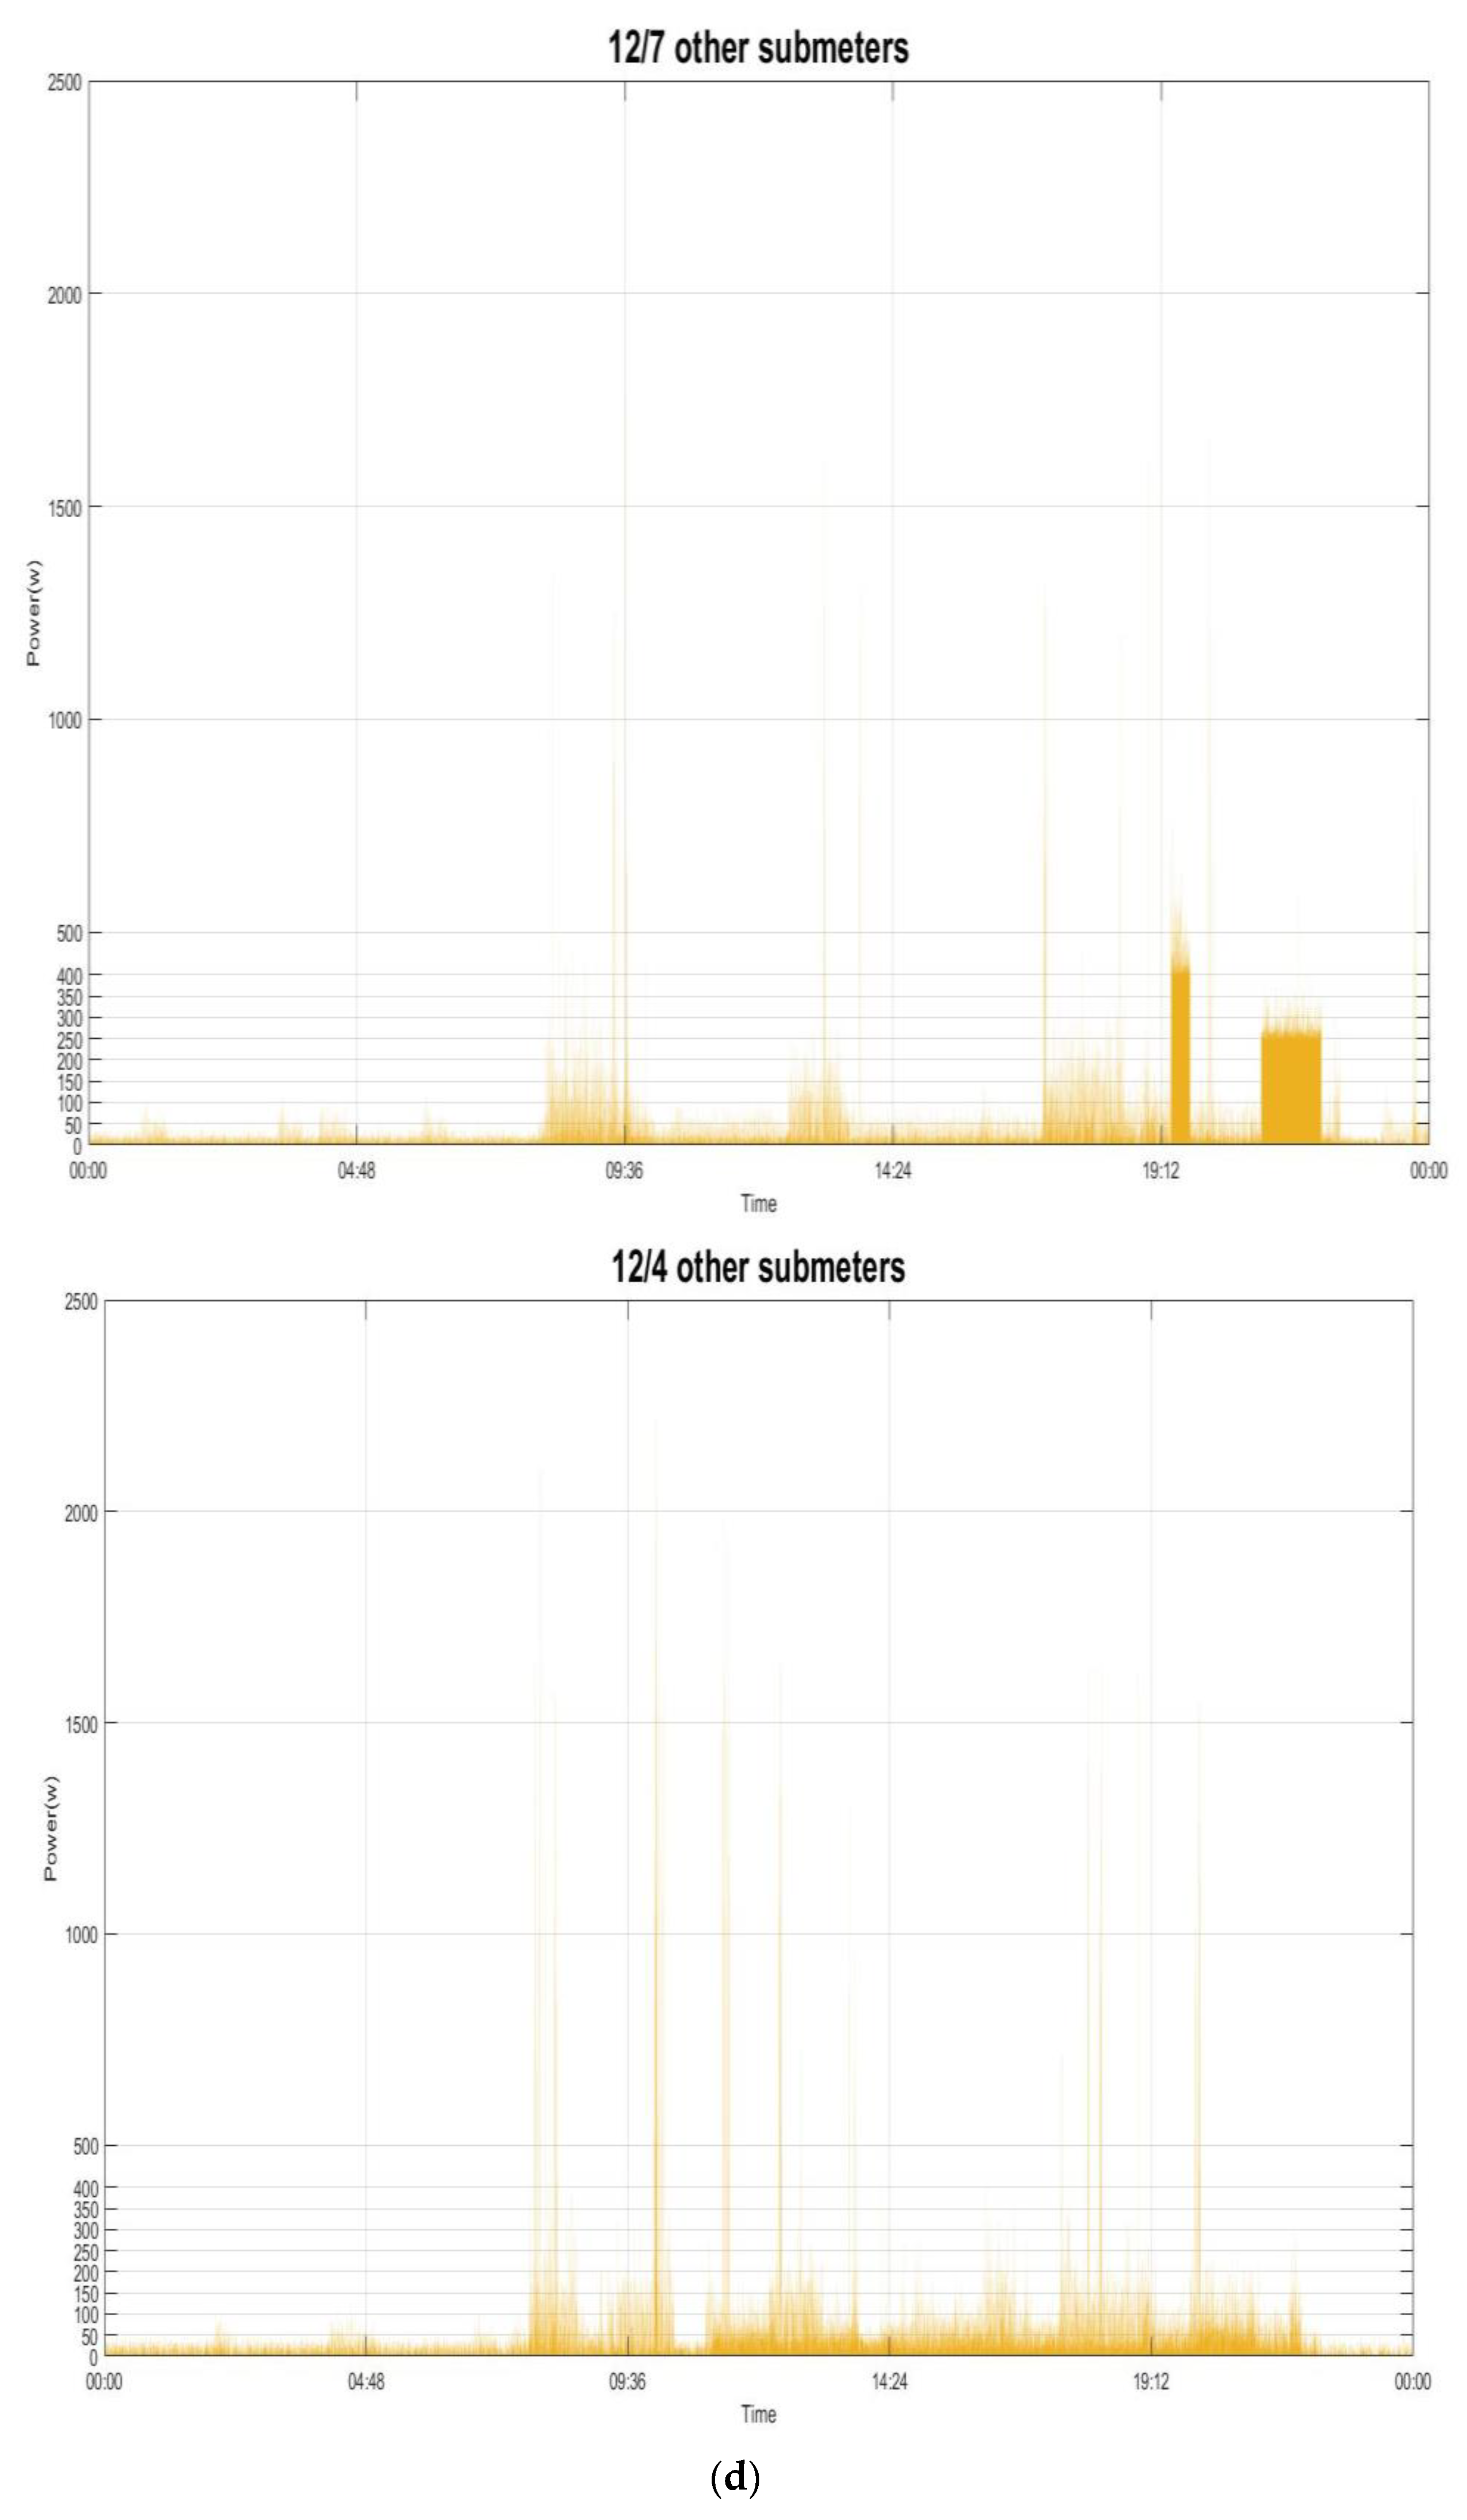
Figure 6 shows the considered historical power demand on two typical days (Sunday 7 December 2014 (Figure 6a,b) and Thursday 4 December 2014 (Figure 6c,d)) in House 1 from the UK-DALE dataset, which is considered, parsed, and used to experimentally validate the performance of the investigated methodology in load recognition. The summarization of the UK-DALE dataset can be found in [32]. In Figure 6a,c, we show the total power demand in the mains. Also, we show the power demand by the concerned individual electrical appliances and all other submeters [32] considered together and treated as a single individual in power absorptions for load disaggregation. As shown in Figure 6b,d, the thin white gap between the power demand in the mains and the summed-up power demand illustrates the amount of power demand, base load, which is not concerned/metered. The concerned electrical appliances, including the considered submeters as a single individual in power absorptions to Pi in Equation (2), are listed in Table 1; their power demand is shown in Figure 6 and the base load, Pbase in Equation (2), is assumed to have a constant value of 150.0 watts for simplicity’s sake. 
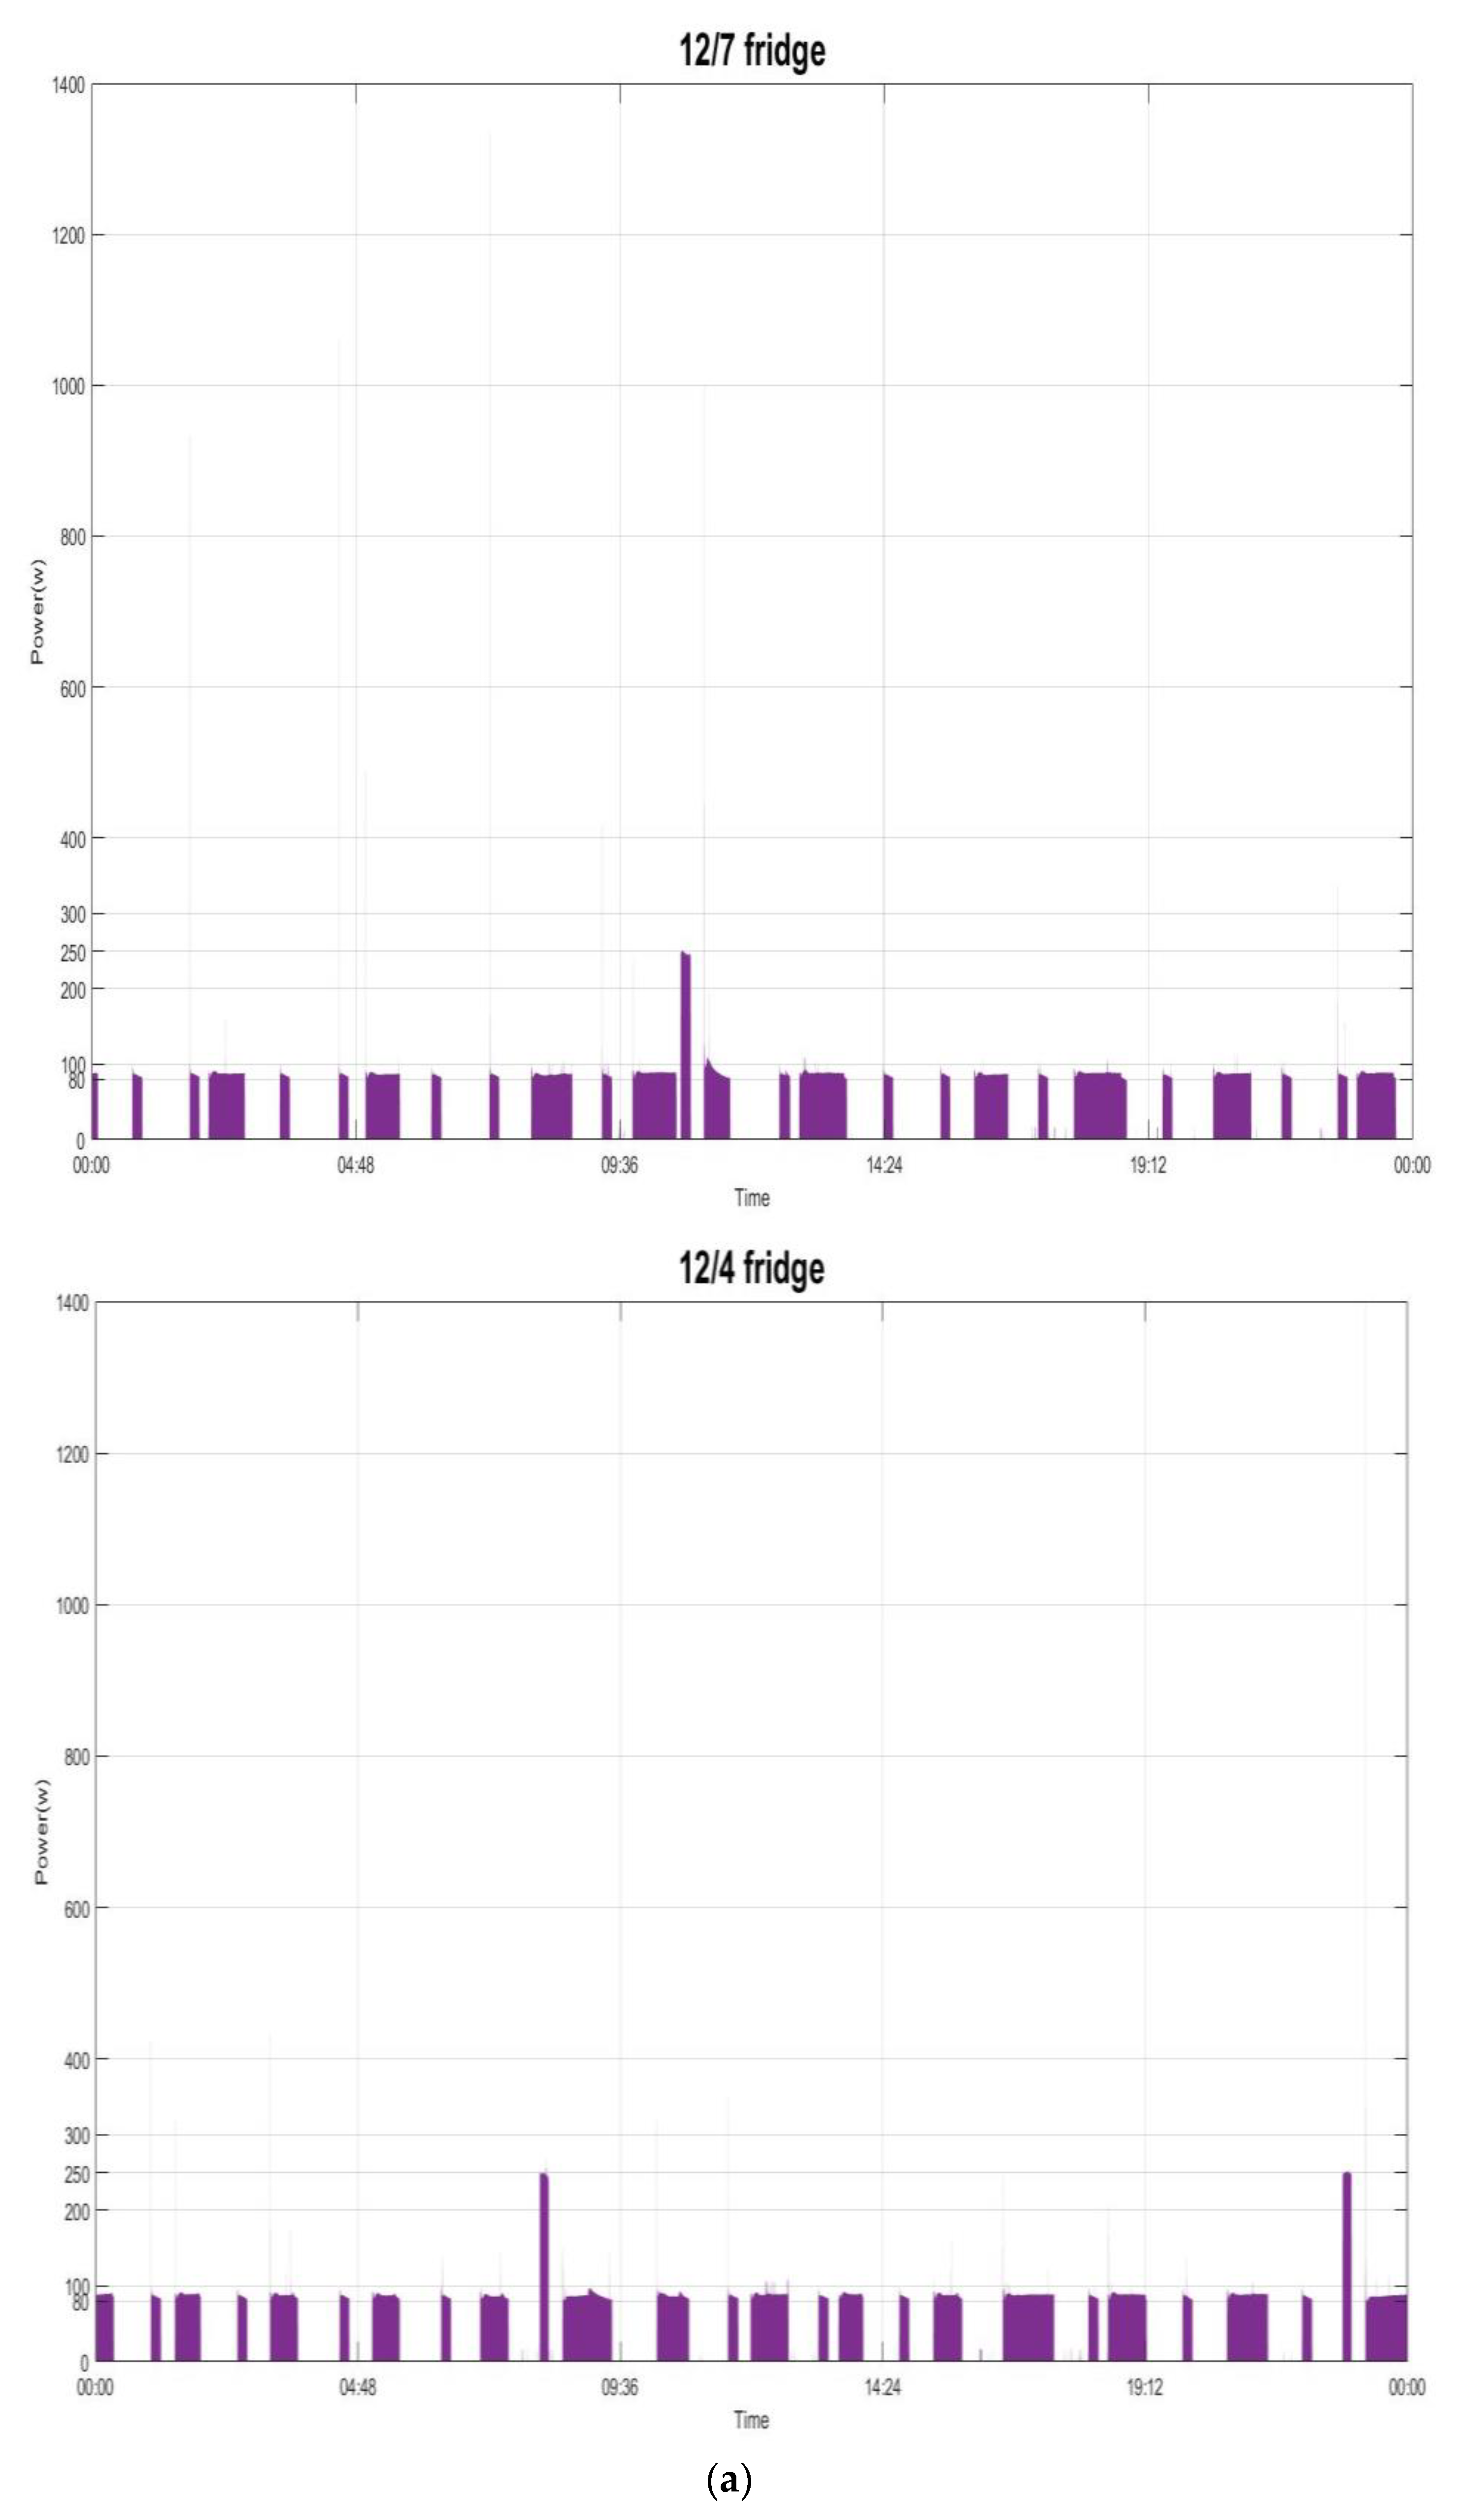
Figure 7 shows the power demand of the several individual electrical appliances targeted in this paper and listed in Table 1. The behavior of the power demand by the electrical appliances can be found in [32]. For example, Figure 7a shows the power demand by the fridge running and doing its respective job of compressor on (state 1: its mean power consumption is ~90.0 watts with a standard deviation of ~44.0) or defrost (state 2: its mean power consumption is ~245.0 watts with a standard deviation of ~16.0). In this paper, the load classes considered from the targeted electrical appliances in Table 1 and recognized are shown in Table 2.
We used the UK-DALE dataset [32] as our reference dataset to experimentally validate the performance of the investigated methodology in load recognition; note that, in the dataset, data that were recorded from House 1 in the UK were considered in this experiment. In this experiment, a total of 4096 (=2N(=12)) load combinations need to be recognized by the parallel computing accelerated GA in this paper (the total number of meters installed and used as ground truth in the house environment is 54 [32]), where a total of 208 composite power consumption (NIALM) data instances are disaggregated according to Equation (2). For each data instance acquired at time t and disaggregated, the parallel computing accelerated GA indicates the electrical appliances whose operation is active or inactive. In this experiment, the parallel computing accelerated GA is implemented in MATLAB® and run on an Acer Predator G3-710 Intel® CoreTM i7-6700 CPU (3.40 GHz) (RAM: 16 GB) personal computer (PC), where for parallel computing the total number of available workers, n, on the machine is four. Note that running the parallel computing accelerated GA requires Global Optimization Toolbox™ [33] required with Parallel Computing Toolbox™ [34] for parallel computing. In this experiment, for simplicity, ci in Equation (2) is set to 1.5, which can be determined through an exhaustive search for the house environment. Also, Pbase assumed and estimated according to Figure 6b,d is 150.0 watts. Parameters for the parallel computing accelerated GA are specified below. The population size, pop_size, is 250. The initial population is created randomly in bit strings, where the total length of each chromosome is 12. The roulette selection strategy is used, and for this proportional selection procedure raw fitness values based on the rank of evaluated chromosomes, rather than their raw fitness value, are scaled. The single-point crossover operator is conducted; the crossover fraction of the population to be evolved is 0.55. The bit-wise mutation operator is used; the mutation rate is 0.01. An elitist strategy that guarantees a total of top (0.05 × pop_size) chromosomes to survive from their current population to the next population is also used. The maximum number of generations is 50. Finally, the fitness function is clarified as —E, where E is the declared objective function shown in Equation (2).
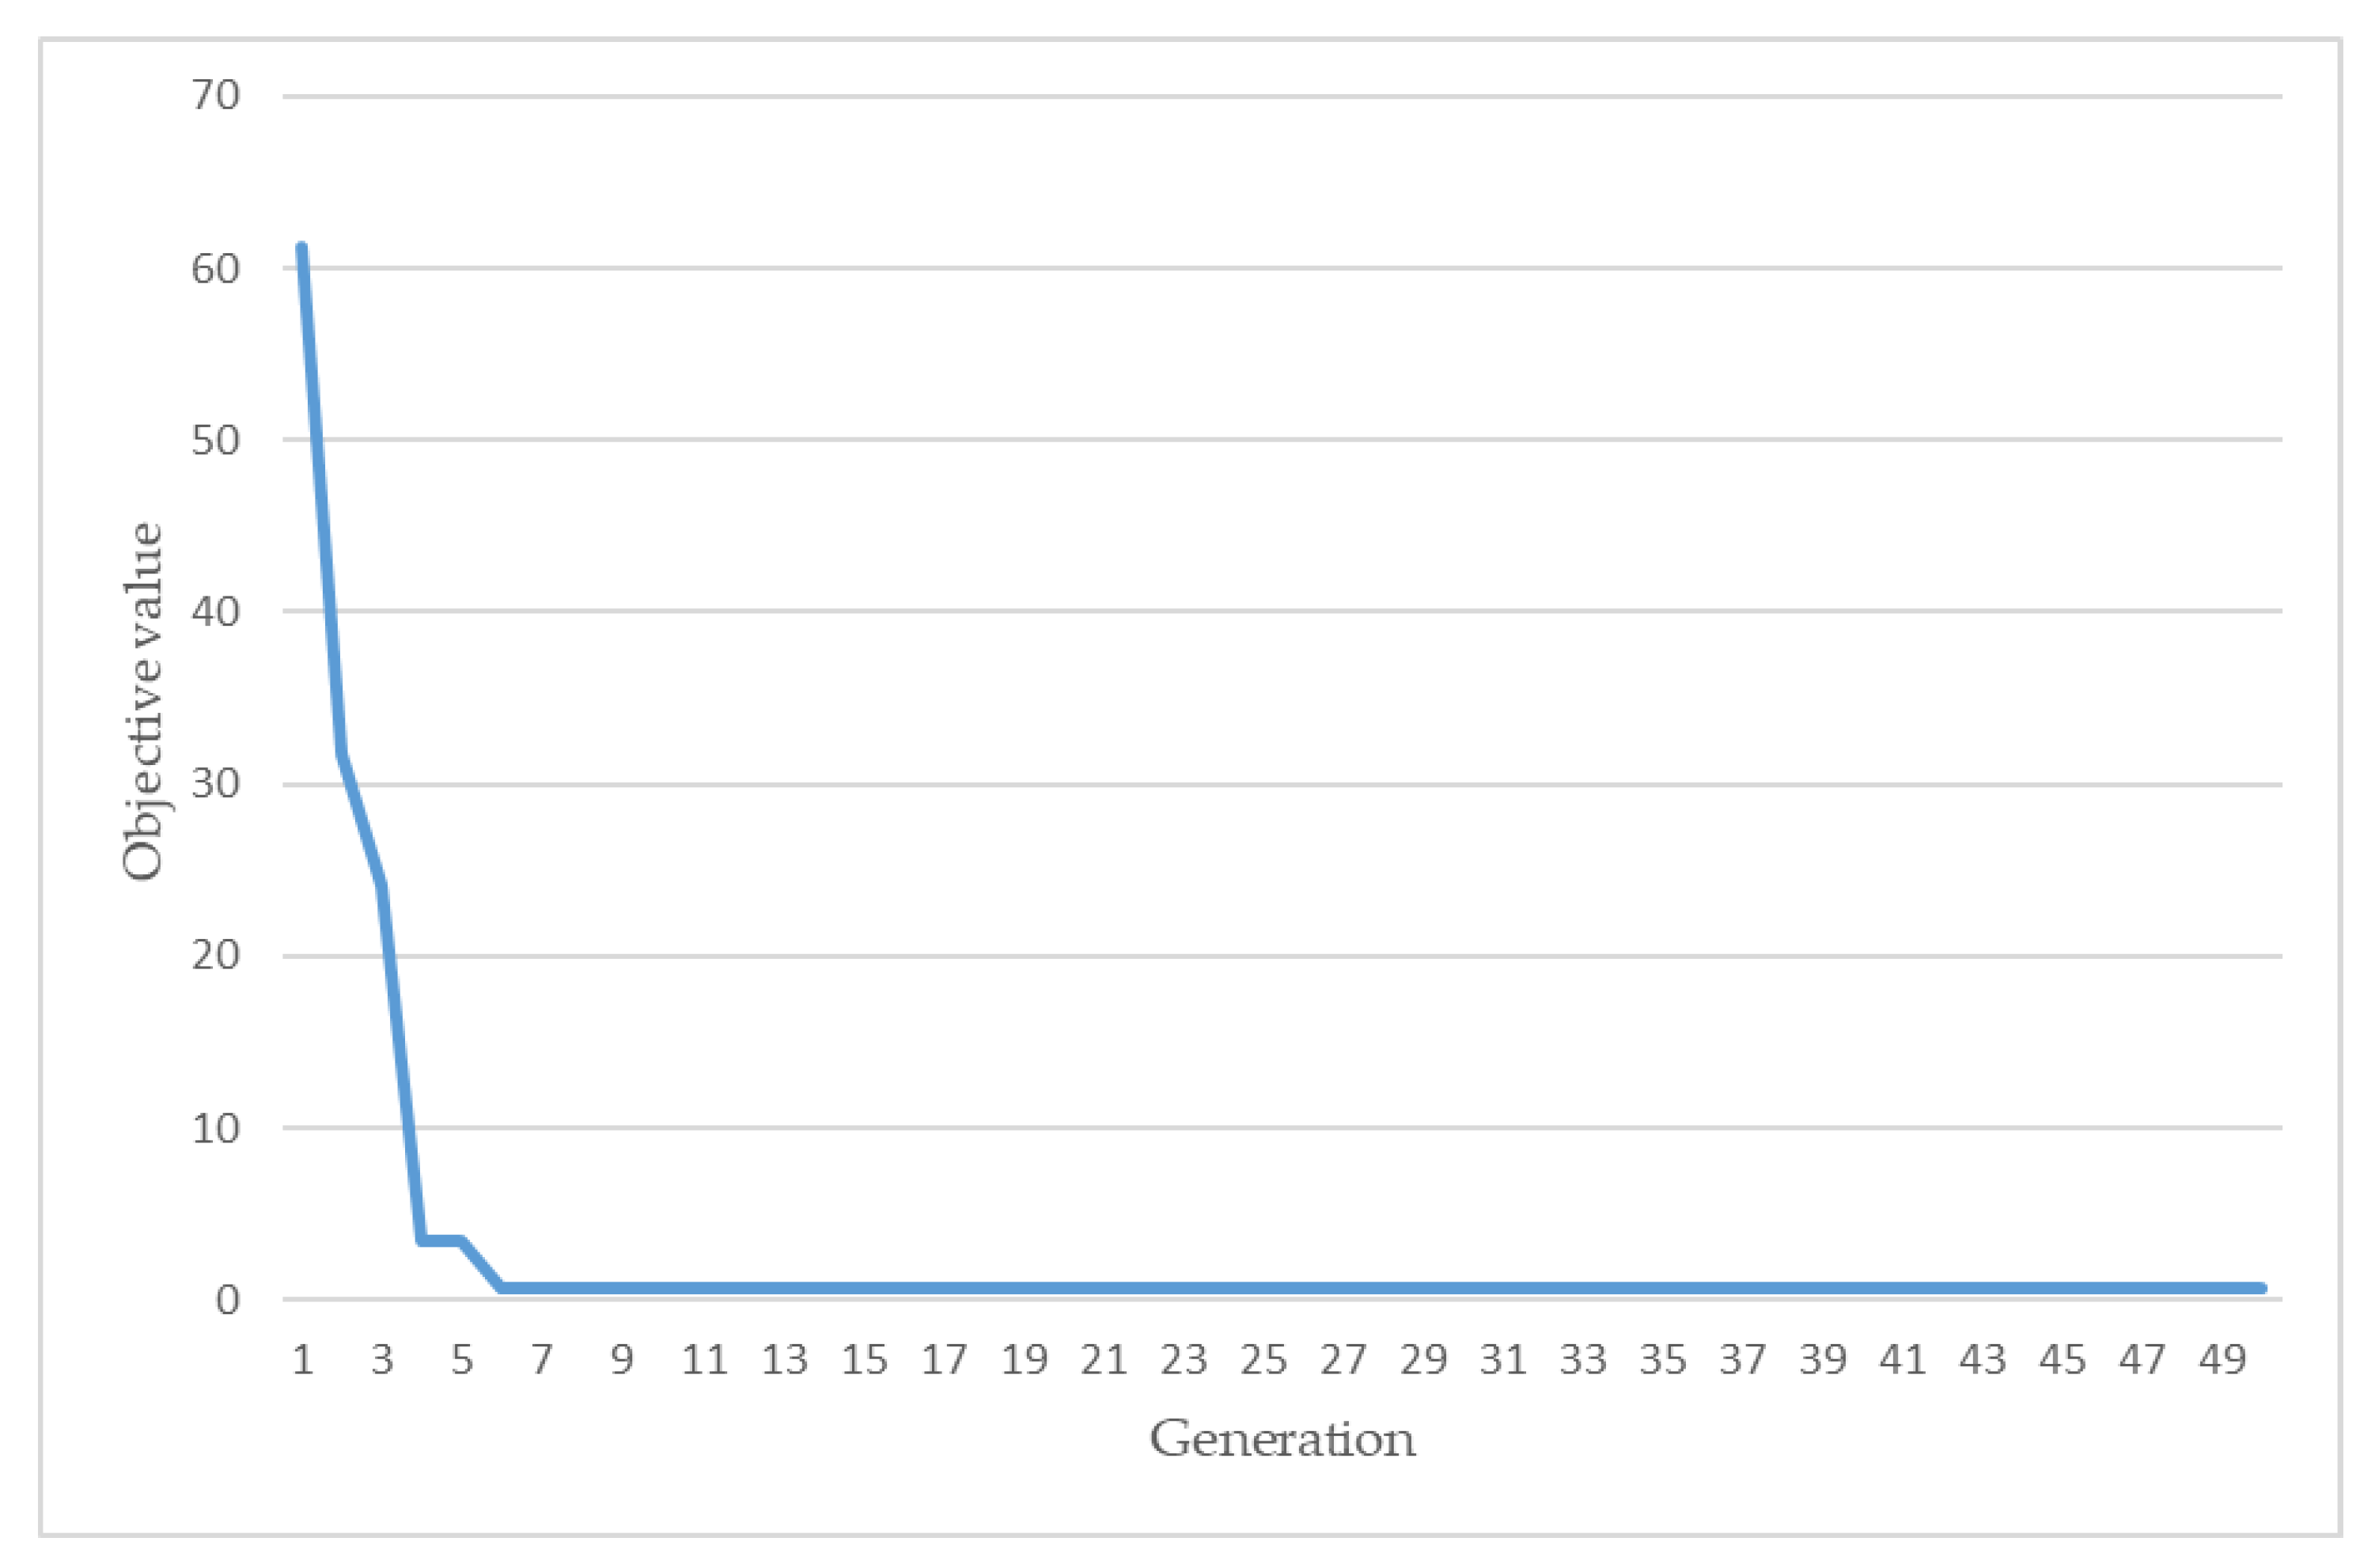
Figure 8 shows the evolutionary trajectory of the parallel computing accelerated GA to a disaggregated NIALM data instance. The resulting objective value obtained is 0.7. To the total 208 NIALM data instances where they are run over for load disaggregation, the parallel computing accelerated GA compared to a standard GA achieves, in terms of computation time, an acceleration of up to 3.49 × (=19.57 s/5.60 s).
In order to evaluate the performance of the parallel computing accelerated GA in load recognition, we examined the ROC curves, TPR and FPR in Equations (3) and (4), where their Area under ROC (AUC) is shown. Table 3 tabulates the load recognition results obtained by the parallel computing accelerated GA applied on the class-imbalanced data, where the F1 score is shown to each load class. Table 4 also tabulates the load recognition results obtained by the parallel computing accelerated GA, where TPR vs. FPR is also shown to each load class. As shown in Table 4, the presented methodology got good load recognition results (against random guesses with AUCs of 0.5) for the fridge, kettle, and dishwasher, where activities of daily living (ADLs) [35] can be inferred from them for occupants in the house. The experimental results reported in this paper have shown the validity of the parallel computing accelerated GA-based NIALM for load disaggregation. In addition, the NIALM’s achieved acceleration of up to 3.49× has been shown. The parallel computing accelerated GA can exploit parallel computing and, thus, reduce computation time. Computation time will increase exponentially when a large amount(s) of NIALM data is run over for load disaggregation (Equation (2)) in a large-scale evaluation of NIALM. Parallel computing will be exploited massively and the computation time will, thus, be reduced drastically. As shown in Table 3 and Table 4, the performance of the presented methodology in load recognition needs a significant improvement, where the presented methodology suffers from similar P where the concerned electrical appliances or the load combinations of the concerned electrical appliances are identical. It will be improved. The improvement is shown below.
The performance of the parallel computing accelerated GA in load recognition needs a significant improvement, although the algorithm is capable of recognizing the fridge/freezer, kettle, and dishwasher in the house environment for ADLs. A comparative study is conducted below, where a feed-forward, multilayer ANN as neurocomputing against evolutionary computing is used for the addressed NIALM problem. A network configuration of 1-15-12 of a feed-forward, multilayer ANN in 
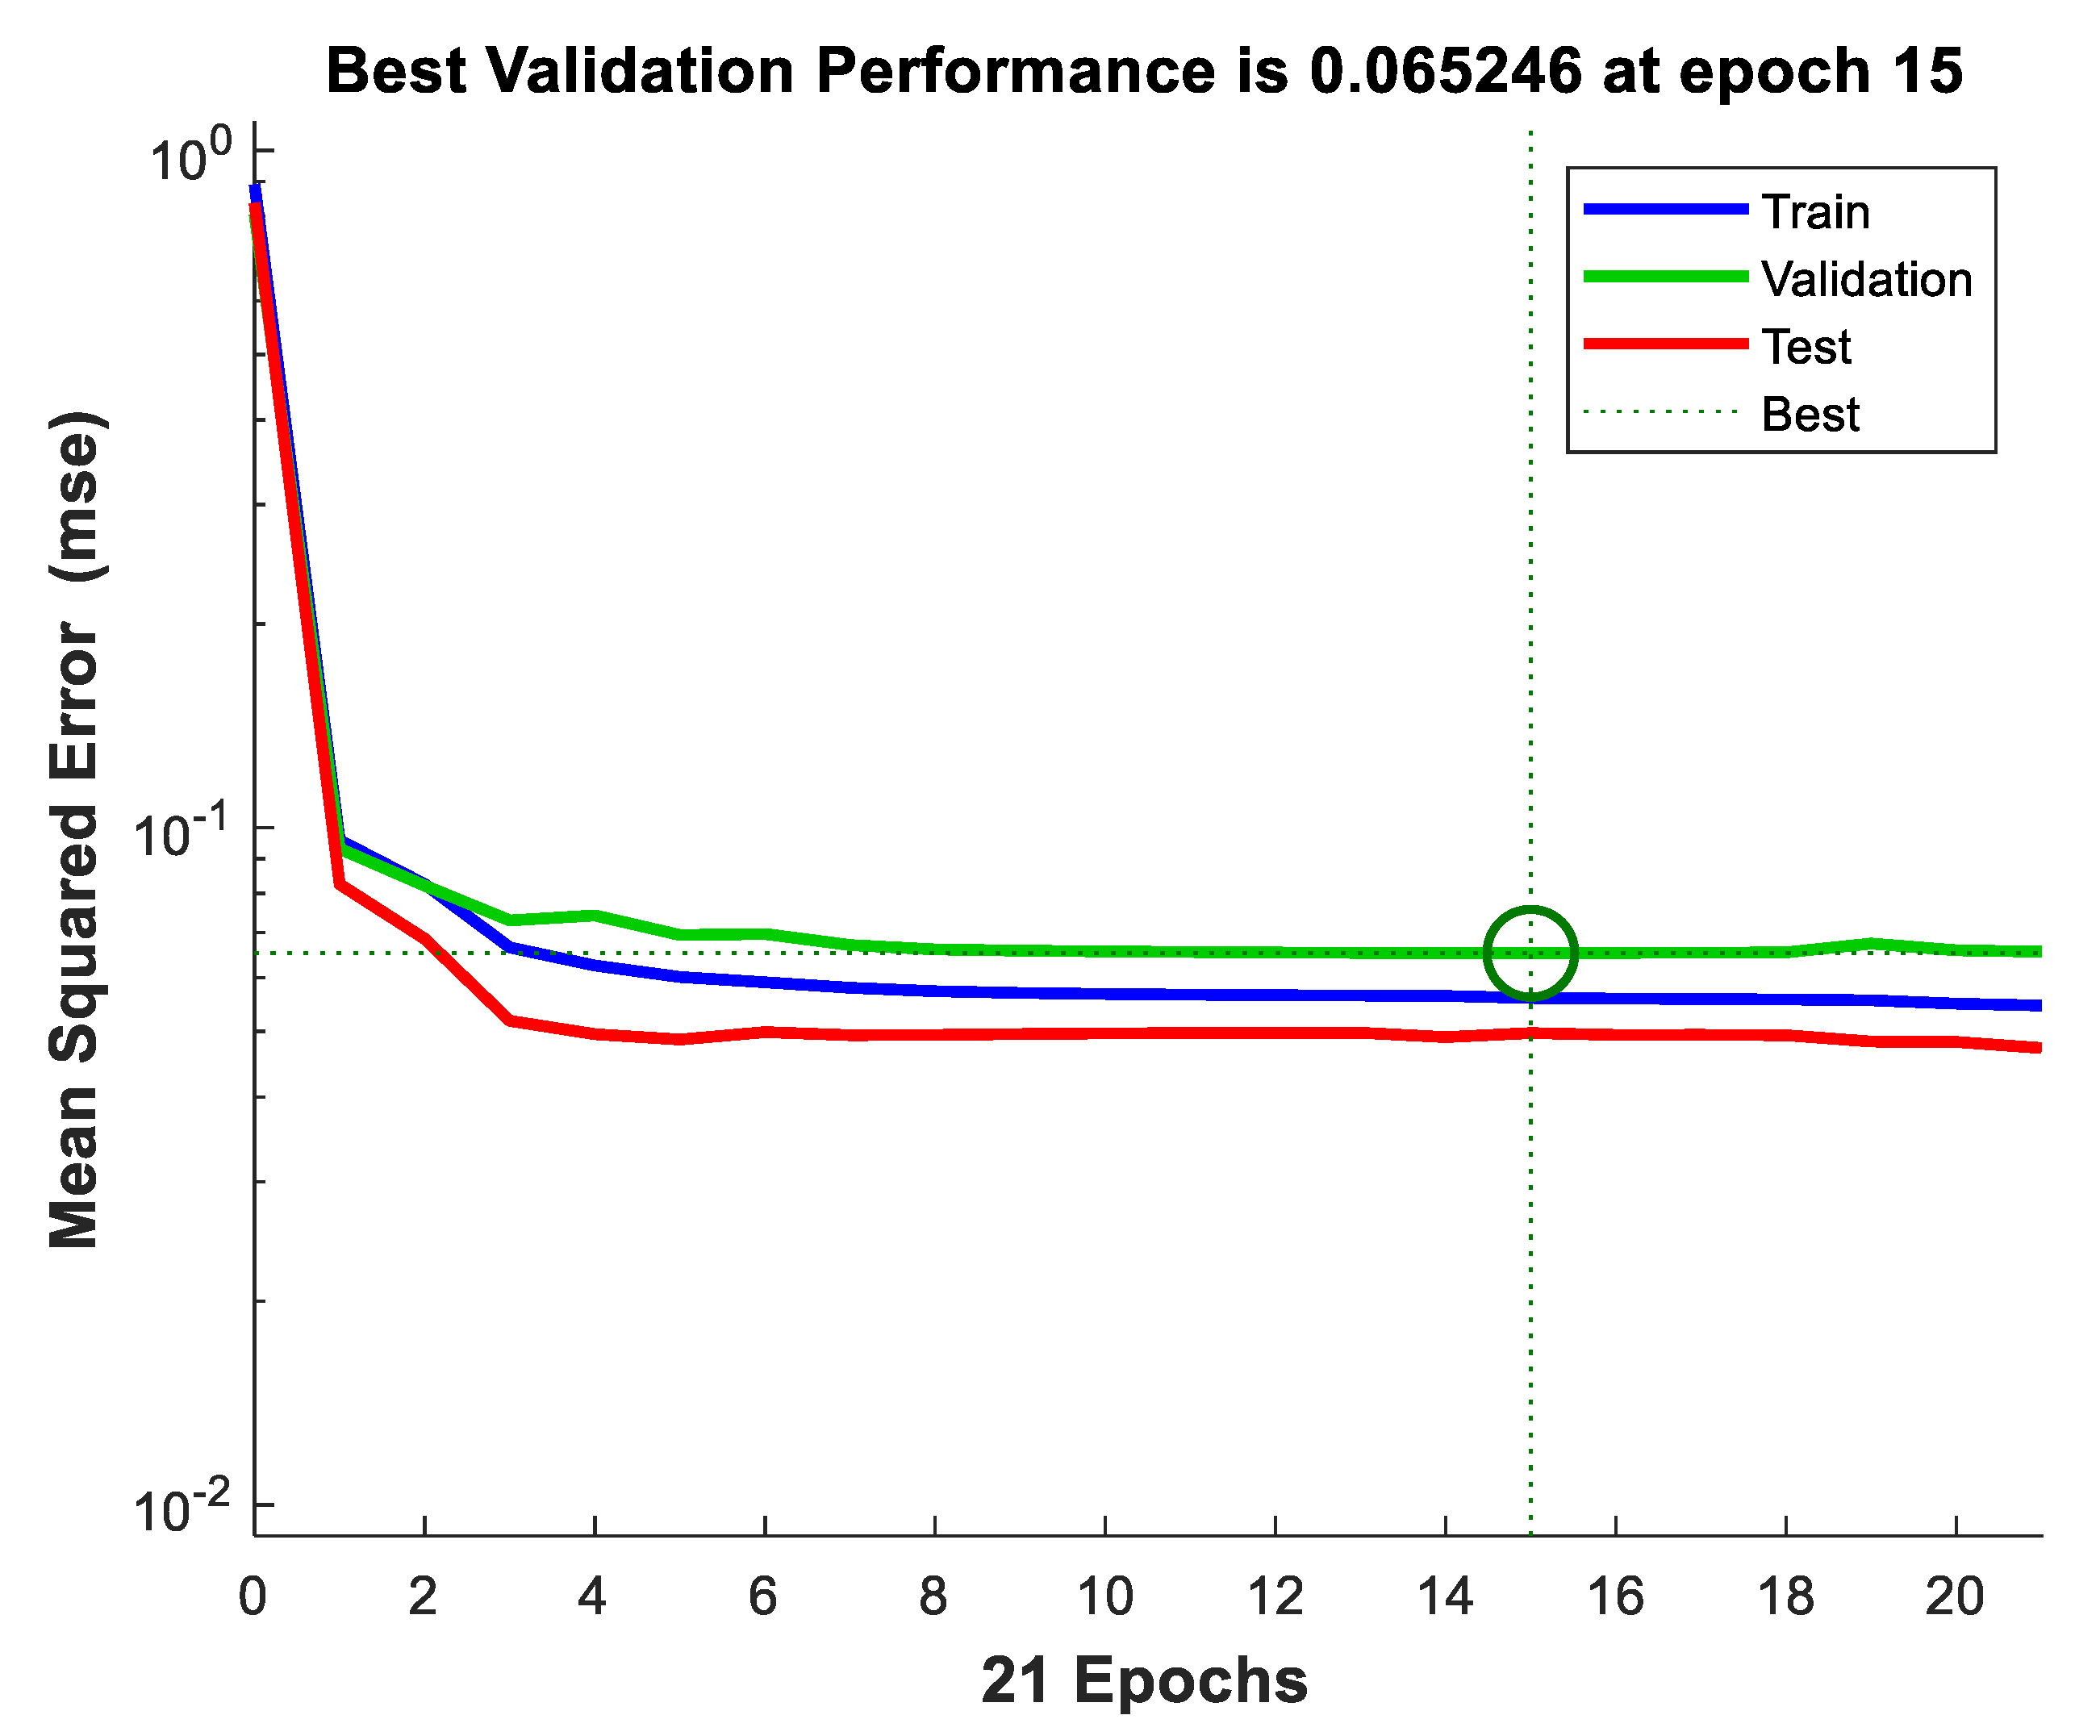
Figure 5a is constructed, specified, and used, in this experiment, to address the same 208 NIALM data instances used before. The feed-forward, multilayer ANN was trained on 135 randomly sampled training data instances (~65% of the whole dataset) and tested on the remaining 73 test data instances. The training trajectory of the constructed, specified and used feed-forward, multilayer ANN is shown in Figure 9. The resulting mean squared error (MSE) is 0.055 (its initial MSE is 0.891). Table 5 tabulates the load recognition results obtained by the feed-forward, multilayer ANN, which has been well trained and validated on the class-imbalanced training data. In Table 5, the F1 score is shown to each load class. Table 6 also tabulates the load recognition results obtained by the well-trained and -tested feed-forward, multilayer ANN applied on the class-imbalanced test data. In Table 6, TPR vs. FPR is also shown to each load class. The authors of [24] used the benchmark implementations, from NILMTK in [36], of the combinatorial optimization (CO) approach, which was developed in [1], as a load recognizer to perform load disaggregation for the UK-DALE dataset. A comparison among the CO, the parallel computing accelerated GA, and the feed-forward, multilayer ANN for load recognition is shown in Table 7. As shown in Table 3, Table 4, Table 5, Table 6 and Table 7, the feed-forward, multilayer ANN outperforms, in terms of load recognition, the parallel computing accelerated GA that is slightly superior in load recognition to the CO.
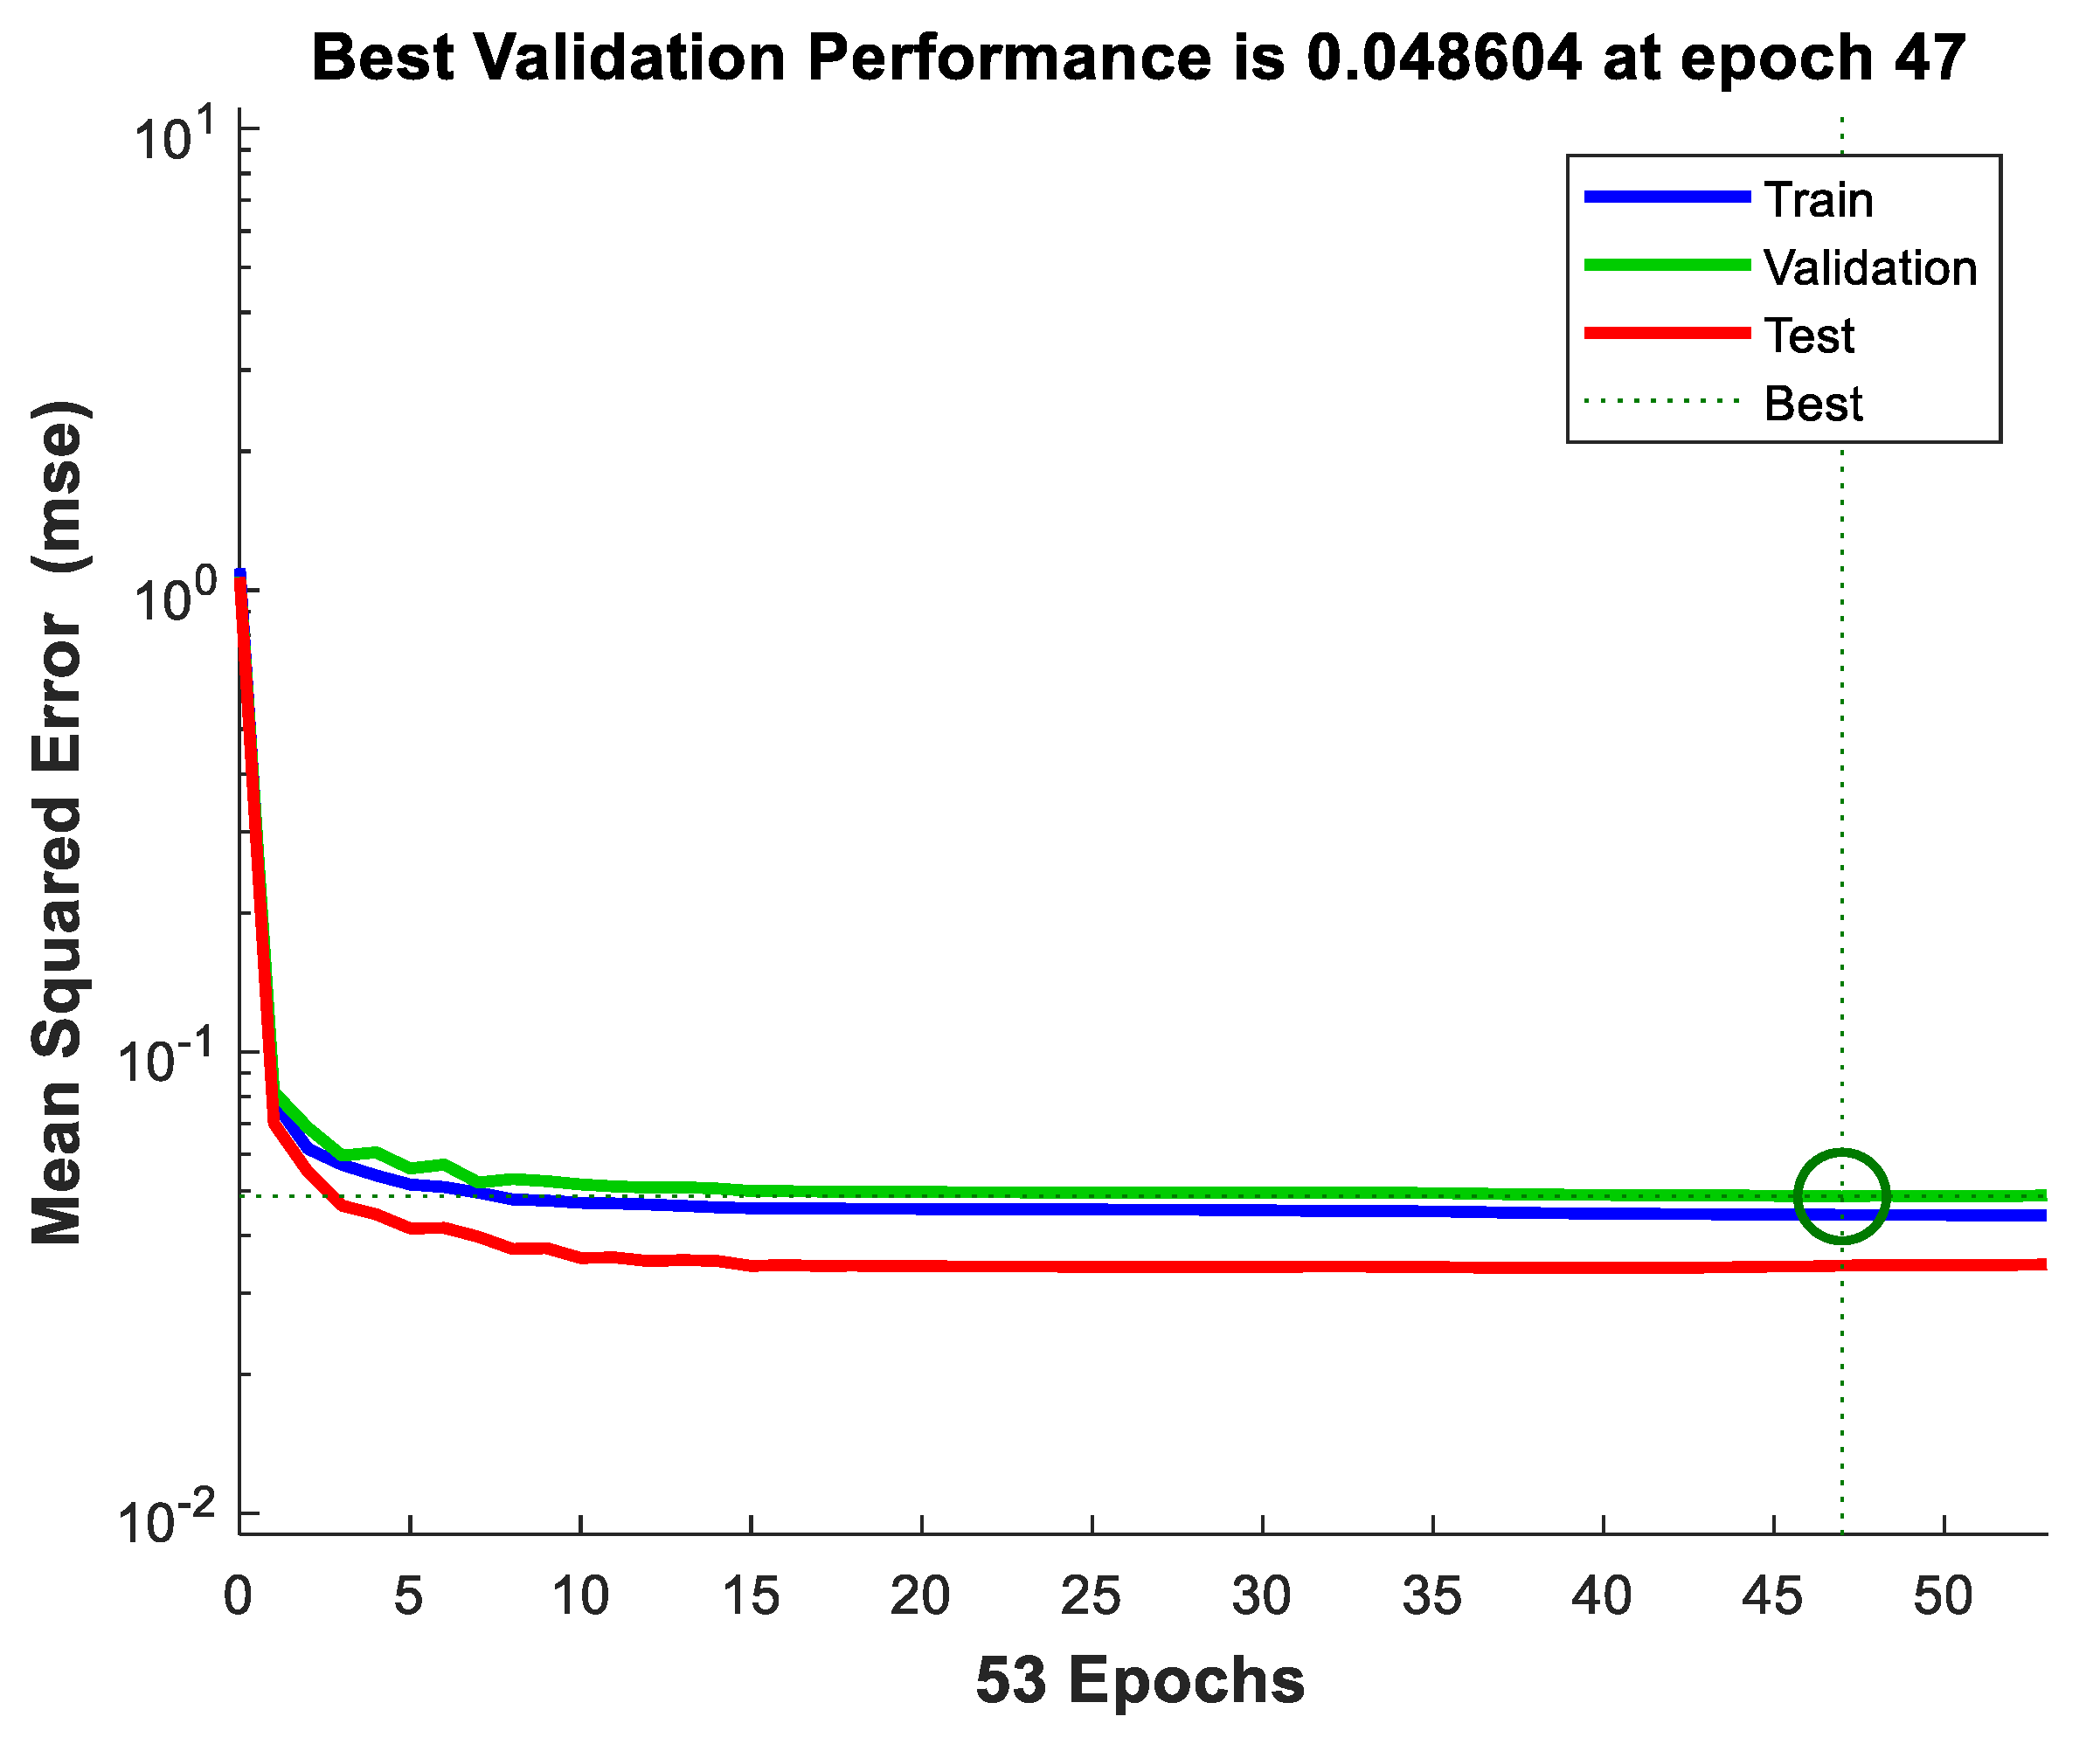
In this experiment, more NIALM data instances, a total of 989 NIALM data instances, are sampled from the house environment and used to experimentally verify the performance of a feed-forward, multilayer ANN (Figure 5a) in terms of load recognition. A network configuration of 1-23-12 of a feed-forward, multilayer ANN was constructed, specified, and used. Also, the feed-forward, multilayer ANN was trained on 643 randomly sampled training data instances (~65% of the whole dataset) and tested on the remaining 346 test data instances. The training trajectory of the feed-forward, multilayer ANN is shown in Figure 10. The resulting MSE was 0.044 (the initial MSE was 1.110). The feed-forward, multilayer ANN can learn from the training data instances across all available CPU workers on the PC used. Table 8 tabulates the load recognition results obtained by the feed-forward, multilayer ANN where it has been well-trained and -validated. In Table 8, the F1 score is shown to each load class. Table 9 also tabulates the load recognition results obtained by the well-trained and -validated feed-forward, multilayer ANN applied on class-imbalanced test data. In Table 9, TPR vs. FPR is also shown for each load class.
As seen in Table 8, the 989 NIALM data instances make up a class-imbalanced dataset. Accuracy alone is not sufficient for evaluating a recognizer trained from class-imbalanced data, where in each class there may exist a significant disparity between positives (status: On) and negatives (status: Off). As a result, F1 score, the harmonic mean of precision and recall, is conducted and used to address the class-imbalanced problem (in order to fully evaluate the performance of the feed-forward ANN in terms of load recognition). Various metrics in addition to F1 score have been developed. Table 9 shows TPRs vs. FPRs, for ROC curves, obtained by the well trained and tested feed-forward, multilayer ANN applied on the class-imbalanced test data for NIALM, where one ROC curve can be shown per class (the maximum AUC is 1, which corresponds to a perfect recognizer as all positives above all negatives—100% sensitivity of no false negatives and 100% specificity of no false positives—are ranked). The authors of [24] used two different types of ANNs, deep NNs by autoencoder and long short-term memory (LSTM), as load recognizers to perform load disaggregation for the UK-DALE dataset. Comparison among the autoencoder, the LSTM and the presented feed-forward, multilayer ANN for load recognition is shown in Table 10. As shown in Table 8, Table 9 and Table 10, the feed-forward, multilayer ANN that gives similar performance, in load recognition, against autoencoder outperforms the LSTM. The load recognizer of the presented NIALM is a shallow neural network, not a deep neural work. As reported in this section, the presented feed-forward, multilayer ANN is able to discriminate the targeted electrical appliances from the house environment well.

4. Conclusions

A smart grid is a promising use-case of AIoT (AI across IoT) that enables bidirectional communication among utilities that come up with DR schemes for DSM and consumers who manage their power demands according to received DR signals. NIALM, a cost-effective load disaggregation approach for (residential) DSM, is able to disaggregate measured total power consumption into appliance-level power consumption based on unique electrical characteristics (features) extracted from electrical appliances concerned. In this paper, we have presented a parallel computing accelerated GA-based NIALM approach, where the presented methodology has been experimentally validated by the publicly available UK-DALE dataset as a reference. It is necessary to parallelize and thus accelerate metaheuristics by exploiting parallel computing, as metaheuristics such as GAs would require very high computational requirements due to its large amounts of data optimized, population-based candidate solutions evaluated as routines, and/or algorithmic iterations executed repeatedly. Besides the parallel computing accelerated GA-based NIALM approach, a feed-forward, multilayer ANN that can learn from training data instances across all available workers of a parallel pool on a machine in parallel computing addresses the same NIALM problem. Therefore, we performed a comparative study. Where, different load recognition approaches in the literature were compared. Comparison among the CO, the parallel computing accelerated GA and the feed-forward, multilayer ANN was shown. The feed-forward, multilayer ANN outperformed, in load recognition, the parallel computing accelerated GA that was slightly superior in load recognition to the CO. Moreover, a comparison among the autoencoder, LSTM, and feed-forward, multilayer ANN was shown. The feed-forward, multilayer ANN that gave similar performance, in load recognition, against the autoencoder outperformed the LSTM. As reported in this paper, the presented NIALM methodology whose performance in load recognition has been improved and compared is able to recognize the targeted/concerned electrical appliances from the house environment well for a future research direction of NIALM in ADLs. In this paper, AI speeded up in parallel computing has been developed and suited for NIALM. In the future, an additional electrical feature or more features will be considered for load disaggregation (Equation (2)). Moreover, high-performance distributed computing harnessing graphics processing units (GPUs) will be developed for the presented methodology in NIALM (batch load disaggregation) for its large-scale evaluation.

Author Contributions

Y.-C.H. conceived, designed, and performed the experiments as well as contributed related experimental tools/materials to analyze the experimental data. Y.-H.L. conceived, designed, and performed the experiments as well as contributed related experimental tools/materials to analyze the experimental data. Y.-H.L. also wrote the paper. C.-H.L. conceived, designed, and performed the experiments as well as contributed related experimental tools/materials to analyze the experimental data. All authors have read and agreed to the published version of the manuscript.

Funding

The Ministry of Science and Technology, Taiwan, under grant nos. MOST 109-3116-F-006-017-CC2 and MOST 109-2221-E-131-006-MY2 partly supported the work that has been done in this paper. First International Computer, Inc. (FIC), Taiwan, under the Industry-Academia Collaboration Project with grant no. O01109E048 partly supported the work as well.

Acknowledgments

The authors would like to sincerely thank the reviewers and editor for their valuable comments and suggestions on this paper.

Conflicts of Interest

The authors declare no conflict of interest.

References

  1. Hart, G.W. Nonintrusive appliance load monitoring. Proc. IEEE 1992, 80, 1870–1891. [Google Scholar] [CrossRef]
  2. Yu, J.; Gao, Y.; Wu, Y.; Jiao, D.; Su, C.; Wu, X. Non-intrusive load disaggregation by linear classifier group considering multi-feature integration. Appl. Sci. 2019, 9, 3558. [Google Scholar] [CrossRef] [Green Version]
  3. Hosseini, S.S.; Agbossou, K.; Kelouwani, S.; Cardenas, A. Non-intrusive load monitoring through home energy management systems: A comprehensive review. Renew. Sustain. Energy Rev. 2017, 79, 1266–1274. [Google Scholar] [CrossRef]
  4. He, H.; Lin, X.; Xiao, Y.; Qian, B.; Zhou, H. Optimal strategy to select load identification features by using a particle resampling algorithm. Appl. Sci. 2019, 9, 2622. [Google Scholar] [CrossRef] [Green Version]
  5. Batra, N.; Singh, A.; Whitehouse, K. If you measure it, can you improve it? Exploring the value of energy disaggregation. In Proceedings of the 2nd ACM International Conference on Embedded Systems for Energy-Efficient Built Environments/ACM BuildSys’15, Seoul, Korea, 4–5 November 2015; pp. 191–200. [Google Scholar]
  6. Froehlich, J.; Larson, E.; Gupta, S.; Cohn, G.; Reynolds, M.; Patel, S. Disaggregated end-use energy sensing for the smart grid. IEEE Pervasive Comput. 2011, 10, 28–39. [Google Scholar] [CrossRef]
  7. Kong, X.; Zhu, S.; Huo, X.; Li, S.; Li, Y.; Zhang, S. A household energy efficiency index assessment method based on non-intrusive load monitoring data. Appl. Sci. 2020, 10, 3820. [Google Scholar] [CrossRef]
  8. Massidda, L.; Marrocu, M.; Manca, S. Non-intrusive load disaggregation by convolutional neural network and multilabel classification. Appl. Sci. 2020, 10, 1454. [Google Scholar] [CrossRef] [Green Version]
  9. Zhao, B.; Stankovic, L.; Stankovic, V. On a training-less solution for non-intrusive appliance load monitoring using graph signal processing. IEEE Access 2016, 4, 1784–1799. [Google Scholar] [CrossRef] [Green Version]
  10. Guillén-García, E.L.; Morales-Velazquez, A.L.; Zorita-Lamadrid, O.; Duque-Perez, R.A.; Osornio-Rios, R.; de Romero-Troncoso, J. Identification of the electrical load by C-means from non-intrusive monitoring of electrical signals in non-residential buildings. Int. J. Electr. Power Energy Syst. 2019, 104, 21–28. [Google Scholar] [CrossRef]
  11. Lin, Y.H.; Tsai, M.S. An advanced home energy management system facilitated by nonintrusive load monitoring with automated multiobjective power scheduling. IEEE Trans. Smart Grid 2015, 6, 1839–1851. [Google Scholar] [CrossRef]
  12. Mueller, J.A.; Kimball, J.W. Accurate energy use estimation for nonintrusive load monitoring in systems of known devices. IEEE Trans. Smart Grid 2018, 9, 2797–2808. [Google Scholar] [CrossRef]
  13. Kong, W.; Dong, Z.Y.; Ma, J.; Hill, D.J.; Zhao, J.; Luo, F. An extensible approach for non-intrusive load disaggregation with smart meter data. IEEE Trans. Smart Grid 2018, 9, 3362–3372. [Google Scholar] [CrossRef]
  14. Lin, Y.H. Design and implementation of an IoT-oriented energy management system based on non-intrusive and self-organizing neuro-fuzzy classification as an electrical energy audit in smart homes. Appl. Sci. 2018, 8, 2337. [Google Scholar] [CrossRef] [Green Version]
  15. Wu, X.; Gao, Y.; Jiao, D. Multi-label classification based on random forest algorithm for non-intrusive load monitoring system. Processes 2019, 7, 337. [Google Scholar] [CrossRef] [Green Version]
  16. Lin, Y.H.; Hu, Y.C. Electrical energy management based on a hybrid artificial neural network-particle swarm optimization-integrated two-stage non-intrusive load monitoring process in smart homes. Processes 2018, 6, 236. [Google Scholar] [CrossRef] [Green Version]
  17. Lin, Y.H.; Hu, Y.C. Residential consumer-centric demand-side management based on energy disaggregation-piloting constrained swarm intelligence: Towards edge computing. Sensors 2018, 18, 1365. [Google Scholar] [CrossRef] [Green Version]
  18. Qi, B.; Liu, L.; Wu, X. Low-rate non-intrusive load disaggregation with graph shift quadratic form constraint. Appl. Sci. 2018, 8, 554. [Google Scholar] [CrossRef] [Green Version]
  19. Zheng, Z.; Chen, H.; Luo, X. A supervised event-based non-intrusive load monitoring for non-linear appliances. Sustainability 2018, 10, 1001. [Google Scholar] [CrossRef] [Green Version]
  20. Schirmer, P.A.; Mporas, I. Statistical and electrical features evaluation for electrical appliances energy disaggregation. Sustainability 2019, 11, 3222. [Google Scholar] [CrossRef] [Green Version]
  21. De Baets, L.; Develder, C.; Dhaene, T.; Deschrijver, D. Detection of unidentified appliances in non-intrusive load monitoring using siamese neural networks. Int. J. Electr. Power Energy Syst. 2019, 104, 645–653. [Google Scholar] [CrossRef]
  22. Fagiani, M.; Bonfigli, R.; Principi, E.; Squartini, S.; Mandolini, L. A non-intrusive load monitoring algorithm based on non-uniform sampling of power data and deep neural networks. Energies 2019, 12, 1371. [Google Scholar] [CrossRef] [Green Version]
  23. Çavdar, İ.H.; Faryad, V. New design of a supervised energy disaggregation model based on the deep neural network for a smart grid. Energies 2019, 12, 1217. [Google Scholar] [CrossRef] [Green Version]
  24. Kelly, J.; Knottenbelt, W. Neural NILM: Deep neural networks applied to energy disaggregation. In Proceedings of the 2nd ACM International Conference on Embedded Systems for Energy-Efficient Built Environments (ACM BuildSys’15), Seoul, Korea, 4–5 November 2015; pp. 55–64. [Google Scholar]
  25. Yang, C.C.; Soh, C.S.; Yap, V.V. A systematic approach to on-off event detection and clustering analysis of non-intrusive appliance load monitoring. Front. Energy 2015, 9, 231–237. [Google Scholar] [CrossRef]
  26. Lin, C.T.; Lee George, C.S. Neural Fuzzy Systems: A Neuro-Fuzzy Synergism to Intelligent Systems; International Edition; Prentice Hall (Pearson Education Taiwan Ltd.): Taipei, Taiwan, 2003; pp. 382–406. [Google Scholar]
  27. Genetic Algorithm—MATLAB & Simulink3-MathWorks. Available online: https://www.mathworks.com/help/gads/genetic-algorithm.html; https://www.mathworks.com/help/gads/ga.html (accessed on 17 July 2020).
  28. Hatcher, W.G.; Yu, W. A survey of deep learning: Platforms, applications and emerging research trends. IEEE Access 2018, 6, 24411–24432. [Google Scholar] [CrossRef]
  29. Machine Learning Crash Course | Google Developers. Available online: https://developers.google.com/machine-learning/crash-course/classification/true-false-positive-negative; https://developers.google.com/machine-learning/crash-course/classification/precision-and-recall; https://developers.google.com/machine-learning/crash-course/classification/roc-and-auc (accessed on 29 April 2020).
  30. Taveira, P.R.Z.; de Moraes, C.H.V.; Lambert-Torres, G. Non-intrusive identification of loads by random forest and fireworks optimization. IEEE Access 2020, 8, 75060–75072. [Google Scholar] [CrossRef]
  31. Lu, M.; Li, Z. A hybrid event detection approach for non-intrusive load monitoring. IEEE Trans. Smart Grid 2020, 11, 528–540. [Google Scholar] [CrossRef] [Green Version]
  32. Kelly, J.; Knottenbelt, W. The UK-DALE dataset, domestic appliance-level electricity demand and whole-house demand from five UK homes. Sci. Data 2015, 2, 150007. [Google Scholar] [CrossRef] [Green Version]
  33. Global Optimization Toolbox—MATLAB-MathWorks. Available online: https://www.mathworks.com/products/global-optimization.html (accessed on 18 May 2020).
  34. Parallel Computing Toolbox—MATLAB-MathWorks. Available online: https://www.mathworks.com/products/parallel-computing.html (accessed on 18 May 2020).
  35. Devlin, M.A.; Hayes, B.P. Non-intrusive load monitoring and classification of activities of daily living using residential smart meter data. IEEE Trans. Consum. Electron. 2019, 65, 339–348. [Google Scholar] [CrossRef]
  36. Batra, N.; Kelly, J.; Parson, O.; Dutta, H.; Knottenbelt, W.; Rogers, A.; Singh, A.; Srivastava, M. NILMTK: An open source toolkit for non-intrusive load monitoring. In Proceedings of the Fifth International Conference on Future Energy Systems (ACM e-Energy), Cambridge, UK, 11–13 June 2014; pp. 265–276. [Google Scholar] [CrossRef] [Green Version]
Figure 1. A basic NIALM process (profiling concerned electrical appliances and statistically computing base load should be done beforehand).
Applsci 10 08114 g001
Figure 2. An illustration of the principle of combinatorial search for load combinations to xi(t) for load disaggregation in this paper, whereby load combinations by xi(t) are optimized. xi(t) is represented as a binary vector, evolved through metaheuristics, and used to minimize Equation (2) between the summation of superimposed absorptions Σxi(t)Pi(t) with an unmonitored base load Pbase(t) and the total load P(t).
Applsci 10 08114 g002
Figure 3. A workflow of the parallel computing accelerated GA used to solve Equation (2) for load recognition in the NIALM in this paper, where the evolutionary cycle is parallelized.
Applsci 10 08114 g003
Figure 4. A chromosomal design encoding xi(t) (at time t) in Equation (2).
Applsci 10 08114 g004
Figure 5. Representative ANNs, connectionisms, mimicking biologic NNs: (a) A connectionism is fully connected; (b) A connectionism considers dropout—one of the hyperparameters whose specified value is used to control the learning process of a connectionism—to prevent overfitting [28].
Applsci 10 08114 g005
Figure 6. Considered historical power demand on two typical days in House 1 from the UK-DALE dataset parsed in this paper. The thin blue line in (a,c) shows the total (whole-house) power demand in the mains; the stacked, filled, and colored blocks show the power demand by the concerned individual electrical appliances and all other submeters [32] considered together and treated as a single individual in the power absorptions also concerned in load disaggregation. Base load in (b,d) exists in the house.
Applsci 10 08114 g006aApplsci 10 08114 g006b
Figure 7. Shown power demand of most of the electrical appliances: (a) fridge; (b) htpc; (c) washer dryer; (d) other submeters.
Applsci 10 08114 g007aApplsci 10 08114 g007bApplsci 10 08114 g007cApplsci 10 08114 g007d
Figure 8. Obtained evolutionary trajectory by the parallel computing accelerated GA in this experiment.
Applsci 10 08114 g008
Figure 9. Training trajectory of the feed-forward, multilayer (1-15-12) ANN.
Applsci 10 08114 g009
Figure 10. Training trajectory of the feed-forward, multilayer (1-23-12) ANN.
Applsci 10 08114 g010
Table 1. Electrical appliances concerned and considered for load disaggregation in this paper.
Electrical ApplianceState 1State 2 3State 3State 4
Mean 1Standard Deviation 2MeanStandard DeviationMeanStandard DeviationMeanStandard Deviation
fridge88.843.7245.516.4----
htpc
(home theatre PC)
68.56.2------
washer dryer182.2131.61833.1152.9----
dishwasher116.015.12309.327.3----
kettle2323.7132.6------
other submeters17.122.267.9152.7457.772.2280.637.4
1Pi (= mean(Pi(t)): statistically computed, for the mean values, from the historical power demand data and stored in the database in Figure 1, where an eventless NIALM approach, the presented methodology, is shown; 2 τi: cistd(Pi(t)); 3 In the GA, the multistate transitions from the same types of the concerned electrical appliances are mutually exclusive; illegal offspring are assigned an objective value of 1000 to Equation (2) (an illegal chromosome cannot be decoded to/as a solution; that is, such an illegal chromosome cannot be evaluated).
Table 2. Twelve load classes considered from the targeted electrical appliances in Table 1 and recognized.
ClassLoad
1fridge, state 1
2fridge, state 2
3htpc, state 1
4washer dryer, state 1
5washer dryer, state 2
6dishwasher, state 1
7dishwasher, state 2
8kettle, state 1
9other submeters, state 1
10other submeters, state 2
11other submeters, state 3
12other submeters, state 4
Table 3. Load recognition results obtained by the parallel computing accelerated GA.
ClassPrecisionRecallF1 Score 1Number of Appliance Instances
10.360.810.5058
20.000.000.0025
30.390.470.4288
40.050.040.0426
50.000.000.0068
60.570.140.2287
70.120.360.1811
80.141.000.244
90.480.570.5297
100.280.290.2951
110.000.000.007
120.250.140.1835
Avg./total0.320.330.29557
1F1 score is the harmonic mean of precision and recall, which is commonly used to evaluate a class-imbalanced problem addressed by a recognizer with a class-imbalanced dataset to be learned.
Table 4. Obtained TPRs vs. FPRs, for ROC curves, by the parallel computing accelerated GA, where for the 12 classes the AUCs obtained are also shown.
ClassFPRTPRAUC
10.560.810.63
20.110.000.45
30.540.470.46
40.110.040.46
50.150.000.43
60.070.140.53
70.150.360.61
80.121.000.94
90.530.570.52
100.240.290.53
110.100.000.45
120.090.140.53
Table 5. Load recognition results obtained by the feed-forward ANN where it has been well trained and validated on the class-imbalanced training data.
ClassPrecisionRecallF1 ScoreNumber of Appliance Instances
10.870.770.8252
20.380.750.504
30.800.740.7738
40.750.670.719
50.881.000.937
60.250.330.293
70.690.920.7912
80.920.790.8514
90.780.940.8533
100.960.850.9026
110.750.670.719
120.500.250.334
Avg./total0.810.790.79211
Table 6. Obtained TPRs vs. FPRs, for ROC curves, from the well trained and tested feed-forward, multilayer ANN applied on the class-imbalanced test data; for the 12 classes the AUCs obtained are also shown.
ClassFPRTPRAUC
10.290.770.74
20.070.750.84
30.200.740.77
40.030.670.82
50.021.000.99
60.040.330.65
70.080.920.92
80.020.790.88
90.230.940.86
100.020.850.91
110.030.670.82
120.010.250.62
Table 7. Comparison among the CO, the parallel computing accelerated GA and the feed-forward, multilayer ANN for load recognition.
Electrical ApplianceCO 1 [1]The Presented GA-Based NIALMThe Presented ANN-Based NIALM
PrecisionRecallF1 ScorePrecisionRecallF1 ScorePrecisionRecallF1 Score
fridge0.300.410.350.180.410.25 20.630.760.68 2
dishwasher0.060.670.110.350.250.2 20.470.630.54 2
kettle0.230.460.310.141.000.240.920.790.85
Avg.0.200.510.260.220.550.230.670.730.69
1 Combinatorial optimization-based NIALM, which was implemented as a widget in the NILMTK developed for the purpose of performing preliminary work for NIALM data preparation and providing a few load recognition approaches for load disaggregation. 2 Across its all states.
Table 8. Load recognition results obtained by the feed-forward ANN where it has been well trained and validated on the class-imbalanced training data.
ClassPrecisionRecallF1 ScoreNumber of Appliance Instances
10.880.820.85210
20.880.980.9345
30.630.620.62105
40.670.910.7711
50.860.840.85122
61.000.900.9589
70.780.820.8051
80.330.600.435
90.940.930.93208
100.670.710.6917
110.900.820.86126
120.000.000.000
Avg./total0.860.840.85989
Table 9. Obtained TPRs vs. FPRs, for ROC curves, from the well trained and tested feed-forward, multilayer ANN applied on the class-imbalanced test data; for the 12 classes the AUCs obtained are also shown.
ClassFPRTPRAUC
10.170.820.83
20.020.980.98
30.160.620.73
40.010.910.95
50.080.840.88
60.000.900.95
70.040.820.89
80.020.600.79
90.100.930.92
100.020.710.84
110.050.820.88
120.02nannan
Table 10. Comparison among the autoencoder, the LSTM and the presented feed-forward, multilayer ANN for load recognition.
Electrical ApplianceThe Presented ANN-Based NIALMA Deep ANN-Based Load Disaggregation by Autoencoder [24]A Deep ANN-Based Load Disaggregation by LSTM [24]
PrecisionRecallF1 ScorePrecisionRecallF1 ScorePrecisionRecallF1 Score
fridge0.880.900.89 10.850.880.870.720.770.74
dishwasher0.890.860.88 10.290.990.440.040.870.08
kettle0.330.600.431.000.870.930.960.910.93
Avg.0.700.790.730.710.910.750.570.850.58
1 Across its all states.
Publisher’s Note: MDPI stays neutral with regard to jurisdictional claims in published maps and institutional affiliations.

