Effect of Red Blood Cell Aging In Vivo on Their Aggregation Properties In Vitro: Measurements with Laser Tweezers


 and
and 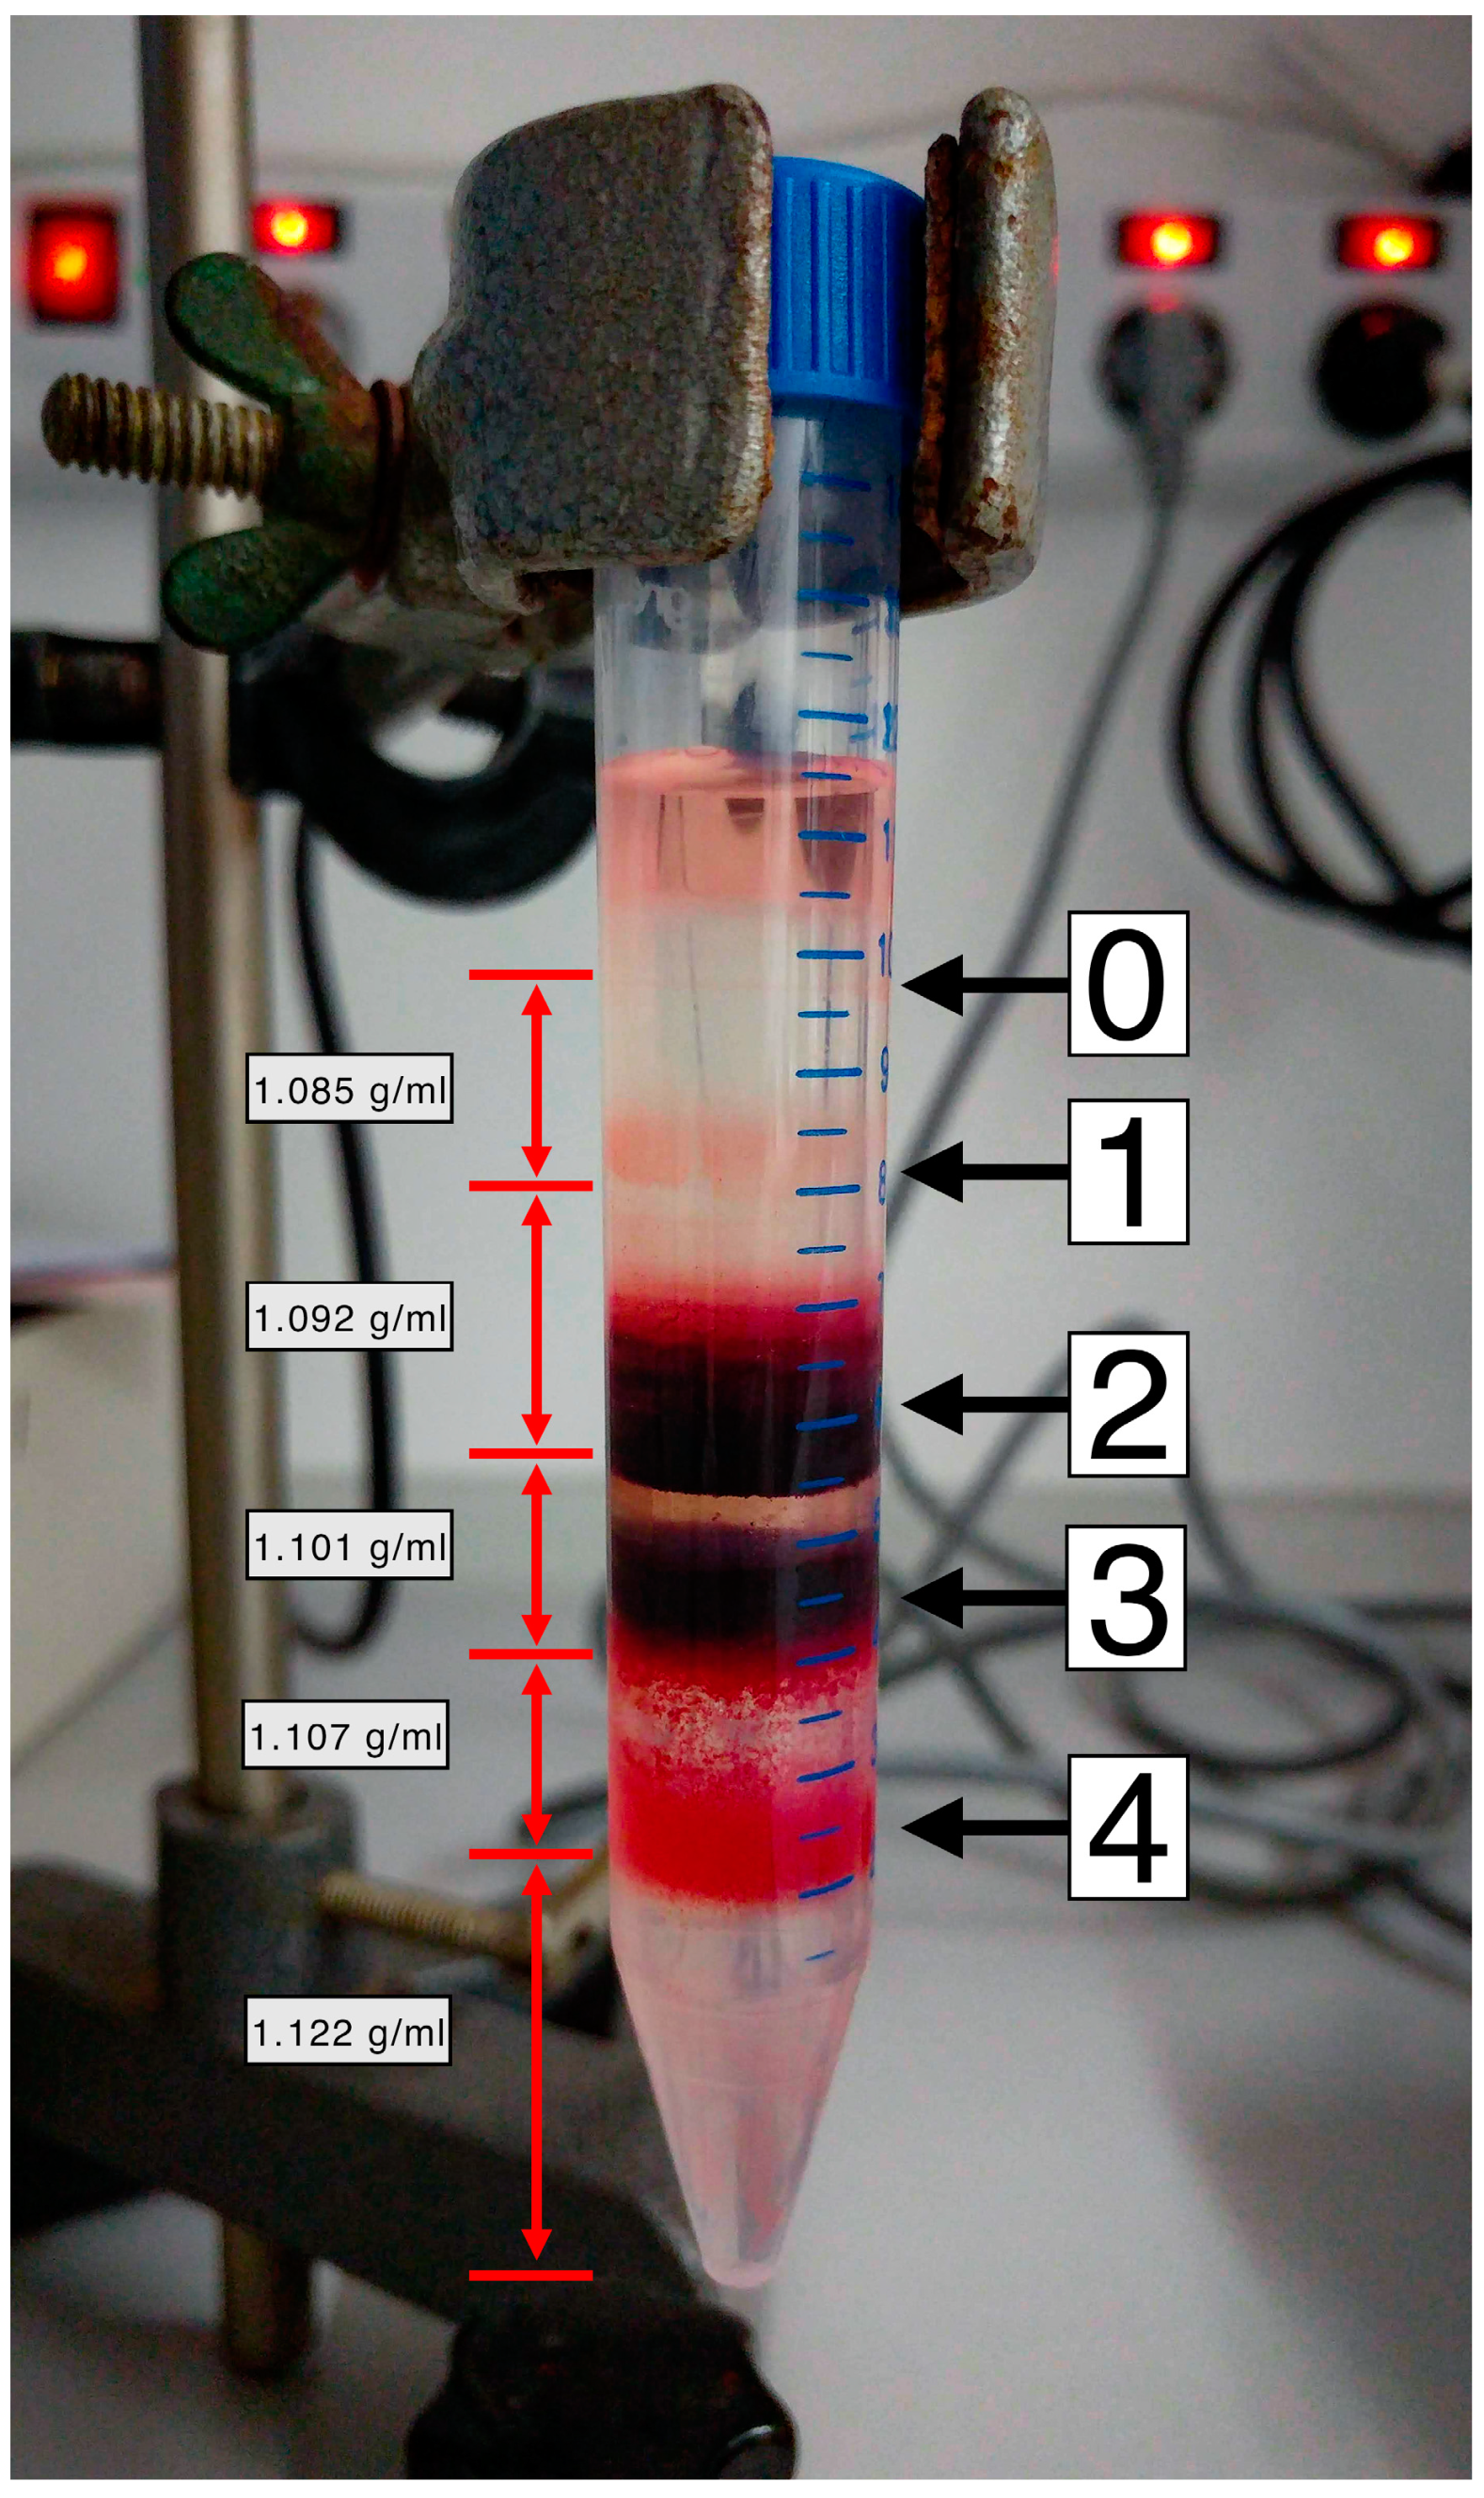
Abstract
1. Introduction
2. Materials and Methods
2.1. RBC Fractionation
2.2. Laser Tweezers
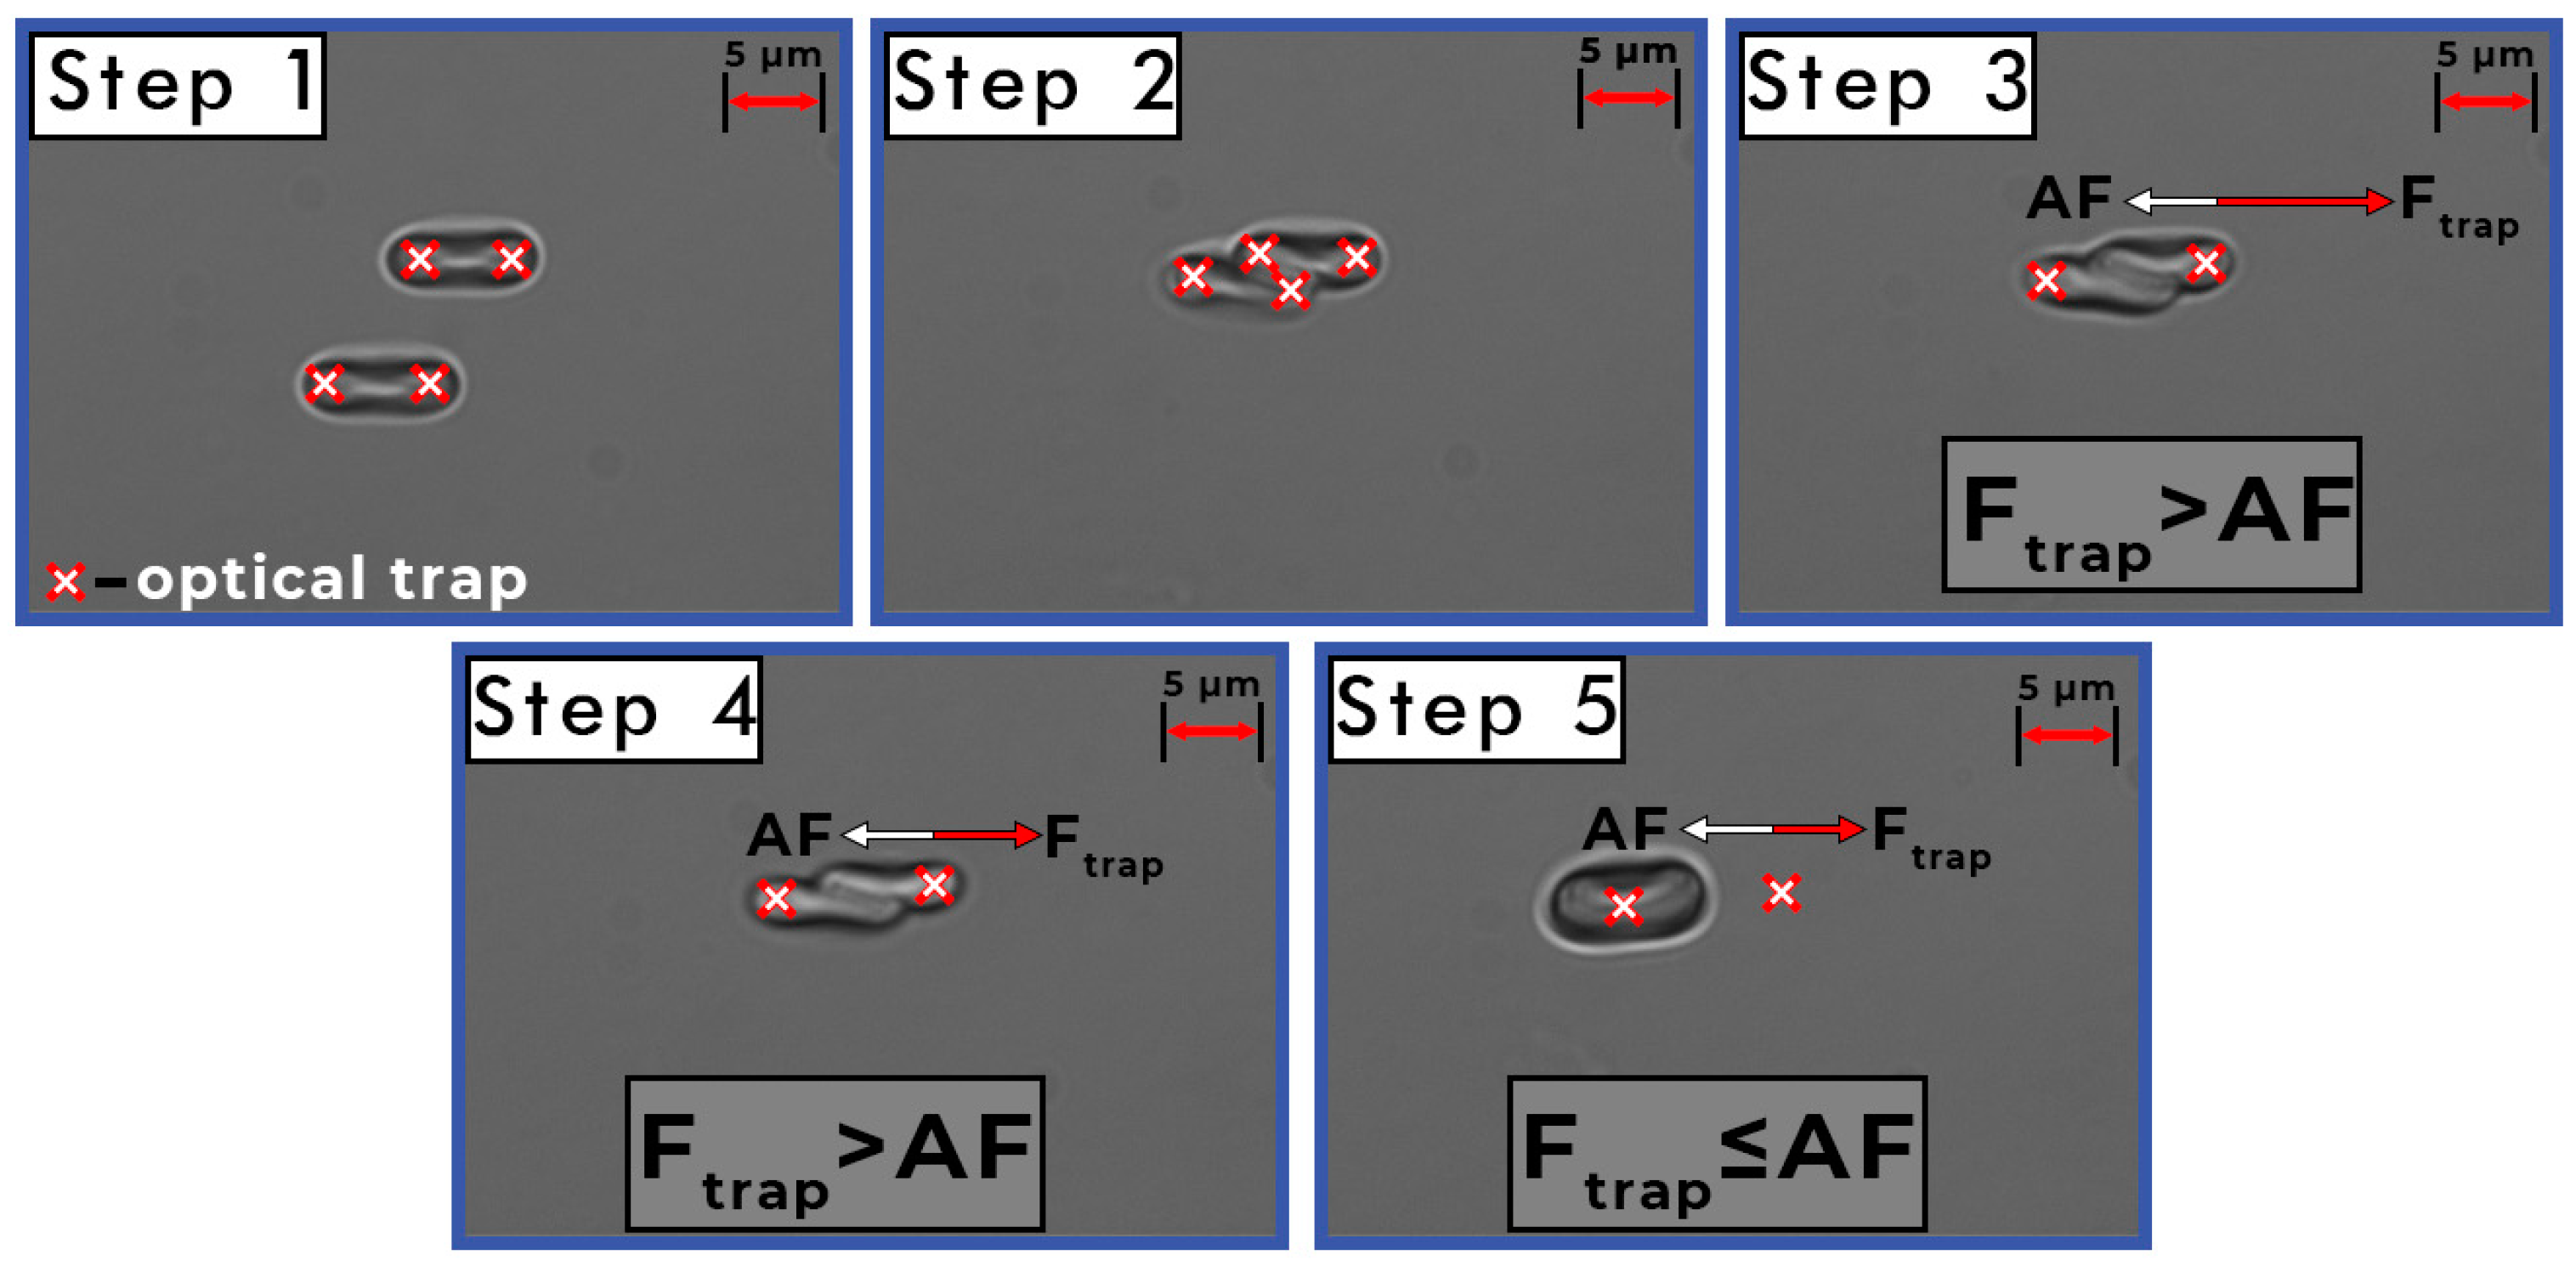
2.3. Measurements of the Interaction Forces between Individual RBCs
2.4. Statistical Analysis
3. Results
4. Discussion
5. Conclusions
Supplementary Materials
Author Contributions
Funding
Conflicts of Interest
References
- Yaroslavsky, A.N.; Yaroslavsky, I.V. Optics of blood. In Handbook of Optical Biomedical Diagnostics, 2nd ed.; Tuchin, V.V., Ed.; SPIE PRESS: Bellingham, WA, USA, 2016; Volume 1, pp. 161–220. [Google Scholar]
- Baskurt, O.; Neu, B.; Meiselman, H.J. Red Blood Cell Aggregation, 1st ed.; CRC Press: Boca Raton, FL, USA, 2012; pp. 31–59. [Google Scholar]
- Zhang, Z.W.; Neu, B. Role of macromolecular depletion in red blood cell adhesion. Biophys. J. 2009, 97, 1031–1037. [Google Scholar] [CrossRef] [PubMed]
- Wagner, C.; Steffen, P.; Svetina, S. Aggregation of red blood cells: From rouleaux to clot formation. C. R. Phys. 2013, 14, 459–469. [Google Scholar] [CrossRef]
- Fantoni, R.; Giacometti, A.; Santos, A. Bridging and depletion mechanisms in colloid-colloid effective interaction: A reentrant phase diagram. J. Chem. Phys. 2015, 142, 224905. [Google Scholar] [CrossRef] [PubMed]
- Ermolinkiy, P.B.; Semenov, A.N.; Lugovtsov, A.E.; Poeschl, C.; Windberger, U.; Kaliviotis, E.; Priezzhev, A.V. Effect of different macromolecules on viscous and microrheologic properties of blood at various temperatures. Proc. SPIE 2019, 11065, 1106507-1–1106507-5. [Google Scholar]
- Priezzhev, A.V.; Lee, K.; Firsov, N.N.; Lademann, J. Optical study of rbc aggregation in whole blood samples and single cells. In Handbook on Optical Biomedical Diagnostics, 2nd ed.; Tuchin, V.V., Ed.; SPIE PRESS: Bellingham, WA, USA, 2016; Volume 1, pp. 5–36. [Google Scholar]
- Brooks, D.E. Mechanism of red cell aggregation. In Blood Cells, Rheology and Aging, 1st ed.; Platt, D., Ed.; Springer: Berlin/Heidelberg, Germany, 1988; pp. 158–162. [Google Scholar]
- Franco, R.S. Measurement of red cell lifespan and aging. Transfus. Med. Hemother. 2012, 39, 302–307. [Google Scholar] [CrossRef] [PubMed]
- Mock, D.M.; Matthews, N.I.; Zhu, S.; Strauss, R.G.; Schmidt, R.L.; Nalbant, D.; Cress, G.A.; Widness, J.A. Red blood cell (RBC) survival determined in humans using RBCs labeled at multiple biotin densities. Transfusion 2011, 51, 1047–1057. [Google Scholar] [CrossRef]
- Shrestha, R.P.; Horowitz, J.; Hollot, C.V.; Germain, M.J.; Widness, J.A.; Mock, D.M.; Veng-Pedersen, P.; Chait, Y. Models for the red blood cell lifespan. J. Pharm. Pharm. 2016, 43, 259–274. [Google Scholar] [CrossRef]
- Waugh, R.E.; Narla, M.; Jackson, C.W.; Mueller, T.J.; Suzuki, T.; Dale, G.L. Rheologic properties of senescent erythrocytes: Loss of surface area and volume with red blood cell age. Blood 1992, 79, 1351–1358. [Google Scholar] [CrossRef]
- Huang, Y.X.; Wu, Z.J.; Mehrishi, J.; Huang, B.T.; Chen, X.Y.; Zheng, X.J.; Liu, W.J.; Luo, M. Human red blood cell aging: Correlative changes in surface charge and cell properties. J. Cell. Mol. Med. 2011, 15, 2634–2642. [Google Scholar] [CrossRef]
- Bizjak, D.B.; Brinkmann, C.; Bloch, W.; Grau, M. Increase in red blood cell-nitric oxide synthase dependent nitric oxide production during red blood cell aging in health and disease: A study on age dependent changes of rheologic and enzymatic properties in red blood cells. PLoS ONE 2015, 10, e0125206. [Google Scholar] [CrossRef]
- Bladier, D.; Vassy, R.; Perret, G.; Cornillot, P.; Monsigny, M. Red cell ageing: Phagocytosis and life-span of young and old erythrocytes fractionated by centrifugation. Biol. Cell 1983, 49, 231–236. [Google Scholar] [CrossRef] [PubMed]
- Lutz, H.U.; Stammler, P.; Fasler, S.; Ingold, M.; Fehr, J. Density separation of human red blood cells on self forming PercollR gradients: Correlation with cell age. Biochim. Biophys. Acta 1992, 1116, 1–10. [Google Scholar] [CrossRef]
- Bosch, F.H.; Werre, J.M.; Roerdinkholder-Stoelwinder, B.; Huls, T.H.; Willekens, F.L.; Halie, M.R. Characteristics of red blood cell populations fractionated with a combination of counterflow centrifugation and Percoll separation. Blood 1992, 79, 254–260. [Google Scholar] [CrossRef]
- D’Alessandro, A.; Blasi, B.; D’Amici, G.M.; Marrocco, C.; Zolla, L. Red blood cell subpopulations in freshly drawn blood: Application of proteomics and metabolomics to a decades-long biological issue. Blood Transfus. 2013, 11, 75–87. [Google Scholar] [PubMed]
- Morrison, M.; Jackson, C.W.; Mueller, T.J.; Huang, T.; Dockter, M.E.; Walker, W.S.; Singer, J.A.; Edwards, H.H. Does cell density correlate with red cell age? Biomed. Biochim. Acta 1983, 42, S107–S111. [Google Scholar]
- Ashkin, A. Optical Trapping and Manipulation of Neutral Particles Using Lasers: A Reprint Volume with Commentaries, 1st ed.; World Scientific Publishing Co. Pte. Ltd.: Singapore, 2006; pp. 123–135. [Google Scholar]
- Lugovtsov, A.E.; Gurfinkel, Y.I.; Ermolinskiy, P.B.; Maslyanitsina, A.I.; Dyachuk, L.I.; Priezzhev, A.V. Optical assessment of alterations of microrheologic and microcirculation parameters in cardiovascular diseases. Biomed. Opt. Express 2019, 10, 3974–3986. [Google Scholar] [CrossRef] [PubMed]
- Ermolinskiy, P.B.; Lugovtsov, A.E.; Maslyanitsina, A.I.; Semenov, A.N.; Dyachuk, L.I.; Priezzhev, A.V. Interaction of erythrocytes in the process of pair aggregation in blood samples from patients with arterial hypertension and healthy donors: Measurements with laser tweezers. J. Biomed. Photonics Eng. 2018, 4, 1–8. [Google Scholar] [CrossRef]
- Kaestner, L.; Steffen, P.; Nguyen, D.B.; Wang, J.; Wagner-Britz, L.; Jung, A.; Wagner, C.; Bernhardt, I. Lysophosphatidic acid induced red blood cell aggregation in vitro. Bioelectrochemistry 2012, 87, 89–95. [Google Scholar] [CrossRef]
- Lee, K.; Wagner, C.; Priezzhev, A.V. Assessment of the “cross—Bridge”—Induced interaction of red blood cells by optical trapping combined with microfluidics. J. Biomed. Opt. 2017, 22, 1–6. [Google Scholar] [CrossRef]
- Lee, K.; Shirshin, E.; Rovnyagina, N.; Yaya, F.; Boujja, Z.; Priezzhev, A.; Wagner, C. Dextran adsorption onto red blood cells revisited: Single cell quantification by laser tweezers combined with microfluidics. Biomed. Opt. Express 2018, 9, 2755–2764. [Google Scholar] [CrossRef]
- Ermolinkiy, P.B.; Maslyanitsina, A.I.; Lugovtsov, A.E.; Priezzhev, A.V. Temperature dependencies of the aggregation properties of RBC in dextran solutions in vitro. J. Biomed. Photonics Eng. 2020, 6, 1–4. [Google Scholar]
- Lee, K.; Kinnunen, M.; Khokhlova, M.D.; Lyubin, E.V.; Priezzhev, A.V.; Meglinski, I.; Fedyanin, A.A. Optical tweezers study of red blood cell aggregation and disaggregation in plasma and protein solutions. J. Biomed. Opt. 2016, 21, 1–10. [Google Scholar] [CrossRef]
- Lee, K.; Priezzhev, A.; Shin, S.; Yaya, F.; Meglinsky, I. Characterization of shear stress preventing red blood cells aggregation at the individual cell level: The temperature dependence. Clin. Hemorheol. Microcirc. 2016, 64, 853–857. [Google Scholar] [CrossRef]
- Baskurt, O.K.; Mat, F. Importance of measurement temperature in detecting the alterations of red blood cell aggregation and deformability studied by ektacytometry: A study on experimental sepsis in rats. Clin. Hemorheol. Microcirc. 2000, 23, 43–49. [Google Scholar] [PubMed]
- Singh, M.; Stoltz, J.F. Influence of temperature variation from 5 degrees C to 37 degrees C on aggregation and deformability of erythrocytes. Clin. Hemorheol. Microcirc. 2002, 26, 1–7. [Google Scholar]
- Kim, J.; Lee, H.Y.; Shin, S. Advanced measurements of red blood cell deformability. J. Cell. Biotechnol. 2015, 1, 63–79. [Google Scholar] [CrossRef]
- Maklygin, A.Y.; Priezzhev, A.V.; Karmenian, A.; Nikitin, S.Y.; Obolenskii, I.S.; Lugovtsov, A.E.; Lee, K. Measurement of interaction forces between red blood cells in aggregates by optical tweezers. Quantum Electron. 2012, 42, 500–504. [Google Scholar] [CrossRef]
- Meiselman, H.J. Red blood cell role in rbc aggregation: 1963–1993 and beyond. Clin. Hemorheol. Microcirc. 1993, 13, 575–592. [Google Scholar] [CrossRef]
- Tugral, E.; Yalcin, O.; Baskurt, O.K. Effect of donor age on the deformability and aggregability of density-separated red blood cells. Turk. J. Hematol. 2002, 19, 303–308. [Google Scholar]
- Meiselman, H.J. Red blood cell aggregation: 45 years being curious. Biorheology 2009, 46, 1–19. [Google Scholar] [CrossRef]
- Bernhardt, I.; Nguyen, D.B.; Wesseling, M.C.; Kaestner, L. Intracellular Ca2+ concentration and phosphatidylserine exposure in healthy human erythrocytes in dependence on in vivo cell age. Front. Physiol. 2020, 10, 1–9. [Google Scholar] [CrossRef] [PubMed]
- Orbach, A.; Zelig, O.; Yedgar, S.; Barshtein, G. Biophysical and biochemical markers of red blood cell fragility. Transfus. Med. Hemother. 2017, 44, 183–187. [Google Scholar] [CrossRef]
- Hadengue, A.L.; Del-Pino, M.; Simon, A.; Levenson, J. Erythrocyte disaggregation shear stress, sialic acid, and cell aging in humans. Hypertension 1998, 32, 324–330. [Google Scholar] [CrossRef]
- Whittingstall, P.; Meiselman, H.J. Effect of galactose incubation on the aggregation behavior of density-separated human erythrocytes. In Hemorheologie et Aggregation Erythrocytaire, 1st ed.; Stoltz, J.F., Donner, M., Copley, A.L., Eds.; Editions Medicales Internationales: Paris, France, 1991; pp. 111–122. [Google Scholar]
- Neu, B.; Sowemimo-Coker, S.O.; Meiselman, H.J. Cell-cell affinity of senescent human erythrocytes. Biophys. J. 2003, 85, 75–84. [Google Scholar] [CrossRef]
- Gottlieb, Y.; Topaz, O.; Cohen, L.A.; Yakov, L.D.; Haber, T.; Morgenstern, A.; Weiss, A.; Berman, C.H.; Fibach, E.; Meyron-Holtz, E.G. Physiologically aged red blood cells undergo erythrophagocytosis in vivo but not in vitro. Haematologica 2012, 97, 994–1002. [Google Scholar] [CrossRef] [PubMed]


Publisher’s Note: MDPI stays neutral with regard to jurisdictional claims in published maps and institutional affiliations. |
© 2020 by the authors. Licensee MDPI, Basel, Switzerland. This article is an open access article distributed under the terms and conditions of the Creative Commons Attribution (CC BY) license (http://creativecommons.org/licenses/by/4.0/).
Share and Cite
Ermolinskiy, P.; Lugovtsov, A.; Yaya, F.; Lee, K.; Kaestner, L.; Wagner, C.; Priezzhev, A. Effect of Red Blood Cell Aging In Vivo on Their Aggregation Properties In Vitro: Measurements with Laser Tweezers. Appl. Sci. 2020, 10, 7581. https://doi.org/10.3390/app10217581
Ermolinskiy P, Lugovtsov A, Yaya F, Lee K, Kaestner L, Wagner C, Priezzhev A. Effect of Red Blood Cell Aging In Vivo on Their Aggregation Properties In Vitro: Measurements with Laser Tweezers. Applied Sciences. 2020; 10(21):7581. https://doi.org/10.3390/app10217581
Chicago/Turabian StyleErmolinskiy, Petr, Andrei Lugovtsov, François Yaya, Kisung Lee, Lars Kaestner, Christian Wagner, and Alexander Priezzhev. 2020. "Effect of Red Blood Cell Aging In Vivo on Their Aggregation Properties In Vitro: Measurements with Laser Tweezers" Applied Sciences 10, no. 21: 7581. https://doi.org/10.3390/app10217581
APA StyleErmolinskiy, P., Lugovtsov, A., Yaya, F., Lee, K., Kaestner, L., Wagner, C., & Priezzhev, A. (2020). Effect of Red Blood Cell Aging In Vivo on Their Aggregation Properties In Vitro: Measurements with Laser Tweezers. Applied Sciences, 10(21), 7581. https://doi.org/10.3390/app10217581