Article

Modelling of Red Blood Cell Morphological and Deformability Changes during In-Vitro Storage

1
School of Mechanical, Medical and Process Engineering, Science and Engineering Faculty, Queensland University of Technology (QUT), Brisbane City, QLD 4000, Australia
2
School of Mechanical and Mechatronic Engineering, University of Technology Sydney (UTS), Ultimo, NSW 2007, Australia
3
Research and Development, Australian Red Cross Lifeblood, Kelvin Grove, QLD 4059, Australia
*
Author to whom correspondence should be addressed.
Appl. Sci. 2020, 10(9), 3209; https://doi.org/10.3390/app10093209
Submission received: 28 February 2020 / Revised: 16 April 2020 / Accepted: 27 April 2020 / Published: 4 May 2020
(This article belongs to the Special Issue Insights into Red Blood Cell Aging: In Vivo and in Vitro)

Abstract

:

Featured Application

Red blood cell (RBC) storage lesion is a critical issue facing transfusion treatments, and significant changes in RBC morphology and deformability are observed due to the storage lesion. RBCs require high deformability to sustain in-vivo circulation, and impaired deformability leads to several post-transfusion adverse outcomes. Therefore, improved understanding of the interrelation between the morphological and deformability changes and the quality and viability of the stored RBCs is essential to prevent or reduce the transfusion related adverse outcomes. To support this requisite, the influence on RBC deformability due to several aspects of the storage lesion, namely, the changes in cell morphology, surface area and volume, RBC membrane biomechanics, and cytoskeletal structural integrity are explored numerically in this study.

Abstract

Storage lesion is a critical issue facing transfusion treatments, and it adversely affects the quality and viability of stored red blood cells (RBCs). RBC deformability is a key indicator of cell health. Deformability measurements of each RBC unit are a key challenge in transfusion medicine research and clinical haematology. In this paper, a numerical study, inspired from the previous research for RBC deformability and morphology predictions, is conducted for the first time, to investigate the deformability and morphology characteristics of RBCs undergoing storage lesion. This study investigates the evolution of the cell shape factor, elongation index and membrane spicule details, where applicable, of discocyte, echinocyte I, echinocyte II, echinocyte III and sphero-echinocyte morphologies during 42 days of in-vitro storage at 4 °C in saline-adenine-glucose-mannitol (SAGM). Computer simulations were performed to investigate the influence of storage lesion-induced membrane structural defects on cell deformability and its recoverability during optical tweezers stretching deformations. The predicted morphology and deformability indicate decreasing quality and viability of stored RBCs undergoing storage lesion. The loss of membrane structural integrity due to the storage lesion further degrades the cell deformability and recoverability during mechanical deformations. This numerical approach provides a potential framework to study the RBC deformation characteristics under varying pathophysiological conditions for better diagnostics and treatments.

1. Introduction

A red blood cell (RBC) transfusion is a critical and lifesaving medical procedure for anaemia caused by disease leading to inadequate bone marrow production or increased RBC breakdown, or by blood loss due to trauma or surgery [1,2,3,4]. Therefore, in-vitro storage is important to fulfil both constant and sudden demands of RBCs for transfusion. According to the current blood bank procedures, RBCs can be stored up to 42 days at 2–4 °C in a preservative solution [1,5], and studies on alternative preservative solutions, rejuvenation procedures, anaerobic storage conditions and temperature effects [2,6,7] are being conducted to ensure the maximum storage time for a healthy and safe RBC supply. The stored RBCs are suitable for transfusion if the mean haemolysis is below 0.8% and more than 75% RBCs survive the first 24 h of post-transfusion period [5,8,9,10,11]. However, concerns have been raised about the quality of stored RBCs as several transfusion complications [12] are observed with respect to the shelf life of the stored RBCs. During the storage, RBCs undergo several biochemical, structural and functional changes, usually known as storage lesion [2,4,5,12,13,14,15,16,17,18,19,20]. These changes include slowed metabolism with a decrease of adenosine triphosphate (ATP) concentration, oxidative damage with structural changes to band 3 protein and lipid peroxidation, functional loss of cation pumps and consequent loss of intracellular potassium and accumulation of sodium, and apoptotic changes of membrane phospholipids and membrane vesiculation [3,19,21,22,23]. Most of these changes that occur due to decreased metabolism such as depletion of ATP and 2,3-diphosphoglycerate (DPG) and cation imbalance are reversible under in vivo conditions. However, protein and lipid modifications, morphology changes, and membrane vesiculation are not reversible under in vivo conditions [15,22]. These irreversible modifications can affect the in vivo cell survival leading to adverse post-transfusion outcomes. Therefore, it is important to measure the quality of each RBC unit prior to use, and the RBC deformability is a key indicator of RBC quality and post-transfusion viability [8,24,25,26]. RBC deformability is primarily influenced by mechanical and geometrical factors of the cell such as cell surface area and volume, elasticity and viscosity of the cell membrane, and volume and viscosity of the cytosol [27,28,29,30,31,32,33]. Therefore, the changes in the cell membrane structure and its mechanical properties adversely affect the cell deformability, and less deformable RBCs can obstruct capillaries and require significantly higher transit time to navigate through the microvasculature leading to decreased levels of oxygen delivery to organs [34,35,36]. In addition, less deformable RBCs are promptly removed from the circulation at the spleen [14,37].
Furthermore, the storage lesion gradually transforms the healthy biconcave discocyte morphology into echinocyte and sphero-echinocyte morphologies [20,21], and the cell becomes smaller and denser [38]. In addition to the in-vitro RBC storage, certain other pathophysiological conditions such as hereditary haemolytic disorders (i.e., spherocytosis, elliptocytosis and ovalocytosis) [27,39], sickle cell disease, malaria [40,41,42,43,44,45,46,47], and shape-transforming conditions (i.e., stomatocytogenic and echinocytogenic conditions) [48,49,50,51,52,53,54] can alter healthy biconcave discocyte morphology. The stomatocytogenic and echinocytogenic shape-transforming conditions transform the usual biconcave discocyte shape into stomatocytes and echinocytes, respectively at constant cell surface area and volume [49,50,51,52,53]. These shape changes are reversible to the stage where sphero-stomatocyte and sphero-echinocyte are formed [55]. These pathophysiological conditions can affect the inter-protein and protein-to-lipid linkages of the cell membrane [56], and alter the mechanical and structural integrity of the cell membrane, leading to reduced cell deformability. Therefore, the RBC deformability is a potential measure of cell viability subjected to morphological, structural and functional changes, and provide valuable insights into the physiology, cell biology and biorheology under pathophysiological conditions. Different techniques have been used to investigate RBC deformability, and descriptions of these techniques can be found in [17,25,29,33,42,43,47,57,58,59,60,61,62,63,64,65,66,67,68,69,70]. Optical tweezers is one such technique and provides a highly sensitive assessment of the cell deformability at the single cell level. With optical tweezers, it is possible to trap, manipulate and displace a living cell or a part of it without damage, either directly or using specific handles such as dielectric beads of silica [27,36,38,40,71,72].
These investigations improve the basic understanding of RBC behaviour under healthy and pathophysiological conditions, in order to be integrated into clinical applications. However, a more detailed understanding on RBC ageing during storage, ageing-influenced changes in RBC metabolism, structural and functional aspects, is required to improve the quality, efficacy and safety of stored RBCs and thereby to prevent or reduce the adverse post-transfusion outcomes. Numerical modelling is a desirable approach to investigate the fundamental mechanics of cell deformability over the experimental investigations, which can be challenging and costly [67,68,73]. Accurate numerical modelling combined with experimental measurements can provide valuable insight on RBC quality and viability. This paper proposes a numerical approach inspired from the previous research for RBC morphology predictions [74,75,76] and for analysis of RBC deformations [39,58] to investigate, for the first time, the deformability and morphology changes of RBCs subjected to storage lesion. A three-dimensional coarse-grained (CG)-RBC membrane model based on the bilayer-couple model (BCM) [76] was employed to predict RBC echinocytosis during 42 days of in-vitro storage at 4 °C in saline-adenine-glucose-mannitol (SAGM) preservative solution. The evolution of RBC morphology, its membrane shear modulus and bending modulus, and cell surface area and volume based on analogous experimental measurements [8,47], was incorporated into the model to better predict the deformability and morphological changes of stored RBCs. The deformability and morphology characteristics: cell shape factor, elongation index and membrane spicule details where applicable, of stored RBCs having discocyte, echinocyte I, echinocyte II, echinocyte III and sphero-echinocyte morphologies, were studied during the 42 days of in-vitro storage, and compared against analogous morphologies obtained via echinocytogenic shape-transforming conditions. The shape-transforming conditions have the potential to recover the morphological and deformability changes of stored RBCs, and to lower the influence of storage lesion. Therefore, the present study investigates the morphology and deformability characteristics of RBCs during in-vitro storage and compares them against echinocytic conditions. In addition, the influence of storage lesion-induced membrane structural defects on cell deformability and its recoverability of sphero-echinocyte morphology under optical tweezers stretching deformation was investigated. The following subsections briefly outline the evolution of RBC morphology and associated CG-RBC membrane model parameters for the prediction of echinocytosis, and discuss the deformability and morphology changes of RBCs during in-vitro storage. This study provides valuable predictions of the influence of storage lesion on RBC quality and viability, and is currently being executed to investigate the recoverability of deformability and morphology changes of RBCs undergoing storage lesion.

2. Methods

The storage lesion-induced changes in RBC morphology, membrane mechanical properties and cell geometry were implemented on a CG-RBC membrane model [76] to predict the analogous echinocytosis process during in-vitro storage. In the first step, the correlations of storage time-dependent evolution of cell morphology index, shear modulus and bending modulus of the membrane, and cell surface area and volume were determined based on analogous experimental observations (i.e., the data presented in Figures 3, 4 and 5 of Kozlova et al. [8], Figure 4a of Park et al. [47] and based on the data extracted from 3D confocal microscopy imaging of RBCs during in-vitro storage by D. Santangelo (D. Santangelo, personal communication, 10 October 2018)). In the second step, the corresponding RBC morphologies were numerically predicted through the CG-RBC membrane model to investigate the deformability and morphology characteristics of RBCs during in-vitro storage.

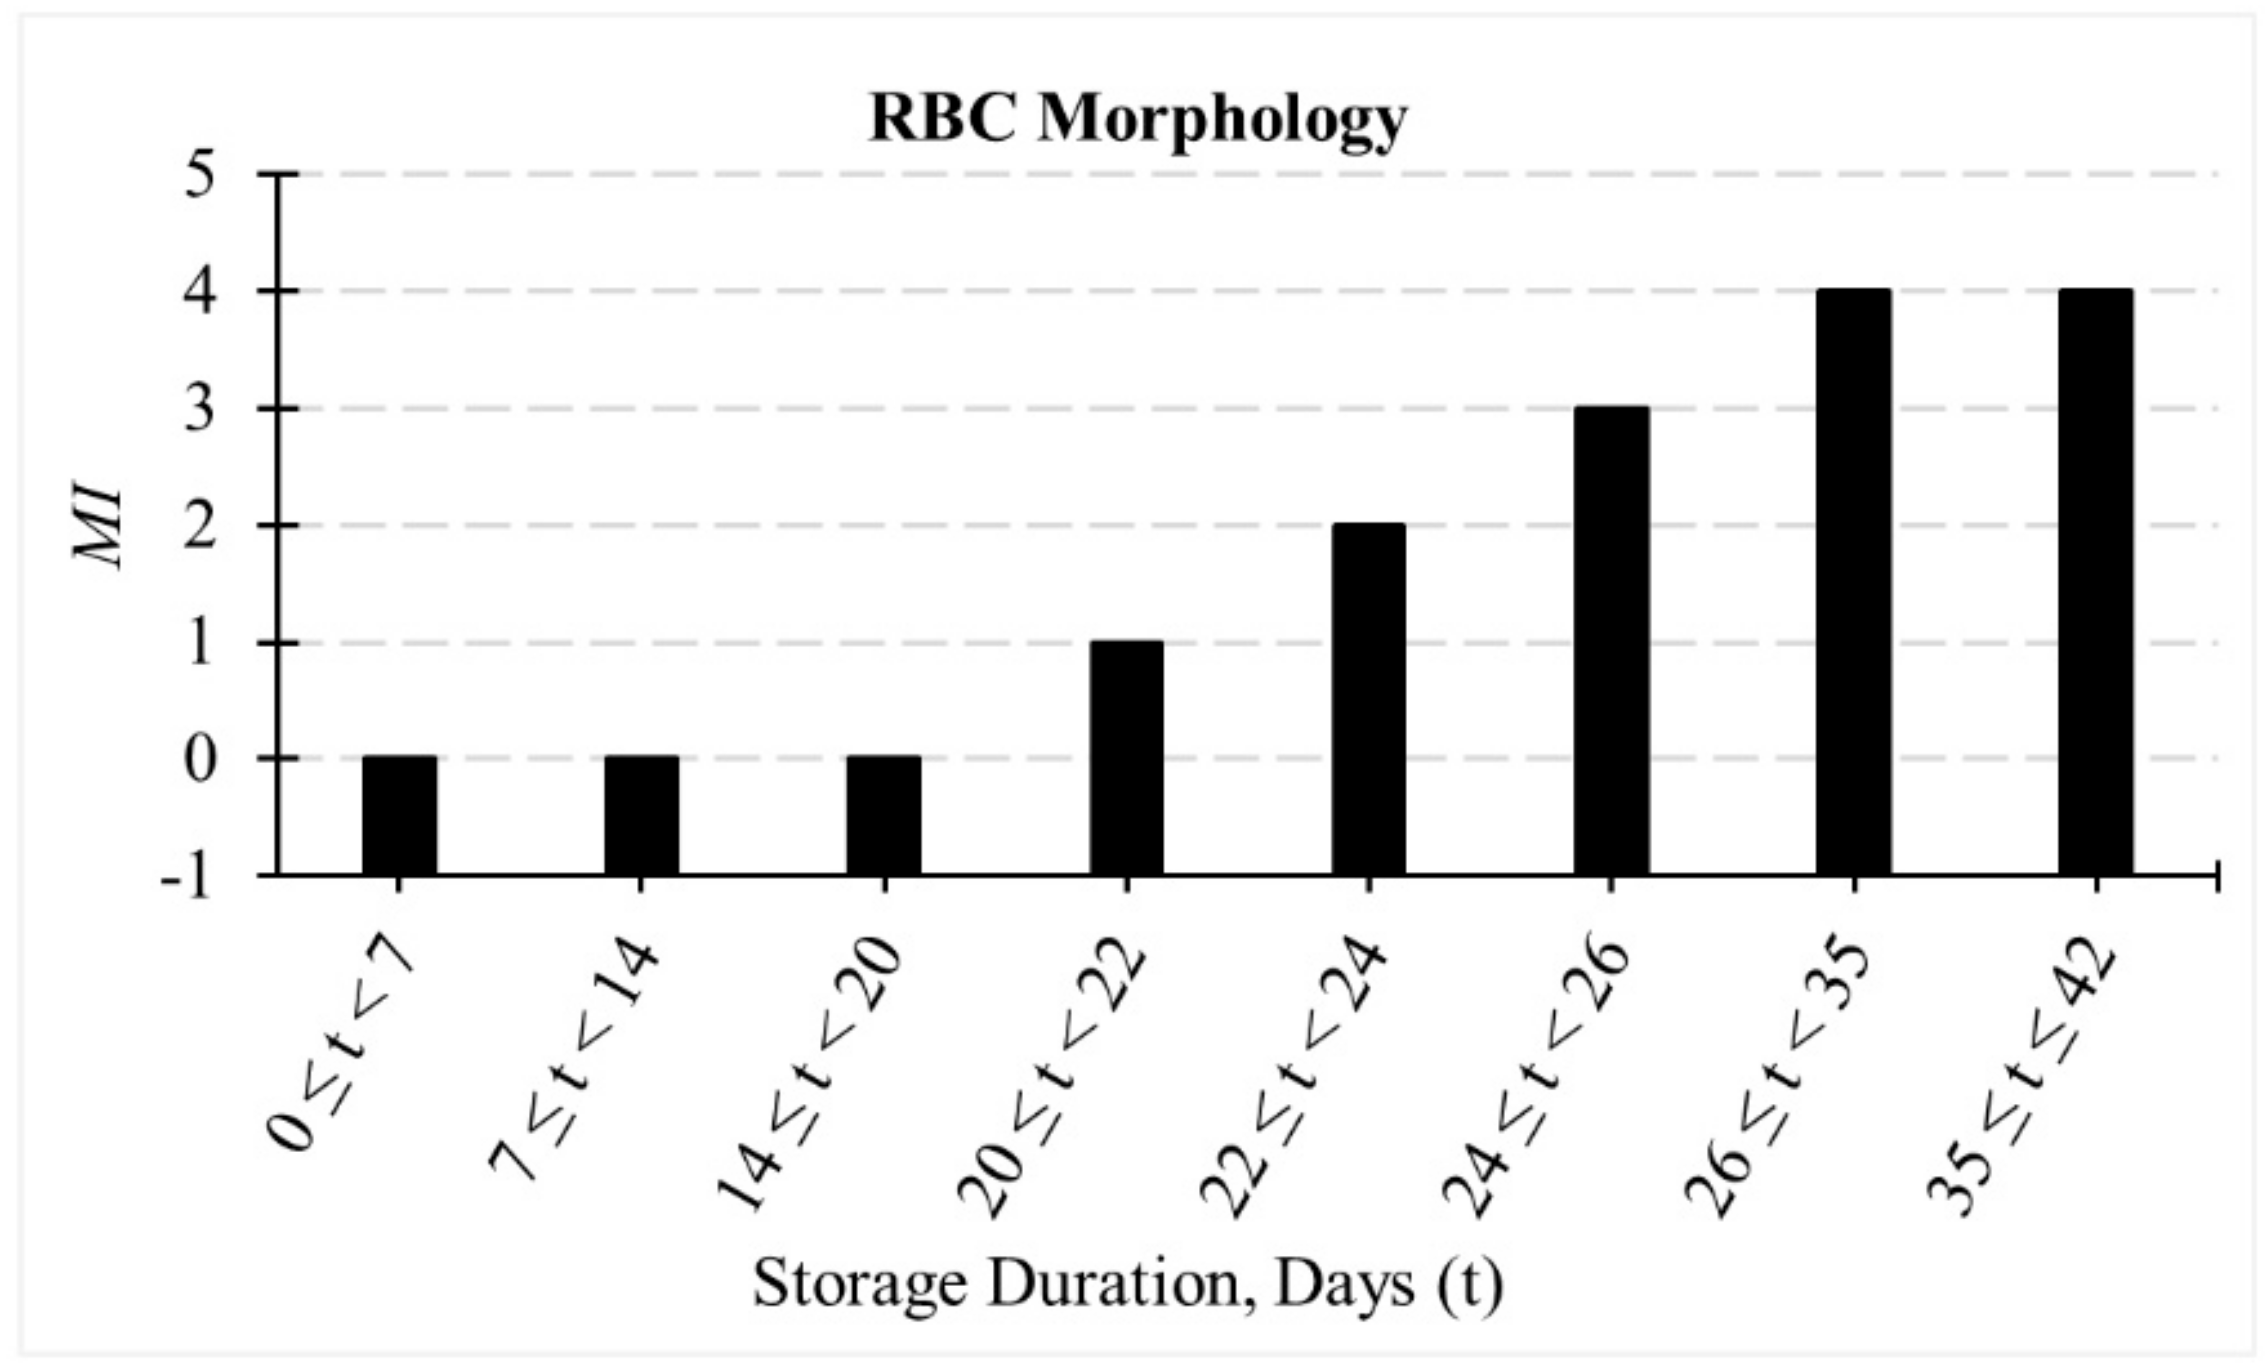
2.1. Evolution of RBC Morphology during In-Vitro Storage

In this section, the storage time-dependent evolution of RBC morphology index ( M I ) is determined for the numerical modelling of RBC echinocytosis during in-vitro storage. M I is based on the Bessis’s classification [75,77], and is 0 for the biconcave discocyte; +1 for the echinocyte I (a flattened or elongated cell with several undulations around its rim); +2 for the echinocyte II (a flattened elliptical cell with rounded spicules distributed more or less uniformly over its surface); +3 for the echinocyte III (an ovoid or spherical cell with sharper and more numerous spicules distributed evenly over its surface); and +4 for the sphero-echinocyte (a spherical cell with small sharp projections still attached to its surface).
Figure 1 summarizes the evolution of RBC morphology during in-vitro storage and was determined based on the experimental observations by Kozlova et al. [8]. It can be observed (refer to Figures 4 and 5 of Kozlova et al. [8]) that five main forms of RBC morphologies arise during in-vitro storage, which are discocyte, echinocyte, sphero-echinocyte, dacrocyte and swelled cells, which are in the form of spheres and ovals. However, only the evolution of discocyte, echinocyte and sphero-echinocyte cells were considered for the present study as these are the main forms of RBC morphologies observed during storage [3,20,21]. The lack of information on the evolution of dacrocytes and swelled cells during in-vitro storage makes it difficult to identify their contribution to the RBC morphology and deformability changes during storage and their recoverability. It can be observed that the major fraction of RBCs up to 20 days of in-vitro storage is composed of discocytes, whereas the major fraction of RBCs from 26 days of storage is composed of sphero-echinocytes. Discocyte RBCs follow the morphology transformation of discocyte → echinocyte I → echinocyte II → echinocyte III → sphero-echinocyte during days 20 to 25, and this period can be considered as the transition period of RBC morphology. The periods of echinocyte I, echinocyte II and echinocyte III morphologies are estimated based on the assumption that the transformation of discocyte to sphero-echinocyte takes place at a steady rate during the transition period. The corresponding RBC morphology in terms of M I as a function of in-vitro storage duration ( t ), is presented in Figure 1.

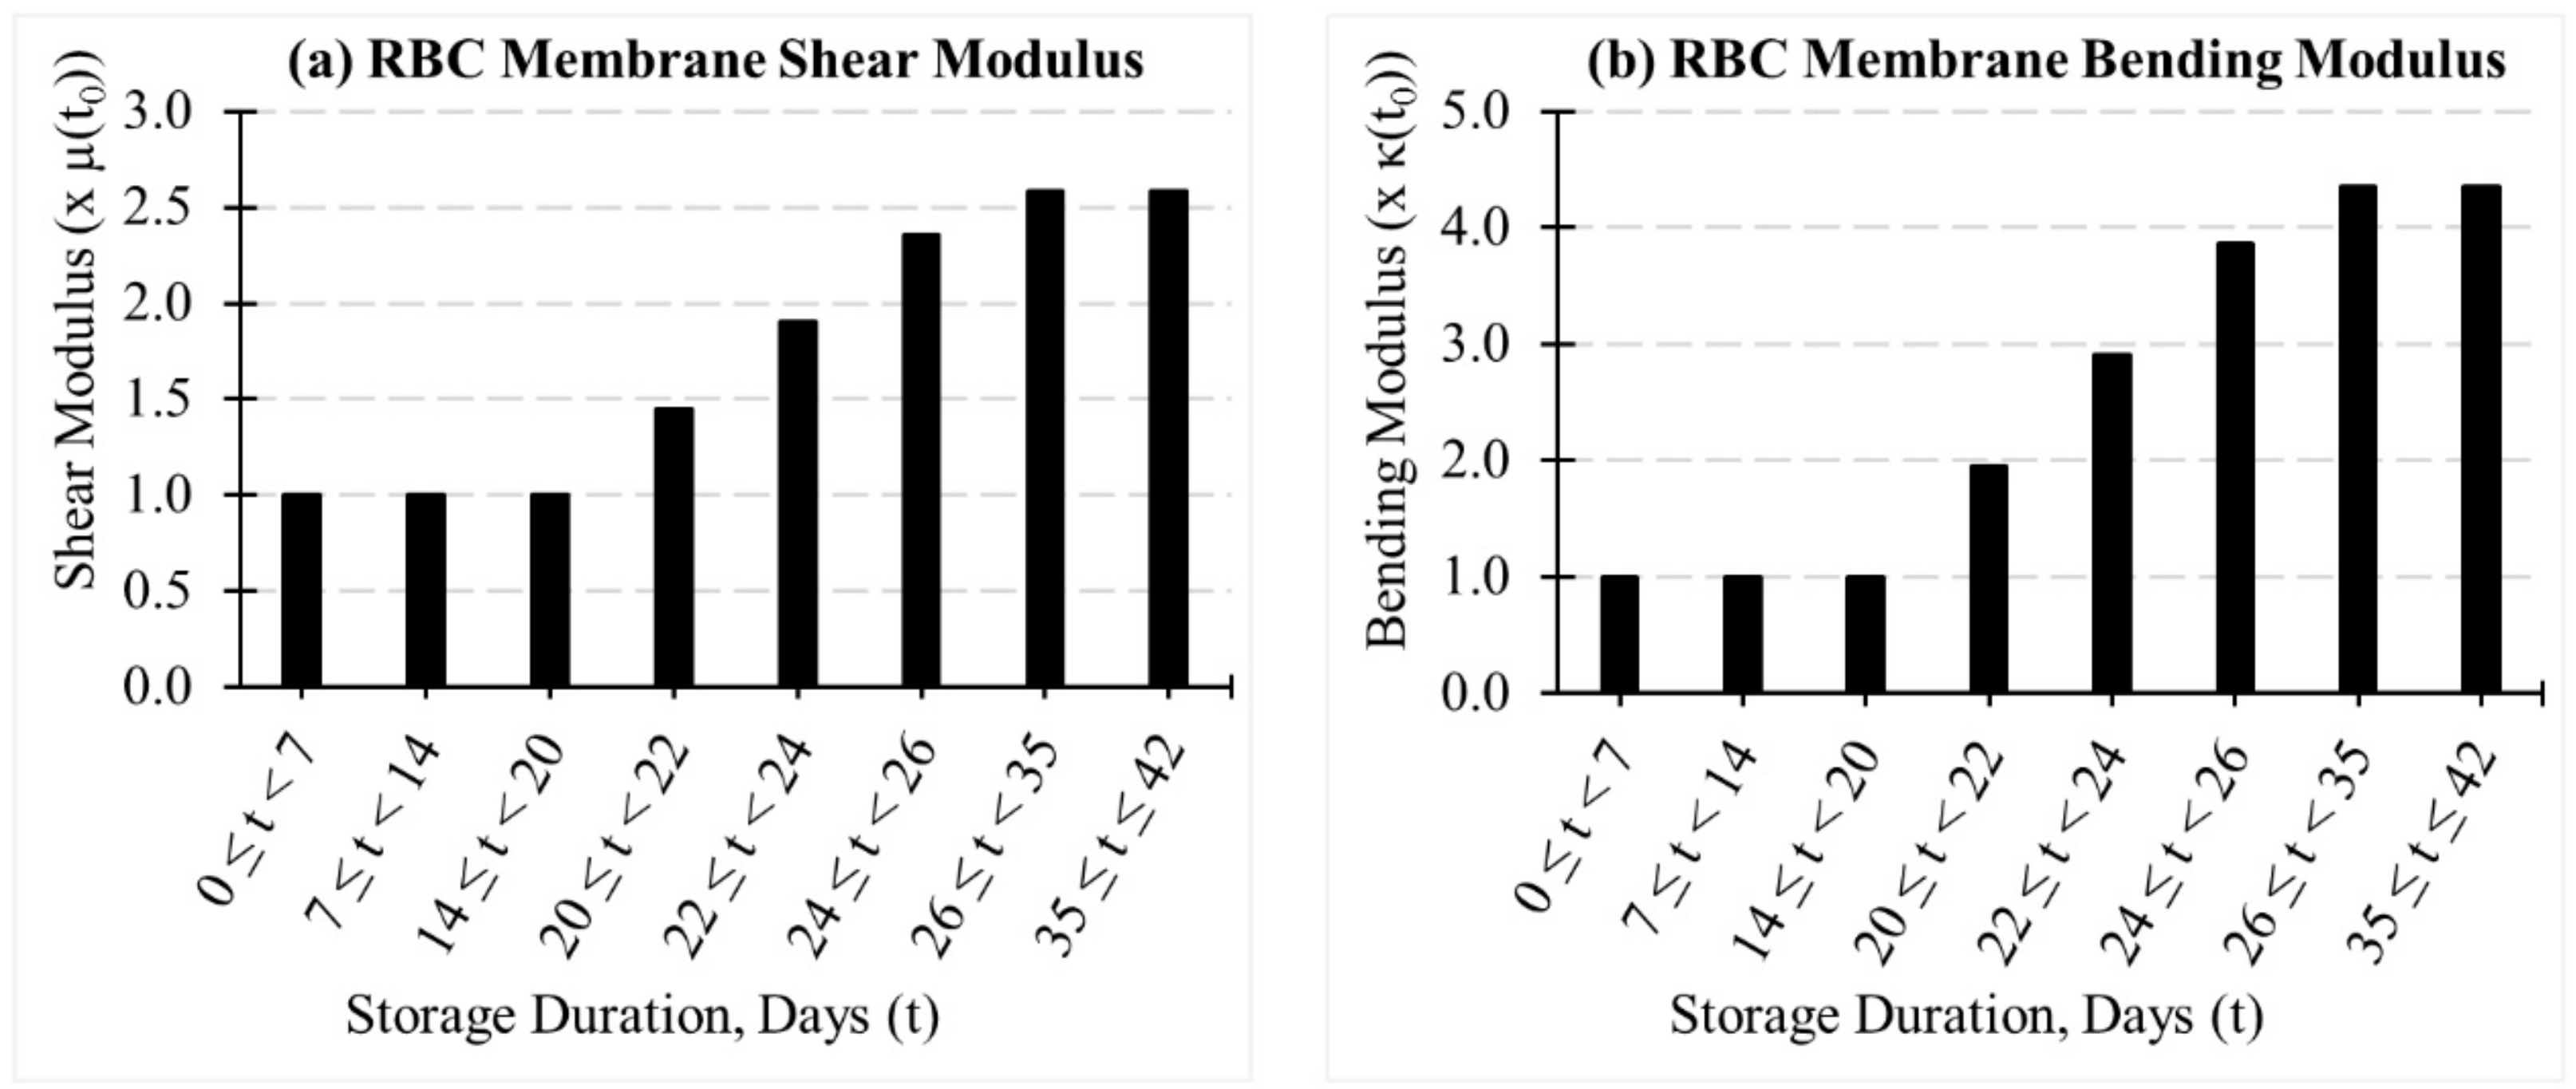
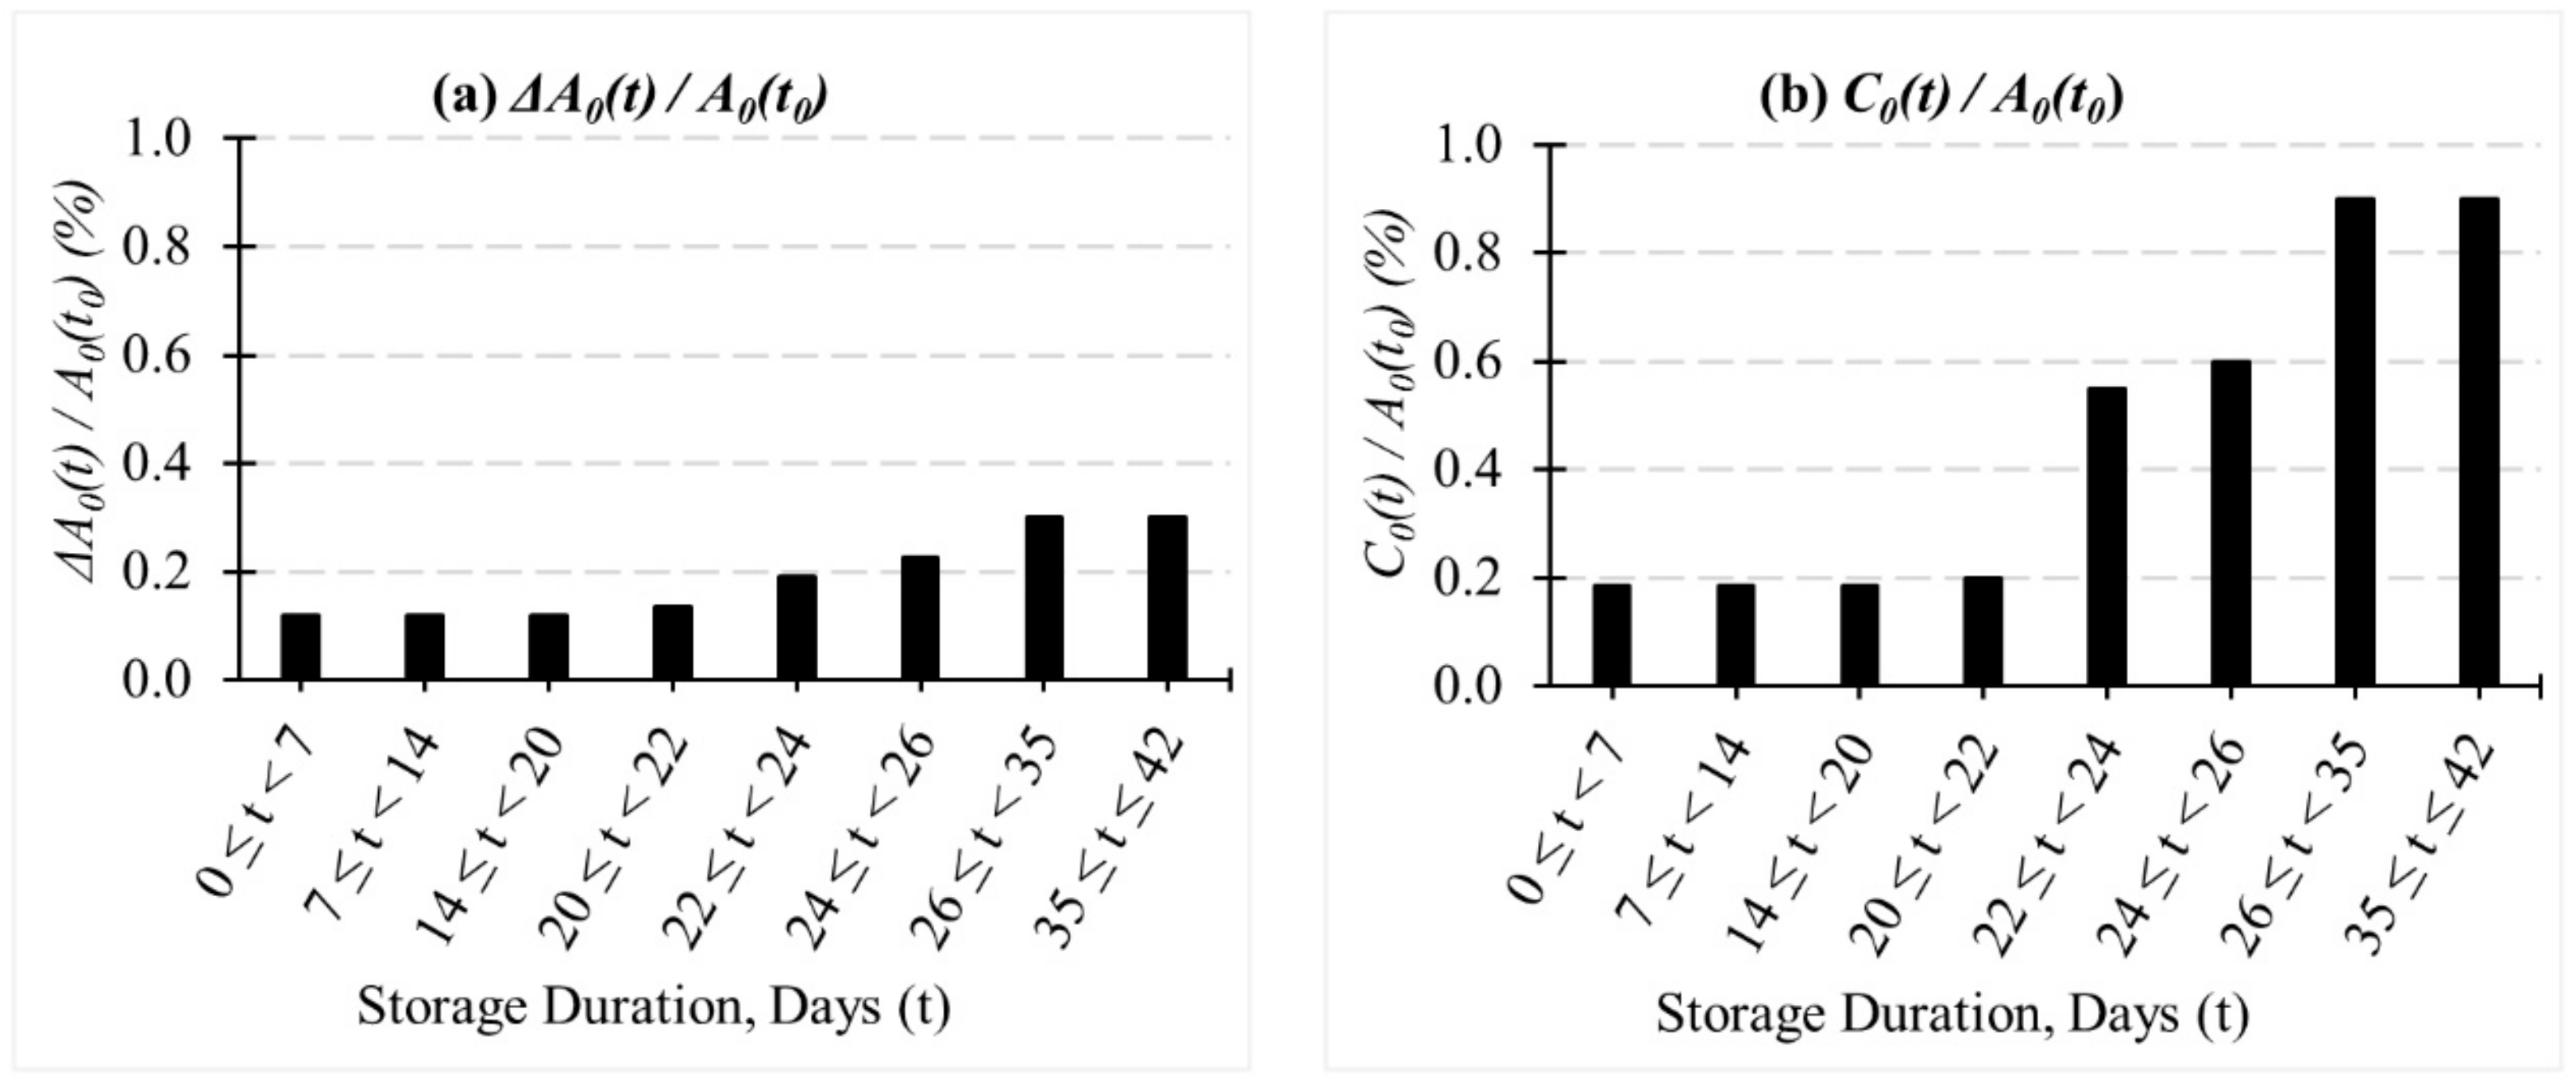
2.2. Evolution of Coarse-Grained (CG)-RBC Membrane Model Parameters during In-Vitro Storage

The CG-RBC membrane model is composed of a triangular surface of N t triangles representing N V cytoskeletal actin junctions and N S spectrin links. The model predicts the minimum free energy state of the RBC membrane, which is the equilibrium RBC morphology at the given reference conditions (e.g., cell surface area ( A 0 ), cell volume ( V 0 ), reference bilayer-leaflet-area-difference ( Δ A 0 ) and reference total-membrane-curvature ( C 0 )). The CG-RBC membrane model is briefly reviewed in Appendix A: CG-RBC Membrane Model, whereas detailed description and discussion on the model development and shape predictions of the discocyte, echinocyte I, echinocyte II, echinocyte III and sphero-echinocyte, are available in Geekiyanage et al. [76]. Geekiyanage et al. [76] presents the numerical predictions of stomatocyte-discocyte-echinocyte morphology transformations of a healthy RBC under stomatocytogenic and echinocytogenic shape-transforming conditions, and the corresponding model parameters and constraint coefficients for discocyte, echinocyte I, echinocyte II, echinocyte III and sphero-echinocyte morphologies are summarised in Appendix B: Prediction of Discocyte, Echinocyte I, Echinocyte II, Echinocyte III and Sphero-Echinocyte RBC Morphologies.
The CG-RBC membrane model requires appropriate adjustments to compensate for the evolution of RBCs during in-vitro storage. Therefore, the numerical evolution of the membrane shear modulus ( μ t ), bending modulus ( κ t ), cell surface area ( A 0 t ), cell volume ( V 0 t ), reference bilayer-leaflet-area-difference ( Δ A 0 t ) and reference total-membrane-curvature ( C 0 t ), is determined as a function of in-vitro storage time. The CG-RBC membrane model parameters mentioned in Appendix B: Prediction of Discocyte, Echinocyte I, Echinocyte II, Echinocyte III and Sphero-Echinocyte RBC Morphologies, were adopted as the analogous RBC properties at day 0 of in-vitro storage, and the corresponding membrane shear modulus ( μ t 0 ), bending modulus ( κ t 0 ), cell surface area ( A 0 t 0 ), and cell volume ( V 0 t 0 ) were established accordingly.
The evolution of the CG-RBC membrane μ t and κ t during in-vitro storage is presented in the Figure 2a and Figure 2b, respectively. The estimation of μ t is based on the experimentally observed evolution of RBC membrane Young’s modulus by Kozlova et al. [8], and it is assumed that the evolution of Young’s modulus during in-vitro storage is comparable to that of the membrane shear modulus. Young’s modulus is one of the key indicators of cell membrane mechanical integrity, and thereby the cell stiffness [8]. However, the storage lesion affects the Young’s modulus. It can be observed (refer to Figure 3 of Kozlova et al. [8]) that the Young’s modulus of RBC membranes is approximately constant up to 20 days of in-vitro storage, and increases rapidly during days 20 to 25, where it remains approximately constant during the period of days 26 to 42. This behaviour is comparable with the evolution of RBC morphology during in-vitro storage. The evolution of μ t was determined in agreement with the outline of the evolution of RBC membrane Young’s modulus, and is presented in Figure 2a, where the evolution of μ t during storage was assumed to be directly proportional to that of the Young’s modulus (i.e., Young’s modulus   μ ). It can be observed that μ t increases rapidly during the transition period, and reaches a value which is nearly 2.6 times higher than μ t 0 . These observations agree with available experimental results [18,38]. The μ t corresponding to echinocyte I, echinocyte II and echinocyte III during the transition period was determined through linear interpolation of μ t .
Similarly, the evolution of κ t was determined based on the measurements of RBC membrane mechanics by Park et al. [47]. It can be observed (refer to Figure 4a of Park et al. [47]) that the spherocyte morphology has the highest membrane bending modulus, whereas the echinocyte has an intermediate membrane bending modulus. The evolution of κ t was determined in agreement with these observations such that the measured membrane bending modulus of the discocyte [47] is comparable with a κ t of up to 20 days of in-vitro storage (i.e., bending modulus of the discocyte   κ t ; 0 t < 20) and the measured membrane bending modulus of the spherocyte [47] is comparable with a κ t from day 26 of in-vitro storage (i.e., bending modulus of the spherocyte   κ t ; 26 t   42). The κ t corresponding to echinocyte I, echinocyte II and echinocyte III during the transition period was determined through linear interpolation of κ t . The evolution of κ t during in-vitro storage is presented in Figure 2b.
The cell surface area is an important property of RBCs as the exchange of oxygen and carbon dioxide takes place at the cell surface. A higher cell surface area is required for improved gas exchange in the lungs and body tissues [78]. However, RBCs lose their cell membrane during cell aging, and the cell becomes smaller and denser during storage [38]. The evolution of A 0 t and V 0 t was determined based on the data extracted from 3D confocal microscopy imaging of RBCs during in-vitro storage (D. Santangelo, personal communication, 10 October 2018). The RBC surface area and volume measurements for the discocyte, echinocyte I, echinocyte II and echinocyte III cell morphologies corresponding to three donors during 42 days of in-vitro storage in SAGM additive solution are presented in Appendix C: Measurements of Cell Surface Area and Volume of RBC during In-Vitro Storage—Experimental Observations. Figure 3 represents the general evolution of cell surface area and volume during in-vitro storage. The loss of membrane surface area and volume results in an increased concentration of micro-particles in the extracellular additive solution, and a notable increase of micro-particle concentration is observed from day 28 onwards [9,20,79]. In agreement with these observations, the evolution of cell surface area and cell volume was considered for two in-vitro storage durations such that 0   t   < 28 and 28   t   42, and the expressions as in Equations (1) and (2) respectively, were established to reflect this evolution. The coefficients of Equations (1) and (2) are estimated based on the linear regression relationships between storage duration (i.e., dependent variable) and cell surface area and volume (i.e., independent variable) for the two in-vitro storage durations (i.e., 0   t   < 28 and 28   t   42). The local surface area of the RBC membrane was assumed to follow the evolution of A 0 t , and the reference area of the k t h triangle of the CG-RBC membrane model ( A k , 0 t ) was estimated according to Equation (3). A k , 0 t 0 is the reference area of the k t h triangle at day 0, and is adopted from Appendix B: Prediction of Discocyte, Echinocyte I, Echinocyte II, Echinocyte III and Sphero-Echinocyte RBC Morphologies.
A 0 t = 0.4232   t + A 0 t 0 A 0 t 0 0     t < 28 0.7907   t + 1.08   A 0 t 0 A 0 t 0 28     t     42
V 0 t = 0.3585   t + V 0 t 0 V 0 t 0 0     t < 28 0.8111   t + 1.13   V 0 t 0 V 0 t 0 28     t     42
A k , 0 t = 0.4232   t + A k , 0 t 0 A k , 0 t 0 0     t < 28 0.7907   t + 1.08   A k , 0 t 0 A k , 0 t 0 28     t     42
The evolution of Δ A 0 t and C 0 t during in-vitro storage was assumed to be equivalent to that of the CG-RBC membrane model-predicted discocyte, echinocyte I, echinocyte II, echinocyte III and sphero-echinocyte morphologies (refer to Appendix B: Prediction of Discocyte, Echinocyte I, Echinocyte II, Echinocyte III and Sphero-Echinocyte RBC Morphologies), and the corresponding Δ A 0 t and C 0 t are summarised in Figure 4. It can be observed that Δ A 0 t and C 0 t increase quickly during days 20 to 25 in agreement with the discocyte → echinocyte I → echinocyte II → echinocyte III → sphero-echinocyte morphology transformation.
These storage-time-dependent model parameters were developed based on the limited available experimental data from RBC concentrates that are collected, processed and stored under varied conditions. However, considering these effects as well as any influence of the donor characteristics and heterogeneity of the RBC population can strengthen the computational approach and improve the numerical predictions. In addition, the availability of a fundamental computational approach facilitates more specific experimental data to be obtained at a larger scale to carry out more statistical and stochastic modelling.

2.3. CG-RBC Membrane Model-Predicted RBC Morphologies during In-Vitro Storage

The in-vitro storage effects were implemented on a CG-RBC membrane model to predict the analogous RBC time-dependent echinocytosis process. Identical model parameters and constraint coefficients as in Appendix B: Prediction of Discocyte, Echinocyte I, Echinocyte II, Echinocyte III and Sphero-Echinocyte RBC Morphologies, except for μ t , κ t , A 0 t , A k , 0 t , V 0 t , Δ A 0 t and C 0 t , were adopted to predict the RBC morphology at t (Days) = 0, 7, 14, 21, 23, 25, 28, 35 and 42. The RBC morphology at the above time points during in-vitro storage was predicted as the stable minimum energy configuration at equivalent reference conditions, and is presented in Table 1. The numerically predicted RBC morphologies at day t qualitatively agree well with both the corresponding morphology characteristics given by Bessis’s classification [75,77] and with the corresponding experimental observations [54,74,75,76] for discocyte, echinocyte I, echinocyte II, echinocyte III and sphero-echinocyte morphologies. It can be observed that the thickness of the biconcavity of the discocyte morphology increases with t , and the cell diameter reduces in response to the increased reduced cell volume at t . In addition, the discocyte cell shape at t = 7 (Days) and t = 14 (Days) indicate uneven cell thickness on its rim, and the echinocyte I at t = 21 (Days) has uneven undulations around its rim. The loss of RBC membrane surface area during in-vitro storage induces increased levels of stress on cytoskeletal spectrin links, and this may affect the equilibrium cell state and morphology at t . Moreover, the cytoskeletal reference state is predicted at an equivalent membrane shear modulus ( μ t 0 ), membrane bending modulus ( κ t 0 ), membrane surface area ( A 0 t 0 ) and cell volume ( V 0 t 0 ) of a healthy RBC at t = 0. Therefore, the cytoskeleton is subjected to increased lateral compression due to the loss of membrane surface area during storage. These changes during in-vitro storage may have influenced the predicted RBC morphology at t .

3. Results and Discussion

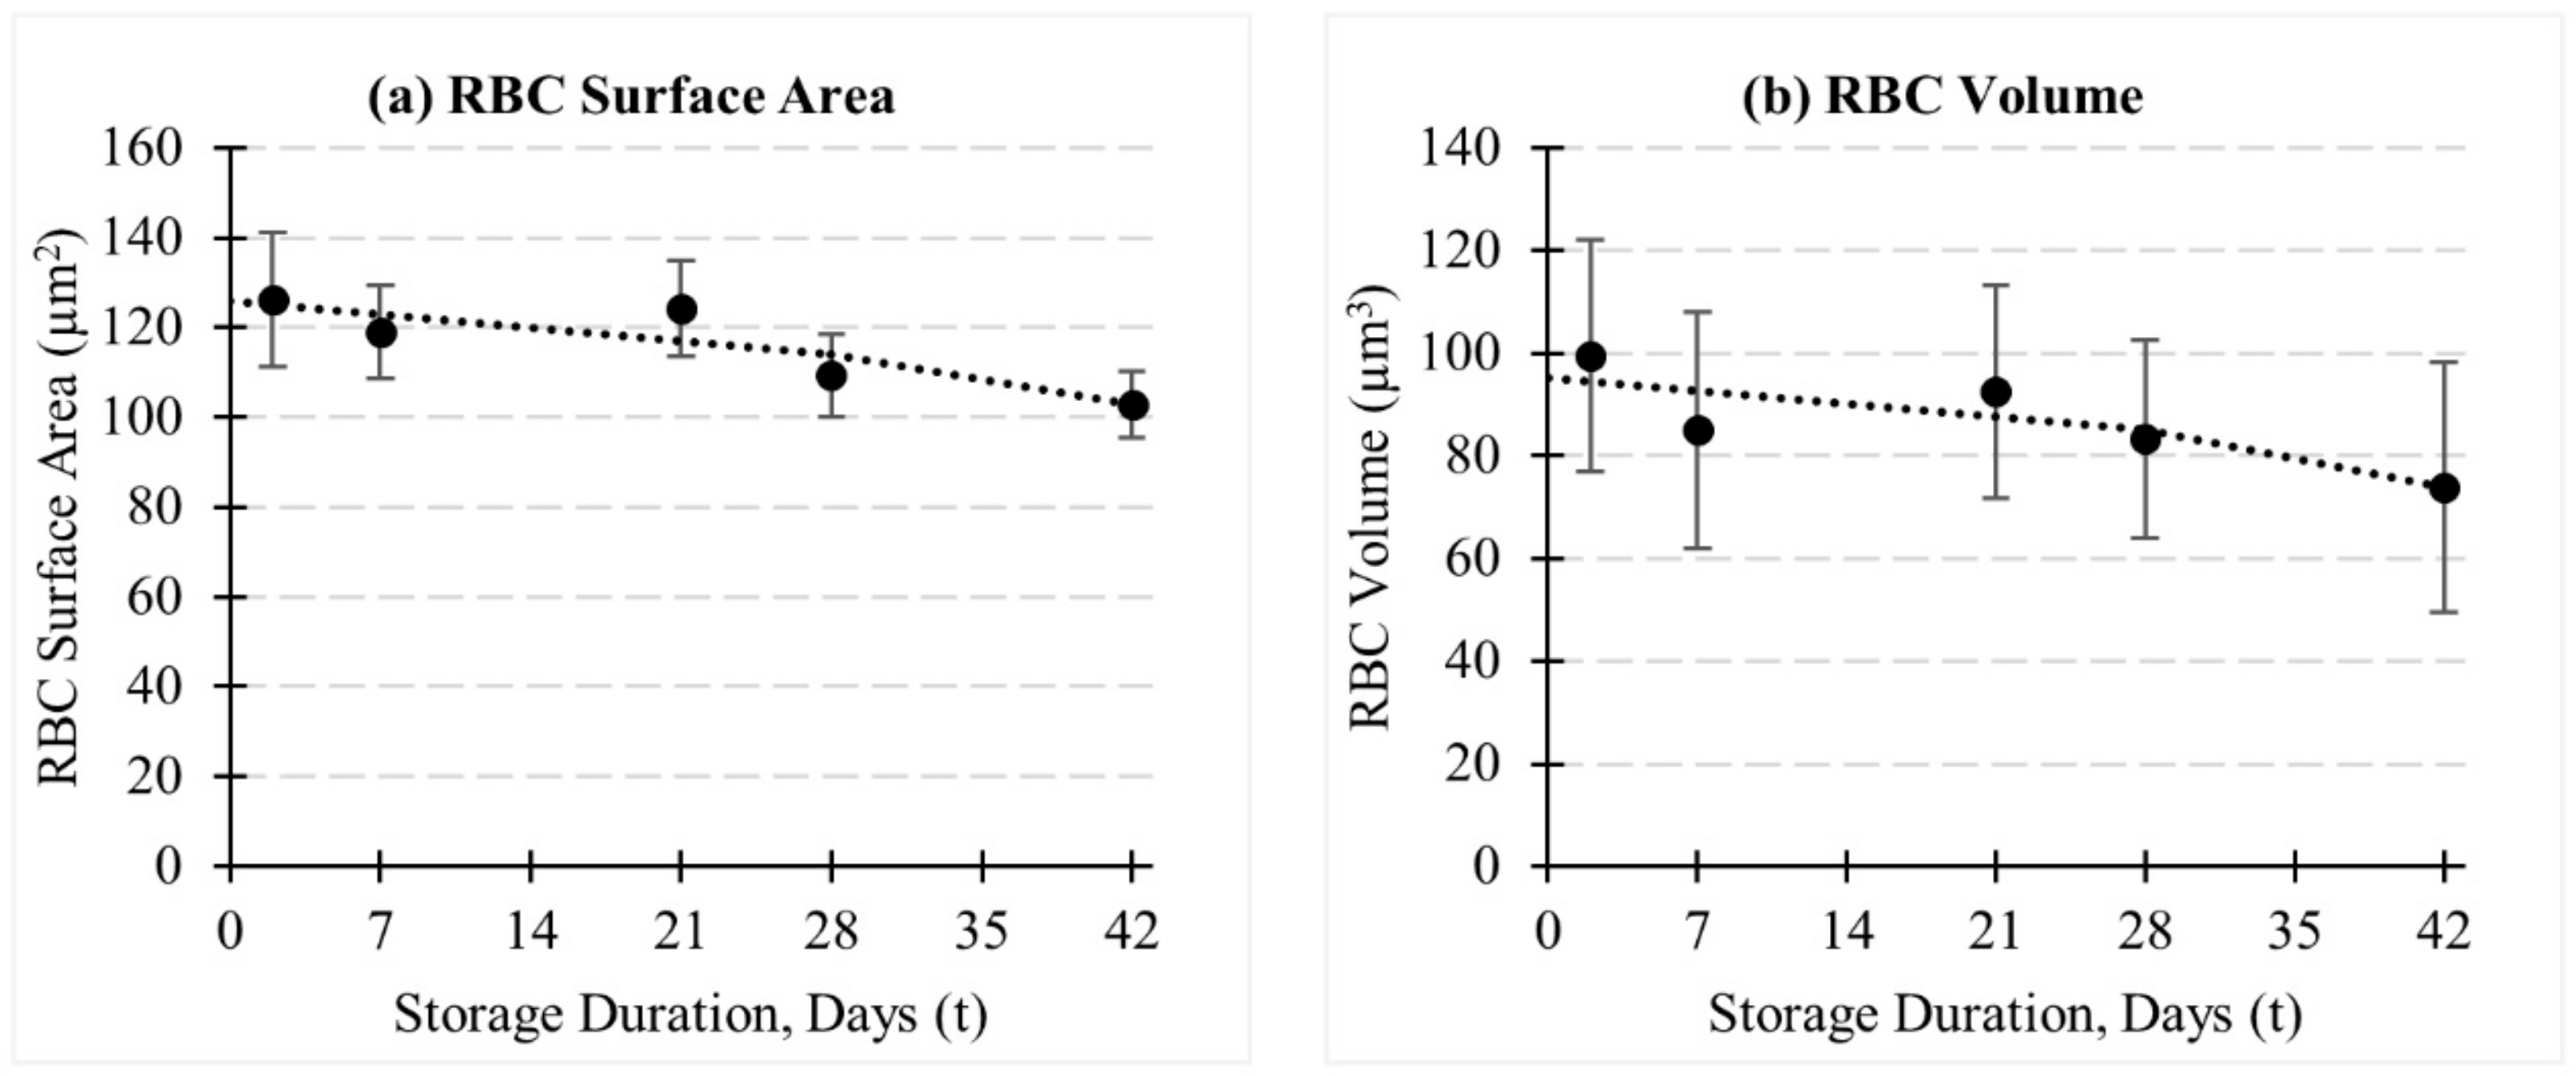
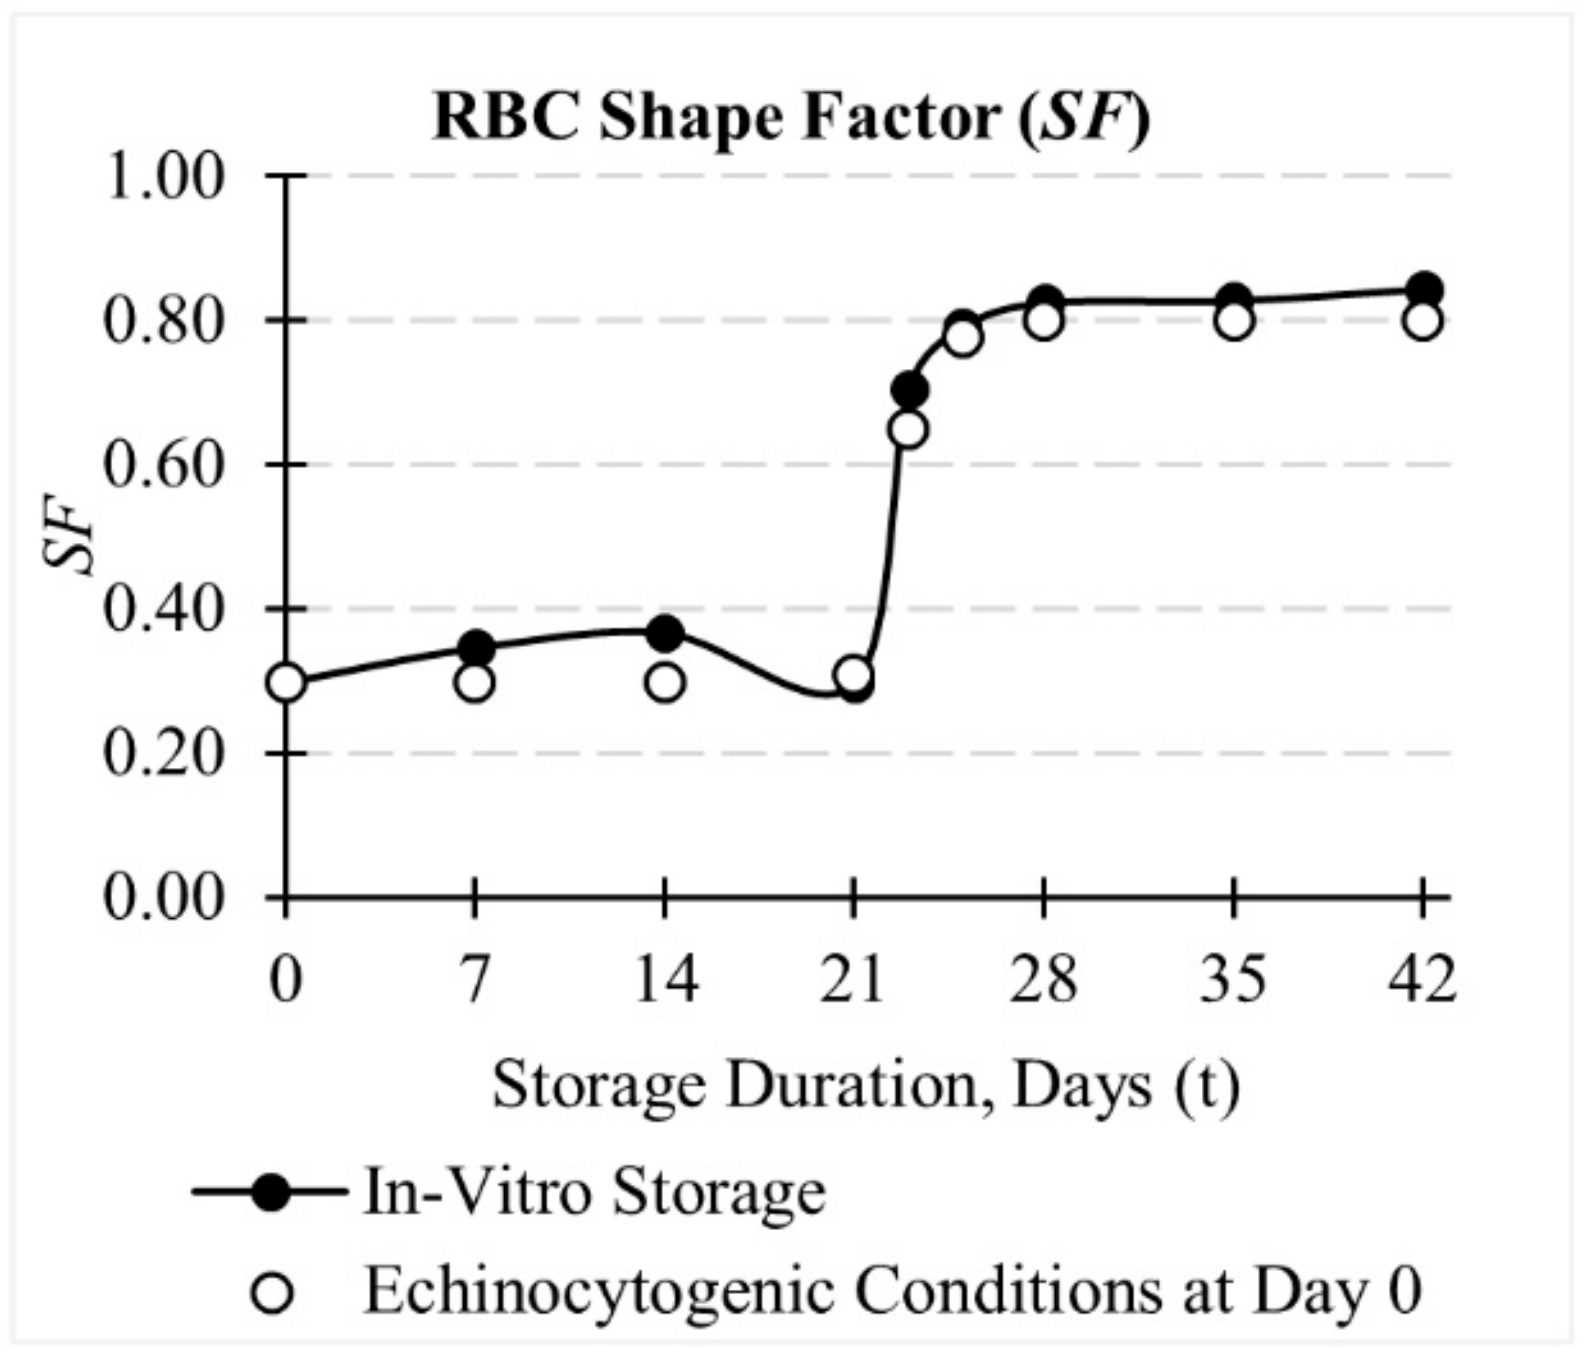
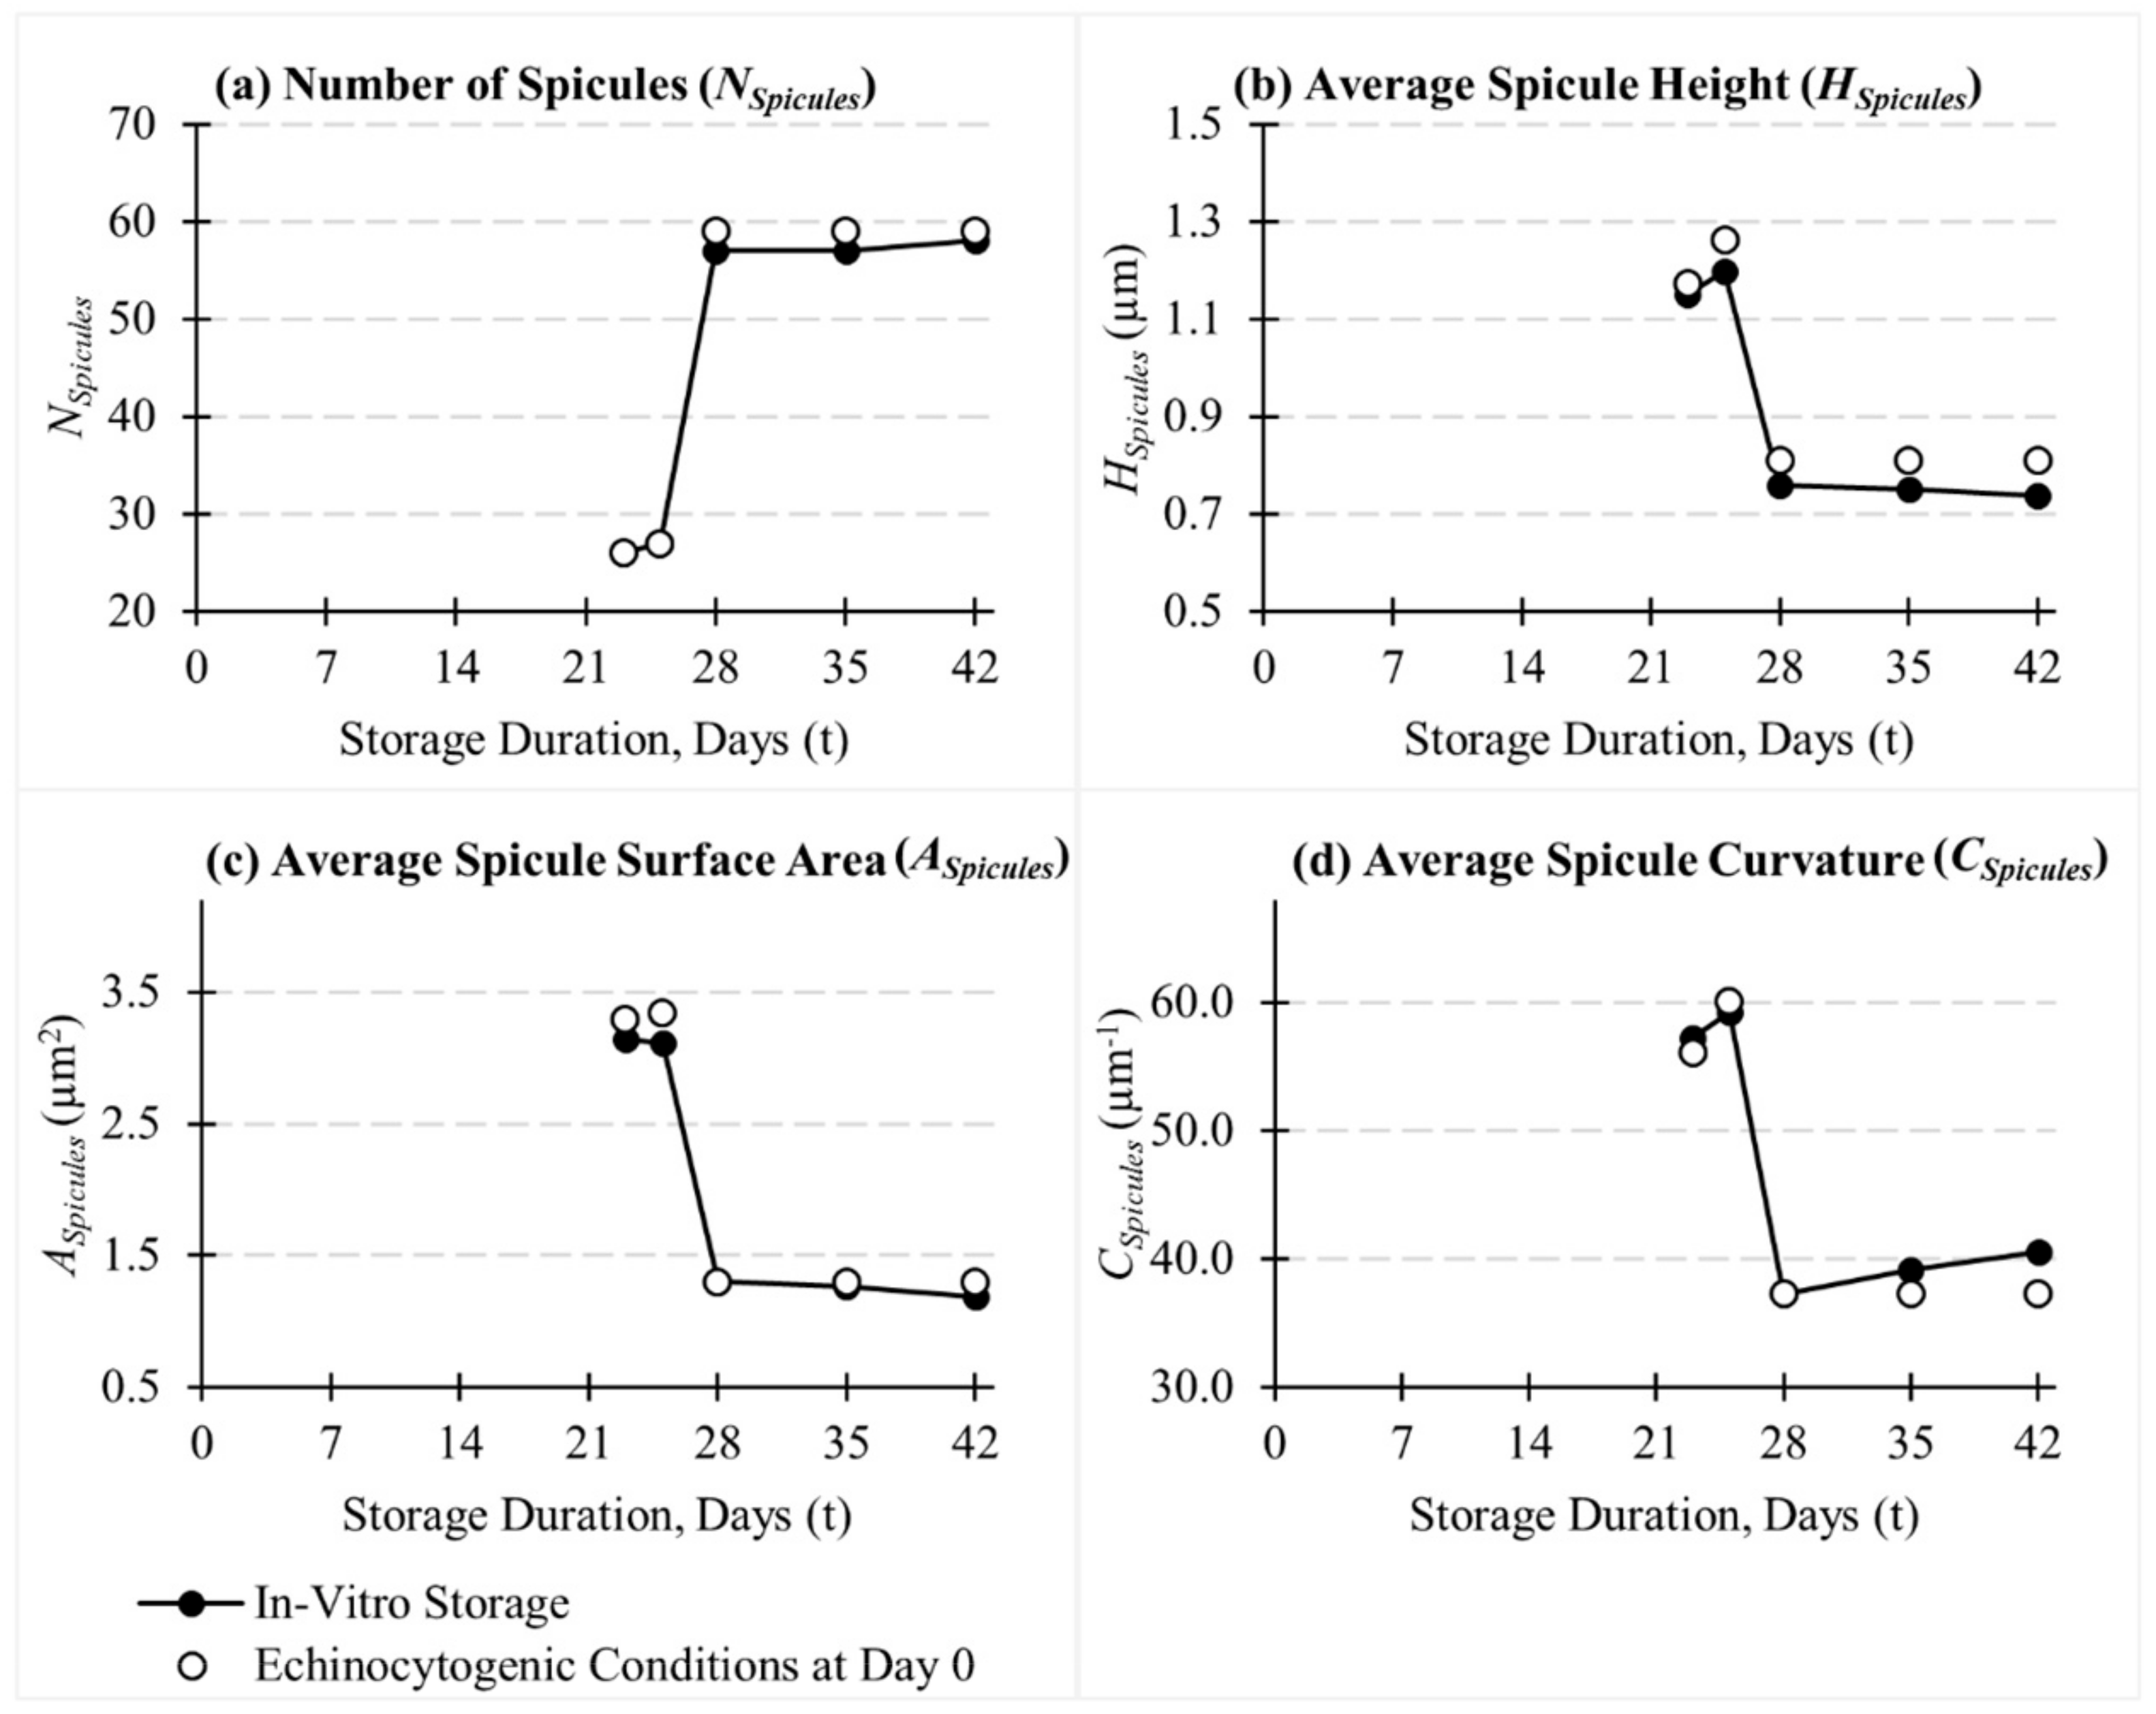
3.1. Evolution of RBC Morphology Characteristics during In-Vitro Storage

The functionality of a RBC is linked with its cell geometry. The evolution of cell dimensions (i.e., cell length, cell diameter and cell thickness) with respect to in-vitro storage effects can be described through the cell shape factor ( S F ) [76]. The cell is assumed to be a rigid body having uniform density, and the centre of mass of the whole cell and its three-principal axes of inertia are determined for each numerically predicted cell shape at t (Days) = 0, 7, 14, 21, 23, 25, 28, 35 and 42. H 1 , H 2 and H 3 are defined as the distance between the furthest vertex points on the RBC membrane surface along the three-principal axes of inertia of the cell such that H 1     H 2     H 3 . S F is given by S F = H 1   / H 2 × H 3 [76,80], and indicates the sphericity of the cell. The cell becomes more and more spherical as S F reaches the value 1, and becomes a more and more flattened disc as S F reaches 0. S F at t (Days) = 0, 7, 14, 21, 23, 25, 28, 35 and 42 was estimated and is presented in Figure 5. The S F of stored RBCs gradually increases at 0   t < 20 and at 26   t   42, whereas a sudden increment of S F was observed at 20   t < 26. The evolution of S F is comparable to the evolution of cell morphology, μ t and κ t during storage (refer to Figure 1 and Figure 2), and can be attributed primarily to the evolution of cell morphology as μ t and κ t are influenced by the cell morphology as well [8,47].
It is important to distinguish the morphology characteristics of stored RBCs against other pathophysiological conditions where similar morphologies are observed, for better diagnostic purposes. Each shape-transformation scenario might affect the cell details differently. Therefore, Figure 5 also compares the morphology characteristics of storage lesion-produced discocyte, echinocyte I, echinocyte II, echinocyte III and sphero-echinocyte RBC morphologies against that of echinocytogenic shape-transforming conditions (e.g., amphipaths, extracellular ionic strength and pH) produced RBC morphologies. The CG-RBC membrane model [76] is capable of predicting RBC morphologies under varying shape-transformation scenarios, and Geekiyanage et al. [76] discussed the morphology characteristics of discocyte, echinocyte I, echinocyte II, echinocyte III and sphero-echinocyte morphologies of a healthy RBC at t = 0 (Days), which were obtained via echinocytogenic shape-transforming conditions. The echinocytogenic shape-transforming conditions transform the biconcave discocyte shape into echinocyte forms at constant cell surface area and volume [48,49,50,51,52,53,54]. S F values of discocyte, echinocyte I, echinocyte II, echinocyte III and sphero-echinocyte RBC morphologies obtained via the echinocytic shape-transforming condition (from Geekiyanage et al. [76]) are presented in Figure 5 at t where analogous morphology was observed during storage.
The dependency of cell S F on its morphology was confirmed by the similar behaviour of S F values for the two considered shape-transforming scenarios; in-vitro storage and echinocytogenic condition. Overall, S F of stored RBCs is higher than that of echinocytogenic conditions-produced RBCs, which shows the influence of the loss of membrane surface area and cell volume during storage. The cell surface area and volume of the stored RBC gradually decreases during storage, whereas the morphological changes in the presence of echinocytogenic conditions take place at constant cell surface area and volume. However, the S F of echinocyte I morphology at t = 21 (Days) is comparable to that of echinocyte I morphology obtained by echinocytogenic conditions. This discrepancy can be attributed to the cell details of the echinocyte I morphology obtained at these two shape-transforming scenarios. The echinocyte I at t = 21 (Days) has uneven undulation around its rim, whereas the echinocytogenic conditions produced echinocyte I has even undulations around its rim. This can influence S F estimation. In general, the evolution of S F of RBCs under both these shape-transforming scenarios indicate the rise of cell sphericity leading to lowered cell deformability [76]. These results agree with the experimentally observed deformability changes of RBCs [26,78], and indicate the potential of S F as a quality measure of stored RBCs.
At latter stages of in-vitro storage, the spicules on sphero-echinocyte RBC morphology form membrane budding and detach from the cell such that the spherocyte is formed. The progression of sphero-echinocyte to spherocyte is characterized by shortened spicules such that complete spheres are formed [77,81]. The S F of a spherocyte is 1.0 and indicates the null deformability of the RBC, and it is important to predict and understand the progression of spherocyte formation during storage. The evolution of membrane spicules of echinocyte II, echinocyte III and sphero-echinocyte was therefore investigated to study the progression of a RBC towards a spherocyte during storage. Number of spicules ( N S p i c u l e s ), average spicule height ( H S p i c u l e s ), average spicule surface area ( A S p i c u l e s ) and average spicule curvature ( C S p i c u l e s ) of echinocyte II, echinocyte III and sphero-echinocyte at 22   t   42 were studied and compared against that of the echinocytogenic conditions-produced echinocyte forms (refer to Figure 6). H S p i c u l e s of the spiculated cells was estimated as follows;
H S p i c u l e s = 1 N S p i c u l e s × k k = 1 N S p i c u l e s r k k , m a x r k k , m i n
where r k k , m a x is the distance to the membrane vertex on the spicule that has the maximum C V , i from the centroid of the cell, whereas r k k , m i n is the distance to the membrane vertex on the spicule that has the minimum C V , i from the centroid of the cell. C V , i is the membrane curvature at i t h membrane vertex (refer to Equation (5)), and the maximum C V , i is given by the membrane vertex at the peak of the spicule, whereas the minimum C V , i is given by the membrane vertex at the foot of the spicule. A S p i c u l e s of the spiculated cells was estimated according to Equation (6);
C V , i = j j = 1 N V T , i M j j Δ A j j
A S p i c u l e s = 1 N S p i c u l e s × i = 1 N V j j = 1 N V T , i Δ A j j , C V , i > 0 0 , C V , i     0
where N V is the number of membrane vertices, N V T , i is the number of neighbouring triangles to which the i t h vertex is attached to, and M j j and Δ A j j are the membrane curvature and the membrane surface area at the triangle-pair that shares the j j t h triangle edge, respectively. In general, C V , i > 0 occurs on the spicule surface, whereas C V , i     0 occurs at the valleys between the membrane spicules. Similarly, C S p i c u l e s of the spiculated cells was estimated according to Equation (7).
C S p i c u l e s = 1 N S p i c u l e s × i = 1 N V C V , i , C V , i > 0     0 , C V , i     0
It can be observed (refer to Figure 6) that the number of spicules on echinocyte II and echinocyte III are similar for both shape-transforming scenarios. However, the number of spicules on the sphero-echinocyte at t (Days) = 28, 35 and 42 is less than the number of spicules on the sphero-echinocyte achieved under echinocytogenic conditions, and increases with the storage duration. This indicates the higher sensitivity of sphero-echinocyte morphology on μ t , κ t , A 0 t , A k , 0 t , and V 0 t than the echinocyte II and echinocyte III morphologies. In particular, the loss of membrane surface area and cell volume during storage constraints the formation of spicules on the cell surface. In general, H S p i c u l e s and A S p i c u l e s of stored RBCs are lower and decrease with the storage duration. This demonstrates the smaller size of membrane spicules of stored RBCs than that of echinocytogenic shape-transforming conditions-produced RBC shapes, and the spicule size decreases with the storage duration. Similarly, C S p i c u l e s of stored RBCs is higher and increases with the storage duration. The gradual decrement of spicule size and increment of spicule curvature of stored RBCs together indicate the progression of membrane vesiculation during in-vitro storage, which leads the cell towards spherocyte formation. In particular, the rapid increment of C S p i c u l e s of sphero-echinocytes during 26   t   42 confirms the increased potential for spherocyte formation during this period. ATP depletion during storage adversely affects the structural integrity of the cytoskeleton, and the membrane vesiculation contributes to removal of defective membrane patches from the cell [26,82] such that the spherocyte is formed. The present CG-RBC membrane model treats the RBC membrane as a single constituent, and the probable detachment of the lipid-bilayer from the underlying cytoskeleton for membrane vesiculation cannot be observed. However, the model can be extended to consider the remodelling of the cell membrane under membrane vesiculation.

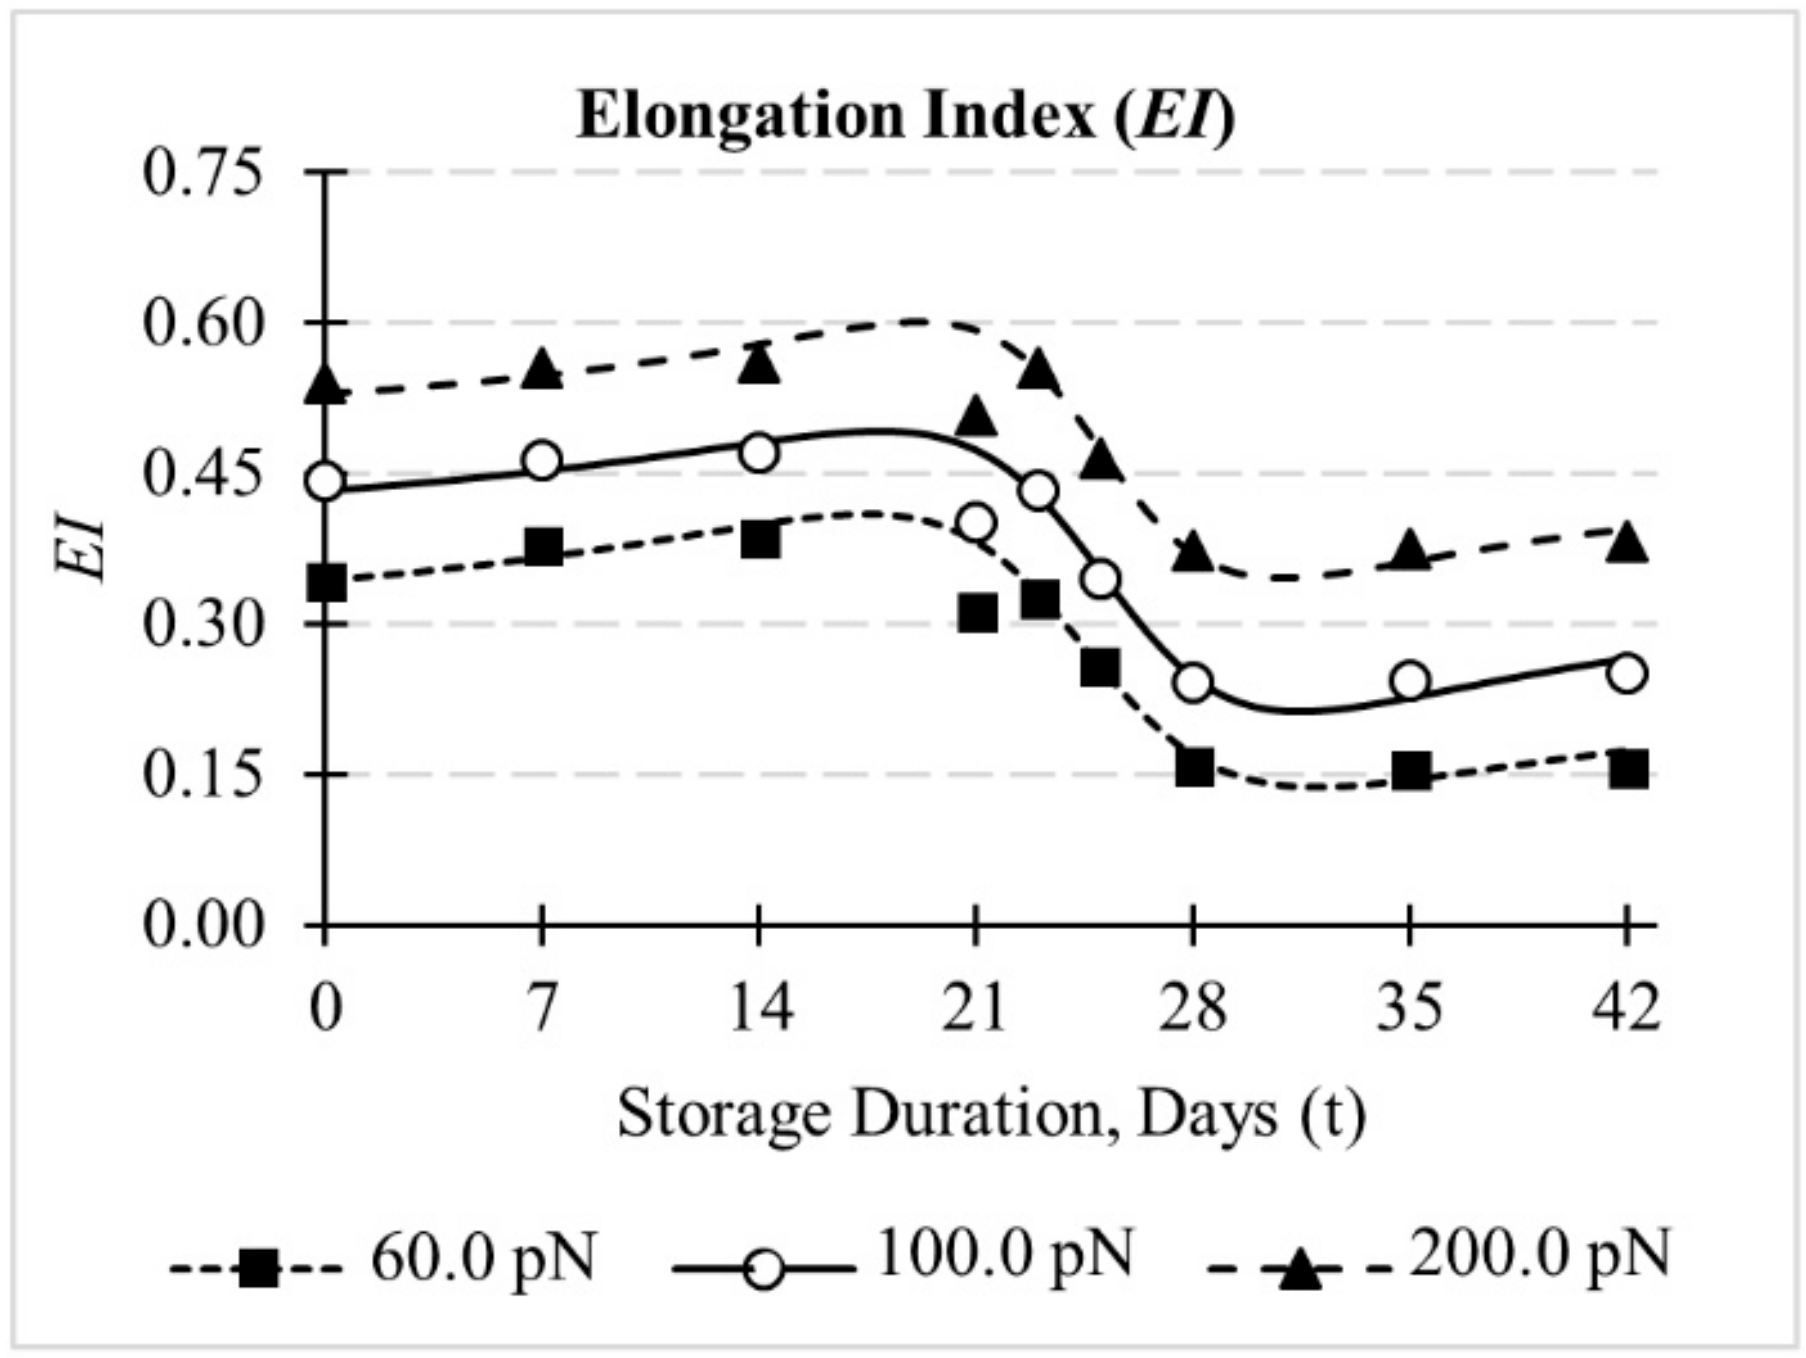
3.2. Evolution of Deformation Behaviour of RBCs during In-Vitro Storage

The evolution of deformation behaviour of stored RBCs was investigated for CG-RBC membrane model-predicted RBC echinocytosis. RBC deformability is a measure of cell viability, and gradually decreases with storage duration [29,83,84]. The optical tweezers stretching forces were applied on the discocyte, echinocyte I, echinocyte II, echinocyte III and sphero-echinocyte morphologies at t (Days) = 0, 7, 14, 21, 23, 25, 28, 35 and 42, and the evolution of cell deformability in terms of elongation index ( E I ) during storage was determined. E I was estimated at the equilibrium cell stretched state based on axial ( D A ) and transverse ( D T ) diameters of the stretched cell [30,62], such that E I = D A D T / D A + D T . The methods of implementation of optical tweezers stretching forces on the RBC and the estimation of E I are discussed in Appendix D: Implementation of Optical Tweezers Stretching. The effect on E I of the discocyte and echinocyte cells at echinocytogenic conditions undergoing optical tweezers stretching at varying membrane shear modulus, spectrin link extensibility, membrane bending modulus and d RBC membrane–bead contact diameter, is discussed in Geekiyanage et al. [85]. The evolution of E I of stored RBCs at the total stretching forces of F e x t = 60, 100 and 200 pN are presented in Figure 7.
The E I of each RBC morphology increases with the increase of F e x t , and reduces with the storage duration. The E I of day 42 sphero-echinocyte is significantly lower than that of the day 0 discocyte; 54.44% at F e x t = 60 pN, 43.39% at F e x t = 100 pN, and 29.19% at F e x t = 200 pN. Therefore, the stored RBCs demonstrate significantly lower deformability especially at low F e x t . A rapid decrement in E I can be observed during the transition period (20   t   < 26), and demonstrates the reducing cell deformability with respect to its morphology transformation. These results indicate that the RBC deformability remained unaltered during 0   t   < 20, and RBCs become difficult to elongate when stored for longer periods and when morphology transformations occur. These observations are consistent with available analogous observations as well [9,17,26,38]. The deformation behaviour of RBCs undergoing optical tweezers stretching is primarily due to the cytoskeletal stretching characteristics [86,87], and therefore the evolution of E I is primarily lead by cytoskeletal stretching characteristics (i.e., membrane shear modulus ( μ ) and maximum extensibility of spectrin links ( x 0 )). The gap between E I values at t decreases with increasing F e x t , and can be attributed to the influence of x 0 such that the stretchability of the cell is inhibited at higher F e x t . The E I of echinocyte I morphology at t = 21 (Days) indicates a lower E I in comparison to the predicted general E I evolution during storage. The definition of E I becomes less suitable for irregular shapes [26], and therefore this observation may result from the uneven undulations on the rim of echinocyte I cells at t = 21 (Days). A slight increment in E I was observed between similar morphologies with respect to the storage duration; for the discocyte morphology at t (Days) = 0, 7 and 14, and also for the sphero-echinocyte morphology at t (Days) = 28, 35 and 42. The evolution of μ t and κ t during storage is comparable with the morphology transition (refer to Section 2). Therefore, the discocyte morphology at 0   t   < 20 has a similar μ t and κ t , and the sphero-echinocyte morphology at 26   t   < 42 has a similar μ t and κ t as well. However, the cell surface area and volume gradually decrease throughout the storage. Therefore, the observed increment of E I for the similar morphology can be attributed to the loss of cell surface area and volume. The results indicate that the stored RBCs have acceptable deformability during 0   t   < 24 up to echinocyte II morphology. However, echinocyte III and sphero-echinocyte morphologies during 24   t   42 have degraded deformability, and contribute to poor quality and viability of RBCs at prolonged storage.

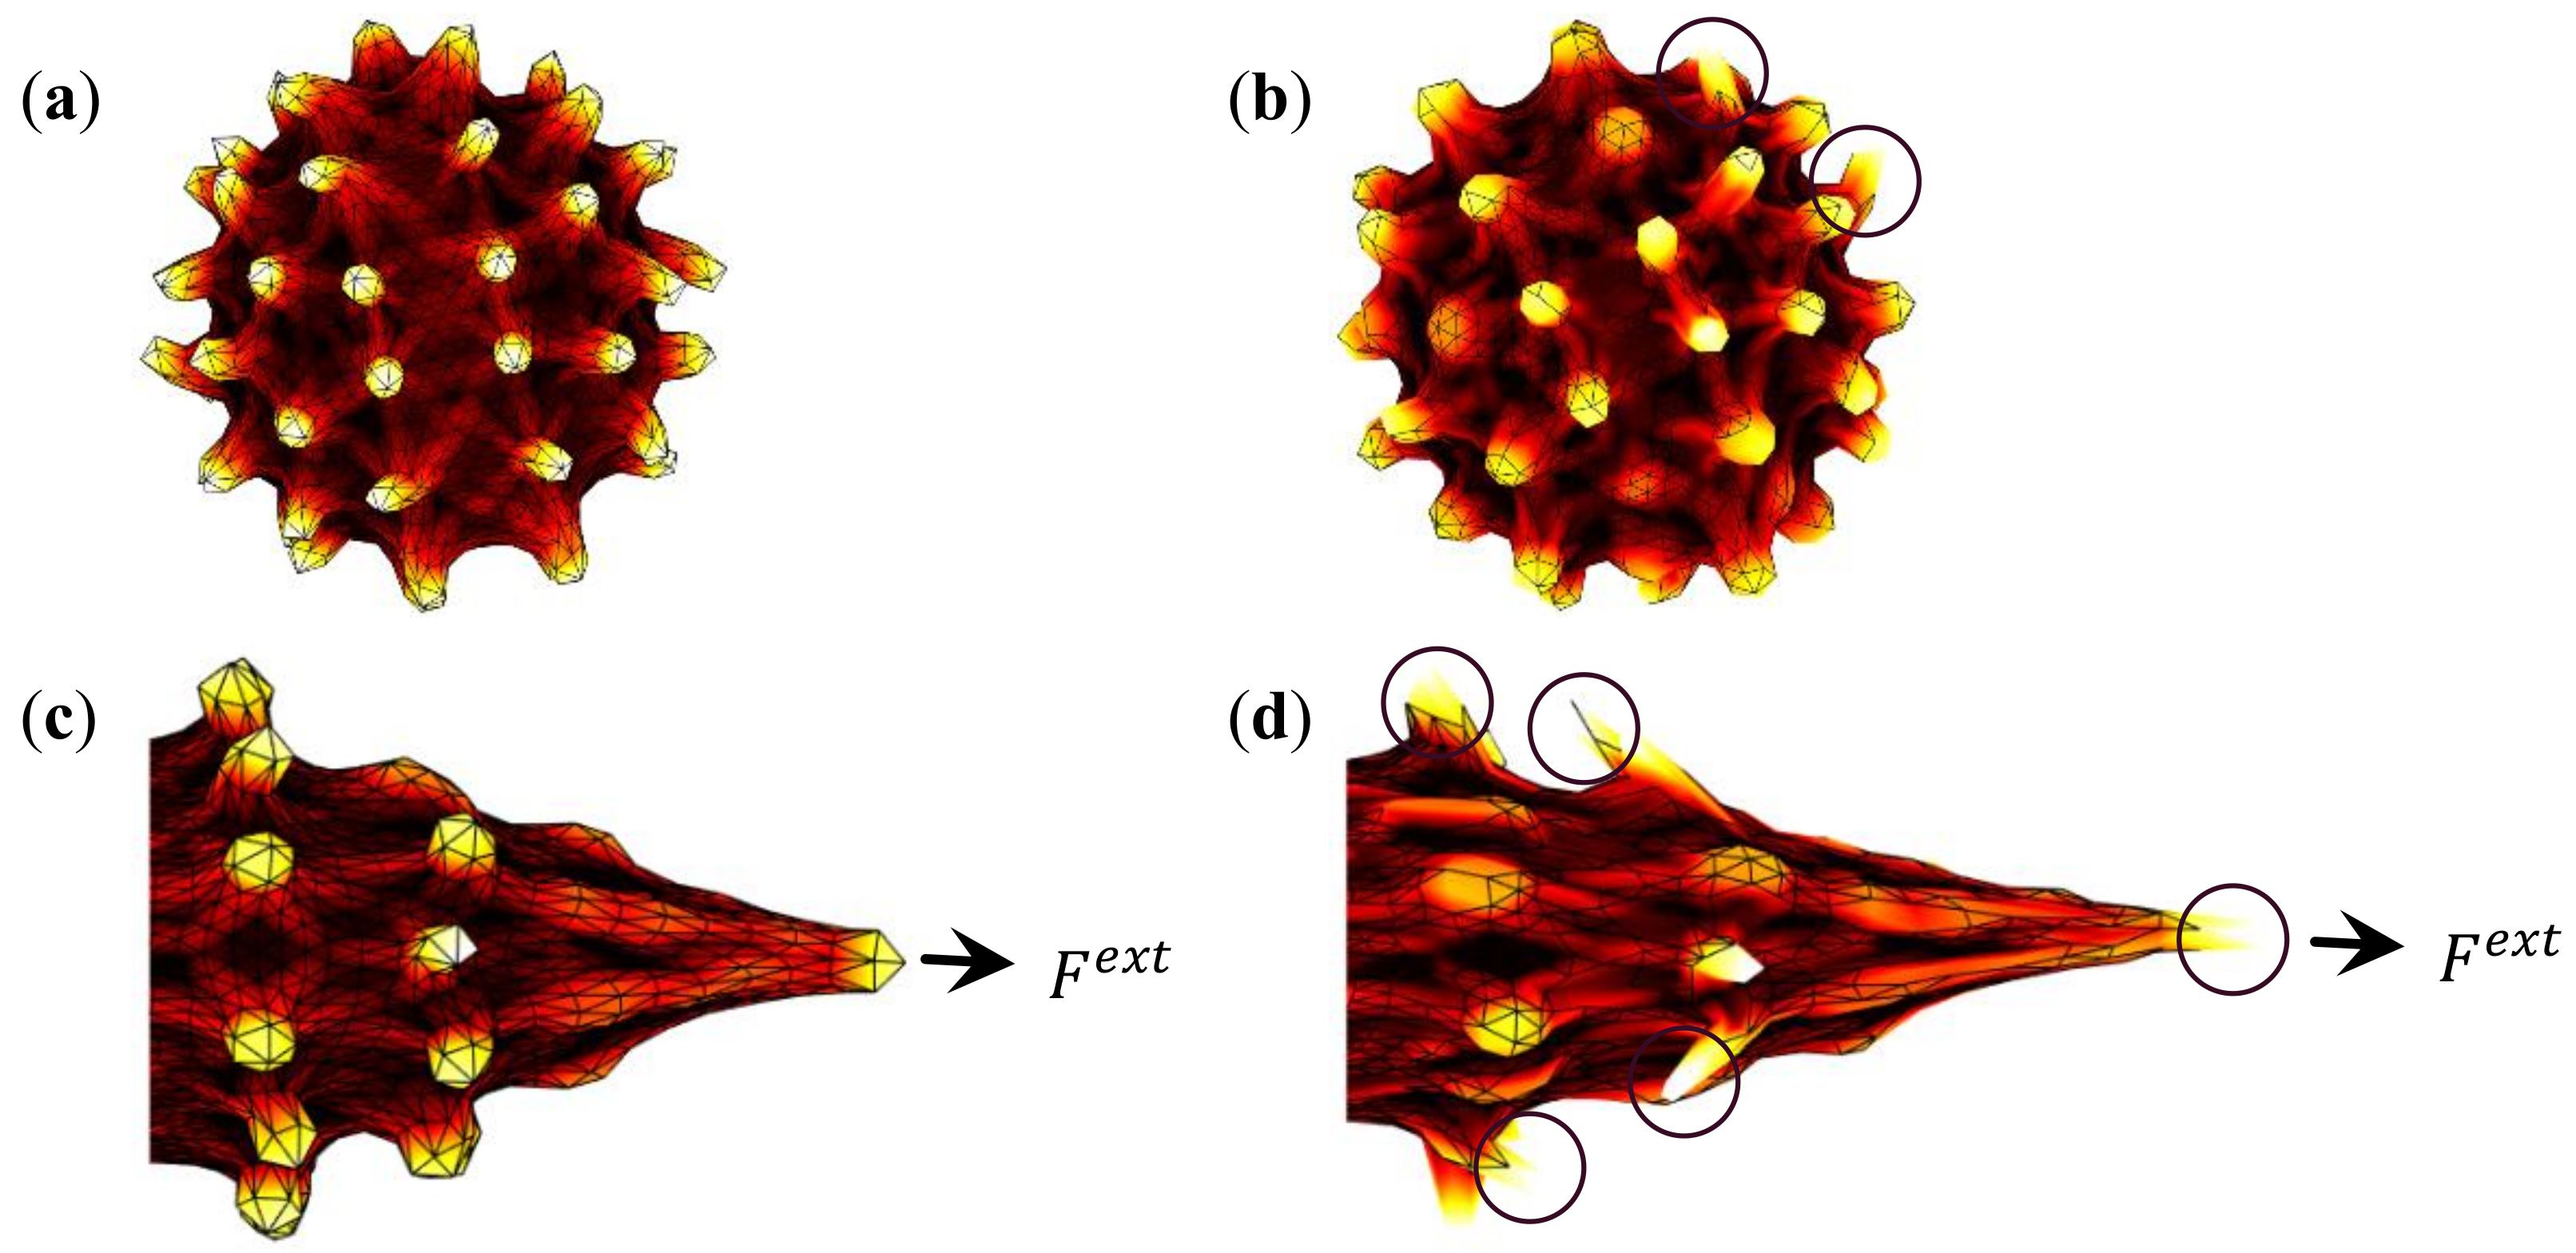
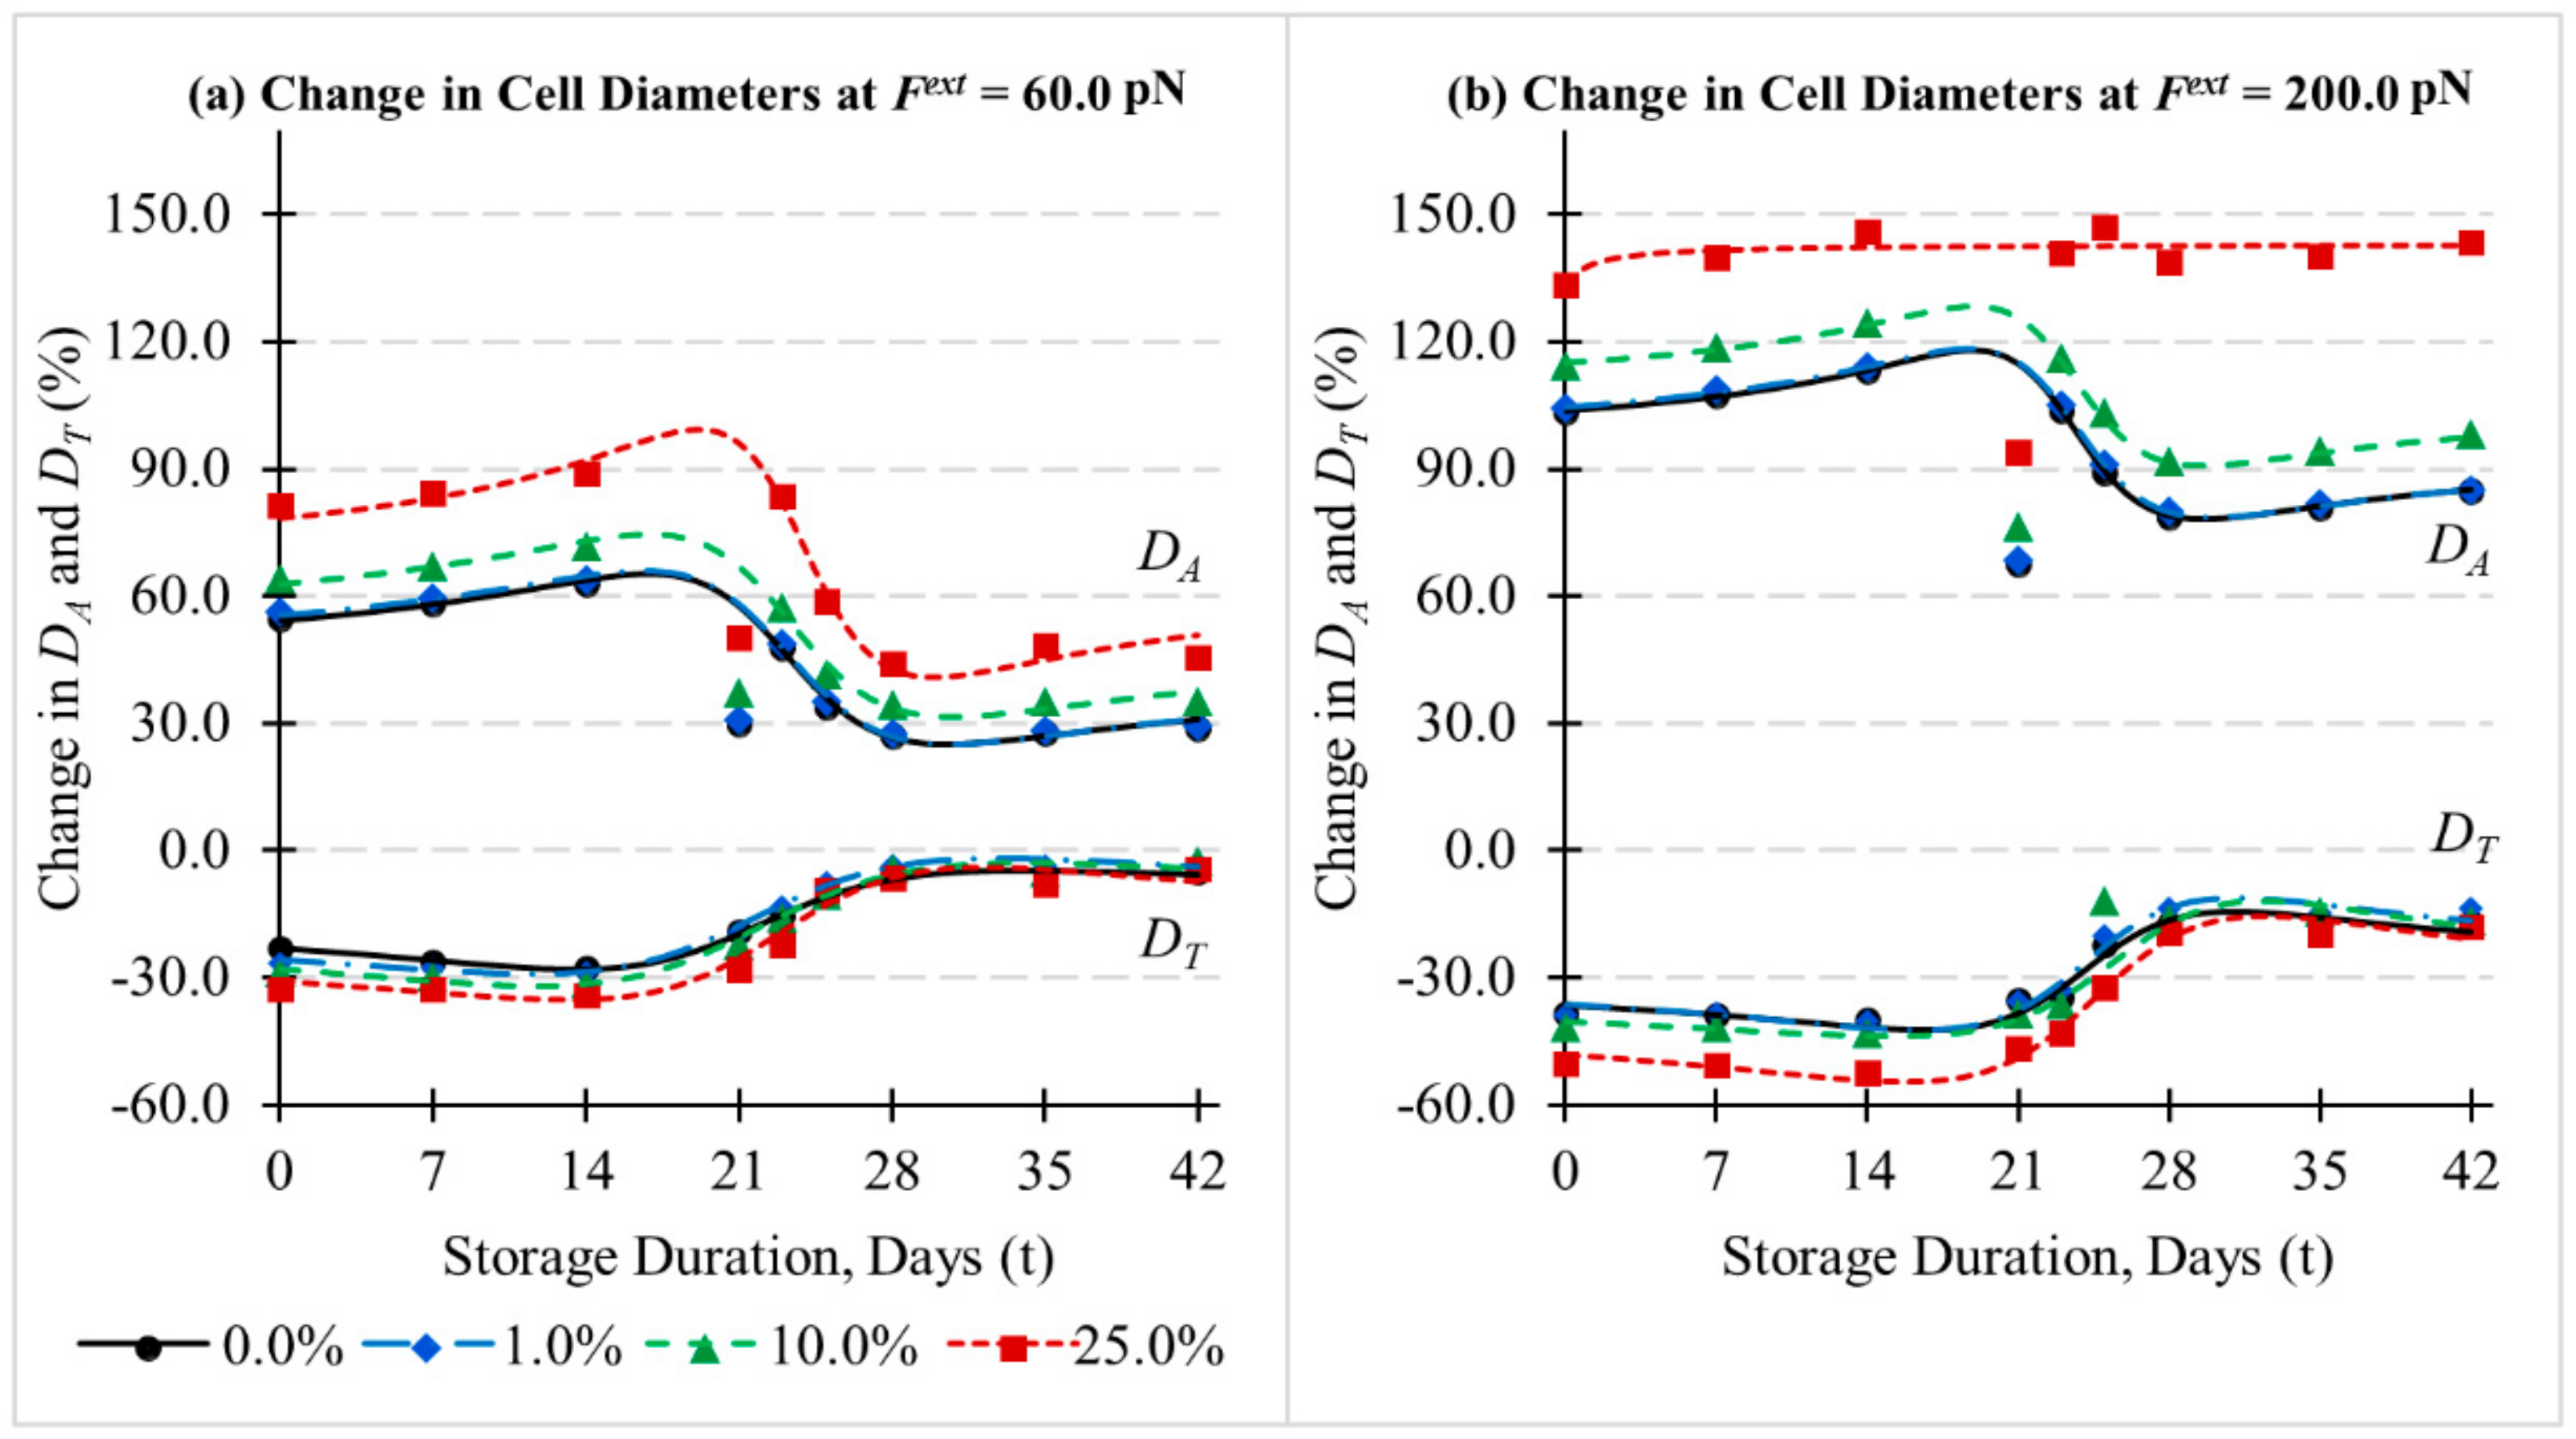
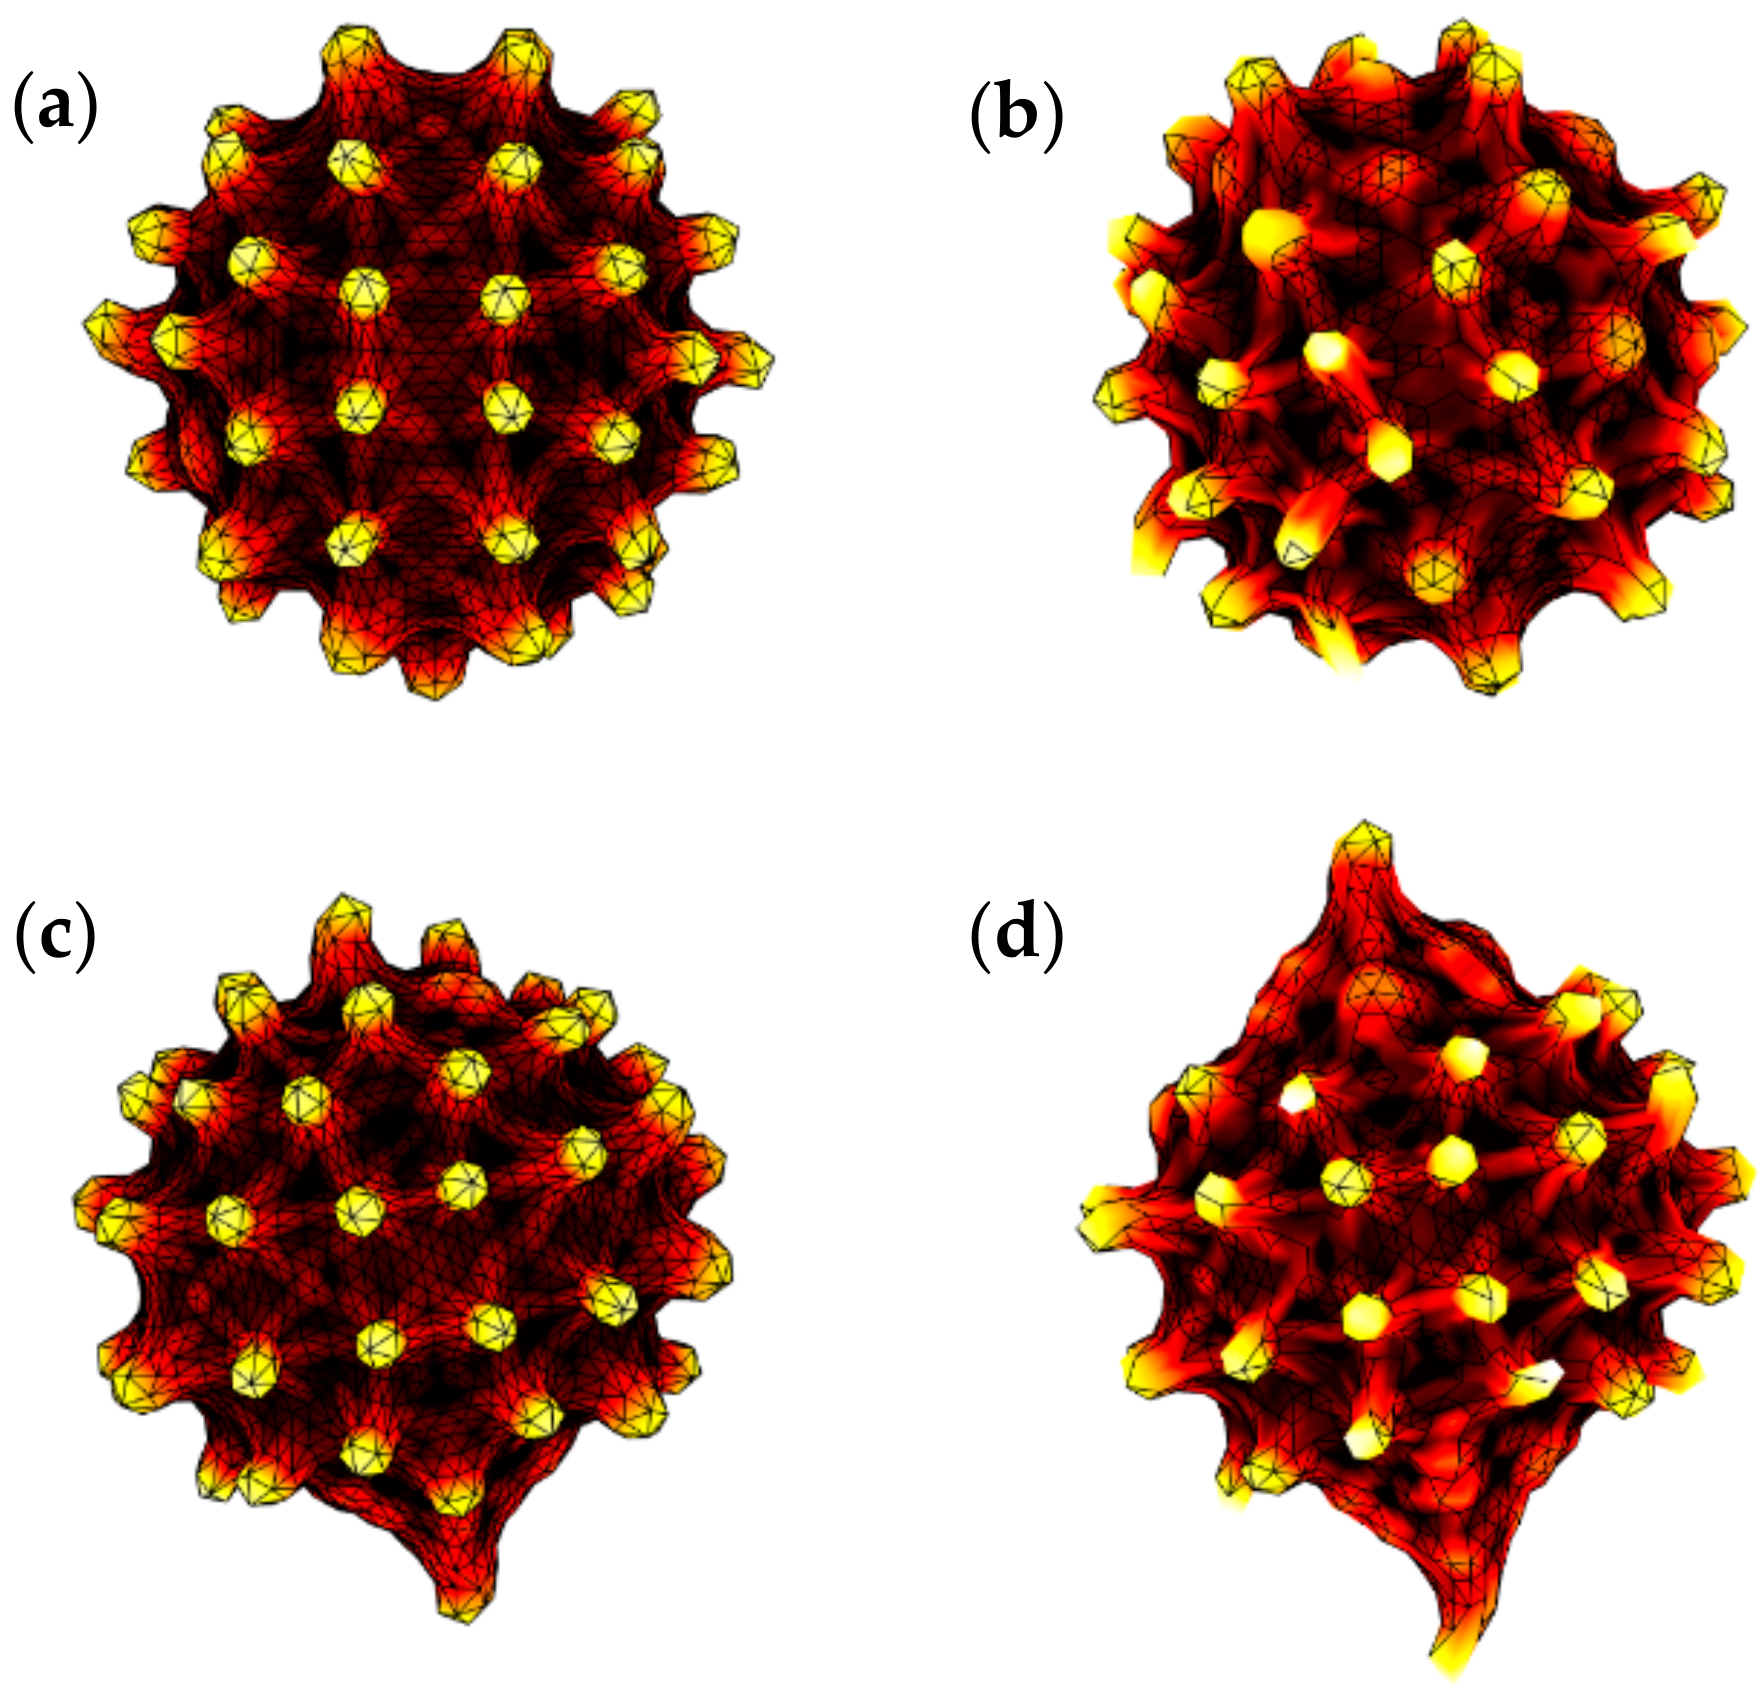
3.3. Influence of Cytoskeletal Actin Junctional Defects during In-Vitro Storage on RBC Morphology and Deformability

The ATP depletion during in-vitro RBC storage can lead to cytoskeletal protein defects such that the connections between the cytoskeletal spectrin network and the lipid-bilayer are disrupted [32,68,82]. RBCs with defective vertical interactions between the lipid-bilayer and the cytoskeleton can lose the unsupported membrane area contributing to membrane vesiculation. In this section, the influence on the equilibrium cell shape and its deformation behaviour is investigated for stored RBCs with defects in the membrane proteins that cause disruption in the vertical interactions between the cytoskeleton and the lipid-bilayer. The protein defects in the vertical interaction are presented in the CG-RBC membrane model by broken connections of spectrin links at randomly selected actin junctional complexes. Loss of vertical connectivity at the actin junctional complexes ( A V e r t i c a l ) from 0% to 25% was introduced to the CG-RBC membrane model such that the spectrin links attached to these defective actin junctional complexes do not contribute to the cytoskeletal stretching response. Therefore, the elastic energy of the cytoskeleton ( E S t r e t c h i n g ) for a cell membrane with loss of vertical connectivity between cytoskeleton and lipid-bilayer, is given by
E S t r e t c h i n g = j = 1 N S k B   T   l m a x 4   p   3 x j 3 2 x j 3 1 x j + k p m 1   l j m 1 , j     S A V e r t i c a l 0 ,   j     S A V e r t i c a l
where S A V e r t i c a l indicates the spectrin links attached to defective actin junctional complexes. k B is the Boltzmann constant, T is the absolute temperature, l m a x is the maximum extension of j t h link, p is the persistence length and k p is the power function coefficient. x j is defined as x j = l j / l m a x for the j t h link having l j length, and m is an exponent such that m = 2. The cytoskeletal spectrin network of A V e r t i c a l = 0, 1, 10 and 25 (%) of defective vertical interactions at randomly selected actin junctional complexes is presented in Figure 8.
The equilibrium cell shapes and membrane spicules become irregular with the severity of membrane defects (i.e., increase of A V e r t i c a l ). The equilibrium cell shapes of day 42 sphero-echinocytes with A V e r t i c a l = 0% and 25% subjected to optical tweezers stretching forces of F e x t = 0 and 200 pN are presented in Figure 9.
Spicules with sharp projections can be observed (refer to Figure 9) in the presence of A V e r t i c a l , especially if the actin junctional defects and spicule tips coincide together. At higher A V e r t i c a l , the unsupported lipid-bilayer forms sharp projections as it can easily contribute to Δ A 0 t and C 0 t in the absence of a cytoskeletal stretching response. The potential to form sharp projections increases with the increase of surface area of the lipid-bilayer segment that is unsupported by the cytoskeleton. Therefore, the loss of cytoskeleton and lipid-bilayer vertical interactions at adjacent actin junctional complexes promotes the formation of sharp projections on the cell surface, and can promote vesiculation at the tips of these sharp projections. This observation is in agreement with the experimental and computational predictions, which show that vesiculation does not require fragmentation of the cytoskeleton, although it can be enhanced by the uncoupling of the lipid-bilayer and the cytoskeleton [32,82]. Therefore, the sphero-echinocyte cells at the latter stages of storage have increased potential for vesiculation due to the higher number of membrane spicules and depleted ATP levels.
In addition, the deformation behaviour of stored RBCs at t (Days) = 0, 7, 14, 21, 23, 25, 28, 35 and 42 was also investigated for RBCs with a defective cytoskeleton of A V e r t i c a l = 0, 1, 10 and 25 (%). The evolution of change in the axial ( D A ) and transverse ( D T ) diameters of stored RBCs with varying A V e r t i c a l with respect to its analogous recovered cell state (i.e., recovered RBC shape at t and A V e r t i c a l = 0%) at F e x t = 60.0 and 200.0 pN is presented in Figure 10.
It can be observed (refer to Figure 10) that the change in D A and D T cell diameters in comparison to the recovered cell state increases with A V e r t i c a l , and indicates a similar form to that of the evolution of cell E I during storage. As expected, the change in D A and D T at equivalent A V e r t i c a l increases with F e x t as a response to the increased external stretching forces. The increasing change in D A and D T with A V e r t i c a l demonstrates the increased cell fluidity in the presence of decreased cytoskeleton and lipid–bilayer interactions. The cells showed a higher D A than D T to accommodate the applied stretching forces while maintaining cell reference conditions, and stretch along the axial direction of stretching. The observed lower change in D A of echinocyte I morphology at t = 21 days can be attributed to the slight deviations of CG-RBC membrane model-predicted echinocyte I morphology at t = 21 days from an ideal echinocyte I morphology. However, it is difficult to distinguish any significant difference in the evolution of D A of stored RBCs in the presence of high F e x t (= 200.0 pN) and A V e r t i c a l (= 25%). This demonstrates the insignificant dependency of changes in cell morphology, μ t , κ t , A 0 t , A k , 0 t , and V 0 t on RBC stretching response at very high F e x t and A V e r t i c a l , and the probability of cell rupture is very high for these RBCs. The present CG-RBC membrane model does not consider cell rupture, but can be extended to investigate the mechanisms of cell rupture of defective cells subjected to mechanical deformation.

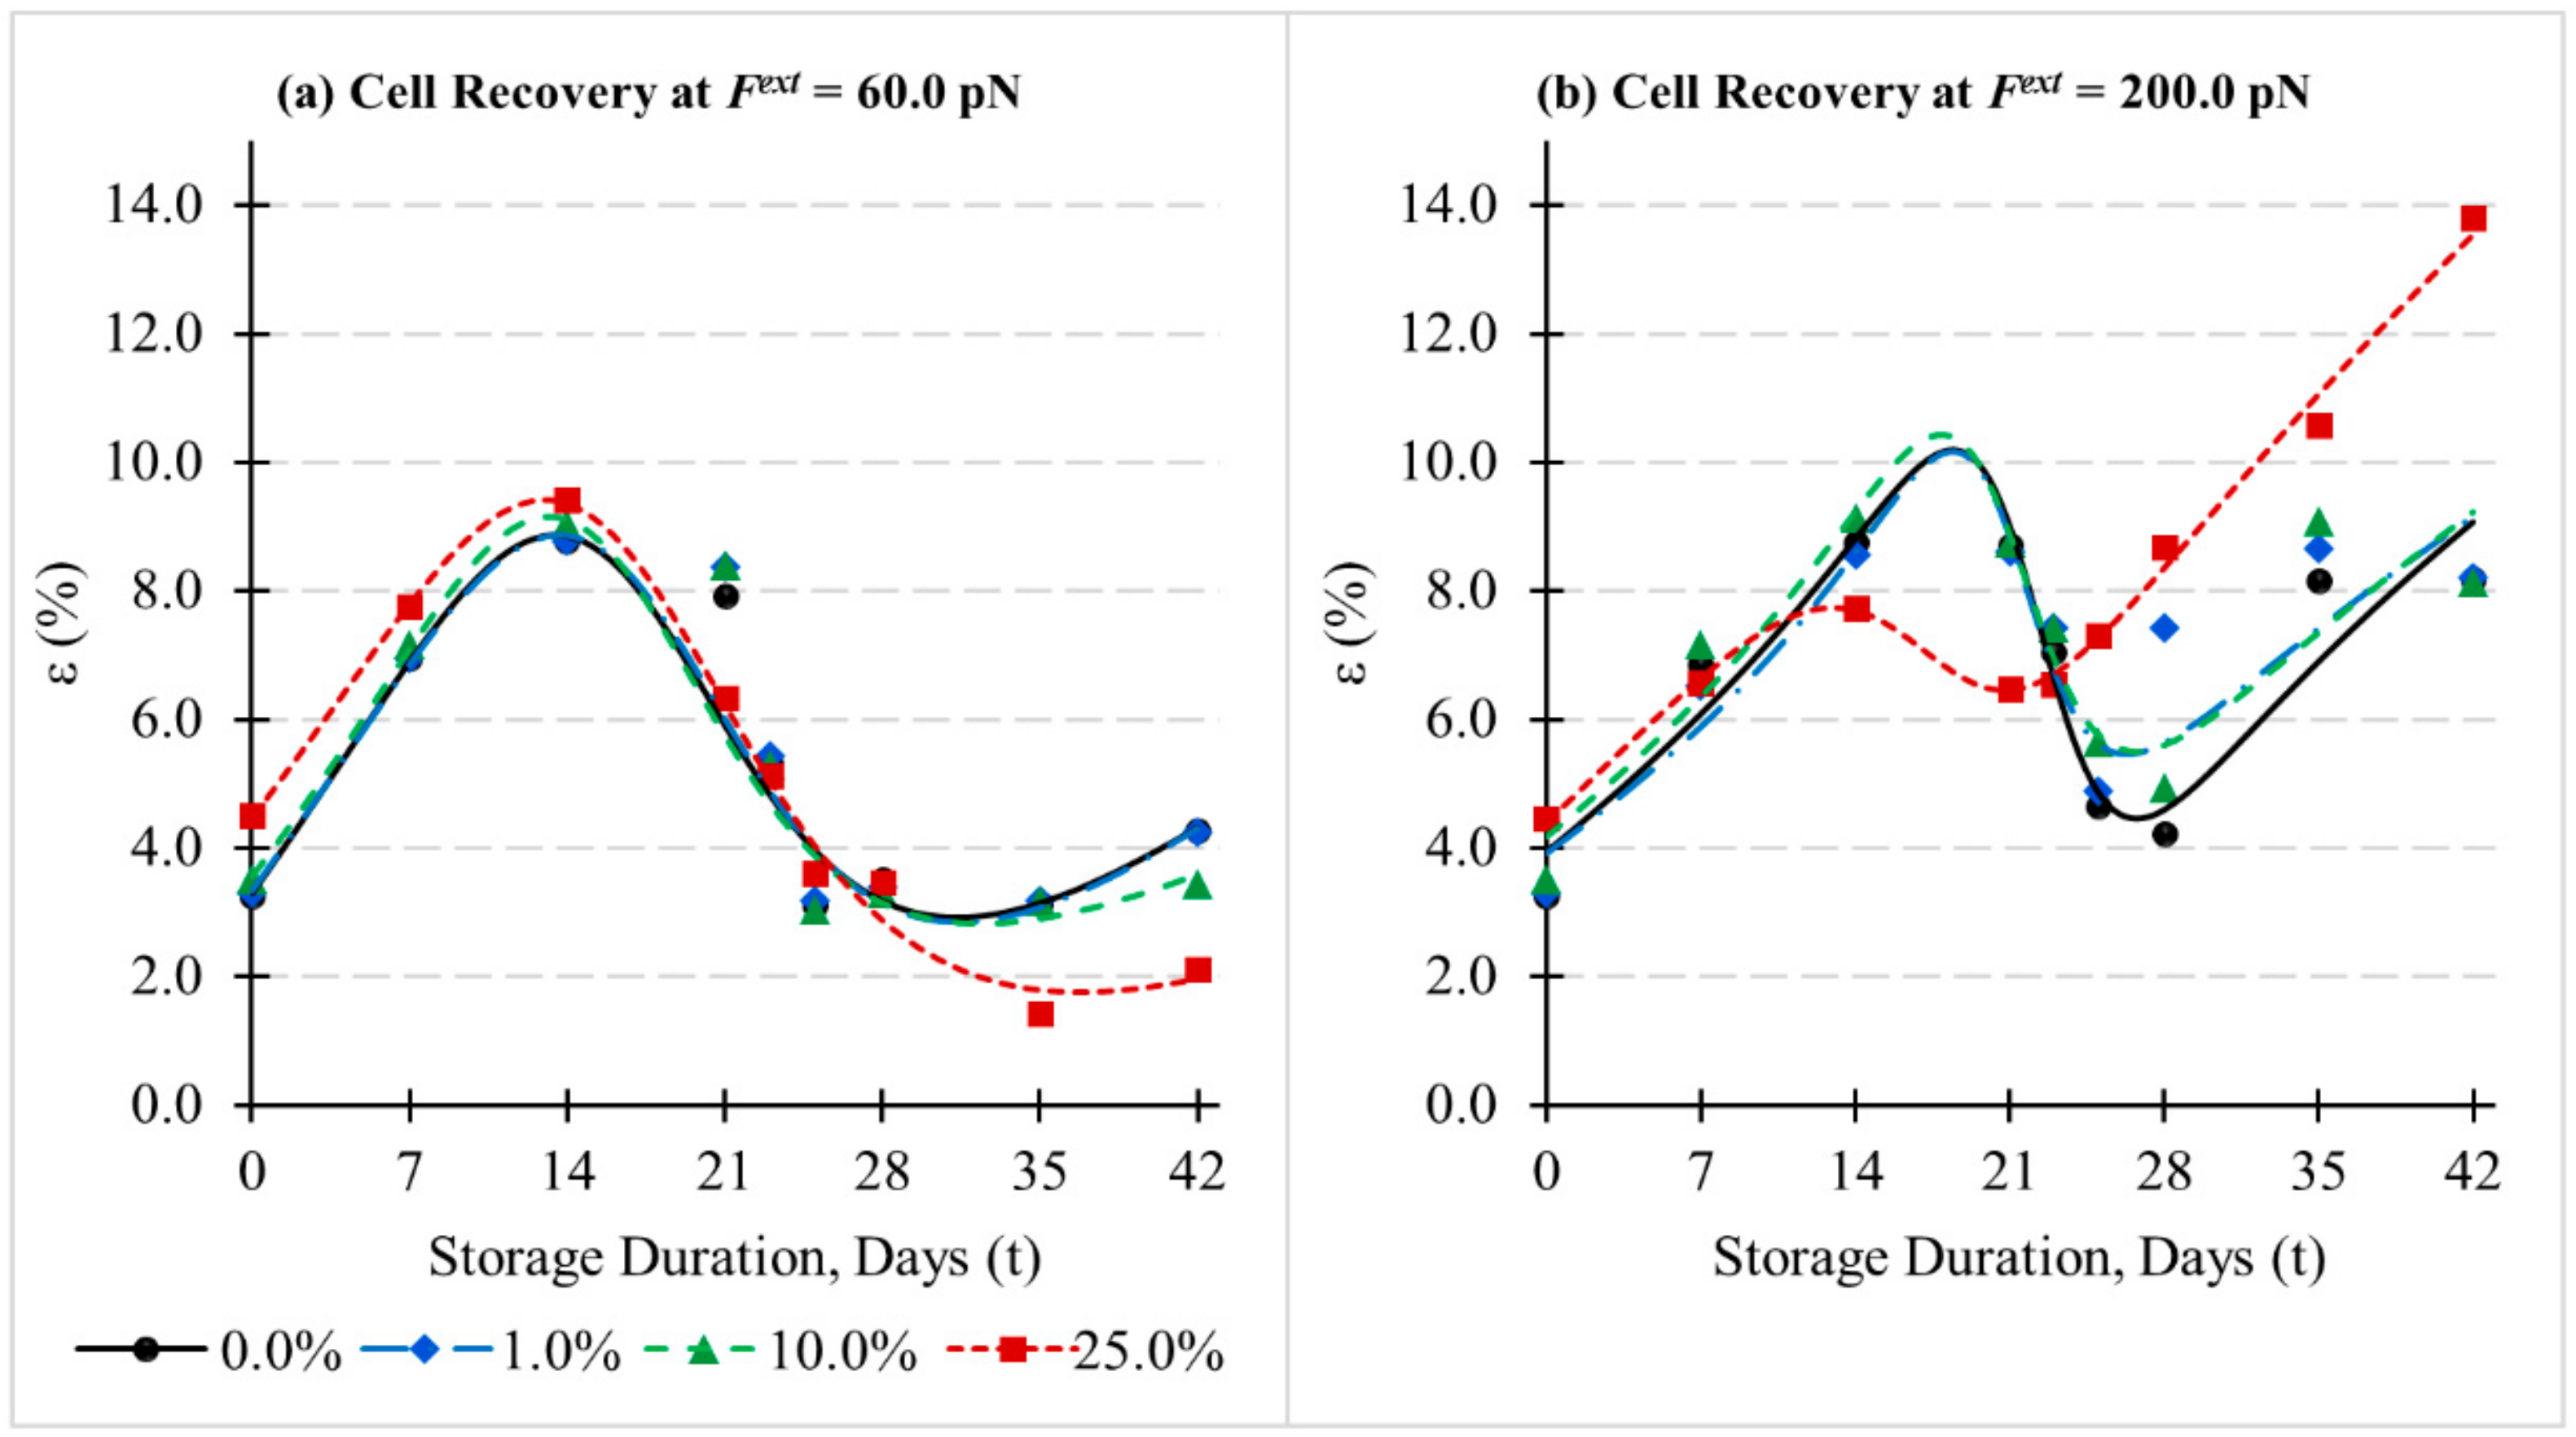
3.4. Influence of Cytoskeletal Actin Junctional Defects during In-Vitro Storage on Cell Recovery following Deformations

It is also important to investigate the influence of storage-induced membrane defects on cell recovery subjected to mechanical deformation. Among those factors that influence the cell stretching response (e.g., spectrin network, intracellular viscosity and cholesterol content), the cytoskeletal spectrin network is the primary contributor for cell stretching response, and differences in cytoskeletal spectrin densities can be observed for different RBC morphologies [28]. During the cell recovery process, the cell can achieve equilibrium and corresponding reference conditions (i.e., Δ A 0 t , C 0 t , A 0 t , A k , 0 t , and V 0 t ) at different cell features to that of the original state. However, a minimal change in cell features indicates a higher integrity of the cell. Therefore, the recoverability of stretched cells at t storage-period with a defective cytoskeleton of A V e r t i c a l = 0, 1, 10 and 25 (%) to its original cell state with A V e r t i c a l = 0% was investigated in terms of cell dimensions. H 1 , H 2 and H 3 cell dimensions were estimated and used to estimate the average percentage error ( ε ) for H 1 , H 2 and H 3 for the analogous original and recovered cell. The evolution of ε of recovered stretched RBCs with varying A V e r t i c a l with respect to its analogous recovered cell state (i.e., recovered RBC shape at t and A V e r t i c a l = 0%) at F e x t = 60.0 and 200.0 pN is presented in Figure 11.
It can be observed (refer to Figure 11) that the trend of evolution of ε increases with storage-period for similar morphologies and decreases during the transition period where irregular RBC morphologies occur. The discocyte morphology during 0   t   < 20 and sphero-echinocyte morphology during 26   t   42 each has equivalent μ t , κ t , Δ A 0 t and C 0 t , but varying A 0 t , A k , 0 t , and V 0 t . The cytoskeletal reference state of the CG-RBC membrane model is considered to be an ellipsoidal shape at around 0.94 of the volume of a healthy RBC. Therefore, the cell recovery process after direct axial cell stretching is affected by the increasing cell sphericity and cytoskeletal reference state such that a cell with increased cell thickness results. In addition, the stretching response of cells with similar morphology indicates increasing change in cell diameters with respect to the applied stretching forces. Therefore, the discocyte at day 19 and the sphero-echinocyte at day 42 need to recover a higher change in cell diameters than that of the day 0 discocyte and day 26 sphero-echinocyte, which can be difficult. Similarly, the decreasing cell stretchability with the storage time with respect to increasing μ t reduces the cell elongation to be recovered, and therefore indicates better cell recoverability during the transition period. In addition, the cell sphericity increases with echinocyte I, echinocyte II, echinocyte III and sphero-echinocyte morphologies, and therefore the cytoskeletal reference state and the evolution of A 0 t , A k , 0 t , and V 0 t supports better cell recovery during the transition period. The sphero-echinocyte during 26   t   42 with increasing A V e r t i c a l at F e x t = 60.0 pN indicates better recoverability than that of a healthy RBC. Similarly, it is difficult to achieve a trend to represent the evolution of ε for sphero-echinocytes during 26   t   42 at A V e r t i c a l = 0%, 1% and 10% and at F e x t = 200.0 pN, such that all the numerically predicted ε values are contained within. These observations for sphero-echinocytes during 26   t   42 with increasing A V e r t i c a l may be due to the increasing spicule irregularity that can influence the estimation of cell dimensions, and therefore ε (refer to Figure 12). The recovered stretched cell shapes of day 42 sphero-echinocyte RBCs with A V e r t i c a l = 0% and 25% at F e x t = 60.0 pN, and that of RBCs having A V e r t i c a l = 0% and 25% at F e x t = 200.0 pN, are presented in Figure 12.
In general, the numerical predictions indicate that the recoverability of a defective RBC membrane with A V e r t i c a l is adversely affected due to its low cytoskeletal integrity. As expected, the day 0 discocyte with low or zero A V e r t i c a l indicates the best recoverability, whereas the day 42 sphero-echinocyte with higher A V e r t i c a l indicates the worst recoverability at high stretching forces. The RBCs with prolonged storage have limited recoverability following mechanical deformations. RBCs are required to deform significantly and repeatedly during their passage through microvasculature, and RBCs with lower recoverability may not survive in-vivo circulation leading to adverse post-transfusion outcomes.

4. Conclusions

A numerical investigation was performed to systematically investigate the deformability and morphology changes of RBCs undergoing storage lesion. It is hypothesized that discocyte, echinocyte I, echinocyte II, echinocyte III and sphero-echinocyte morphologies and associated changes in cell membrane mechanics and cell geometry during in-vitro storage, can be attributed to a CG-RBC membrane approach integrated with the BCM-based membrane free energy model. The CG-RBC membrane model [76] captures the essential features of RBC echinocytosis during in-vitro storage, and enables valuable predictions of the influence of storage lesion on RBC quality and viability. The predicted morphology and deformability characteristics of RBC echinocytosis confirms the decreasing cell deformability, and thereby the decreasing quality and viability of stored RBCs with increasing storage duration. Differences in deformability and morphology characteristics: cell shape factor, elongation index and membrane spicule details such as number of spicules, average spicule height, average spicule surface area and average spicule curvature, were observed between the storage lesion-produced and echinocytogenic shape-transforming conditions-produced echinocyte I, echinocyte II, echinocyte III and sphero-echinocyte morphologies. Furthermore, the results predict the adverse influence of membrane structural defects due to storage lesion on cell deformability and recoverability during mechanical deformations, and indicate further degradation of cell viability.
RBC storage lesion is a significant issue facing transfusion treatments, and despite the improved in-vitro storage procedures, storage lesion still occurs, affecting the maximum storage time for a healthy and safe RBC supply. Therefore, improved understanding of the interrelation between quality and viability of stored RBCs and storage lesion is essential to prevent or reduce transfusion related adverse outcomes. The present numerical study provides a strengthened approach for such understanding, and can be extended for a detailed discussion of the relationship between storage lesion and RBC membrane mechanics, where any associated changes to the lipid-bilayer and/or cytoskeletal spectrin network should be considered. In addition, the availability of any physicochemical models that discuss the influence of storage environment on red blood cells along with these numerical investigations on RBC membrane mechanics would facilitate better predictions of the storage lesion. The present study assumes a homogeneous population of healthy young RBCs at day 0 of storage. However, RBCs are a heterogenous population with different ages, and they are also affected by donor characteristics such as donor age, gender and health. Therefore, this study can be extended further to investigate the influence of these donor characteristics on RBCs during storage. Insights gained from such investigations will facilitate better storage procedure and transfusion practices. Moreover, this numerical approach provides a potential framework to study the membrane vesiculation and RBC deformation characteristics under varying pathophysiological conditions, and the influence of altered membrane proteins on RBC function such as hereditary haemolytic disorders (i.e., spherocytosis, elliptocytosis and ovalocytosis) for better diagnostics and treatments. Finally, this study is currently being extended to investigate the recoverability of deformability and morphology changes of RBCs undergoing storage lesion.

Author Contributions

N.G. developed the CG-RBC model and algorithm, performed modelling, data analysis and composed the manuscript. E.S. guided the model development, data analysis and revised the manuscript. S.S. revised the manuscript. R.F. revised the manuscript. Y.G. guided the model development and revised the manuscript. All authors have read and agreed to the published version of the manuscript.

Funding

This research was funded by the Australian Research Council through Linkage Grant (LP150100737), and Queensland University of Technology (QUT) through QUT Postgraduate Research Award (QUTPRA), Higher Degree Research (HDR) Tuition Fee Sponsorship and QUT Excellence Top-Up Scholarship.

Acknowledgments

The authors would like to acknowledge the support provided by HN Polwaththe-Gallage, S Barns, M Balanant, QUT’s High Performance Computer Resources (HPC) and the Australian Red Cross Lifeblood are gratefully acknowledged. The Australian Government fully fund the Australian Red Cross Lifeblood for the provision of blood, blood products and services to the Australian community.

Conflicts of Interest

The authors declare no conflict of interest. The funders had no role in the design of the study; in the collection, analyses, or interpretation of data; in the writing of the manuscript, or in the decision to publish the results.

Appendix A. CG-RBC Membrane Model

The CG-RBC membrane model is composed of N V vertices to represent the cytoskeletal actin junctional complexes, which form a 2D triangulated surface of N t triangles. The N S adjacent vertex-vertex connections represent the cytoskeletal spectrin links. The free-energy of the CG-RBC membrane model ( E ) takes into account the elastic energy of the cytoskeletal spectrin network ( E S t r e t c h i n g ), bending resistance of the lipid-bilayer ( E B e n d i n g ), and constraints of fixed total surface area ( E S u r f a c e a r e a ) and enclosed volume ( E V o l u m e ). A BCM-based membrane bending energy approach [68,88,89,90,91] was implemented via bilayer-leaflet-area-difference constraint ( E A r e a d i f f e r e n c e ) to achieve the stomatocyte, discocyte and echinocyte morphologies at corresponding reference bilayer-leaflet-area-difference ( Δ A 0 ). In addition, the total-membrane-curvature constraint ( E T o t a l c u r v a t u r e ) was implemented to achieve numerically consistent RBC morphologies at corresponding reference total-membrane-curvature ( C 0 ). Therefore, E is given by,
E = E S t r e t c h i n g + E B e n d i n g + E S u r f a c e a r e a + E V o l u m e + E A r e a d i f f e r e n c e + E T o t a l c u r v a t u r e
E S t r e t c h i n g was estimated based on the coarse-graining approach by Fedosov et al. [58], and is given by,
E S t r e t c h i n g = j   ϵ   1 N S k B   T   l m a x 4   p   3 x j 3 2 x j 3 1 x j + k p m 1   l j m 1 ,
where k B is the Boltzmann constant, T is the absolute temperature, l m a x is the maximum extension of j t h link, p is the persistence length and k p is the power function coefficient. x j is defined as x j = l j / l m a x for the j t h link having l j length, and m is an exponent such that m > 1. The experimentally estimated membrane shear modulus ( μ 0 ) of a healthy RBC lies between 4–12 µNm−1 [58,68], and can be determined as below for the CG-RBC membrane model [58].
μ 0 = 3   k B   T 4   p   l m a x   x 0   x 0 2   1 x 0 3 1 4   1 x 0 2 1 4 + 3   k p   m + 1 4   l 0 m + 1 ,
where l 0 is the equilibrium length of the j t h link, and defined as x 0 = l 0 / l m a x . E B e n d i n g of the lipid-bilayer for a zero spontaneous curvature is estimated by
E B e n d i n g = 2   κ   j   ϵ   1 N S M j 2 Δ A j ,
where κ is the membrane bending modulus, M j is the membrane curvature at the j t h link, and Δ A j is the membrane surface area associated with the j t h link. M j and Δ A j , corresponding to the triangle-pair composed of T 1 and T 2 triangles that share the j t h link, are estimated as follows;
M j = 1 2   l j   θ j ,
Δ A j = 1 3   A T 1 + A T 2 ,
where θ j is the angle between outward normal vectors to the triangles T 1 and T 2 , and A T 1 and A T 2 are the planer area associated with T 1 and T 2 , respectively. θ j is defined such that the concave arrangement of T 1 and T 2 corresponds to a positive θ j , whereas the convex arrangement corresponds to a negative θ j , and results in positive or negative M j , respectively.
The energy components due to constraints: E S u r f a c e a r e a , E V o l u m e , E A r e a d i f f e r e n c e and E T o t a l c u r v a t u r e are estimated by [58,76,92],
E S u r f a c e a r e a = 1 2   k A   A A 0 A 0 2   A 0 + k   ϵ   1 N t 1 2   k a   A k A k , 0 A k , 0 2   A k , 0 ,
E V o l u m e = 1 2   k V   V V 0 V 0 2   V 0 ,
E A r e a d i f f e r e n c e = 1 2   π   k A D D 0 2   Δ A Δ A 0 A 2   A ,
E T o t a l c u r v a t u r e = 1 2   π   k C D 0 2   C C 0 A 2   A ,
where A 0 is the reference membrane surface area, A is the instantaneous membrane surface area, A k , 0 is the reference area of k t h triangle, and A k is the instantaneous area of k t h triangle. V 0 is the reference cell volume and V is the instantaneous cell volume. D 0 is the monolayer thickness of the lipid-bilayer, Δ A is the instantaneous bilayer-leaflet-area-difference, and C is the instantaneous total-membrane-curvature. k A , k a , k V , k A D and k C represent the total surface area, local surface area, volume, bilayer-leaflet-area-difference and total-membrane-curvature constraint coefficients, respectively.
It is assumed that the membrane vertices move over the RBC membrane surface to achieve the minimum free energy state, which is the equilibrium RBC shape. The force ( F i ) acting on the i t h vertex at point r i on the surface is derived from the principle of virtual work, such that;
F i = E r i ,   i     1     N V ,
The resulting motion of the i t h vertex is then estimated from the Newton’s second law of motion as follows;
F i + f i e x t = m i r ¨ i + c   r ˙ i ,
where f i e x t is the contribution from any external forces on the i t h vertex point, m i is the mass of i t h vertex point, dot (.) is the time derivative and c is the viscosity of the RBC membrane. The updated velocity ( r ˙ i ) and the position ( r i ) of the i t h vertex at time ( t + Δ t ) from the time ( t ) is given as;
r ˙ i t +   Δ t = c   r ˙ i t + r ¨ i t   Δ t ,
r i t +   Δ t = r i t + r ˙ i t +   Δ t   Δ t ,
In these simulations, m i and c in Equations (A12) and (A13) do not affect the equilibrium shape of the RBC as these parameters only control the convergence speed of the simulation from the initial to the equilibrium state, and are purely numerical inputs for the present steady-state numerical predictions. Therefore, c in Equation (A13) acts as a damping coefficient to achieve the numerical consistency during the simulation. The iterations are continued until the RBC membrane reaches the equilibrium state, which is the minimum free energy state of the RBC membrane at given reference conditions. In the present computational implementation, the equilibrium cell state is acknowledged and the derivation is terminated when the change between each analogous energy component at two successive iterations is less than 1 × 10⁻⁷ in the order of energy component in consideration.

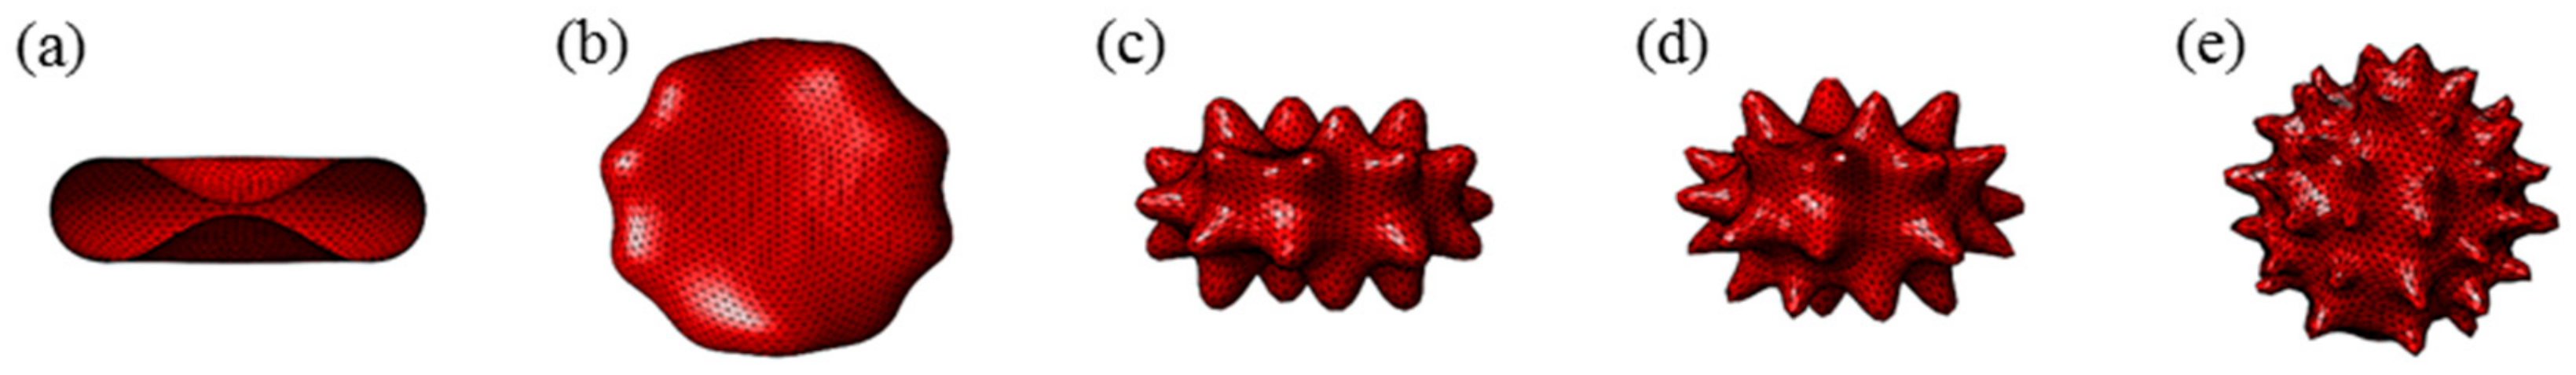
Appendix B. Prediction of Discocyte, Echinocyte I, Echinocyte II, Echinocyte III and Sphero-Echinocyte RBC Morphologies

The CG-RBC membrane model-predicted discocyte, echinocyte I, echinocyte II, echinocyte III and sphero-echinocyte morphologies were achieved according to the method presented in Geekiyanage et al. [76], and the key model parameters are summarised in Table A1. The analogous equilibrium discocyte, echinocyte I, echinocyte II, echinocyte III and sphero-echinocyte shapes are presented in Figure A1.
Table A1. The key parameters values used to model the discocyte, echinocyte I, echinocyte II, echinocyte III and sphero-echinocyte RBC morphologies.
ParameterDescriptionValueSource
A 0 Reference RBC membrane surface area140.0 µm2[62,76,93]
C 0 , D i s c o c y t e Reference total-membrane-curvature for discocyte1.85 × 10−3 A 0 m2[76]
C 0 , E c h i n o c y t e   I Reference total-membrane-curvature for echinocyte I2.00 × 10−3 A 0 m2[76]
C 0 , E c h i n o c y t e   I I Reference total-membrane-curvature for echinocyte II5.50 × 10−3 A 0 m2[76]
C 0 , E c h i n o c y t e   I I I Reference total-membrane-curvature for echinocyte III6.00 × 10−3 A 0 m2[76]
C 0 , S p h e r o E c h i n o c y t e Reference total-membrane-curvature for sphero-echinocyte9.00 × 10−3 A 0 m2[76]
D 0 Monolayer thickness of the lipid-bilayer2.0 nm[75,76]
N S Number of links in CG-RBC membrane model7680[76]
N V Number of vertices in CG-RBC membrane model2562[76]
N t Number of triangles in CG-RBC membrane model5120[76]
V 0 Reference RBC volume93.48 µm3[62,76,93]
k A Constraint coefficient for total membrane surface area1.0 × 10−3 Nm−1[76]
k A D Constraint coefficient for bilayer-leaflet-area-difference300.0 κ Nm[76]
k C Constraint coefficient for total-membrane-curvature100.0 κ Nm[76]
k V Constraint coefficient for cell volume100.0 Nm−2[76]
k a Constraint coefficient for local membrane surface area5.0 × 10−5 Nm−1[76]
m i Mass of the i t h CG-RBC membrane vertex1.0 × 10−9 kg[76]
x 0 Extensibility of spectrin links0.45[58,76]
μ 0 Membrane shear modulus4.0 µNm−1[58,68,76]
Δ A 0 , D i s c o c y t e Reference total-membrane-curvature for discocyte1.20 × 10−3 A 0 m2[76]
Δ A 0 , E c h i n o c y t e   I Reference total-membrane-curvature for echinocyte I1.35 × 10−3 A 0 m2[76]
Δ A 0 , E c h i n o c y t e   I I Reference total-membrane-curvature for echinocyte II1.90 × 10−3 A 0 m2[76]
Δ A 0 , E c h i n o c y t e   I I I Reference total-membrane-curvature for echinocyte III2.25 × 10−3 A 0 m2[76]
Δ A 0 , S p h e r o E c h i n o c y t e Reference total-membrane-curvature for sphero-echinocyte3.00 × 10−3 A 0 m2[76]
T Absolute temperature 296.15 K[76]
c Membrane viscosity1.0 × 10−7 Nsm−1[76]
m Exponent of E S t r e t c h i n g 2[58,76]
κ Membrane bending modulus2.5 × 10−19 Nm[57,68,76]
Figure A1. The CG-RBC membrane model-predicted (a) discocyte, (b) echinocyte I, (c) echinocyte II, (d) echinocyte III and (e) sphero-echinocyte morphologies at model parameters given in Table A1.
Applsci 10 03209 g0a1

Appendix C. Measurements of Cell Surface Area and Volume of RBC during In-Vitro Storage—Experimental Observations

Table A2. Measurements of cell surface area of RBC morphologies of three donors during 48 days of in-vitro storage in SAGM additive solution (D. Santangelo, personal communication, 10 October 2018). Mean represents the mean values whereas SD represents the standard deviation.
RBC Surface Area (µm2)
Day #DiscocyteEchinocyte IEchinocyte IIEchinocyte IIIRBC Mean
MeanSDMeanSDMeanSDMeanSD
2130.9710.13128.3316.59135.115.34112.0912.09126.18
± 15.08
7111.807.33122.2613.27118.587.27123.054.78118.87
± 10.33
21127.024.44126.1911.15117.7112.11118.8813.68124.29
± 10.69
28106.4810.29106.417.59115.552.19112.8910.30109.33
± 9.26
4899.413.64105.868.8298.662.69105.127.56102.88
± 7.48
Table A3. Measurements of cell volume of RBC morphologies of three donors during 48 days of in-vitro storage in SAGM additive solution (D. Santangelo, personal communication, 10 October 2018). Mean represents the mean values whereas SD represents the standard deviation.
RBC Volume (µm3)
Day #DiscocyteEchinocyte IEchinocyte IIEchinocyte IIIRBC Mean
MeanSDMeanSDMeanSDMeanSD
2106.9824.1996.4022.27113.2717.7484.7813.7399.51
± 22.68
777.1519.8886.3921.7381.6922.7597.0623.5185.03
± 22.98
2189.9519.8891.6218.7392.6224.6199.3820.7292.47
± 20.78
2877.3318.3179.9615.9690.5324.0487.1816.3883.25
± 19.24
4876.2020.3869.3225.6169.9722.9682.0024.9273.87
± 24.39

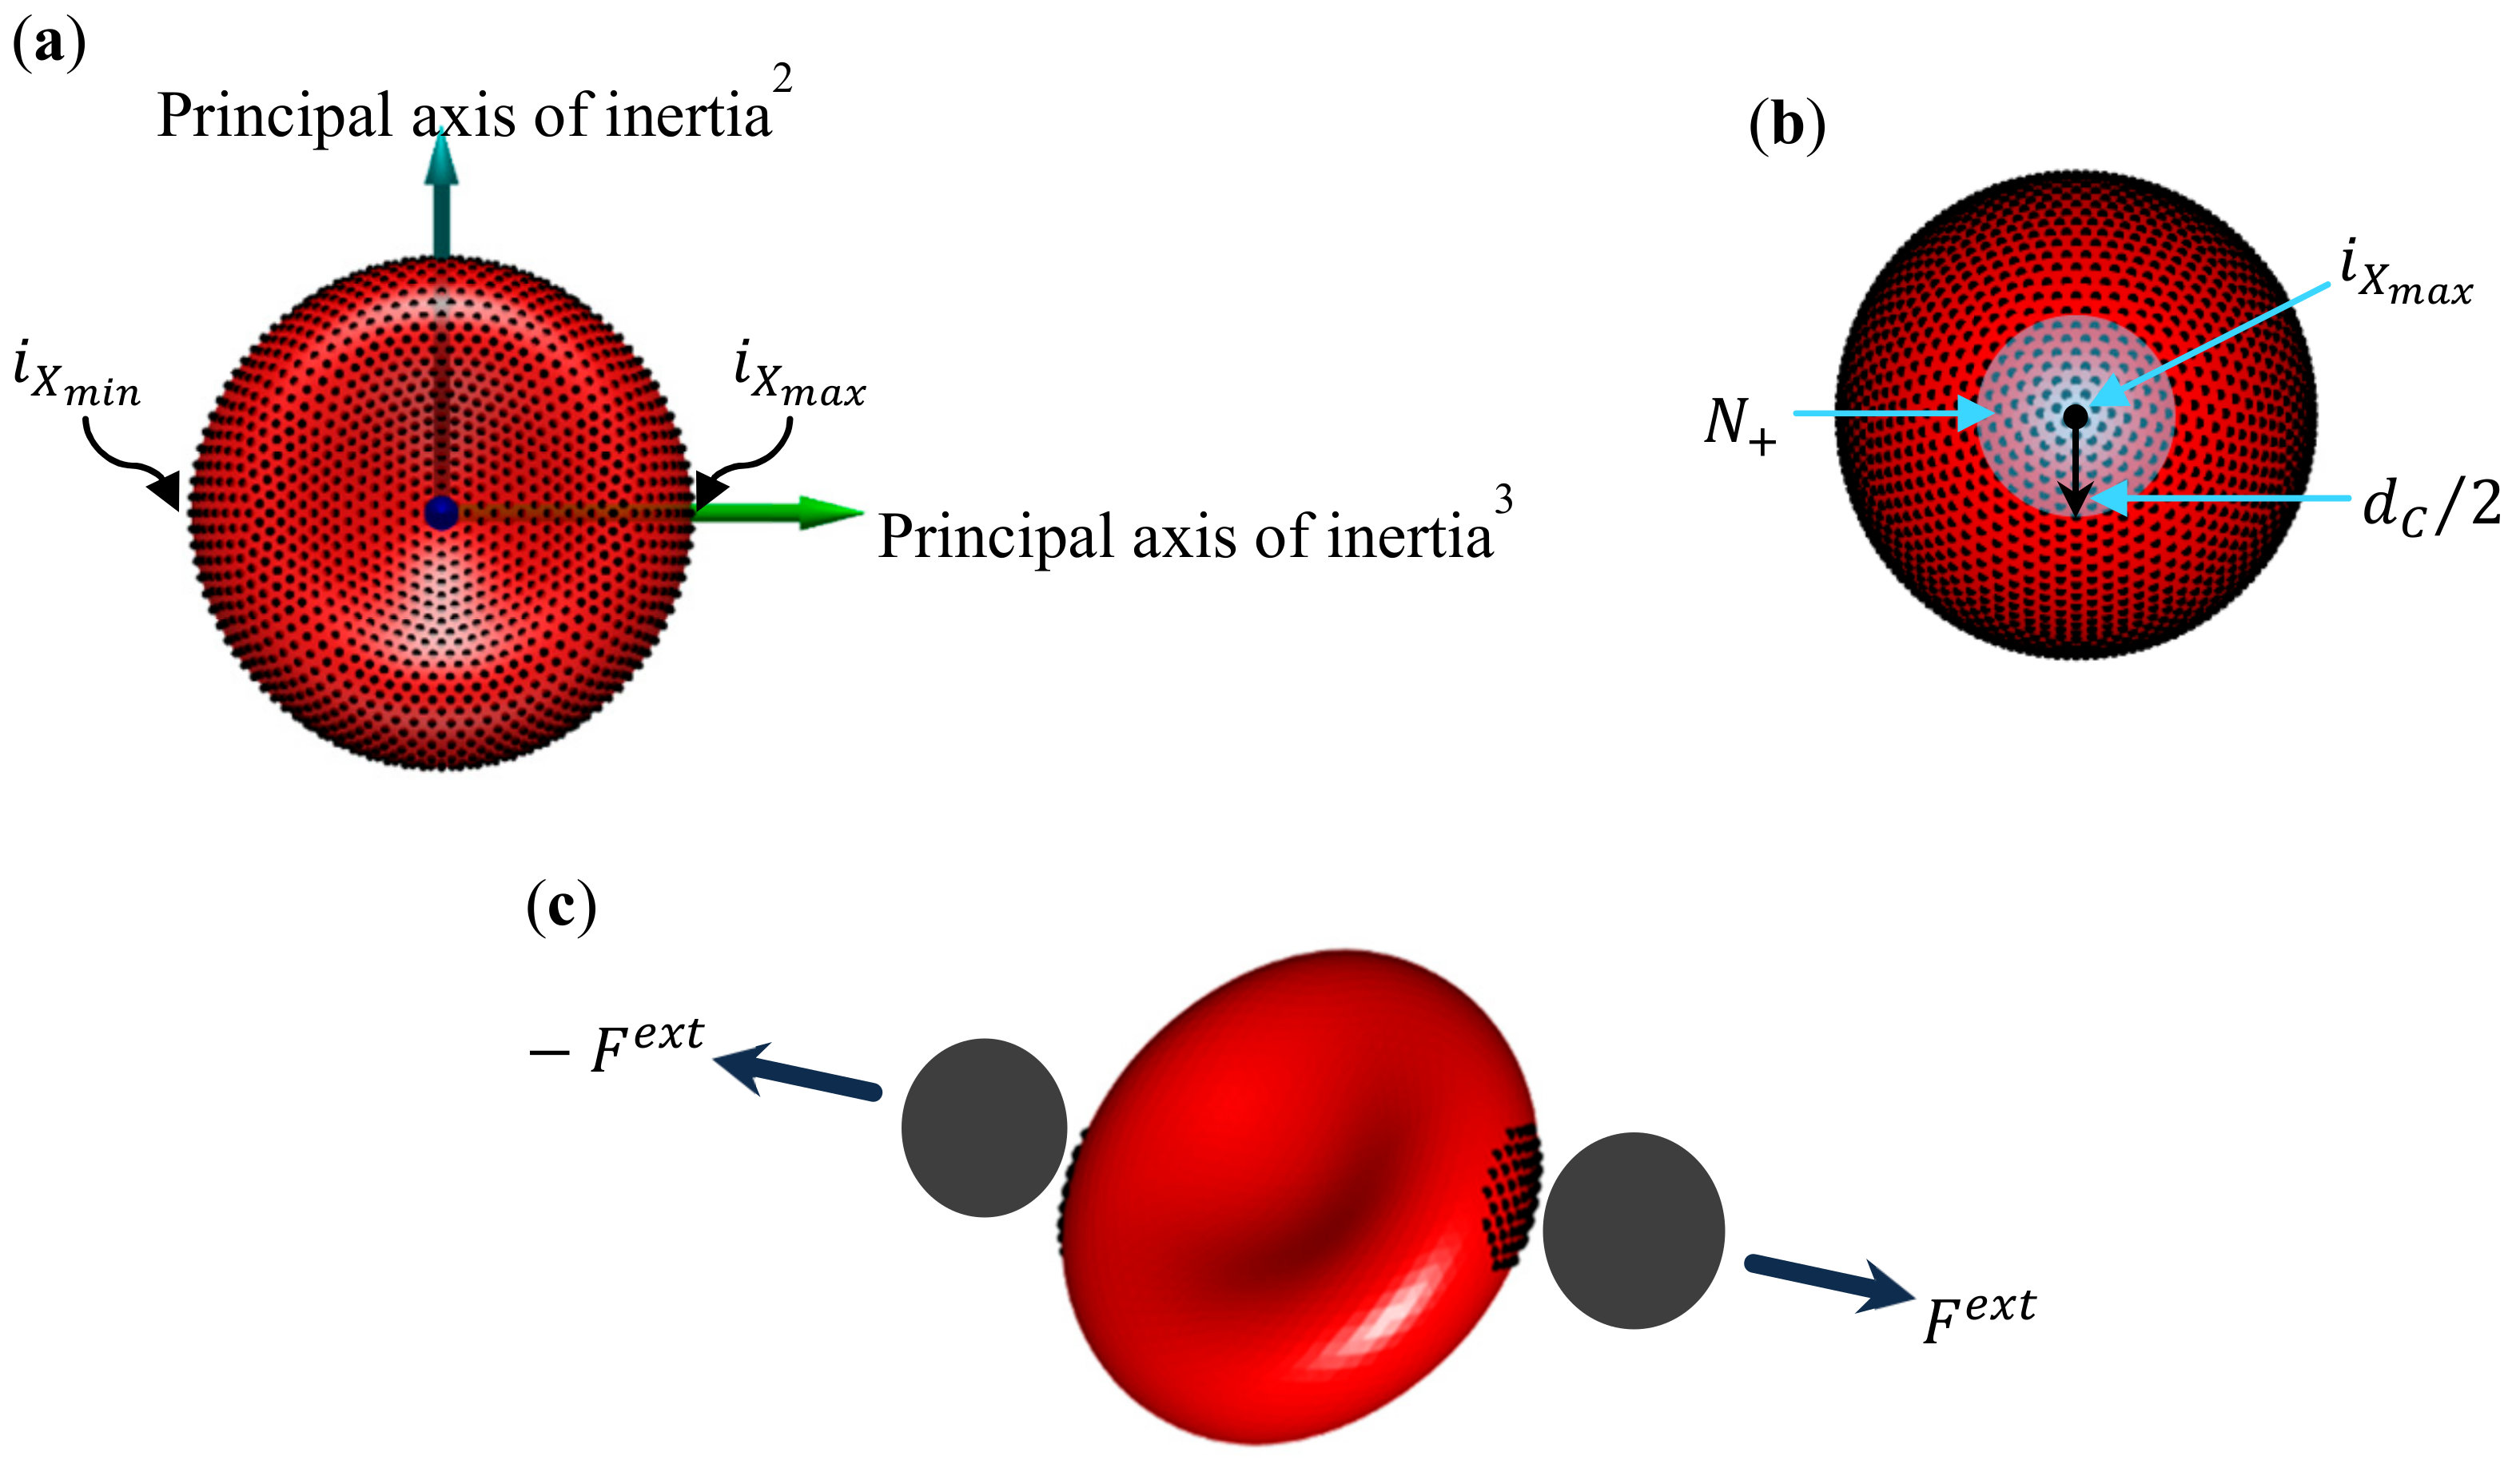
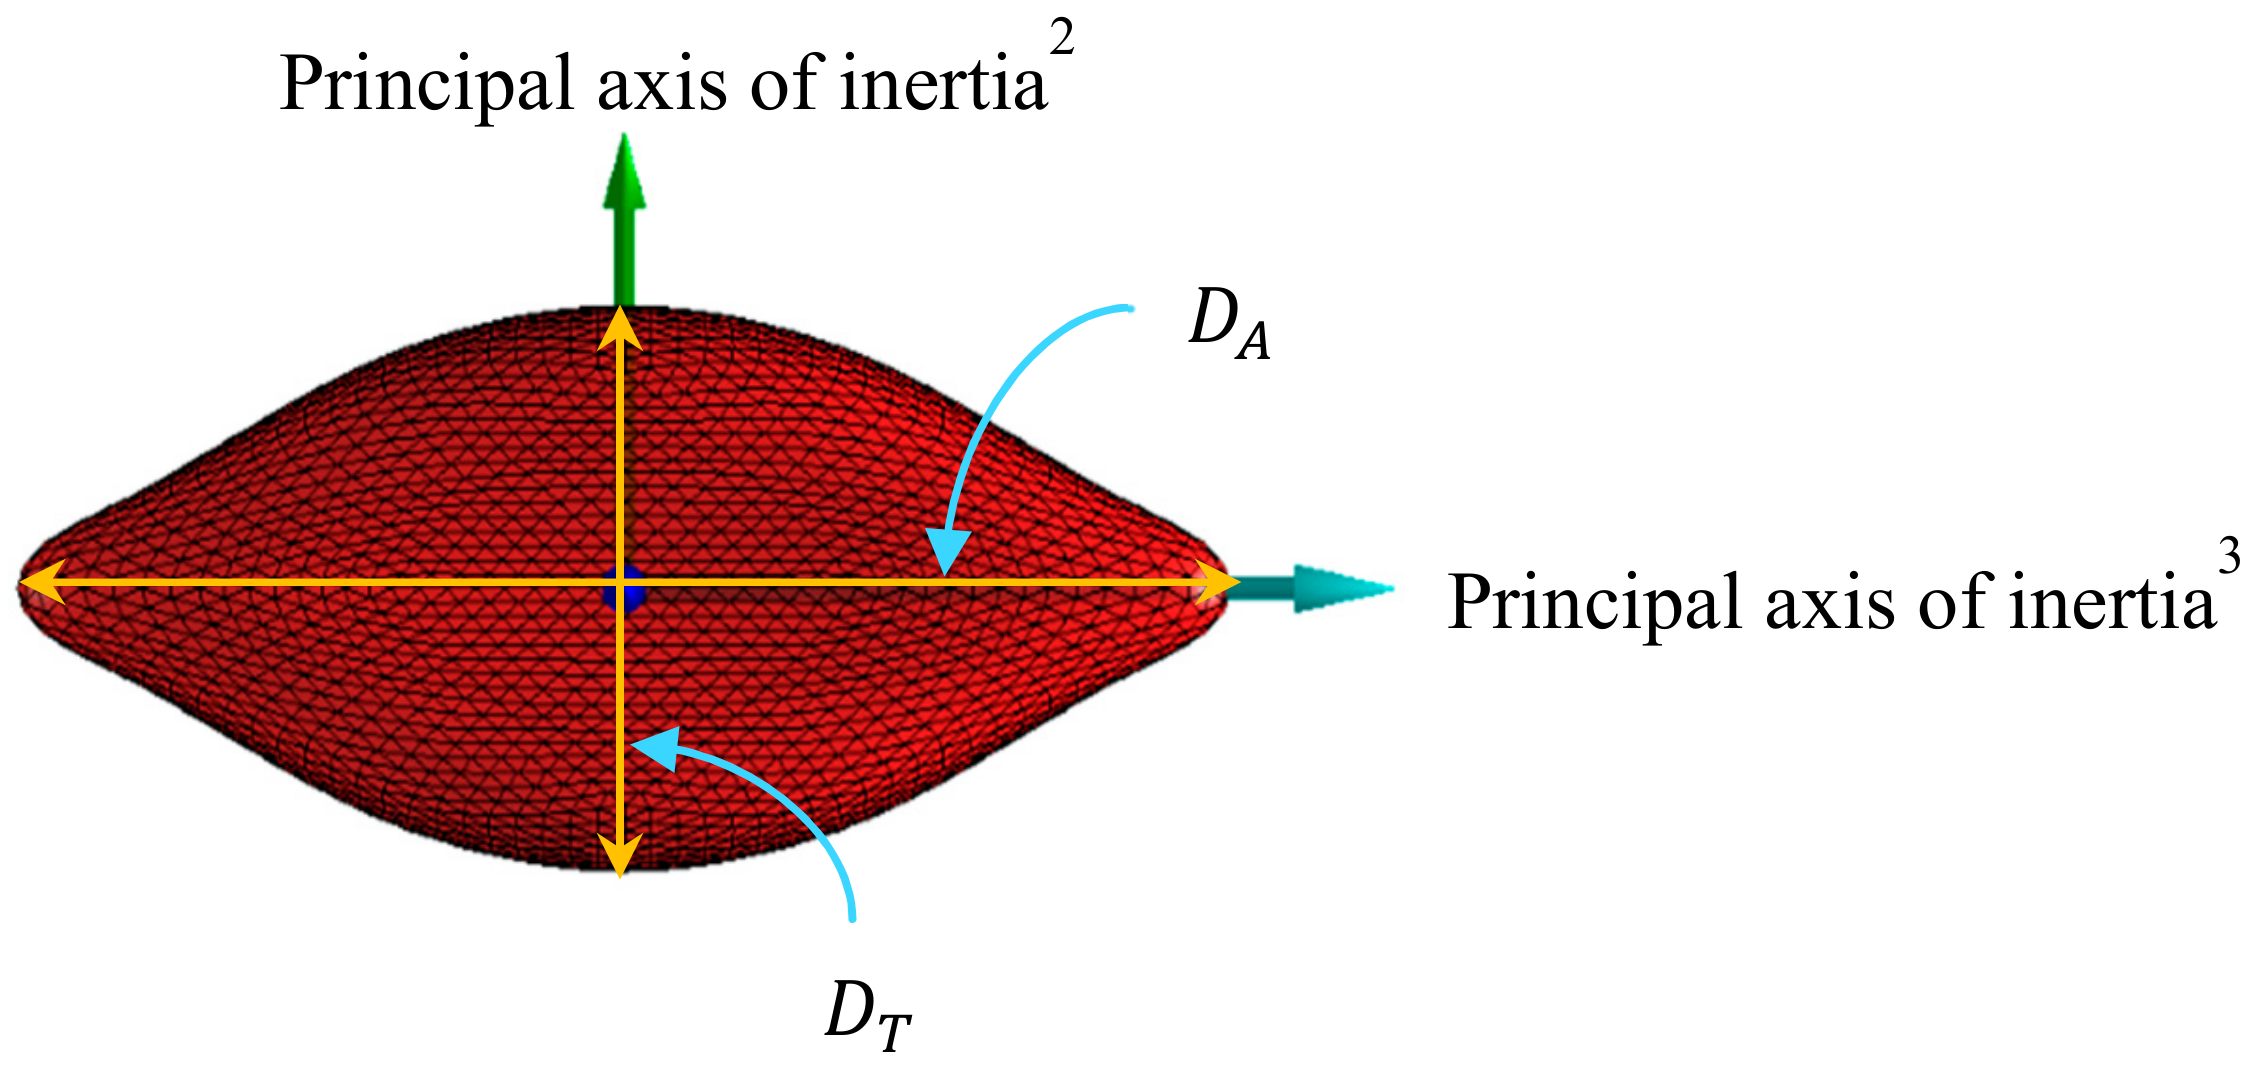
Appendix D. Implementation of Optical Tweezers Stretching

The optical tweezers stretching forces were implemented on the CG-RBC membrane model-predicted equilibrium RBC morphologies. Assuming rigid body conditions, the centre of mass of the whole cell and its three-principal axes of inertia were determined for each RBC morphology. The total stretching force ( F e x t ) was applied on N + = a   N V vertices, whereas F e x t is applied on N = a   N V vertices along the principal axis of inertia3 [39,58] (refer to Figure A2). N + and N are the vertices that locate within the circular region of radius d C / 2 on the initial spherical geometry, and from the 2 vertices ( i X m a x and i X m i n ) on the furthest ends of the equilibrium cell shape along the principal axis of inertia3. d C is the contact diameter between the cell membrane and the attached silica beads. The vertex fraction a corresponds to d C and is given by a = π   d C 2 / ( 4   A 0 ) . Therefore, f i e x t is applied on the i t h vertex, such that;
f i e x t = F e x t / N + , i     N + F e x t / N , i     N 0 , i     N +     N ,
Figure A2. Optical tweezers stretching implementation on the discocyte cell; (a) identification of i X m a x and i X m i n vertices, (b) identification of N + vertices, and (c) contact region between the RBC membrane and binding silica beads.
Applsci 10 03209 g0a2
F e x t was gradually applied on the cell via regular force increments of Δ F e x t , where the cell is provided with sufficient time to converge to the equilibrium stretched state after each force increment. The equilibrium stretched cell state was determined at equivalent A 0 , A k , 0 , V 0 , Δ A 0 and C 0 for stomatocyte, discocyte and echinocyte cell shapes and at corresponding F e x t . The resultant force and motion of i t h membrane vertex was determined according to Equations (A11) and (A12) for F e x t external force, and the equilibrium cell state was determined. The axial diameter ( D A ) was measured along the principal axis of inertia3, whereas the transverse diameter ( D T ) was measured along the principal axis of inertia2 of the equilibrium stretched cell state at F e x t . Refer to Figure A3 for a graphical representation of D A and D T .
Figure A3. Measurement of axial ( D A ) and transverse ( D T ) diameters of a RBC at equilibrium cell stretched state.
Applsci 10 03209 g0a3

References

  1. Park, H.; Lee, S.; Ji, M.; Kim, K.; Son, Y.; Jang, S.; Park, Y. Measuring cell surface area and deformability of individual human red blood cells over blood storage using quantitative phase imaging. Sci. Rep. 2016, 6, 34257. [Google Scholar] [CrossRef] [PubMed] [Green Version]
  2. D’Alessandro, A.; Culp-Hill, R.; Reisz, J.A.; Anderson, M.; Fu, X.; Nemkov, T.; Gehrke, S.; Zheng, C.; Kanias, T.; Guo, Y.; et al. Heterogeneity of blood processing and storage additives in different centers impacts stored red blood cell metabolism as much as storage time: Lessons from REDS-III—Omics. Transfusion 2019, 59, 89–100. [Google Scholar] [CrossRef] [PubMed]
  3. Bosman, G.J.C.G.M.; Werre, J.M.; Willekens, F.L.A.; Novotný, V.M.J. Erythrocyte ageing in vivo and in vitro: Structural aspects and implications for transfusion. Transfus. Med. 2008, 18, 335–347. [Google Scholar] [CrossRef] [PubMed]
  4. Sparrow, R.L. Time to revisit red blood cell additive solutions and storage conditions: A role for “omics” analyses. Blood Transfus. 2012, 10, 7–11. [Google Scholar]
  5. Mustafa, I.; al Marwani, A.; Nasr, K.M.; Kano, N.A.; Hadwan, T. Time dependent assessment of morphological changes: Leukodepleted packed red blood cells stored in SAGM. Biomed. Res. Int. 2016, 2016, 4529434. [Google Scholar] [CrossRef] [PubMed] [Green Version]
  6. D’Alessandro, A.; Liumbruno, G.M. Red blood cell storage and clinical outcomes: New insights. Blood Transfus. 2017, 15, 101–103. [Google Scholar] [PubMed]
  7. D’Alessandro, A.; Gray, A.D.; Sczcepiorkowski, Z.M.; Hansen, K.; Herschel, L.H.; Dumont, L.J. Red blood cell metabolic responses to refrigerated storage, rejuvenation, and frozen storage. Transfusion 2017, 57, 1019–1030. [Google Scholar] [CrossRef] [Green Version]
  8. Kozlova, E.; Chernysh, A.; Moroz, V.; Sergunova, V.; Gudkova, O.; Manchenko, E. Morphology, membrane nanostructure and stiffness for quality assessment of packed red blood cells. Sci. Rep. 2017, 7, 7846. [Google Scholar] [CrossRef] [Green Version]
  9. Roussel, C.; Dussiot, M.; Marin, M.; Morel, A.; Ndour, P.A.; Duez, J.; Kim, C.L.V.; Hermine, O.; Colin, Y.; Buffet, P.A.; et al. Spherocytic shift of red blood cells during storage provides a quantitative whole cell–based marker of the storage lesion. Transfusion 2017, 57, 1007–1018. [Google Scholar] [CrossRef]
  10. Sierra, F.D.A.; Melzak, K.A.; Janetzko, K.; Klueter, H.; Suhr, H.; Bieback, K.; Wiedemann, P. Flow morphometry to assess the red blood cell storage lesion. Cytom. Part A 2017, 91, 874–882. [Google Scholar] [CrossRef] [Green Version]
  11. Tuo, W.W.; Wang, D.; Liang, W.J.; Huang, Y.X. How cell number and cellular properties of blood-banked red blood cells of different cell ages decline during storage. PLoS ONE 2014, 9, 105692. [Google Scholar] [CrossRef]
  12. Holme, S. Current issues related to the quality of stored RBCs. Transfus. Apher. Sci. 2005, 33, 55–61. [Google Scholar] [CrossRef]
  13. Zehnder, L.; Schulzki, T.; Goede, J.S.; Hayes, J.; Reinhart, W.H. Erythrocyte storage in hypertonic (SAGM) or isotonic (PAGGSM) conservation medium: Influence on cell properties. Vox Sang. 2008, 95, 280–287. [Google Scholar] [CrossRef] [PubMed]
  14. Bhaduri, B.; Kandel, M.; Brugnara, C.; Tangella, K.; Popescu, G. Optical assay of erythrocyte function in banked blood. Sci. Rep. 2014, 4, 6211. [Google Scholar] [CrossRef] [PubMed]
  15. Antonelou, M.H.; Kriebardis, A.G.; Stamoulis, K.E.; Economou-Petersen, E.; Margaritis, L.H.; Papassideri, I.S. Red blood cell aging markers during storage in citrate-phosphate-dextrose-saline-adenine-glucose-mannitol. Transfusion 2010, 50, 376–389. [Google Scholar] [CrossRef] [PubMed]
  16. Tzounakas, V.L.; Kriebardis, A.G.; Seghatchian, J.; Papassideri, I.S.; Antonelou, M.H. Unraveling the Gordian knot: Red blood cell storage lesion and transfusion outcomes. Blood Transfus. 2017, 15, 126–130. [Google Scholar] [PubMed]
  17. Xu, Z.; Pu, H.; Xie, S.; Wang, C.; Sun, Y. Microfluidic measurement of RBC bending stiffness changes in blood storage. In Proceedings of the 19th International Conference on Solid-State Sensors, Actuators and Microsystems (TRANSDUCERS), Kaohsiung, Taiwan, 18–22 June 2017; pp. 734–737. [Google Scholar]
  18. Xu, Z.; Zheng, Y.; Wang, X.; Shehata, N.; Wang, C.; Sun, Y. Stiffness Increase of red blood cells during storage. Microsyst. Nanoeng. 2018, 4, 17103. [Google Scholar] [CrossRef] [Green Version]
  19. Yoshida, T.; Prudent, M.; D’Alessandro, A. Red blood cell storage lesion: Causes and potential clinical consequences. Blood Transfus. 2019, 17, 27–52. [Google Scholar]
  20. Frank, S.M.; Abazyan, B.; Ono, M.; Hogue, C.W.; Cohen, D.B.; Berkowitz, D.E.; Ness, P.M.; Barodka, V.M. Decreased erythrocyte deformability after transfusion and the effects of erythrocyte storage duration. Anesth. Analg. 2013, 116, 975–981. [Google Scholar] [CrossRef] [Green Version]
  21. Obrador, R.; Musulin, S.; Hansen, B. Red blood cell storage lesion. J. Vet. Emerg. Crit. Care 2015, 25, 187–199. [Google Scholar] [CrossRef]
  22. Antonelou, M.H.; Seghatchian, J. Insights into red blood cell storage lesion: Toward a new appreciation. Transfus. Apher. Sci. 2016, 55, 292–301. [Google Scholar] [CrossRef] [PubMed]
  23. D’Alessandro, A. Red blood cell storage lesion. ISBT Sci. Ser. 2017, 12, 207–213. [Google Scholar] [CrossRef]
  24. Matthews, K.; Myrand-Lapierre, M.-E.; Ang, R.R.; Duffy, S.P.; Scott, M.D.; Ma, H. Microfluidic deformability analysis of the red cell storage lesion. J. Biomech. 2015, 48, 4065–4072. [Google Scholar] [CrossRef] [PubMed]
  25. Song, H.; Liu, Y.; Zhang, B.; Tian, K.; Zhu, P.; Lu, H.; Tang, Q. Study of in vitro RBCs membrane elasticity with AOD scanning optical tweezers. Biomed. Opt. Express 2017, 8, 384–394. [Google Scholar] [CrossRef] [PubMed]
  26. Zheng, Y.; Chen, J.; Cui, T.; Shehata, N.; Wang, C.; Sun, Y. Characterization of red blood cell deformability change during blood storage. Lab Chip 2014, 14, 577–583. [Google Scholar] [CrossRef]
  27. Dao, M.; Lim, C.T.; Suresh, S. Mechanics of the human red blood cell deformed by optical tweezers. J. Mech. Phys. Solids 2003, 51, 2259–2280. [Google Scholar] [CrossRef]
  28. Kuzman, D.; Svetina, S.; Waugh, R.E.; Žekš, B. Elastic properties of the red blood cell membrane that determine echinocyte deformability. Eur. Biophys. J. 2004, 33, 1–15. [Google Scholar] [CrossRef]
  29. Kim, Y.; Kim, K.; Park, Y.K. Measurement techniques for red blood cell deformability: Recent advances. In Blood Cell—An Overview of Studies in Hematology; Moschandreou, T.E., Ed.; InTech: New York, NY, USA, 2012; Volume 10, pp. 167–194. [Google Scholar]
  30. Chang, H.-Y.; Li, X.; Li, H.; Karniadakis, G.E. MD/DPD Multiscale Framework for Predicting Morphology and Stresses of Red Blood Cells in Health and Disease. PLoS Comput. Biol. 2016, 12, 1005173. [Google Scholar] [CrossRef] [Green Version]
  31. Li, X.; Dao, M.; Lykotrafitis, G.; Karniadakis, G.E. Biomechanics and biorheology of red blood cells in sickle cell anemia. J. Biomech. 2016, 50, 34–41. [Google Scholar] [CrossRef] [Green Version]
  32. Li, H.; Lu, L.; Li, X.; Buffet, P.A.; Dao, M.; Karniadakis, G.E.; Suresh, S. Mechanics of diseased red blood cells in human spleen and consequences for hereditary blood disorders. Proc. Natl. Acad. Sci. USA 2018, 115, 9574–9579. [Google Scholar] [CrossRef] [Green Version]
  33. Wang, Y.; You, G.; Chen, P.; Li, J.; Chen, G.; Wang, B.; Li, P.; Han, D.; Zhou, H.; Zhao, L. The mechanical properties of stored red blood cells measured by a convenient microfluidic approach combining with mathematic model. Biomicrofluidics 2016, 10, 024104. [Google Scholar] [CrossRef] [PubMed] [Green Version]
  34. Card, R.T.; Mohandas, N.; Mollison, P.L. Relationship of post-transfusion viability to deformability of stored red-cells. Br. J. Haematol. 1983, 53, 237–240. [Google Scholar] [CrossRef] [PubMed]
  35. Van de Watering, L. More data on red blood cell storage could clarify confusing clinical outcomes. Transfusion 2014, 54, 501–502. [Google Scholar] [CrossRef] [PubMed]
  36. Huruta, R.R.; Barjas-Castro, M.L.; Saad, S.T.O.; Costa, F.F.; Fontes, A.; Barbosa, L.C.; Cesar, C.L. Mechanical properties of stored red blood cells using optical tweezers. Blood 1998, 92, 2975–2977. [Google Scholar] [CrossRef]
  37. Ramirez-Arcos, S.; Marks, D.C.; Acker, J.P.; Sheffield, W.P. Quality and safety of blood products. J. Blood Transfus. 2016, 2016, 2482157. [Google Scholar] [CrossRef]
  38. Czerwinska, J.; Wolf, S.M.; Mohammadi, H.; Jeney, S. Red blood cell aging during storage, studied using optical tweezers experiment. Cell. Mol. Bioeng. 2015, 8, 258–266. [Google Scholar] [CrossRef]
  39. Dao, M.; Li, J.; Suresh, S. Molecularly based analysis of deformation of spectrin network and human erythrocyte. Mater. Sci. Eng. C 2006, 26, 1232–1244. [Google Scholar] [CrossRef]
  40. Lim, C.T.; Dao, M.; Suresh, S.; Sow, C.H.; Chew, K.T. Large deformation of living cells using laser traps. Acta Mater. 2004, 52, 1837–1845. [Google Scholar] [CrossRef]
  41. Mills, J.P.; Qie, L.; Dao, M.; Lim, C.T.; Suresh, S. Nonlinear elastic and viscoelastic deformation of the human red blood cell with optical tweezers. Mech. Chem. Biosyst. 2004, 1, 169–180. [Google Scholar]
  42. Fedosov, D.A.; Dao, M.; Karniadakis, G.E.; Suresh, S. Computational biorheology of human blood flow in health and disease. Ann. Biomed. Eng. 2014, 42, 368–387. [Google Scholar] [CrossRef] [Green Version]
  43. Fedosov, D.A.; Noguchi, H.; Gompper, G. Multiscale modeling of blood flow: From single cells to blood rheology. Biomech. Model. Mechanobiol. 2014, 13, 239–258. [Google Scholar] [CrossRef] [PubMed]
  44. Jiang, L.-G.; Wu, H.-A.; Zhou, X.-Z.; Wang, X.-X. Coarse-grained molecular dynamics simulation of a red blood cell. Chin. Phys. Lett. 2010, 27, 028704. [Google Scholar]
  45. Polwaththe-Gallage, H.N.; Saha, S.C.; Gu, Y. Deformation of a three-dimensional red blood cell in a stenosed microcapillary. In Proceedings of the 8th Australasian Congress on Applied Mechanics (ACAM-8), Melbourne, Australia, 23–26 November 2014. [Google Scholar]
  46. Yazdani, A.; Li, X.; Karniadakis, G.E. Dynamic and rheological properties of soft biological cell suspensions. Rheol. Acta 2016, 55, 433–449. [Google Scholar] [CrossRef] [PubMed] [Green Version]
  47. Park, Y.; Best, C.A.; Badizadegan, K.; Dasari, R.R.; Feld, M.S.; Kuriabova, T.; Henle, M.L.; Levine, A.J.; Popescu, G. Measurement of red blood cell mechanics during morphological changes. Proc. Natl. Acad. Sci. USA 2010, 107, 6731–6736. [Google Scholar] [CrossRef] [PubMed] [Green Version]
  48. Israelachvili, J.N. (Ed.) Intermolecular and Surface Forces, 3rd ed.; Academic Press: San Diego, CA, USA, 2011. [Google Scholar]
  49. Iglič, A.; Kralj-Iglič, V.; Hägerstrand, H. Amphiphile induced echinocyte-spheroechinoeyte transformation of red blood cell shape. Eur. Biophys. J. 1998, 27, 335–339. [Google Scholar] [PubMed]
  50. Mukhopadhyay, R.; Lim, G.; Wortis, M. Echinocyte shapes: Bending, stretching, and shear determine spicule shape and spacing. Biophys. J. 2002, 82, 1756–1772. [Google Scholar] [CrossRef] [Green Version]
  51. Rudenko, S.V. Erythrocyte morphological states, phases, transitions and trajectories. Biochim. Biophys. Acta (BBA)—Biomembr. 2010, 1798, 1767–1778. [Google Scholar] [CrossRef] [Green Version]
  52. Rudenko, S.V.; Saeid, M.K. Reconstruction of erythrocyte shape during modified morphological response. Biochemistry (Moscow) 2010, 75, 1025–1031. [Google Scholar] [CrossRef]
  53. Etcheverry, S.; Gallardo, M.J.; Solano, P.; Suwalsky, M.; Mesquita, O.N.; Saavedra, C. Real-time study of shape and thermal fluctuations in the echinocyte transformation of human erythrocytes using defocusing microscopy. J. Biomed. Opt. 2012, 17, 106013. [Google Scholar] [CrossRef] [Green Version]
  54. Chen, M.; Boyle, F.J. An enhanced spring-particle model for red blood cell structural mechanics: Application to the stomatocyte–discocyte–echinocyte transformation. J. Biomech. Eng. 2017, 139, 121009. [Google Scholar] [CrossRef]
  55. Wong, P. A basis of echinocytosis and stomatocytosis in the disc–sphere transformations of the erythrocyte. J. Theor. Biol. 1999, 196, 343–361. [Google Scholar] [CrossRef] [PubMed]
  56. Peng, Z.; Asaro, R.J.; Zhu, Q. Multiscale simulation of erythrocyte membranes. Phys. Rev. E 2010, 81, 031904. [Google Scholar] [CrossRef] [PubMed]
  57. Fedosov, D.A.; Caswell, B.; Karniadakis, G.E. Coarse-grained red blood cell model with accurate mechanical properties, rheology and dynamics. In Proceedings of the Annual International Conference of the IEEE Engineering in Medicine and Biology Society, Minneapolis, MN, USA, 2–6 September 2009; Volume 1–20, pp. 4266–4269. [Google Scholar]
  58. Fedosov, D.A.; Caswell, B.; Karniadakis, G.E. Systematic coarse-graining of spectrin-level red blood cell models. Comput. Methods Appl. Mech. Eng. 2010, 199, 1937–1948. [Google Scholar] [CrossRef] [PubMed] [Green Version]
  59. Fedosov, D.A.; Caswell, B.; Karniadakis, G.E. A multiscale red blood cell model with accurate mechanics, rheology, and dynamics. Biophys. J. 2010, 98, 2215–2225. [Google Scholar] [CrossRef] [Green Version]
  60. Peng, Z.; Asaro, R.J.; Zhu, Q. Multiscale modelling of erythrocytes in Stokes flow. J. Fluid Mech. 2011, 686, 299–337. [Google Scholar] [CrossRef] [Green Version]
  61. Peng, Z.; Li, X.; Pivkin, I.V.; Dao, M.; Karniadakis, G.E.; Suresh, S. Lipid bilayer and cytoskeletal interactions in a red blood cell. Proc. Natl. Acad. Sci. USA 2013, 110, 13356–13361. [Google Scholar] [CrossRef] [Green Version]
  62. Tomaiuolo, G. Biomechanical properties of red blood cells in health and disease towards microfluidics. Biomicrofluidics 2014, 8, 051501. [Google Scholar] [CrossRef] [Green Version]
  63. Ju, M.; Ye, S.S.; Namgung, B.; Cho, S.; Low, H.T.; Leo, H.L.; Kim, S. A review of numerical methods for red blood cell flow simulation. Comput. Methods Biomech. Biomed. Eng. 2015, 18, 130–140. [Google Scholar] [CrossRef]
  64. Monzel, C.; Sengupta, K. Measuring shape fluctuations in biological membranes. J. Phys. D—Appl. Phys. 2016, 49, 243002. [Google Scholar] [CrossRef] [Green Version]
  65. Bento, D.; Rodrigues, R.; Faustino, V.; Pinho, D.; Fernandes, C.; Pereira, A.; Garcia, V.; Miranda, J.; Lima, R. Deformation of red blood cells, air bubbles, and droplets in microfluidic devices: Flow visualizations and measurements. Micromachines 2018, 9, 151. [Google Scholar] [CrossRef] [Green Version]
  66. Polwaththe-Gallage, H.N.; Saha, S.C.; Sauret, E.; Flower, R.; Senadeera, W.; Gu, Y. SPH-DEM approach to numerically simulate the deformation of three-dimensional RBCs in non-uniform capillaries. Biomed. Eng. Online 2016, 15, 354–370. [Google Scholar] [CrossRef] [PubMed] [Green Version]
  67. Barns, S.; Balanant, M.A.; Sauret, E.; Flower, R.; Saha, S.; Gu, Y. Investigation of red blood cell mechanical properties using AFM indentation and coarse-grained particle method. Biomed. Eng. Online 2017, 16, 140. [Google Scholar] [CrossRef] [PubMed] [Green Version]
  68. Li, X.; Li, H.; Chang, H.-Y.; Lykotrafitis, G.; Karniadakis, G.E. Computational biomechanics of human red blood cells in hematological disorders. J. Biomech. Eng. 2017, 139, 021008. [Google Scholar] [CrossRef] [PubMed]
  69. Ademiloye, A.S.; Zhang, L.W.; Liew, K.M. A multiscale framework for large deformation modeling of RBC membranes. Comput. Methods Appl. Mecha. Eng. 2018, 329, 144–167. [Google Scholar] [CrossRef]
  70. Ademiloye, A.S.; Zhang, L.W.; Liew, K.M. Atomistic–continuum model for probing the biomechanical properties of human erythrocyte membrane under extreme conditions. Comput. Methods Appl. Mech. Eng. 2017, 325, 22–36. [Google Scholar] [CrossRef]
  71. Hénon, S.; Lenormand, G.; Richert, A.; Gallet, F. A new determination of the shear modulus of the human erythrocyte membrane using optical tweezers. Biophys. J. 1999, 76, 1145–1151. [Google Scholar] [CrossRef] [Green Version]
  72. Liang, Y.; Xiang, Y.; Lamstein, J.; Bezryadina, A.; Chen, Z. Cell deformation and assessment with tunable “tug-of-war” optical tweezers. In Conference on Lasers and Electro-Optics; Optical Society of America: San Jose, CA, USA, 2019. [Google Scholar]
  73. Imai, Y.; Omori, T.; Shimogonya, Y.; Yamaguchi, T.; Ishikawa, T. Numerical methods for simulating blood flow at macro, micro, and multi scales. J. Biomech. 2016, 49, 2221–2228. [Google Scholar] [CrossRef]
  74. Lim, G.H.W.; Wortis, M.; Mukhopadhyay, R. Stomatocyte–discocyte–echinocyte sequence of the human red blood cell: Evidence for the bilayer– couple hypothesis from membrane mechanics. Proc. Natl. Acad. Sci. USA 2002, 99, 16766–16769. [Google Scholar] [CrossRef] [Green Version]
  75. Lim, G.H.W.; Wortis, M.; Mukhopadhyay, R. Red blood cell shapes and shape transformations: Newtonian mechanics of a composite membrane: Sections 2.5–2.8. Soft Matter 2009, 4, 139–204. [Google Scholar]
  76. Geekiyanage, N.M.; Balanant, M.A.; Sauret, E.; Saha, S.; Flower, R.; Lim, C.T.; Gu, Y. A coarse-grained red blood cell membrane model to study stomatocyte-discocyte-echinocyte morphologies. PLoS ONE 2019, 14, 0215447. [Google Scholar] [CrossRef] [Green Version]
  77. Bessis, M. Red cell shapes. An illustrated classification and its rationale. In Red Cell Shape; Springer: Berlin/Heidelberg, Germany, 1973; Volume 12, pp. 721–746, no. 6. [Google Scholar]
  78. Jaferzadeh, K.; Moon, I. Quantitative investigation of red blood cell three-dimensional geometric and chemical changes in the storage lesion using digital holographic microscopy. J. Biomed. Opt. 2015, 20, 111218. [Google Scholar] [CrossRef] [PubMed]
  79. Veale, M.F.; Healey, G.; Sparrow, R.L. Effect of additive solutions on red blood cell (RBC) membrane properties of stored RBCs prepared from whole blood held for 24 hours at room temperature. Transfusion 2011, 51, 25–33. [Google Scholar] [CrossRef] [PubMed]
  80. Rodriguez, J.; Edeskär, T.; Knutsson, S. Particle shape quantities and measurement techniques: A review. Electron. J. Geotech. Eng. 2013, 18, 169–198. [Google Scholar]
  81. Brecher, G.; Bessis, M. Present status of spiculed red cells and their relationship to the discocyte-echinocyte transformation: A critical review. Blood 1972, 40, 333–344. [Google Scholar] [CrossRef] [PubMed] [Green Version]
  82. Li, H.; Lykotrafitis, G. Vesiculation of healthy and defective red blood cells. Phys. Rev. E 2015, 92, 012715. [Google Scholar] [CrossRef] [Green Version]
  83. Li, Y.; Wen, C.; Xie, H.; Ye, A.; Yin, Y. Mechanical property analysis of stored red blood cell using optical tweezers. Colloids Surf. B Biointerfaces 2009, 70, 169–173. [Google Scholar] [CrossRef]
  84. Li, H.; Lykotrafitis, G. Erythrocyte membrane model with explicit description of the lipid bilayer and the spectrin network. Biophys. J. 2014, 107, 642–653. [Google Scholar] [CrossRef] [Green Version]
  85. Geekiyanage, N.M.; Sauret, E.; Saha, S.C.; Flower, R.L.; Gu, Y.T. Deformation behaviour of stomatocyte, discocyte and echinocyte red blood cell morphologies during optical tweezers stretching. (in eng). Biomech. Model. Mechanobiol. 2020, 1–17. (In English) [Google Scholar] [CrossRef]
  86. Li, J.; Dao, M.; Lim, C.T.; Suresh, S. Spectrin-level modeling of the cytoskeleton and optical tweezers stretching of the erythrocyte. Biophys. J. 2005, 88, 3707–3719. [Google Scholar] [CrossRef] [Green Version]
  87. Suresh, S.; Spatz, J.; Mills, J.P.; Micoulet, A.; Dao, M.; Lim, C.T.; Beil, M.; Seufferlein, T. Connections between single-cell biomechanics and human disease states: Gastrointestinal cancer and malaria. Acta Biomater. 2005, 1, 15–30. [Google Scholar] [CrossRef]
  88. Helfrich, W. Blocked lipid exchange in bilayers and its possible influence on the shape of vesicles. Z. Naturforschung 1974, 29, 510–515. [Google Scholar] [CrossRef] [PubMed]
  89. Svetina, S.; Žekš, B. Membrane bending energy and shape determination of phospholipid vesicles and red blood cells. Eur. Biophys. J. 1989, 17, 101–111. [Google Scholar] [CrossRef] [PubMed]
  90. Seifert, U.; Berndl, K.; Lipowsky, R. Shape transformations of vesicles: Phase diagram for spontaneous- curvature and bilayer-coupling models. Phys. Rev. A 1991, 44, 1182–1202. [Google Scholar] [CrossRef] [PubMed] [Green Version]
  91. Miao, L.; Seifert, U.; Wortis, M.; Döbereiner, H.-G. Budding transitions of fluid-bilayer vesicles: The effect of area-difference elasticity. Phys. Rev. E 1994, 49, 5389–5407. [Google Scholar] [CrossRef] [Green Version]
  92. Nakamura, M.; Bessho, S.; Wada, S. Analysis of red blood cell deformation under fast shear flow for better estimation of hemolysis. Int. J. Numer. Methods Biomed. Eng. 2014, 30, 42–54. [Google Scholar] [CrossRef]
  93. Mohandas, N.; Gallagher, P.G. Red cell membrane: Past, present, and future. Blood 2008, 112, 3939–3948. [Google Scholar] [CrossRef] [Green Version]
Figure 1. Evolution of RBC morphology during in-vitro storage duration. The morphology index ( M I ) corresponding to each RBC morphology is presented.
Applsci 10 03209 g001
Figure 2. The evolution of the Coarse-Grained (CG)-RBC membrane: (a) shear modulus ( μ t ) and (b) bending modulus ( κ t ) during in-vitro storage. μ t and κ t are presented in the form of multiplications of μ t 0 and κ t 0 , respectively.
Applsci 10 03209 g002
Figure 3. Evolution of (a) cell surface area ( A 0 t ), and (b) cell volume ( V 0 t ) of in-vitro stored RBCs.
Applsci 10 03209 g003
Figure 4. The evolution of the CG-RBC membrane model predicted a (a) reference bilayer-leaflet-area-difference ( Δ A 0 t ), and (b) reference total-membrane-curvature ( C 0 t ) during in-vitro RBC storage.
Applsci 10 03209 g004
Figure 5. Shape factors ( S F ) of CG-RBC membrane model-predicted RBC morphologies during in-vitro storage (discocyte at 0   t < 20; echinocyte I at 20   t < 22; echinocyte II at 22   t < 24; echinocyte III at 24   t < 26; and sphero-echinocyte at 26   t   42), and at echinocytic shape-transforming conditions.
Applsci 10 03209 g005
Figure 6. Comparison of (a) number of spicules ( N S p i c u l e s ), (b) average spicule height ( H S p i c u l e s ), (c) average spicule surface area ( A S p i c u l e s ) and (d) average spicule curvature ( C S p i c u l e s ) of CG-RBC membrane model-predicted echinocyte II (at 22   t < 24), echinocyte III (at 24   t < 26) and sphero-echinocyte (at 26   t   42) during in-vitro storage and under echinocytogenic shape-transforming conditions.
Applsci 10 03209 g006
Figure 7. Evolution of elongation index ( E I ) of stored RBCs (discocyte at 0   t < 20; echinocyte I at 20   t < 22; echinocyte II at 22   t < 24; echinocyte III at 24   t < 26; and sphero-echinocyte at 26   t   42) at the total optical tweezers stretching forces of F e x t = 60, 100 and 200 pN.
Applsci 10 03209 g007
Figure 8. The cytoskeletal spectrin network having (a) 0%, (b) 1%, (c) 10% and (d) 25% of defective vertical interactions ( A V e r t i c a l ) at randomly selected actin junctional complexes.
Applsci 10 03209 g008
Figure 9. The equilibrium cell shapes of day 42 sphero-echinocytes with (a) A V e r t i c a l = 0% and (b) A V e r t i c a l = 25%, and the stretched cell state of (a,b) under optical tweezers stretching forces of F e x t = 200 pN; (c,d), respectively. The lines in black on the cell surface indicate the membrane surface supported by the cytoskeleton. The circled regions in black on day 42 sphero-echinocytes with A V e r t i c a l = 25% indicate the sharp projections on the cell surface.
Applsci 10 03209 g009
Figure 10. The change in axial ( D A ) and transverse ( D T ) diameters of stored RBCs with 0%, 1%, 10% and 25% defective vertical interactions ( A V e r t i c a l ) with respect to their analogous recovered cell state at optical tweezers stretching forces of (a) F e x t = 60.0 pN and (b) F e x t = 200.0 pN.
Applsci 10 03209 g010
Figure 11. The error in cell dimensions ( ε ) of recovered stretched RBCs with 0%, 1%, 10% and 25% of defective vertical interactions ( A V e r t i c a l ) with respect to their analogous recovered cell state at optical tweezers stretching forces of (a) F e x t = 60.0 pN and (b) F e x t = 200.0 pN.
Applsci 10 03209 g011
Figure 12. The recovered stretched cell shapes of day 42 sphero-echinocyte RBCs with (a) 0% and (b) 25% of defective vertical interactions ( A V e r t i c a l ) at optical tweezers stretching forces of F e x t = 60.0 pN, and that of RBCs having (c) A V e r t i c a l = 0% and (d) A V e r t i c a l = 25% at F e x t = 200.0 pN.
Applsci 10 03209 g012
Table 1. The CG-RBC membrane model-predicted morphology of in-vitro stored RBC. Shear modulus ( μ t ), bending modulus ( κ t ), cell surface area ( A 0 t ) and cell volume ( V 0 t ) during in-vitro storage are presented in the form of multiplications of μ t 0 , κ t 0 , A 0 t 0 , V 0 t 0 , respectively, which represent the corresponding parameters at t = 0 (Days) (refer to Figure 2 and Figure 3). Δ A 0 t and C 0 t are the reference bilayer-leaflet-area-difference and reference total-membrane-curvature, respectively (refer to Geekiyanage et al. [76]). Cross-sectional view of discocyte morphology is presented.
Days
(t)
CG-RBC Membrane Model Parameters at t RBC Shape
μ t μ t 0 κ t κ t 0 A 0 t A 0 t 0 V 0 t V 0 t 0 Δ A 0 t A 0 t 0
(%)
C 0 t A 0 t 0
(%)
01.0001.0001.0001.0000.1200.185 Applsci 10 03209 i001
71.0001.0000.9760.9740.1200.185 Applsci 10 03209 i002
141.0001.0000.9530.9470.1200.185 Applsci 10 03209 i003
211.4521.9560.9290.9210.1350.200 Applsci 10 03209 i004
231.9052.9110.9230.9130.1900.550 Applsci 10 03209 i005
252.3573.8670.9160.9060.2250.600 Applsci 10 03209 i006
282.5834.3450.9060.8950.3000.900 Applsci 10 03209 i007
352.5834.3450.8620.8350.3000.900 Applsci 10 03209 i008
422.5834.3450.8180.7750.3000.900 Applsci 10 03209 i009

