Article

Experimental Study on the Torsional Behaviour of Prestressed HSC Hollow Beams

1
Department of Civil Engineering and Architecture, Centre of Materials and Building Technologies (C-MADE), University of Beira Interior, 6201-001 Covilhã, Portugal
2
Department of Civil Engineering, Center for Mechanical Engineering, Materials and Processes (CEMMPRE), University of Coimbra, 3030-788 Coimbra, Portugal
*
Author to whom correspondence should be addressed.
Appl. Sci. 2020, 10(2), 642; https://doi.org/10.3390/app10020642
Submission received: 23 December 2019 / Revised: 8 January 2020 / Accepted: 13 January 2020 / Published: 16 January 2020
(This article belongs to the Special Issue Architectural Structure)

Abstract

:
This article describes an experimental program developed to study the influence of longitudinal prestress on the behaviour of high-strength concrete hollow beams under pure torsion. The pre-cracking, the post-cracking and the ultimate behaviour are analysed. Three tests were carried out on large hollow high-strength concrete beams with similar concrete strength. The variable studied was the level of longitudinal uniform prestress. Some important conclusions on different aspects of the beams’ behaviour are presented. These conclusions, considered important for the design of box bridges, include the influence of the level of prestress in the cracking and ultimate behaviour.

1. Introduction

Pure torsion does not really occur too often in concrete structures; it usually occurs together with other internal forces such as shear, bending and axial forces. However, in some structures, such as the case of curved box bridges, the torsional action can be very important for design.
The application of prestress usually increases the cracking and ultimate resistances of concrete structures. Prestress is particularly important in High-Strength Concrete (HSC) structures. In general, HSC structures are expected to be more flexible than Normal-Strength Concrete (NSC) structures because of the smaller cross-section area of members. This high flexibility could be problematic for the serviceability limit states. The use of the prestress technique can also help to solve such problems associated with high flexibility.
The application of longitudinal prestress in members under high torsional loads is a common situation, as for instance in curved bridges. Many of such structures are also built with HSC and use hollow cross-sections for the girders (Figure 1) because they present some advantages when compared to solid cross-sections. In large cross-sections under high torsion, the internal shear flow is mainly absorbed by the outer concrete shell. Thus, the concrete at the centre zone of the cross-section is redundant and can be removed. As a consequence, hollow cross-sections allow for a high reduction in weight and concrete consumption, without compromising the torsional strength.
Since the end of the last century, it is well known that the uniaxial stress-strain curve for HSC is quite different from that for NSC [1]. Therefore, it is not obvious that the computing and design models for HSC members can be directly extrapolated from NSC. Nowadays, many codes of practice already include HSC range. However, some aspects of the structural behaviour of HSC members still need to be studied in order to check if the physical models accepted for NSC can be adopted for HSC. The response of HSC beams to torsional loads constitutes an example of such cases.
There are still few experimental studies on hollow beams under pure torsion reported in the literature and most of them involve only a small number of NSC beams [2,3,4,5]. Only some few recent works report new results for both NSC and HSC hollow beams [6,7]. When compared with NSC beams, such studies demonstrate some of the advantages of HSC, namely, to increase the cracking and ultimate torsional strengths, as well as the torsional stiffness of the beams. However, some disadvantages of using HSC are also pointed out, in particular related to the torsional ductility which constitutes an important property to be considered for design. By using the experimental results reported in the previously referred experimental studies and also by using numerical models, other recent studies show that some ductility can be observed in NSC beams under torsion, namely for a certain range of the torsional reinforcement. However, almost no torsional ductility in HSC beams under torsion is observed [8,9,10]. Such studies also show that the level of the observed torsional ductility is normally low when compared with flexural ductility [11,12].
Few previous studies leading with testing of prestressed concrete rectangular beams under torsion can be found in the literature, namely—Mitchell and Collins in 1974 [4], El-Degwy and McMullen in 1985 [13], Hsu and Mo in 1985 [14] and Wafa et al. in 1995 [15]. Among the beams tested in the referred studies (twenty-seven beams), only three where hollow and built with NSC. This is because building hollow beams for testing is more complicated when compared with solid beams. Furthermore, due to the complexity of the experimental program, only a constant longitudinal prestressing was considered in all the referred studies. The authors did not find any previous study on the experimental behaviour of HSC prestressed hollow beams under torsion.
From the foregoing, experimental studies on the behaviour of prestressed hollow beams under torsion are needed, in particular for HSC beams. This article presents an experimental study on the global behaviour of HSC hollow beams with uniform longitudinal prestress. The beams were loaded under pure torsion and tested up to failure. As for the previous referred studies, a uniform longitudinal prestress was applied. This was considered to be sufficient to give some indications on the influence of prestress on the behaviour of HSC hollow beams under torsion.

2. Experimental Program
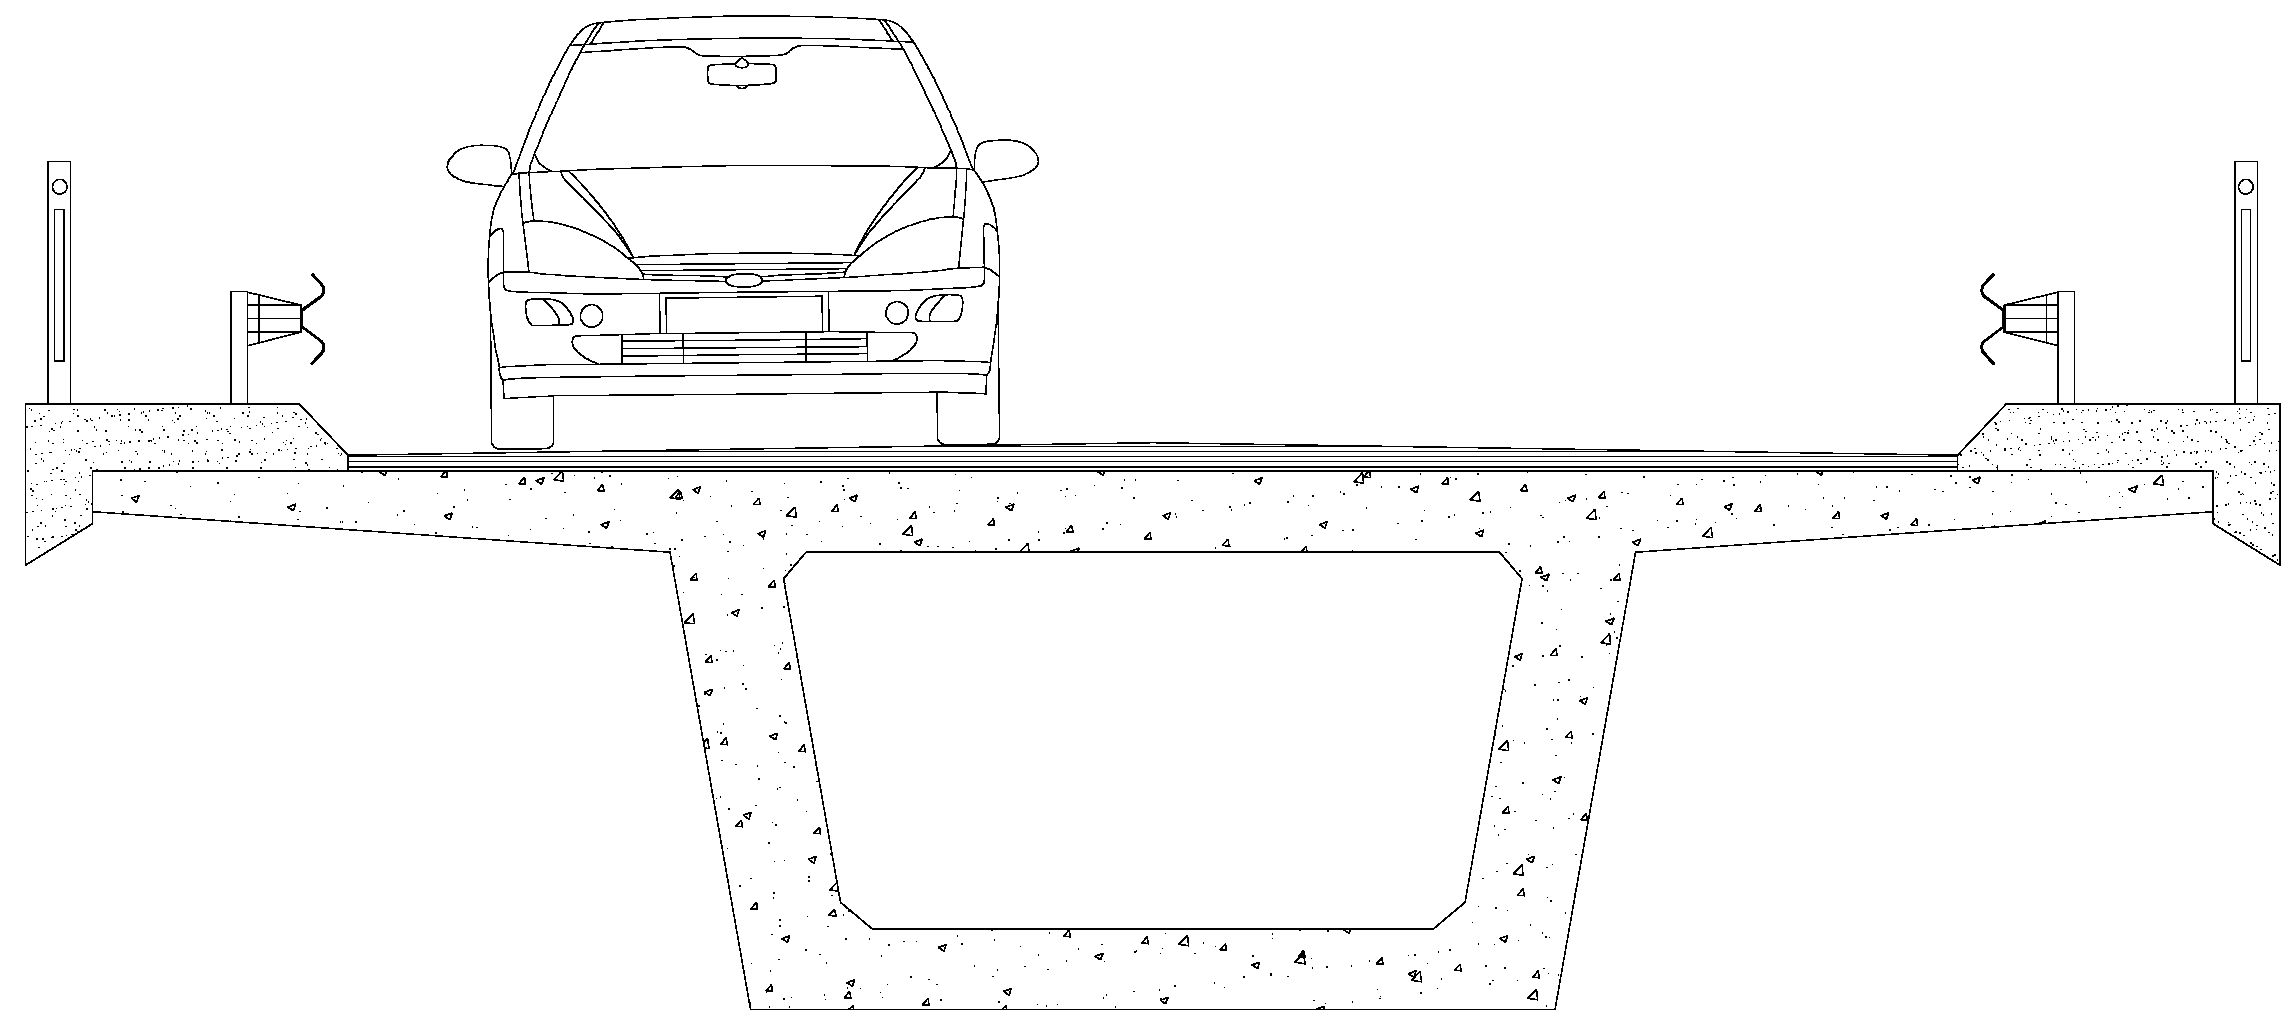
2.1. Test Specimens

For this study, three hollow beams were tested up to failure. The beams had a squared cross-section and were 5.90 m long. During testing, the beams had an extremity fixed to the strong floor of the laboratory and the load was applied to the other extremity by an electromechanical actuator. In this extremity, a special device transformed the linear point load applied by the actuator into a torque applied to the beam extremity. The dimensions of the test models are presented in Figure 2. The geometry and dimensions of the adopted cross-section are in line with some of the works previously referred and leading with hollow beams.
External prestressing was applied through four 0.6′′ wires (0.6 inches or 1.52 cm diameter) centred in the cross-section (Figure 2). The torsional reinforcement ratio was kept constant for the three beams and it corresponds to an average value which was defined accounting for the range of values that were used in a previous experimental work on similar beams with no prestressing [6]. The concrete strength was approximately constant, varying between 77.8 and 80.8 MPa. The average level of stress in concrete induced by prestress ( f c p ) varied between 0 MPa (beam with no prestress) and 3.08 MPa, after short term losses. The maximum value is not very high because the losses were somewhat important. This is because the effect of anchorage slip becomes important when the length of the wires is relatively small.
Table 1 summarizes the characteristics of each test beam, namely—the real thickness of the walls of the cross-section ( t ), the distance between parallel branches of stirrups, x 1 and y 1 , the total area of ordinary longitudinal reinforcement ( A s l ), the area of one branch of the transverse reinforcement ( A s t ), the longitudinal spacing of the stirrups ( s ), the total area of prestress longitudinal reinforcement ( A s p ), the ratios of longitudinal reinforcement ( ρ l = A s l / A c , where A c = x y and x = y = 60   cm ) and transverse reinforcement ( ρ t = A s t u / A c s , where u = 2 ( x 1 + y 1 ) ), the total ratio of reinforcement ( ρ t o t = ρ l + ρ t ), the balanced ratio of the longitudinal to transverse reinforcement ( m b = A s l s / A s t u ) and the average values for the compressive concrete strength obtained from cylindrical specimens ( f c ).
The beams are named according to the series to which they belong (series D) and to the average stress (in MPa) in concrete induced by prestress, f c p , after short term losses.

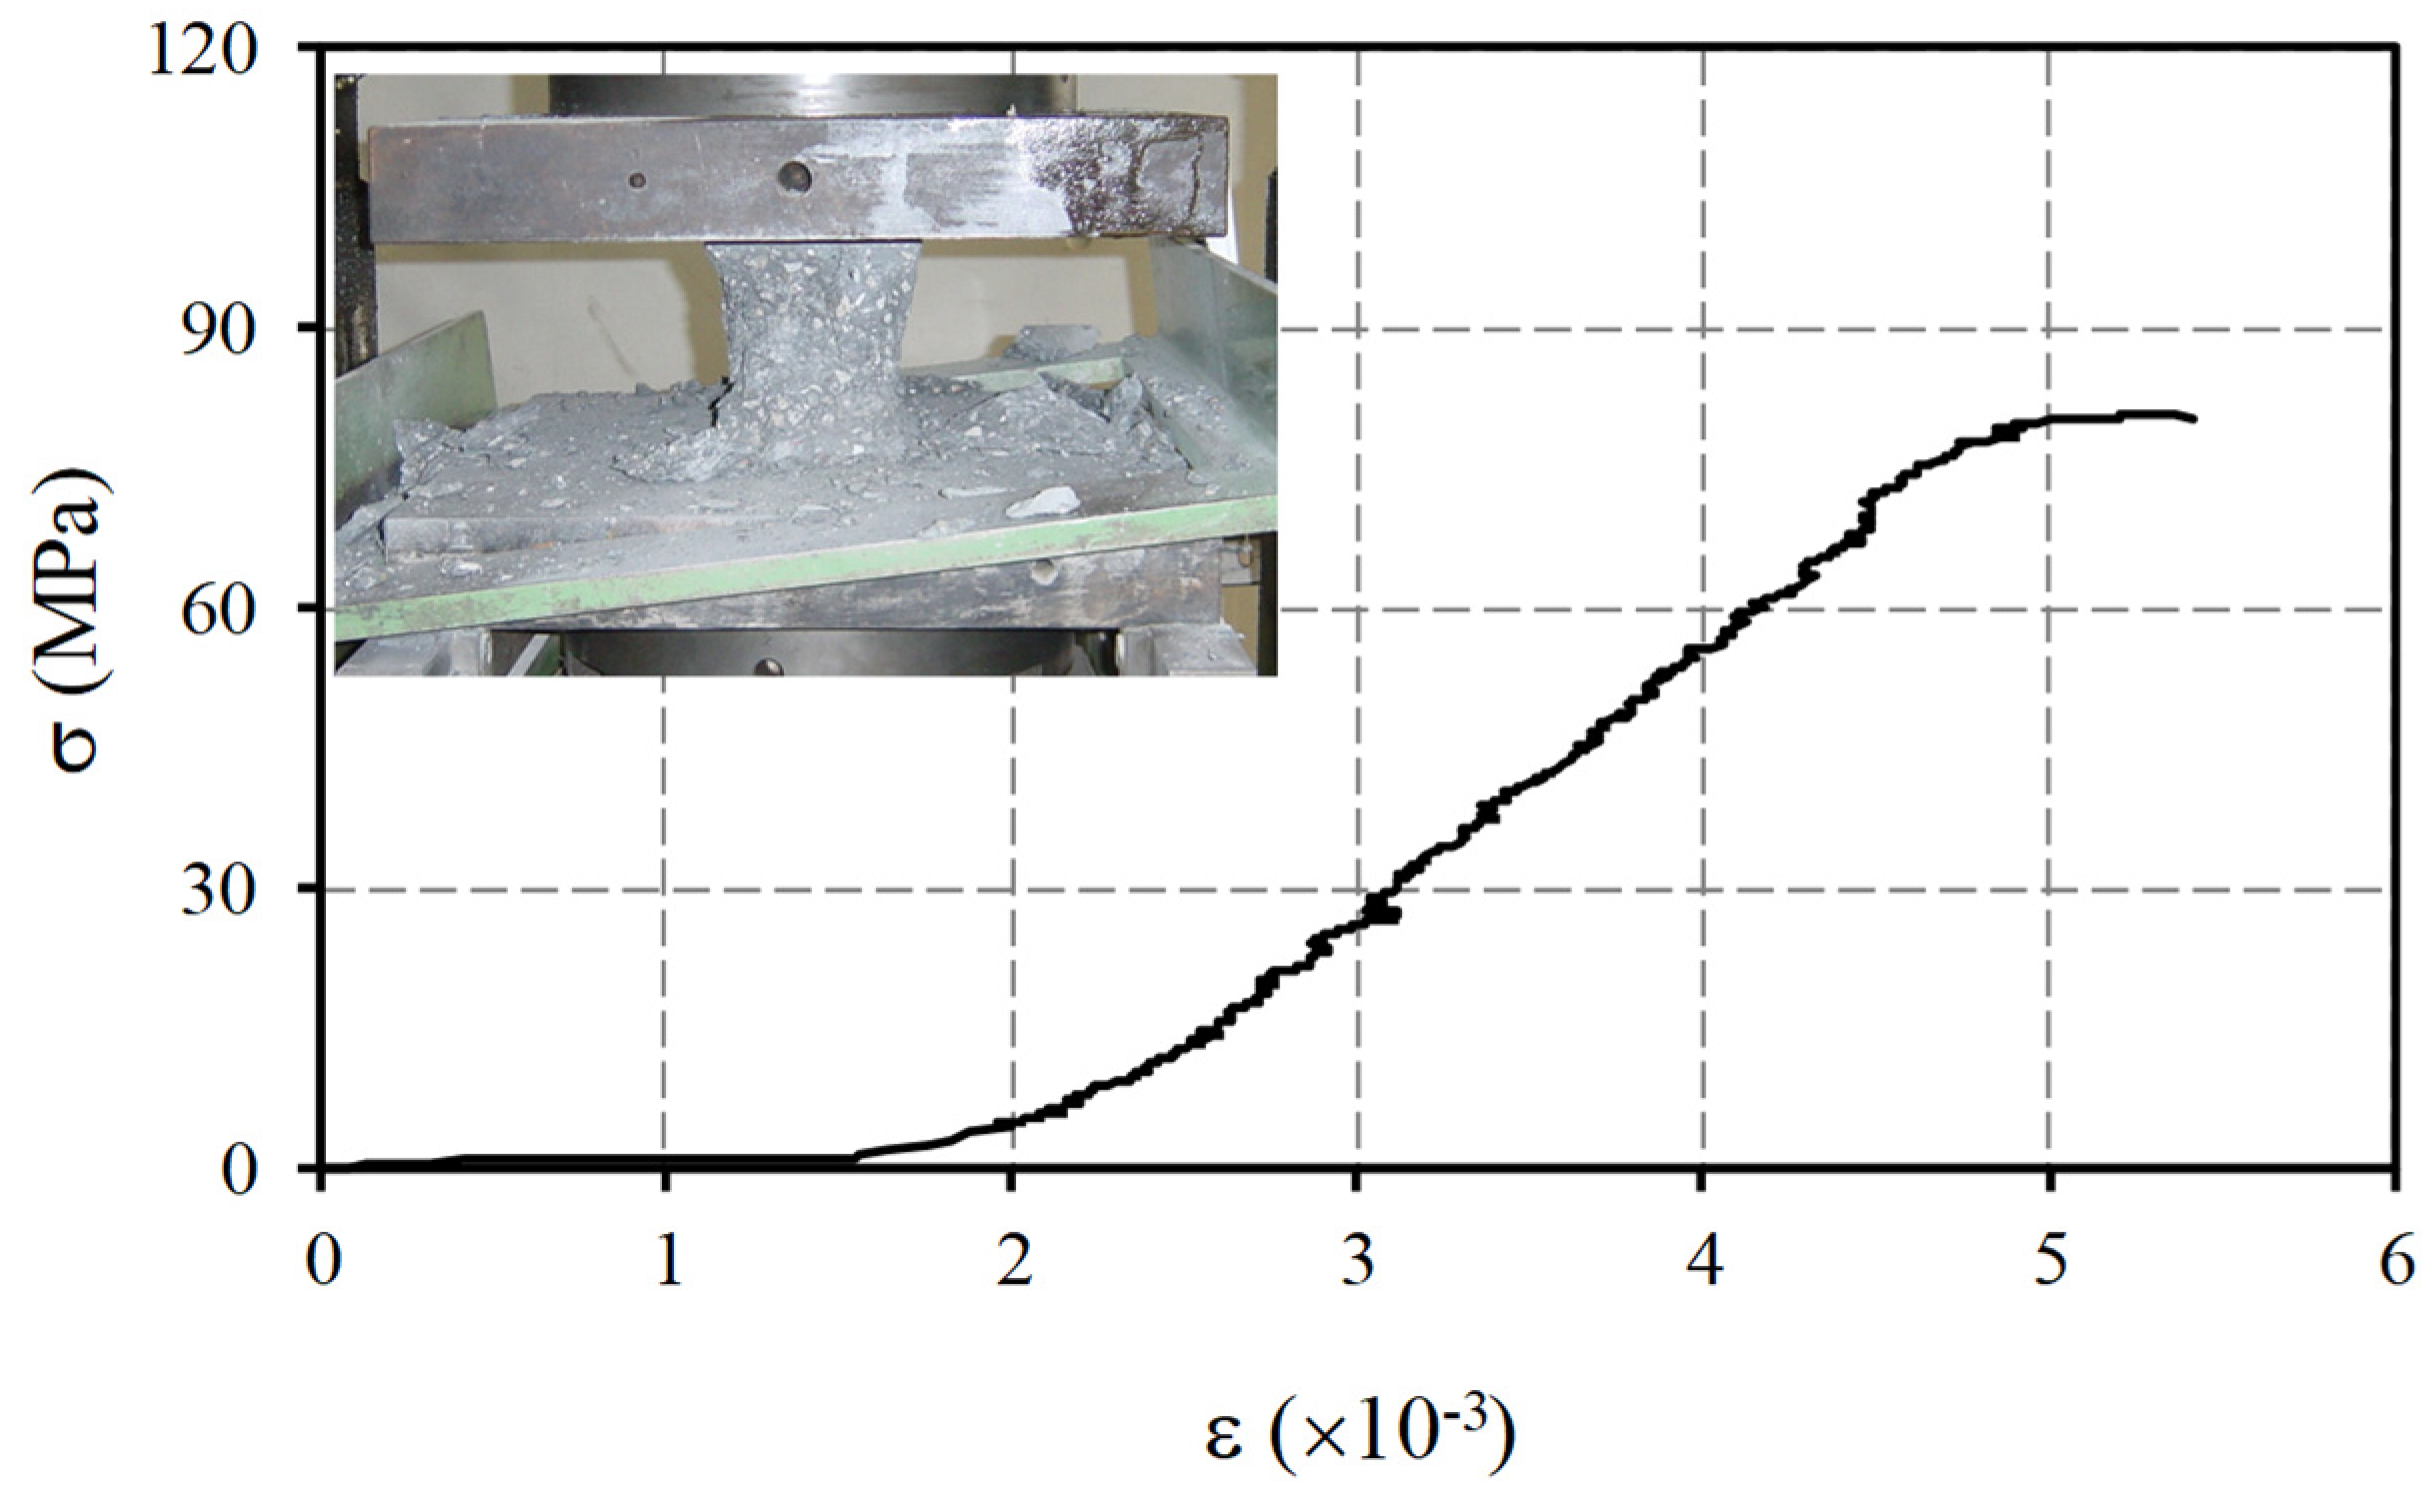
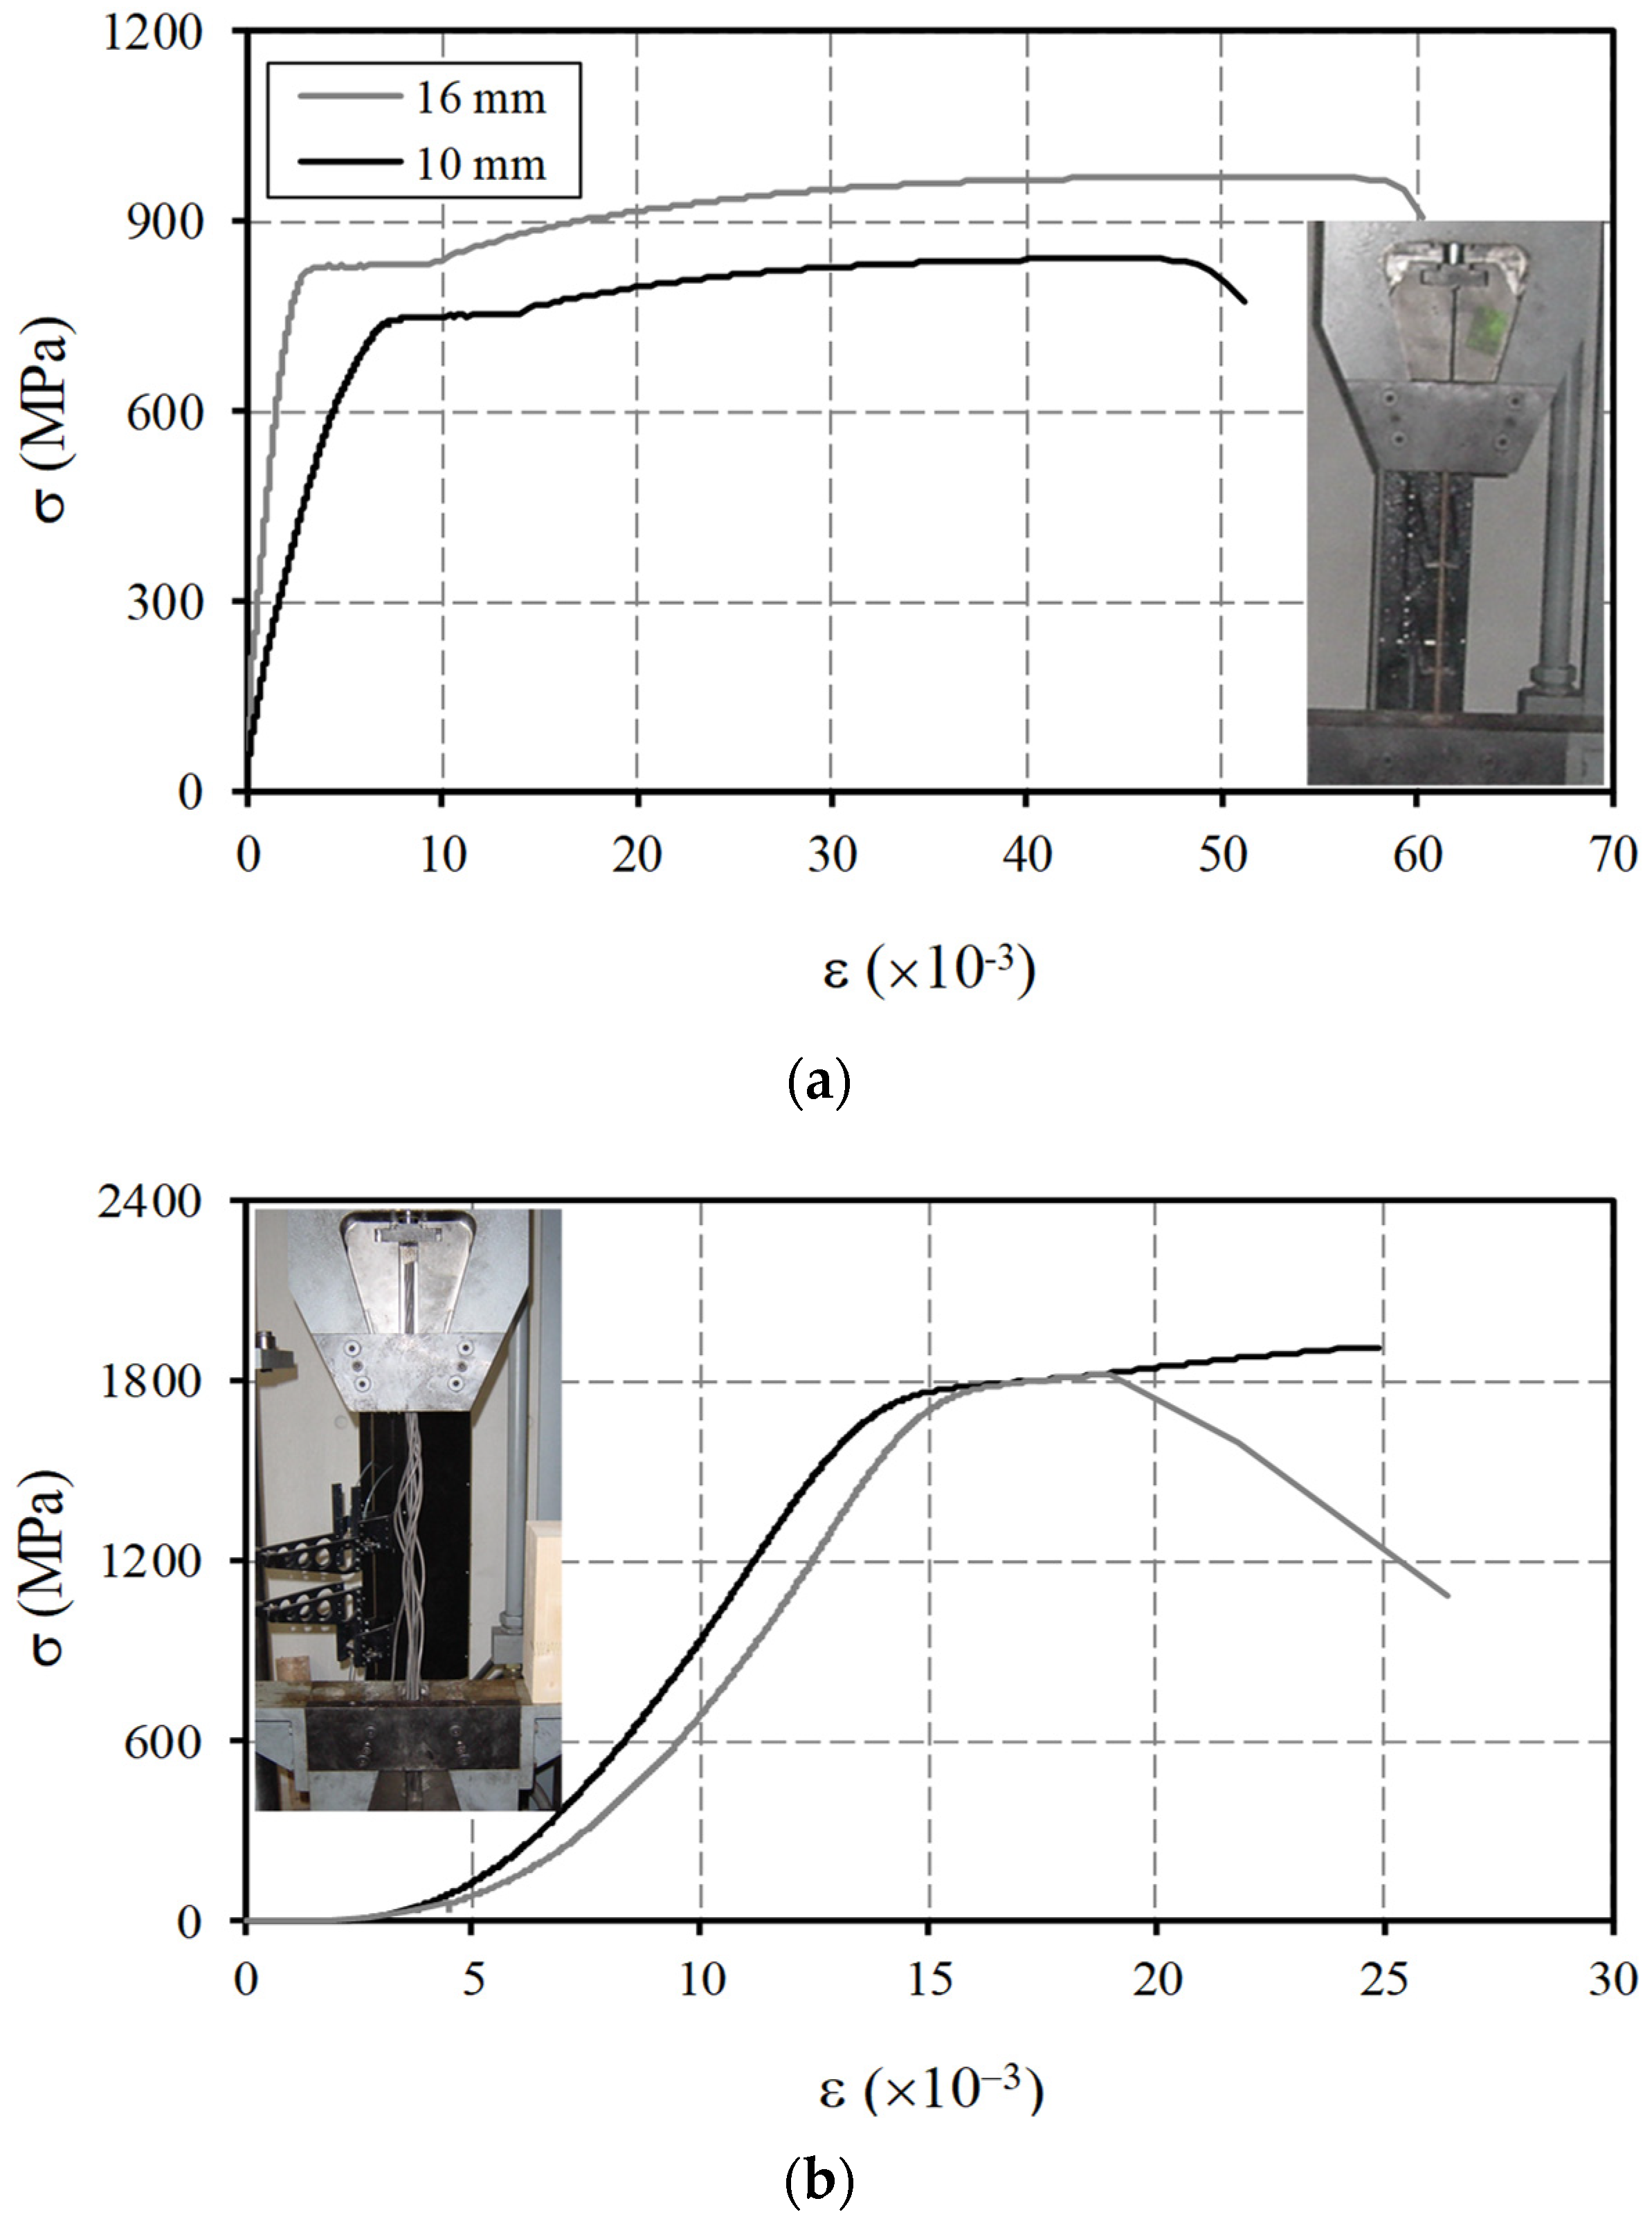
2.2. Materials Properties

The average value of the compressive concrete strength used in each tested beam was obtained from 5 cube specimens, casted and tested at the same time of the corresponding beam. The equivalent cylindrical values were computed by following the indications from Eurocode 2 [16]. Table 2 presents the concrete mix design used to produce the concrete.
Table 1 also presents, for each tested beam, the average values for the tensile concrete strength ( f c t m ) and for the concrete Young’s Modulus ( E c ). These two parameters were computed from f c also following the indications from Eurocode 2 [16].
As example, Figure 3 illustrates a stress ( σ )–strain ( ε ) curve recorded during the test of one of the concrete samples. The initial part of the graph shows the influence of the adjustment due to the existent gap between the loading plates of the test machine and the concrete specimen.
The ordinary reinforcement used in the beams consisted of hot rolled ribbed steel bars (with 10 and 16 mm diameters) sold commercially as Class A500. In order to know the average values of the yield stress and corresponding strain of the bars ( f y and ε y , respectively), tensile tests on steel samples were carried out (6 samples of each of the diameters that were used in the beams). The following average values were obtained— f y = 686   MPa and ε y = 3.43 × 10 3 . For the steel Young´s Modulus, the typical value set in codes of practice was assumed, E s = 200   GPa [16].
As example, Figure 4a illustrates some σ ε curves recorded during the tensile tests of steel specimens (ordinary reinforcement).
The prestress reinforcement used in Beams D-1.79 and D-3.08 consisted of four 0.6′′ wires (0.6 inches or 1.52 cm diameter) belonging to Class S1670/1860. Tests on 6 prestress wire specimens were also carried out and the average values of the 0.1% limit proportional stress ( f p 0.1 % ) and the ultimate stress ( f p u ) of the wires were obtained— f p 0.1 % = 1670.5   MPa and f p u = 1867.1   MPa , respectively. The corresponding strain at 0.1 % was computed by assuming a linear relationship between strains and stresses, which led to ε p 0.1 % = 8.567 × 10 3 . The Young’s Modulus was assumed to be the one indicated by the supplier, E p = 195   GPa .
As example, Figure 4b illustrates σ ε curves recorded during the tensile test of two prestress steel specimens (with 4 × 0.6 inches wires each).
It should be referred that some slip was observed between the steel specimens and the claws of the test machine. This explains the apparent different initial stiffness between the curves for 10 and 16 mm bars in Figure 4a and also the initial part of the curves in Figure 4b. This problem had no implication to the previously presented strain values at the end of the elastic stage. The strains were computed from Hooke’s law by knowing the stresses and assuming the Young’s Modulus.

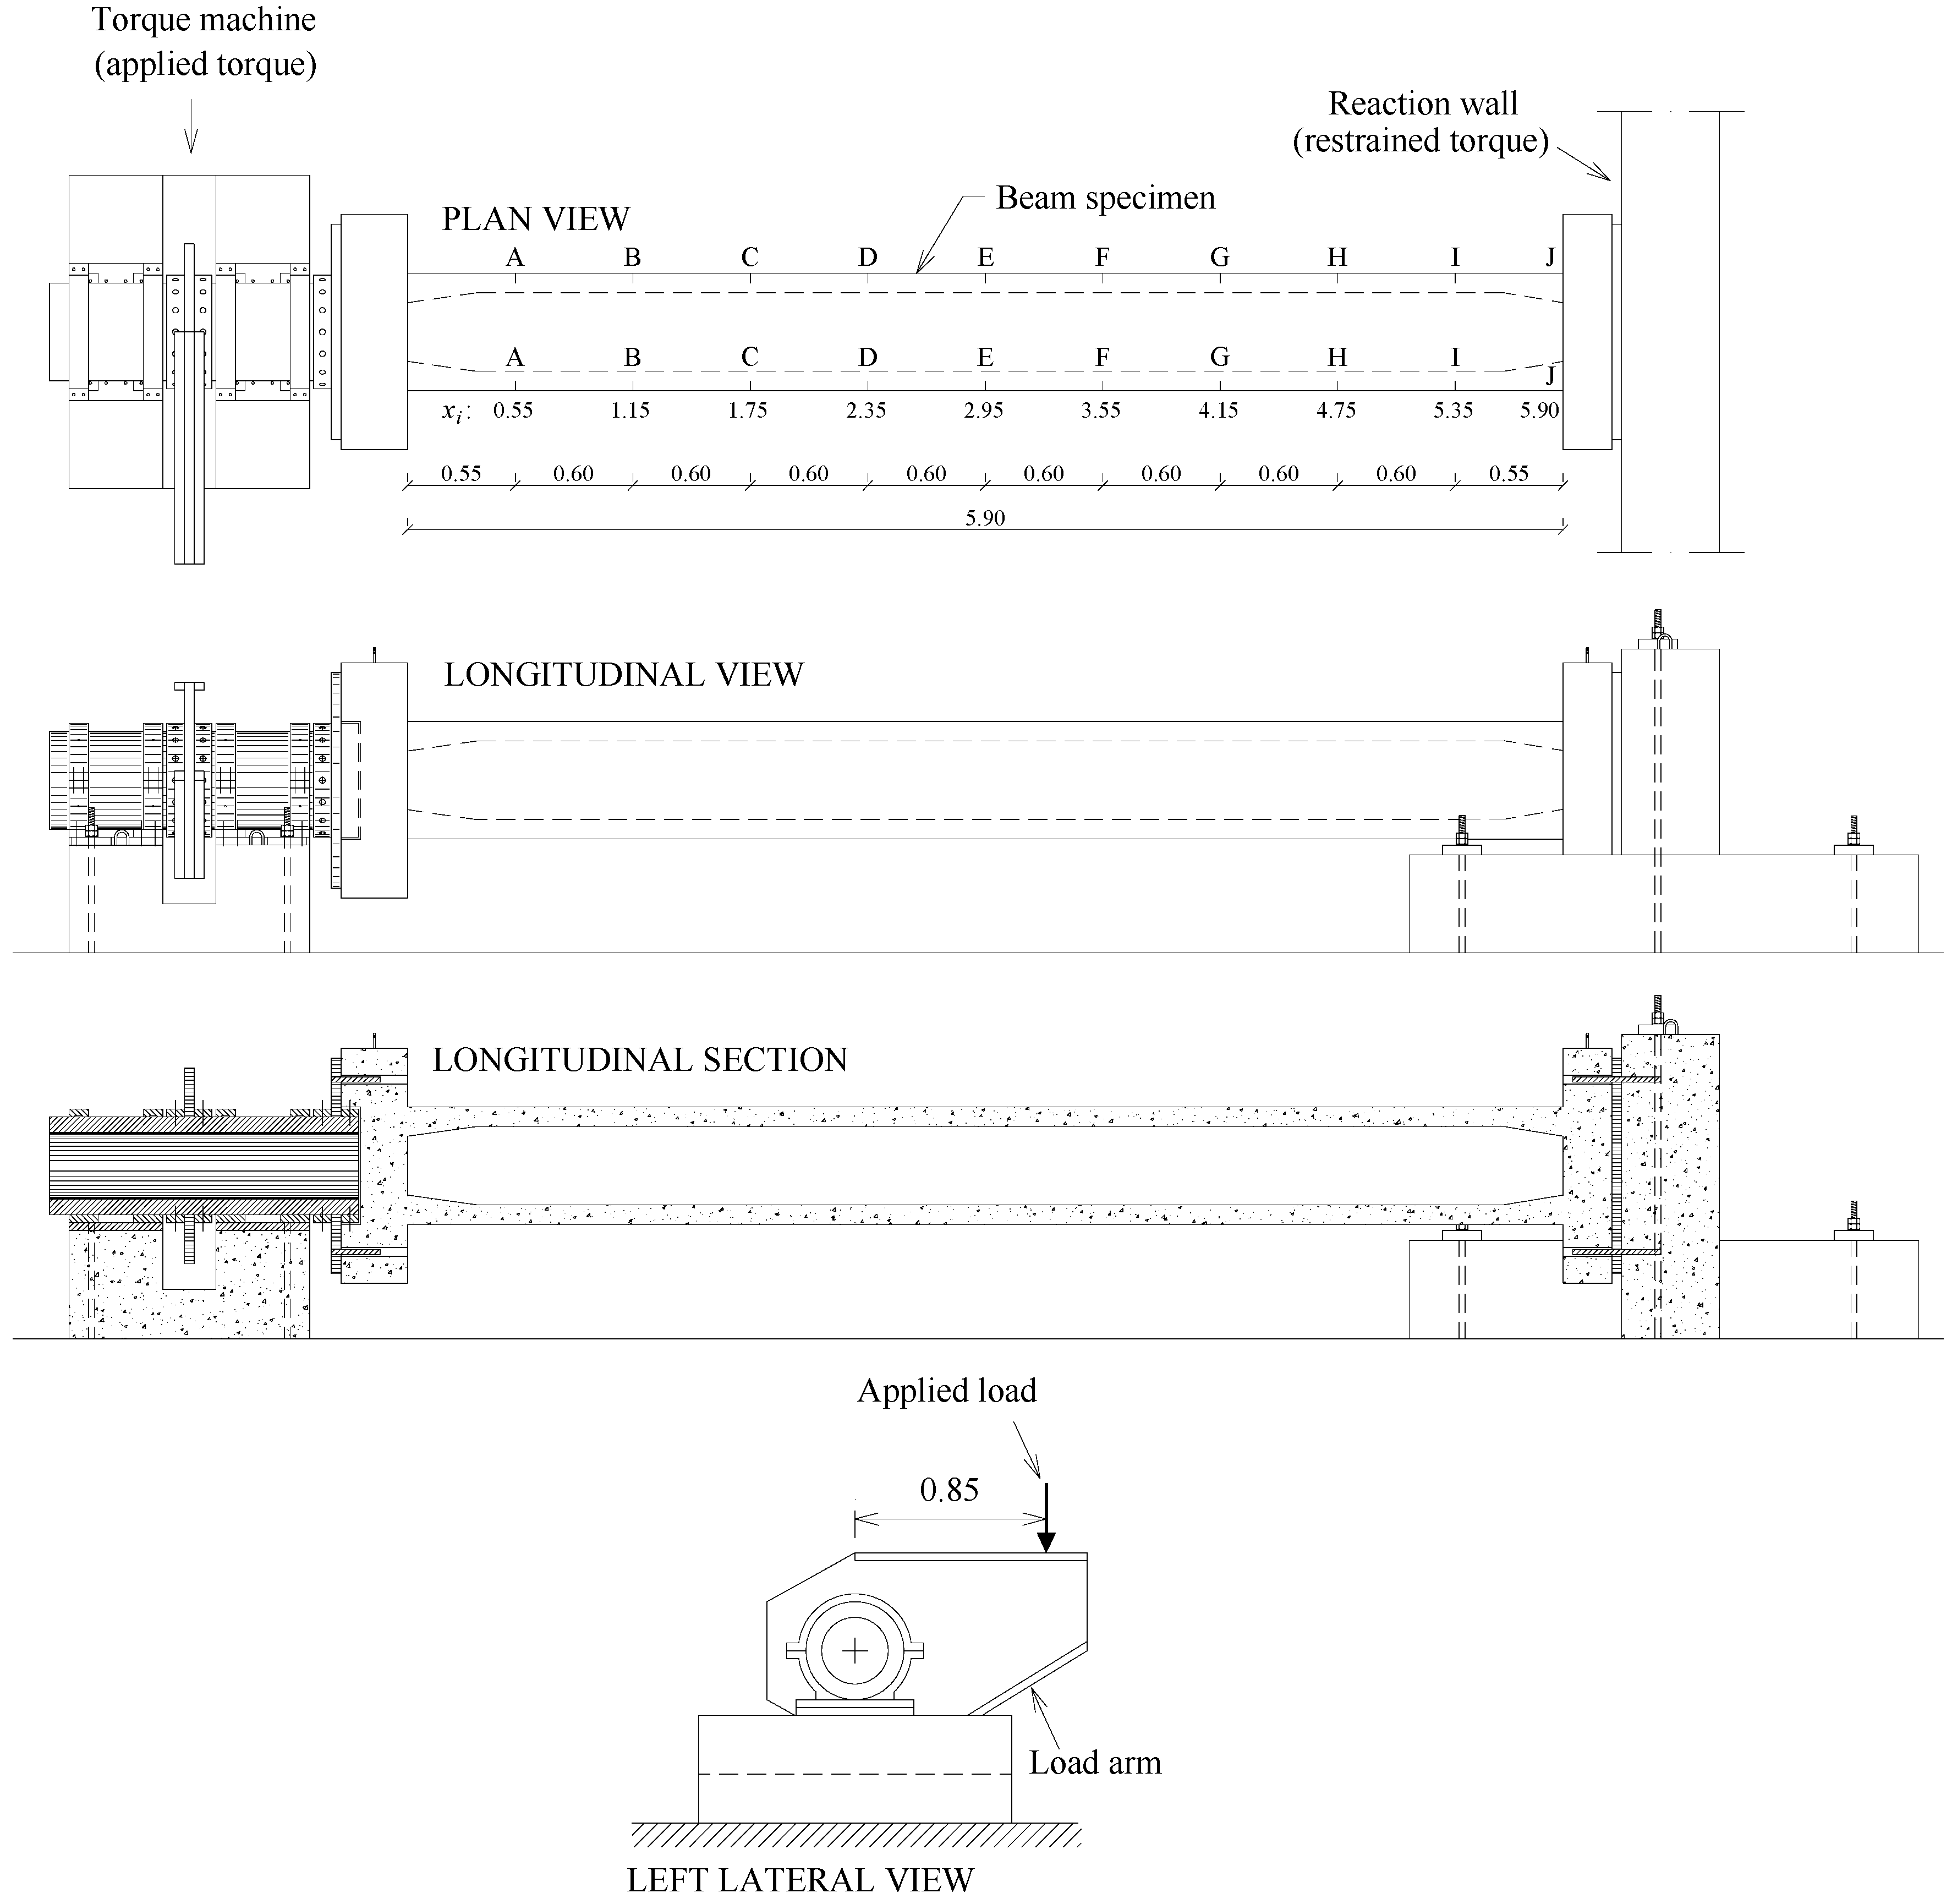
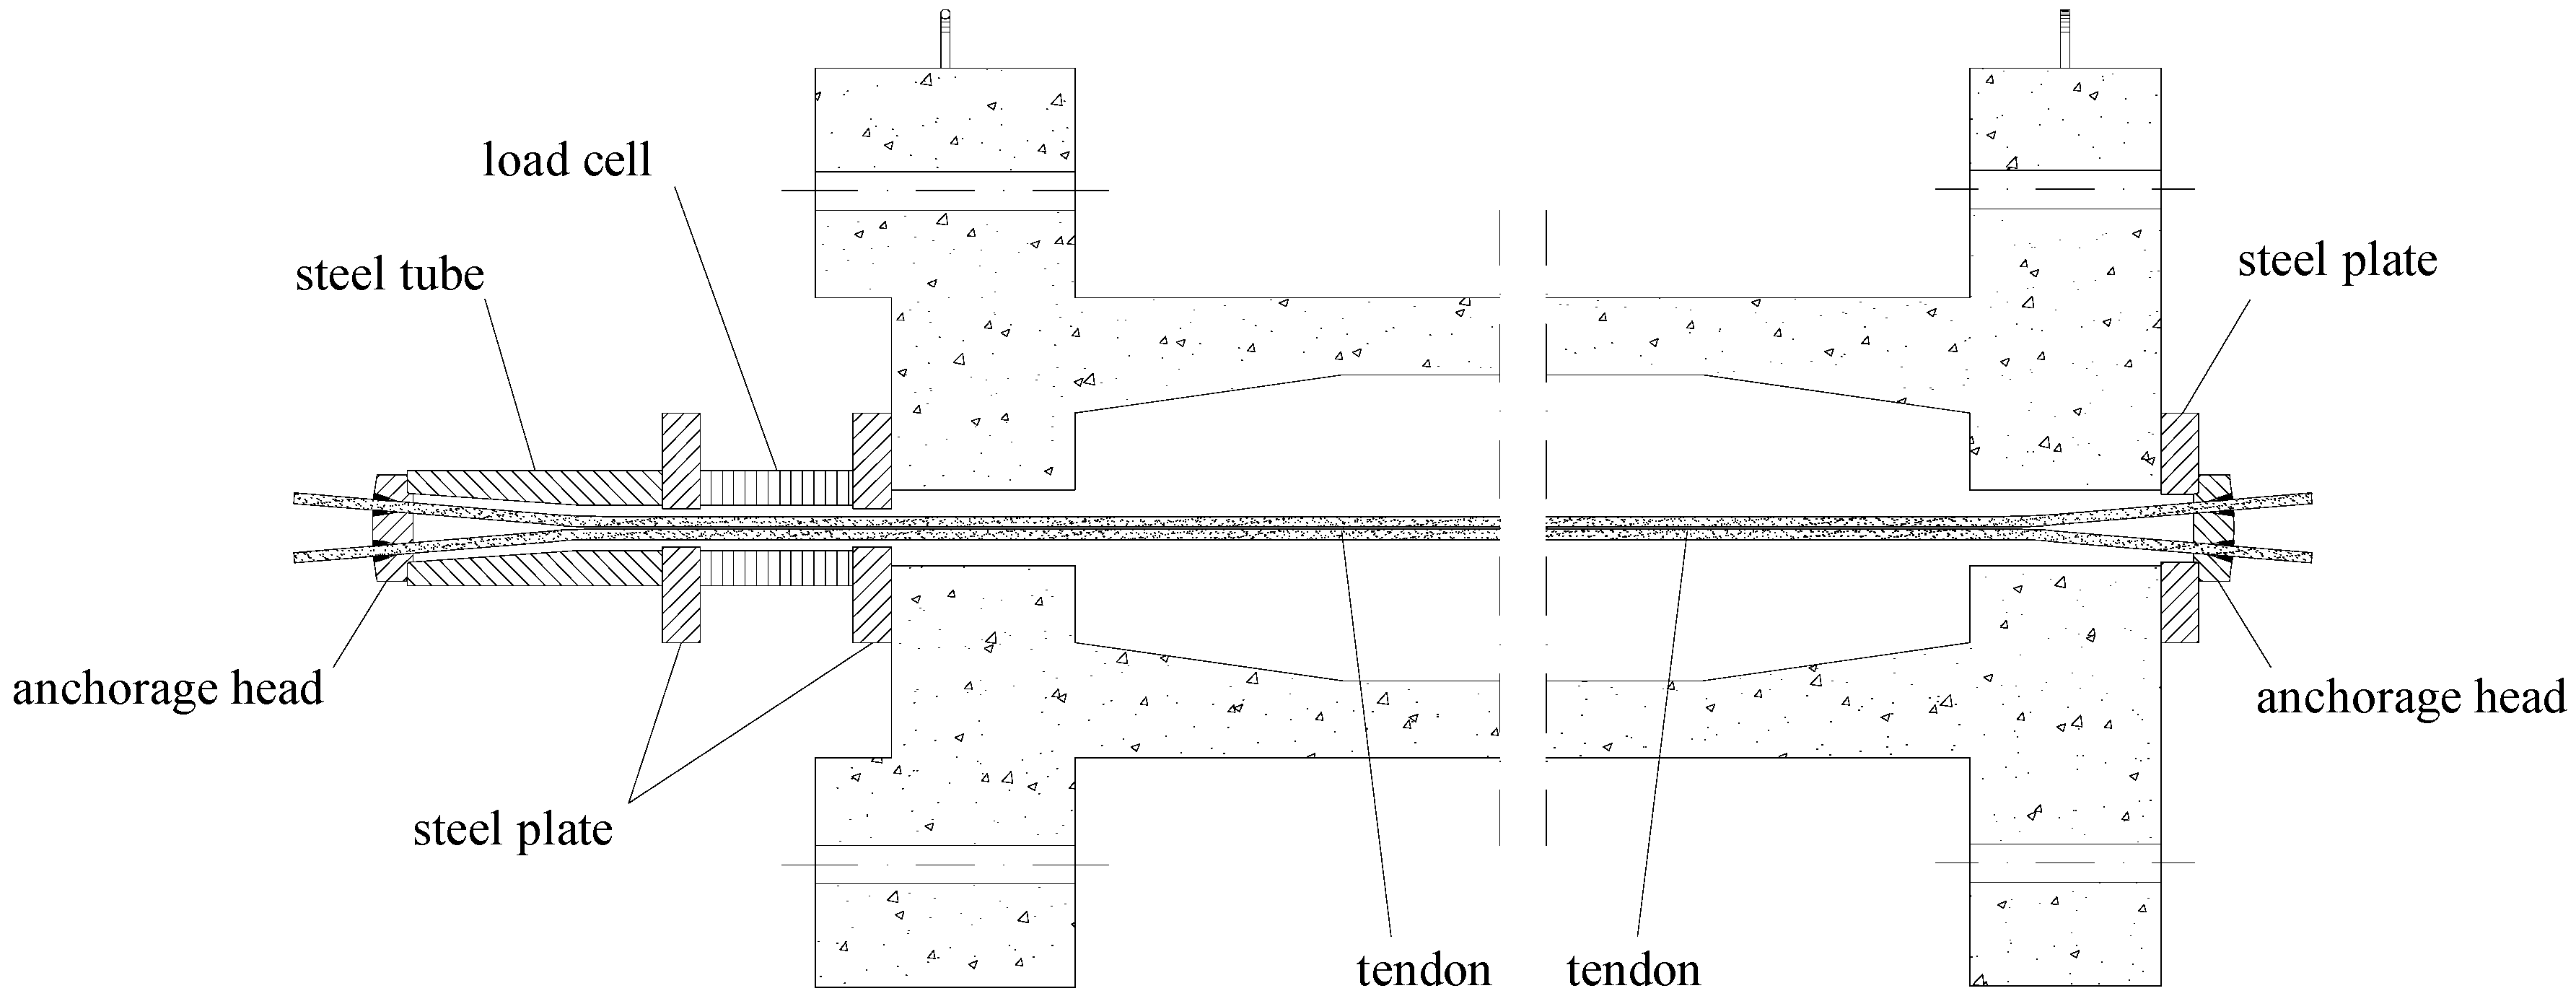
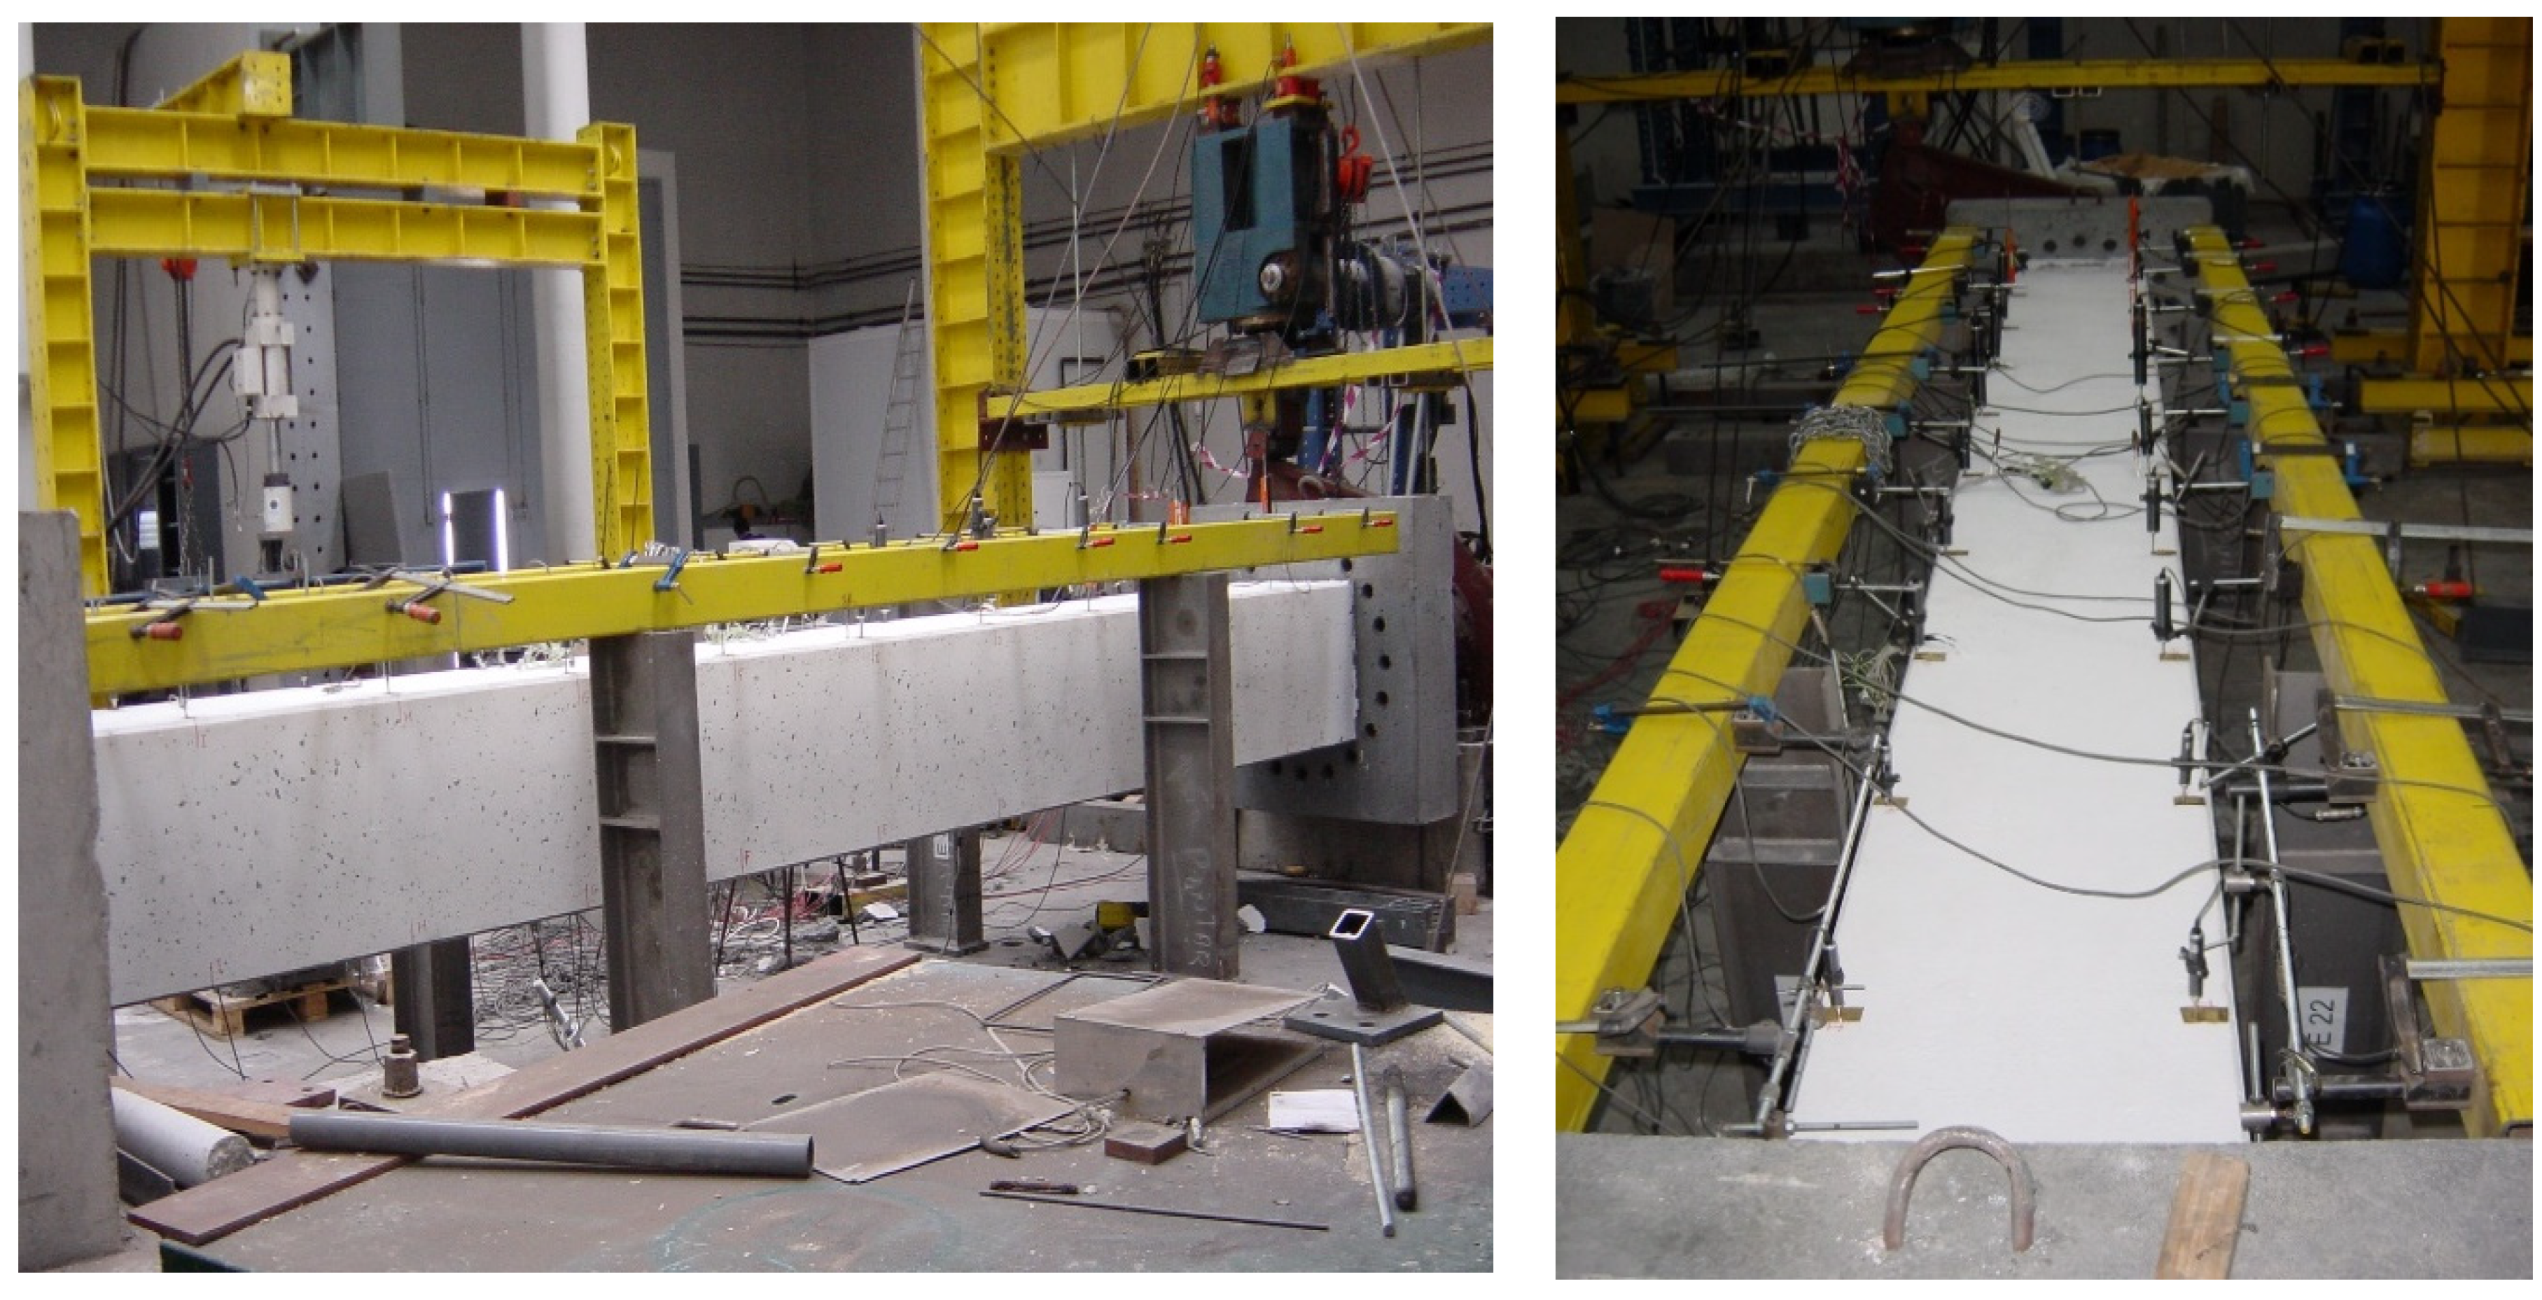
2.3. Testing Procedure

The test device is made of three main components:
  • a test frame where the mechanical actuator is fixed;
  • a device that receives the load from the mechanical actuator and applies a torsional moment in one end of the test beams;
  • a device that fixes the test beam at the other end, restricting its transversal rotation (twist) and allowing its longitudinal deformation (elongation).
Figure 5 illustrates the global test device with a beam in its test position.
The load was applied by imposing a low deformation rate with an electromechanical actuator. Several load cells were placed in different points of the global test device in order to record at any time the general loading state of the beams.
The transversal rotations (twists) were read in 10 sections uniformly spaced along the length of the beams (Sections A-A to J-J), as illustrated in Figure 5. For this, 10 pairs of displacement transducers were placed at the top face of the beam (they were fixed to an external anchored referential). Special care was taken to allow free horizontal relative movements between the beams and the LVDT arms. Because of this, the horizontal projection of the distance between pairs of transducers remained constant during the test and the rotation angles at each section could be easily computed from the transducers’ readings.
The torsional reinforcement bars were instrumented in three selected sections at quarters of the beams’ length. Resistance strain gauges were stuck on the 4 longitudinal corner bars and on the 4 branches of one stirrup.
For Beams D-1.79 and D-3.08, in order to evaluate the effective longitudinal prestressing force after losses and also the changes in this force due to the application of increasing torque, a load cell was placed between the head of the beam and the head of anchorage. Figure 6 illustrates longitudinal cuts at the ends of the prestressed beams and shows the technical solutions adopted to prestress the beams and to read the prestress force during the tests.
A Data Logger was used to record all the readings. Figure 7 shows general views of a beam in its position with the instrumentation ready for testing.

3. Global Analysis of the Experimental Results

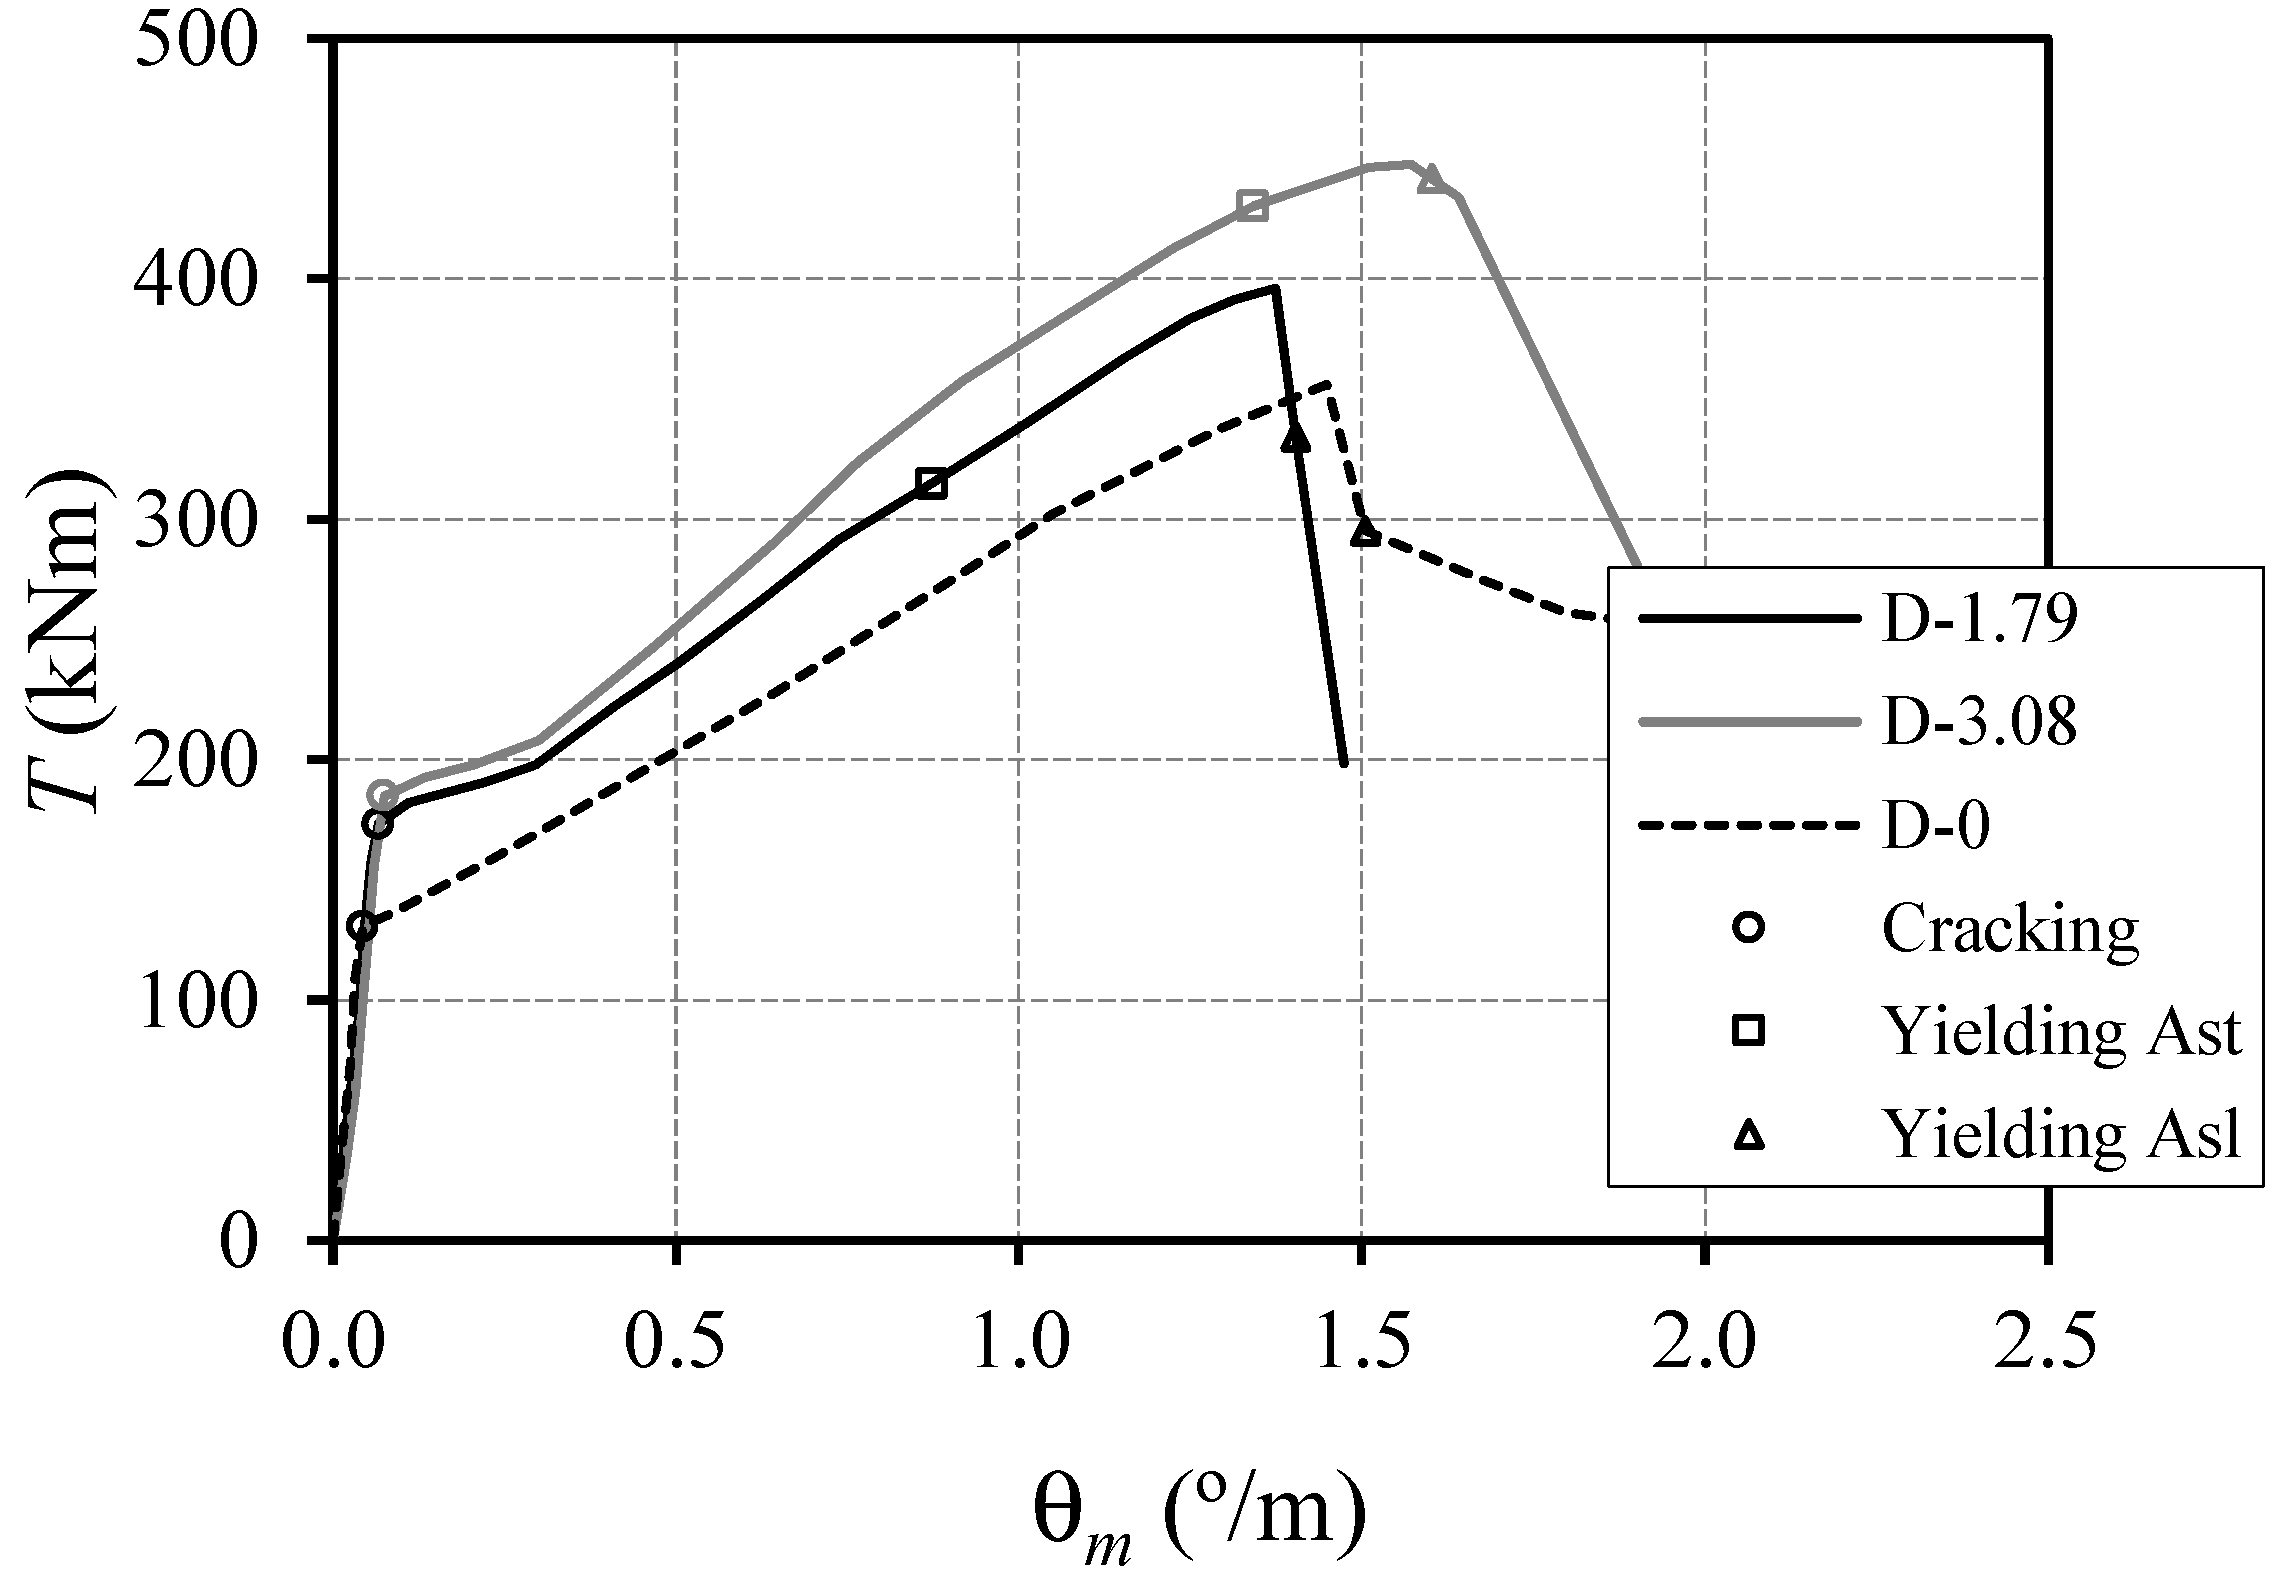
3.1. Torsional Moments vs. Twists

Figure 8 presents the graphs of torque ( T ) versus the average twists ( θ m ) for the tested beams. The torque, T , was obtained multiplying the load applied by the actuator by the horizontal projection of the level arm, 0.85   m , which remained constant (see Figure 5). The average twist, θ m , was obtained by dividing the experimental angle measured in Section A-A to the distance between Sections A-A and J-J, 5.35   m (Figure 5). In each T θ m curve, identification marks were used to highlight the points corresponding to cracking ( ) and to yielding of the transverse ( ) and longitudinal ( ) reinforcement. The yielding points were calculated from the experimental values of the strains recorded by the strain gauges stuck to the reinforcement bars.
As expected, Figure 8 shows the high influence of prestress in the cracking torque. It is known that prestress delays the formation of cracking. For a moderate concrete stress (induced by prestress) of 1.79   MPa (Beam D-1.79) an increase of approximately 32.5 % on the cracking torque is observed, when compared with the beam without prestress (Beam D-0). This shows the efficiency of uniform longitudinal prestress to delay the cracking in beams under torsion. This high influence of prestress can be explained because in torsion the concrete is under a lower and more uniform level of tensile stresses (in the whole section) when compared with the bending situation. Therefore, even for low levels of prestress, the cracking stage is delayed. It is also observed that, in State I (non-cracked state), the steel bars, including the prestressed wires, generally have little influence on the stiffness of the beams. In fact, the T θ m curves are almost coincident at this state.
In State II (cracked state), the T θ m curves are almost parallel to each other. This shows that the contribution of the longitudinal prestress for the stiffness of the beams is small at this state. This is due to the adopted prestressing technique (external longitudinal and centred prestress).
As expected, Figure 8 also shows that the use of prestress increases the resistant torque, T r , of the beams. However, there is not a clear tendency with respect to the associated twist at the ultimate torque, θ T r . In fact, since prestress induces a compressive stress state in concrete, it would be expected that the deformation capacity of concrete in the compressed areas of the beam (namely in the struts) would decrease as the level of prestress increases. As a consequence, the twist corresponding to the ultimate torque should decrease as the stress induced by prestress increases. This is not the case for Beam D-3.08, which has the highest level of prestress and reaches a twist θ T r that exceeds the same one of the other beams. However, this observation can be explained due to the type of failure of Beams D-0 and D-1.79, which was fragile and somehow premature (failure by pull off of the concrete corners). This subject will be discussed later. This aspect also justifies the different shape of the descending branches of T θ m curves that is observed and the absence of yielding points before the peak torque is reached for Beam D-0.
T θ m curves of Figure 8 also show that, before the peak torque is reached, the prestressed beams only present points corresponding to yielding of the transverse reinforcement. It is observed that the yielding of longitudinal reinforcement only occurs after the peak torque. After cracking, the longitudinal prestress reinforcement starts working as ordinary reinforcement under the torsional loading. Consequently, the beams with balanced longitudinal to transverse reinforcement ratios will lose this balance because of the influence of the prestress wires. Hence, the calculation of the balanced ratio of the longitudinal to transverse reinforcements should account for the area of the prestressed steel ( m b , t o t = ( A s l + n A s p ) s / A s t u with n = E p / E s ), which leads to an excess of longitudinal reinforcement of about 20 % . Therefore, the transverse reinforcement should yield before the longitudinal reinforcement, as observed in Figure 8.
Table 3 presents, for each tested beam, the main properties of T θ m curves, namely—the cracking torque and correspondent twist ( T c r and θ c r ), the torsional stiffness in State I ( ( G C ) I ), the torsional stiffness in State II ( ( G C ) II ), the torque corresponding to the yielding of the transverse reinforcement and correspondent twist ( T t y and θ t y ), the resistant torque (peak torque) and correspondent twist ( T r and θ T r ). Since the yielding of the longitudinal reinforcement occurs after the peak torque, the corresponding values are not presented.
The torsional stiffness in State I was calculated dividing T c r by θ c r (with θ c r in radians unit). Prior to the calculation of the torsional stiffness in State II, the equation of the line of T θ m curve in the linear elastic stage was previously calculated from linear interpolation. For this calculation, the points of the T θ m curves located in the zone that can be identified as belonging to State II were selected. Only the zone of the curves that is approximately a straight line was considered. After the calculation of the equation, T = a θ + b (see Table 3), the stiffness ( G C ) II is equal to the slope a of the line (with twists converted to radian units).
The analysis of the values displayed in Table 3 confirms the trends observed in the T θ m curves from Figure 8 and previously discussed.

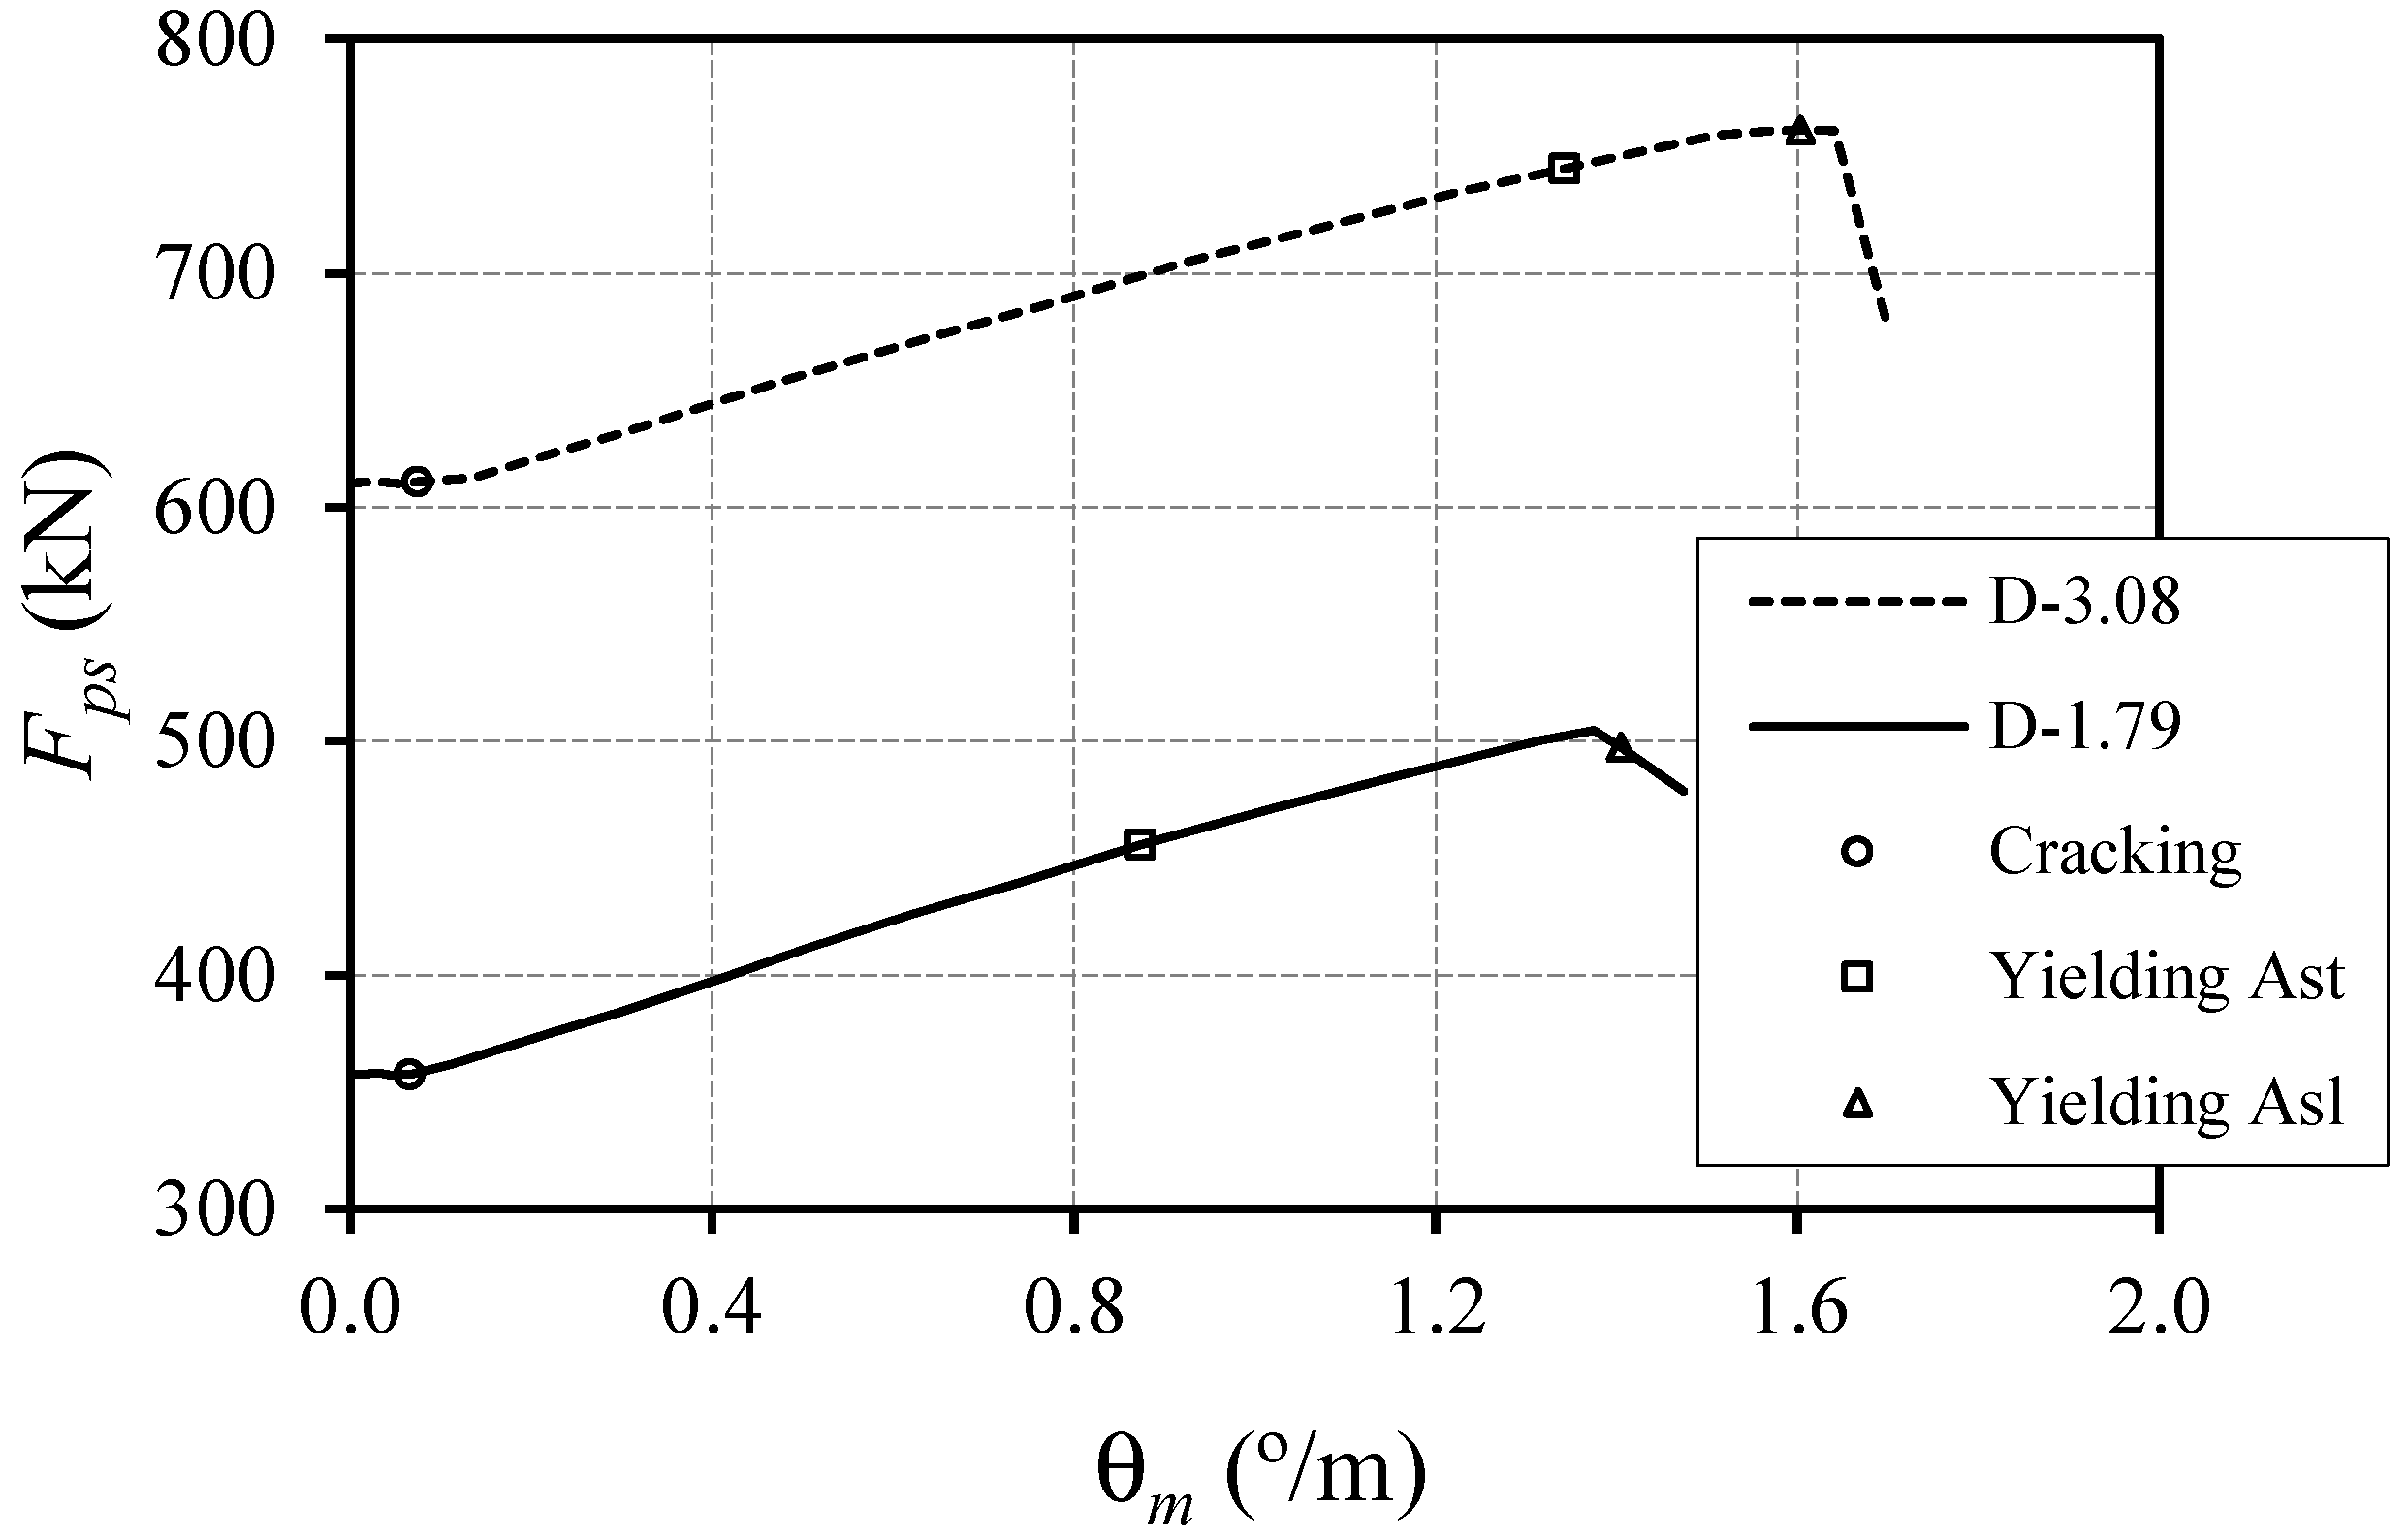
3.2. Force in the Prestress Reinforcement vs. Twists

Figure 9 presents the graphs of the force in the longitudinal prestress reinforcement ( F p s ) versus the average twist ( θ m ). The force F p s was obtained directly from the load cell placed in the anchorage zone of the prestressed wires. The evolution of the recorded values starts from the initial value of the applied prestress force (after short-term losses).
The curves of Figure 9 show the existence of a small horizontal zone where the force in the prestress reinforcement is almost constant and equal to the force due to initial prestress. This zone ends as the first crack appears in the beam. After this zone, the force in the prestressed wires increases gradually. In fact, before cracking, the internal reinforcement steel bars are also under very low levels of stress. The strains in the beam during the pre-cracking state are very small, as confirmed by the readings of the strains in the reinforcement bars (recorded from the strain gauges). Decompression of concrete takes place at a certain point of this initial horizontal zone (before this point, concrete is only in compression).
After cracking, the torsional longitudinal reinforcement bars become effective and the tensile stress in the bars increases as the longitudinal deformation of the beam increases. The elongation of the beams also causes the increasing of the initial force in the prestressed reinforcement. This increasing occurs up to the failure of the beams.

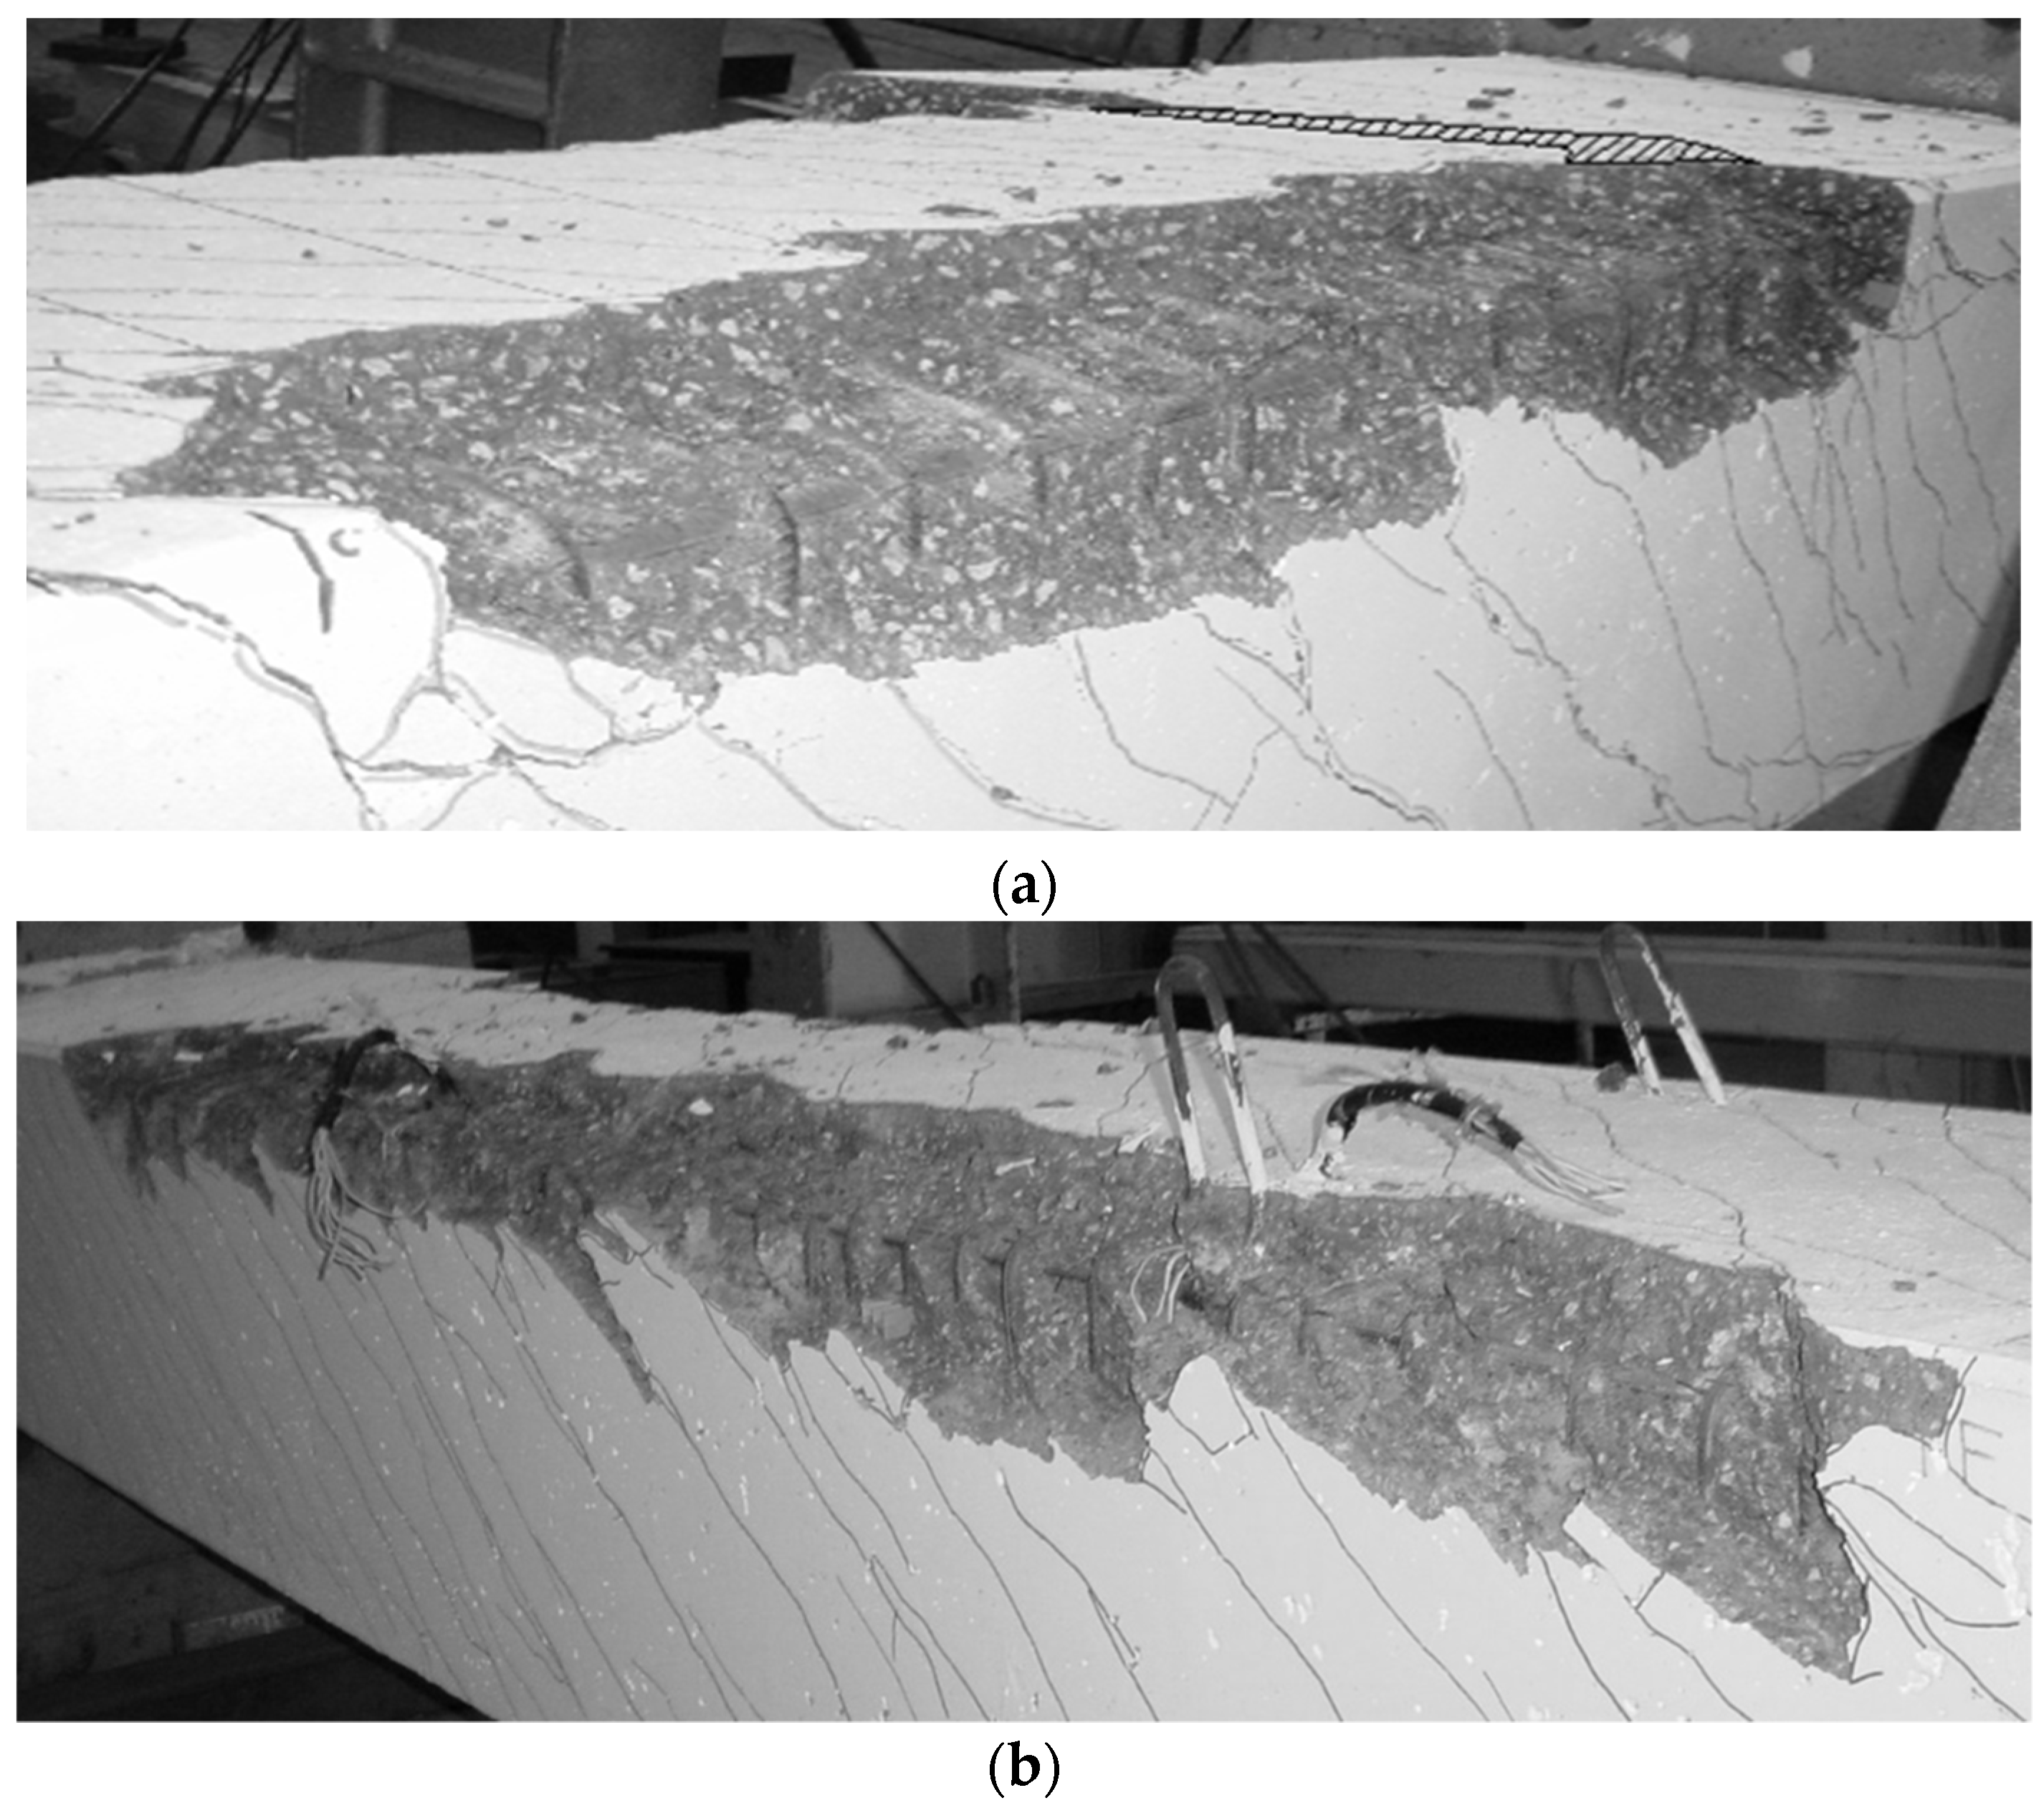
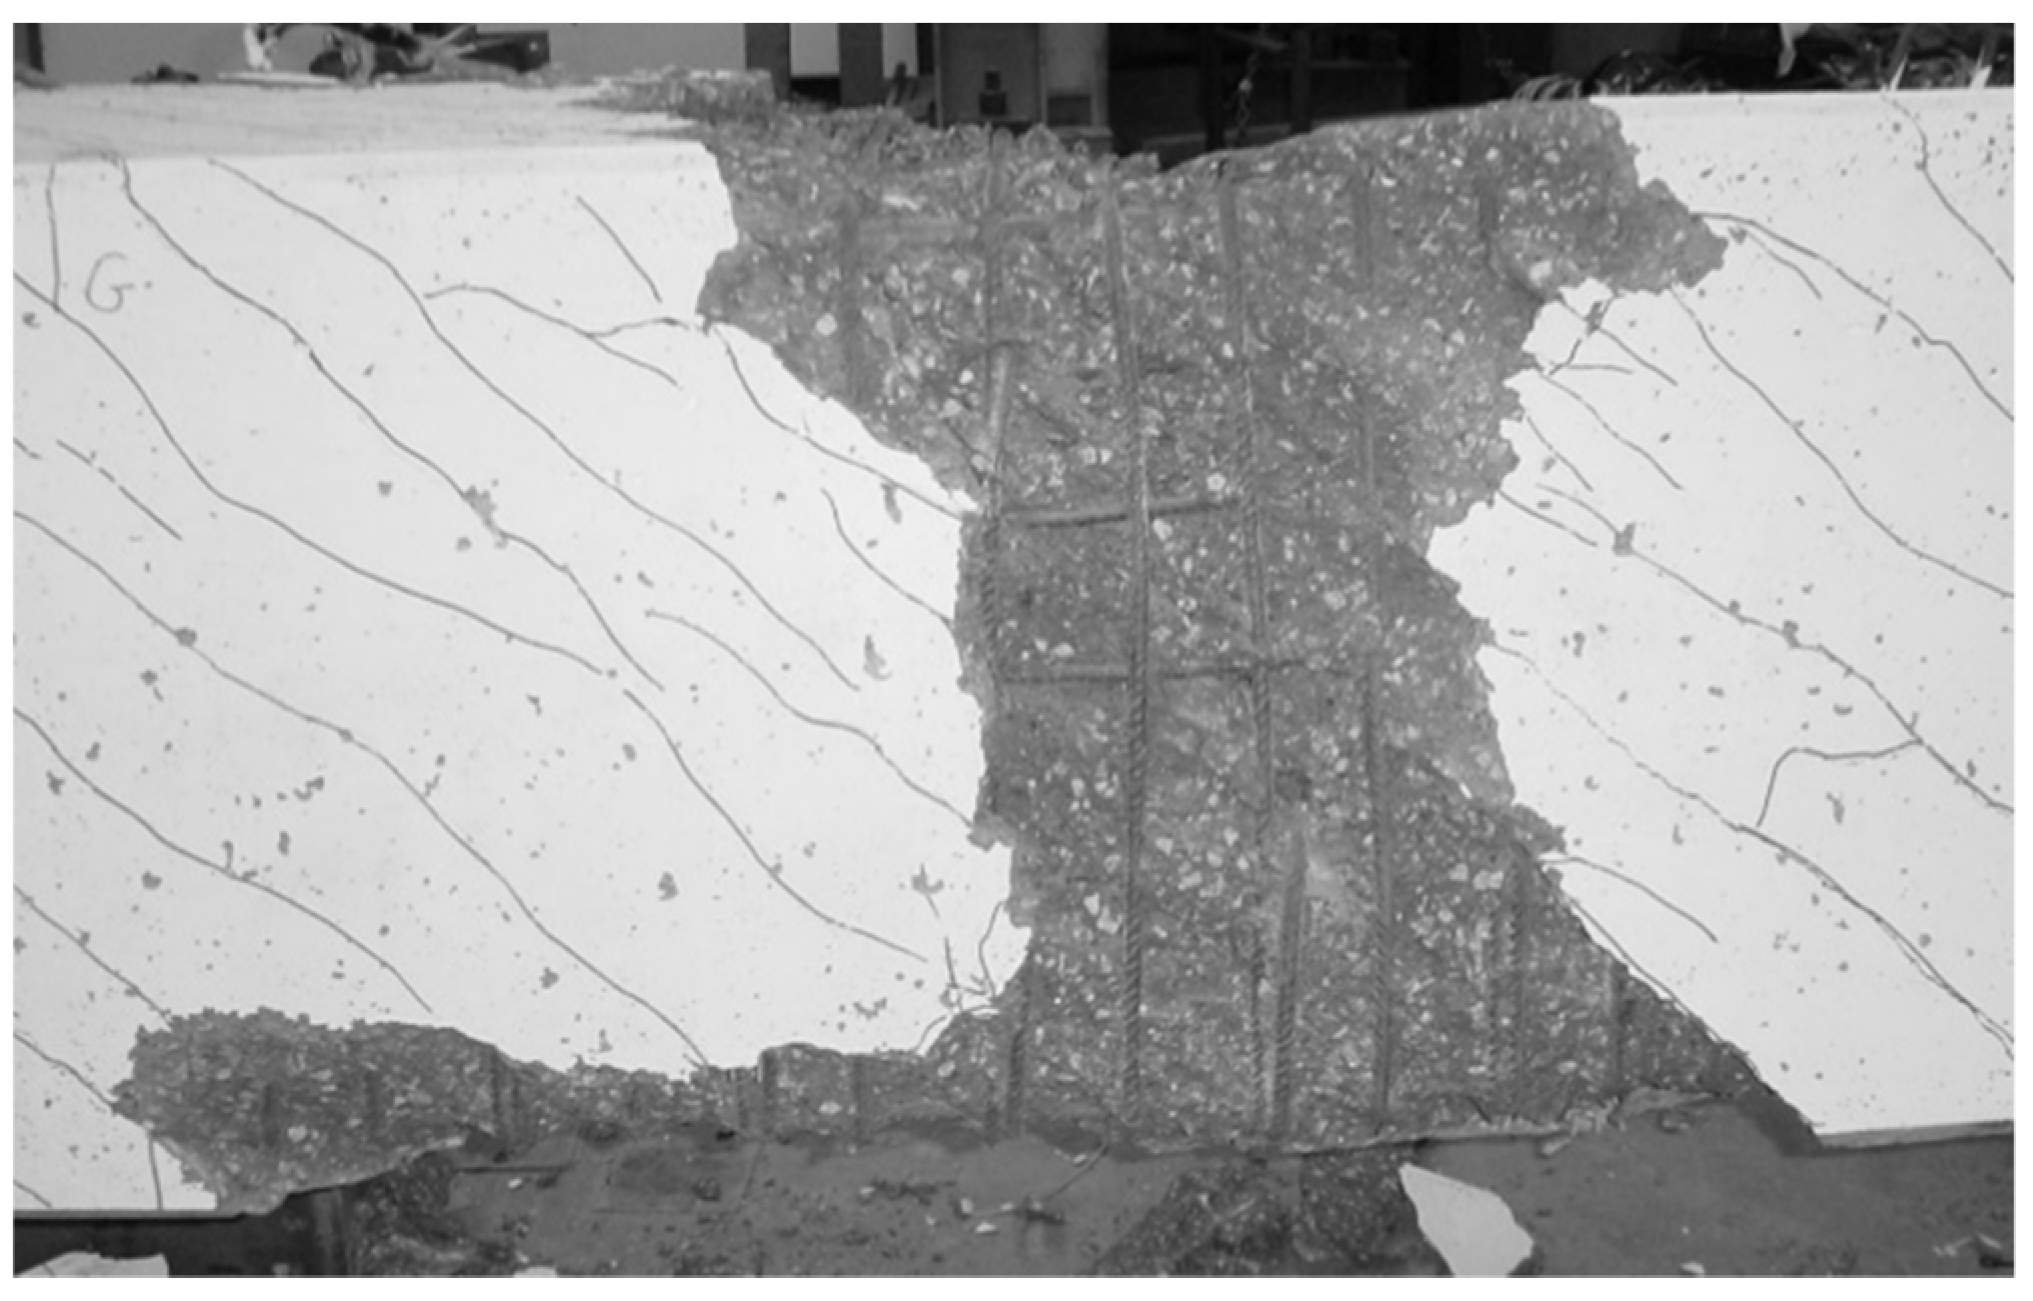
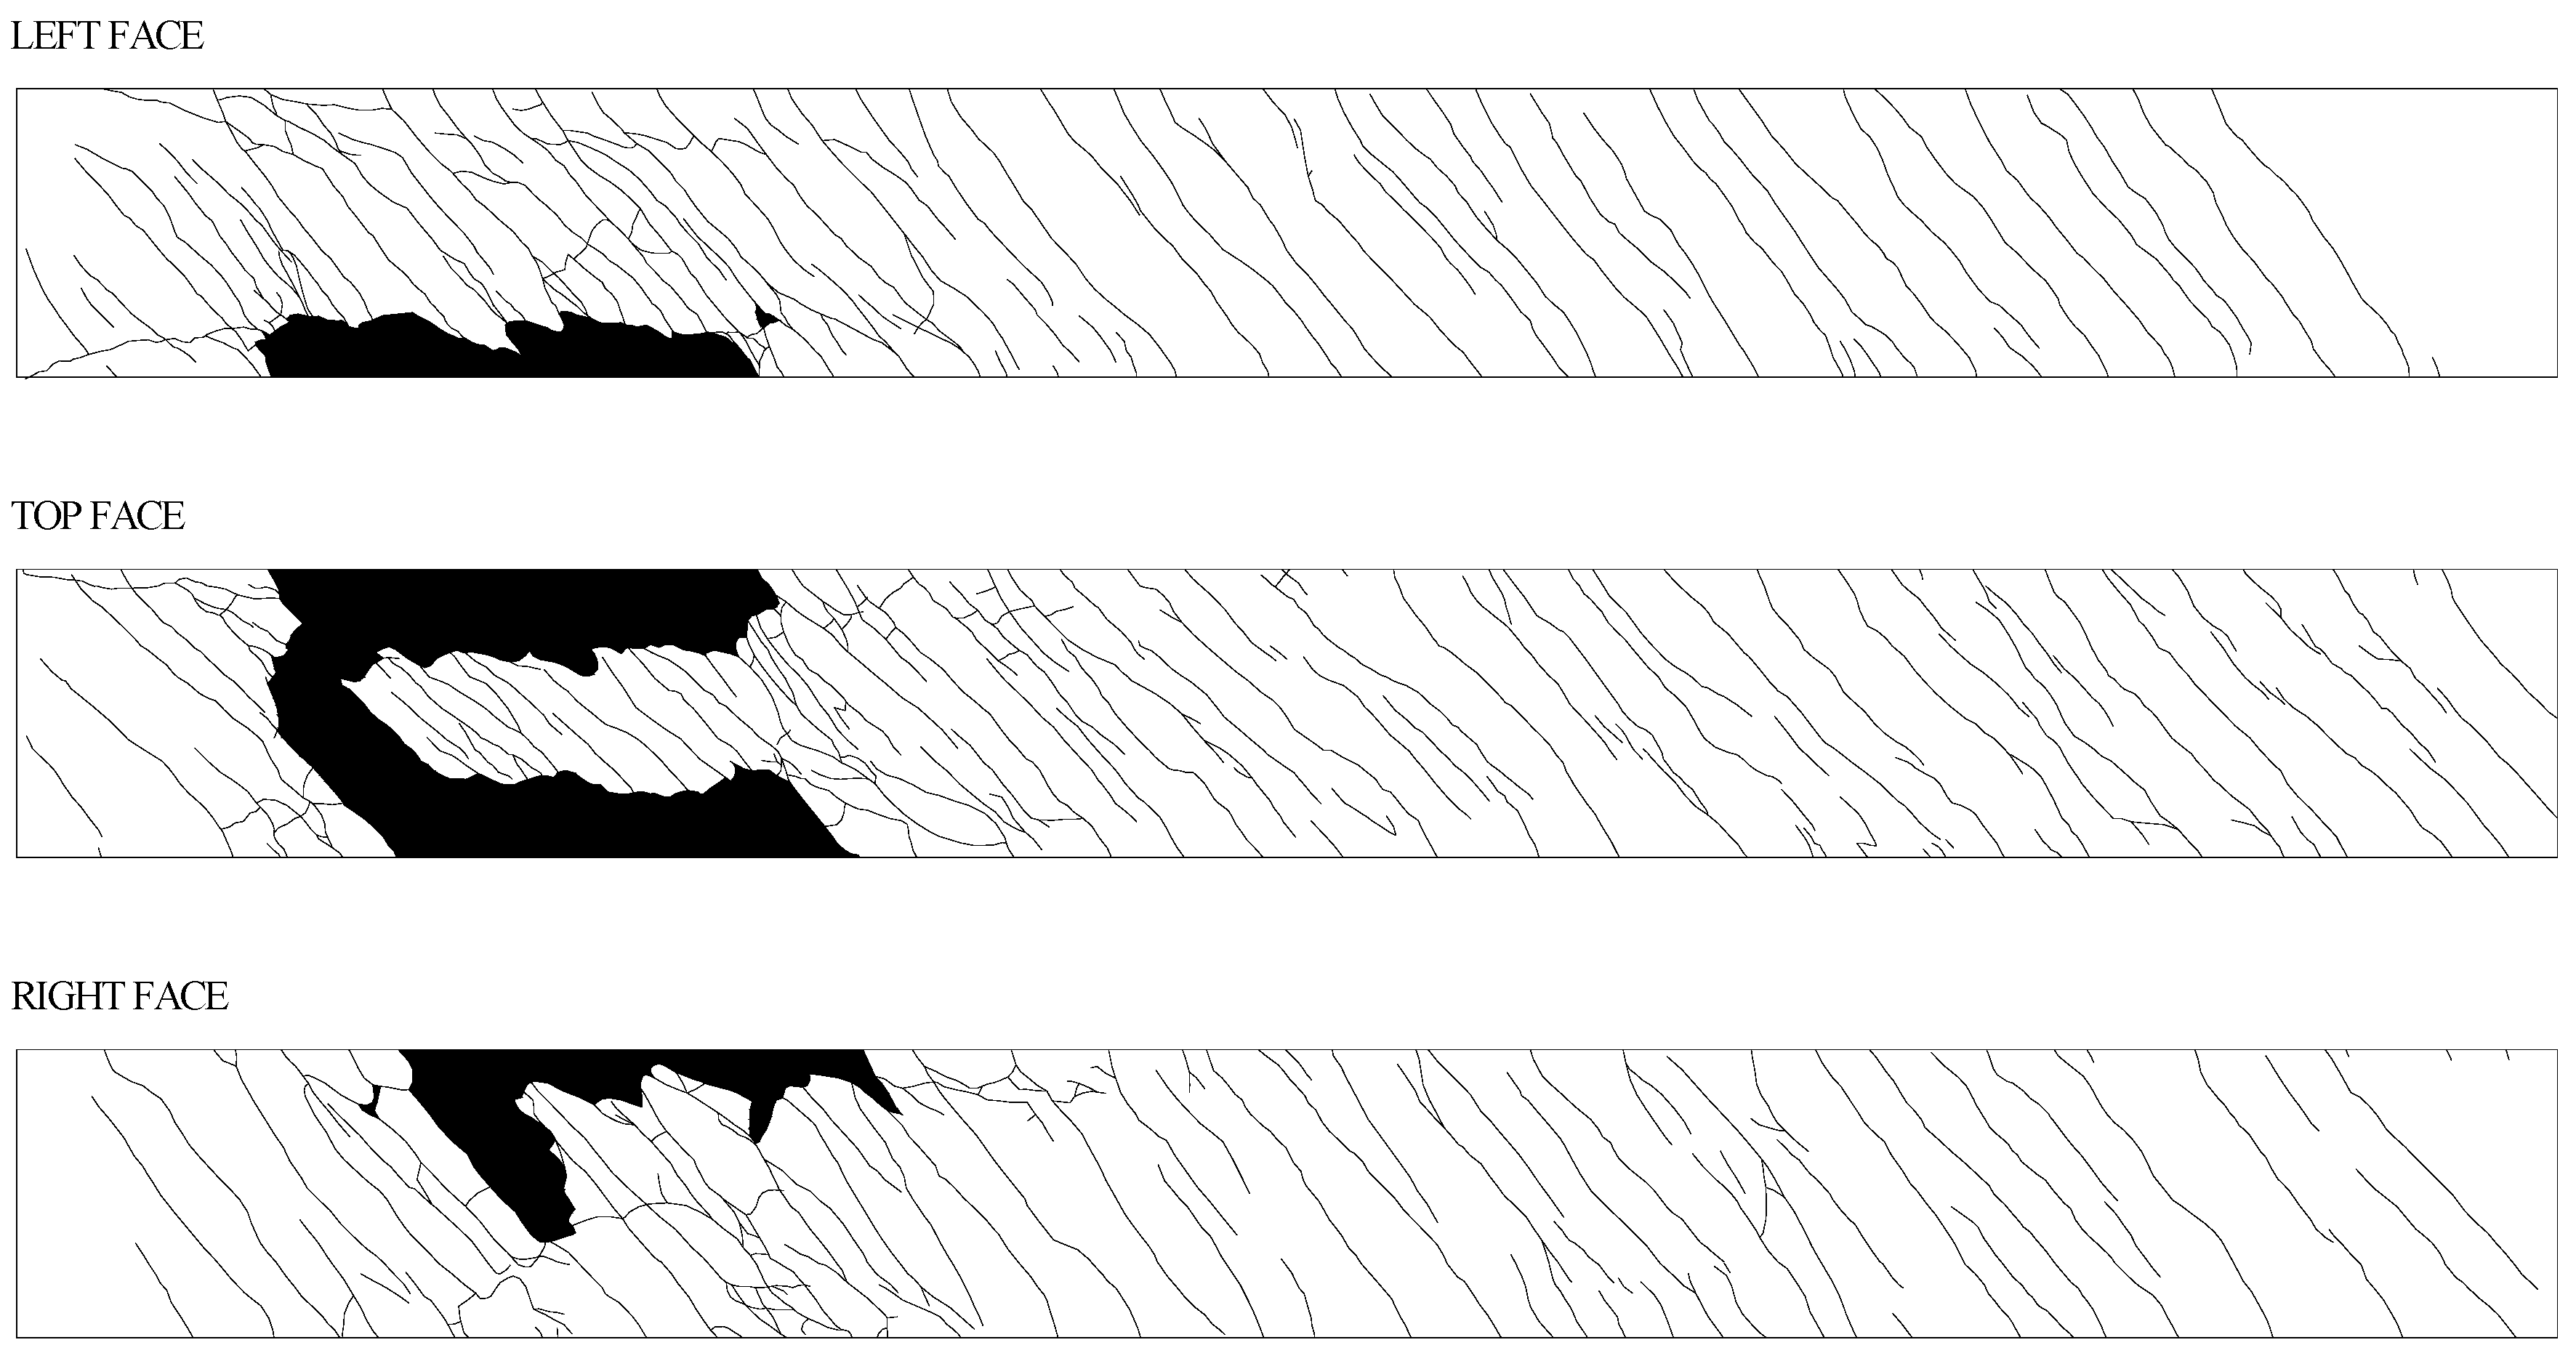
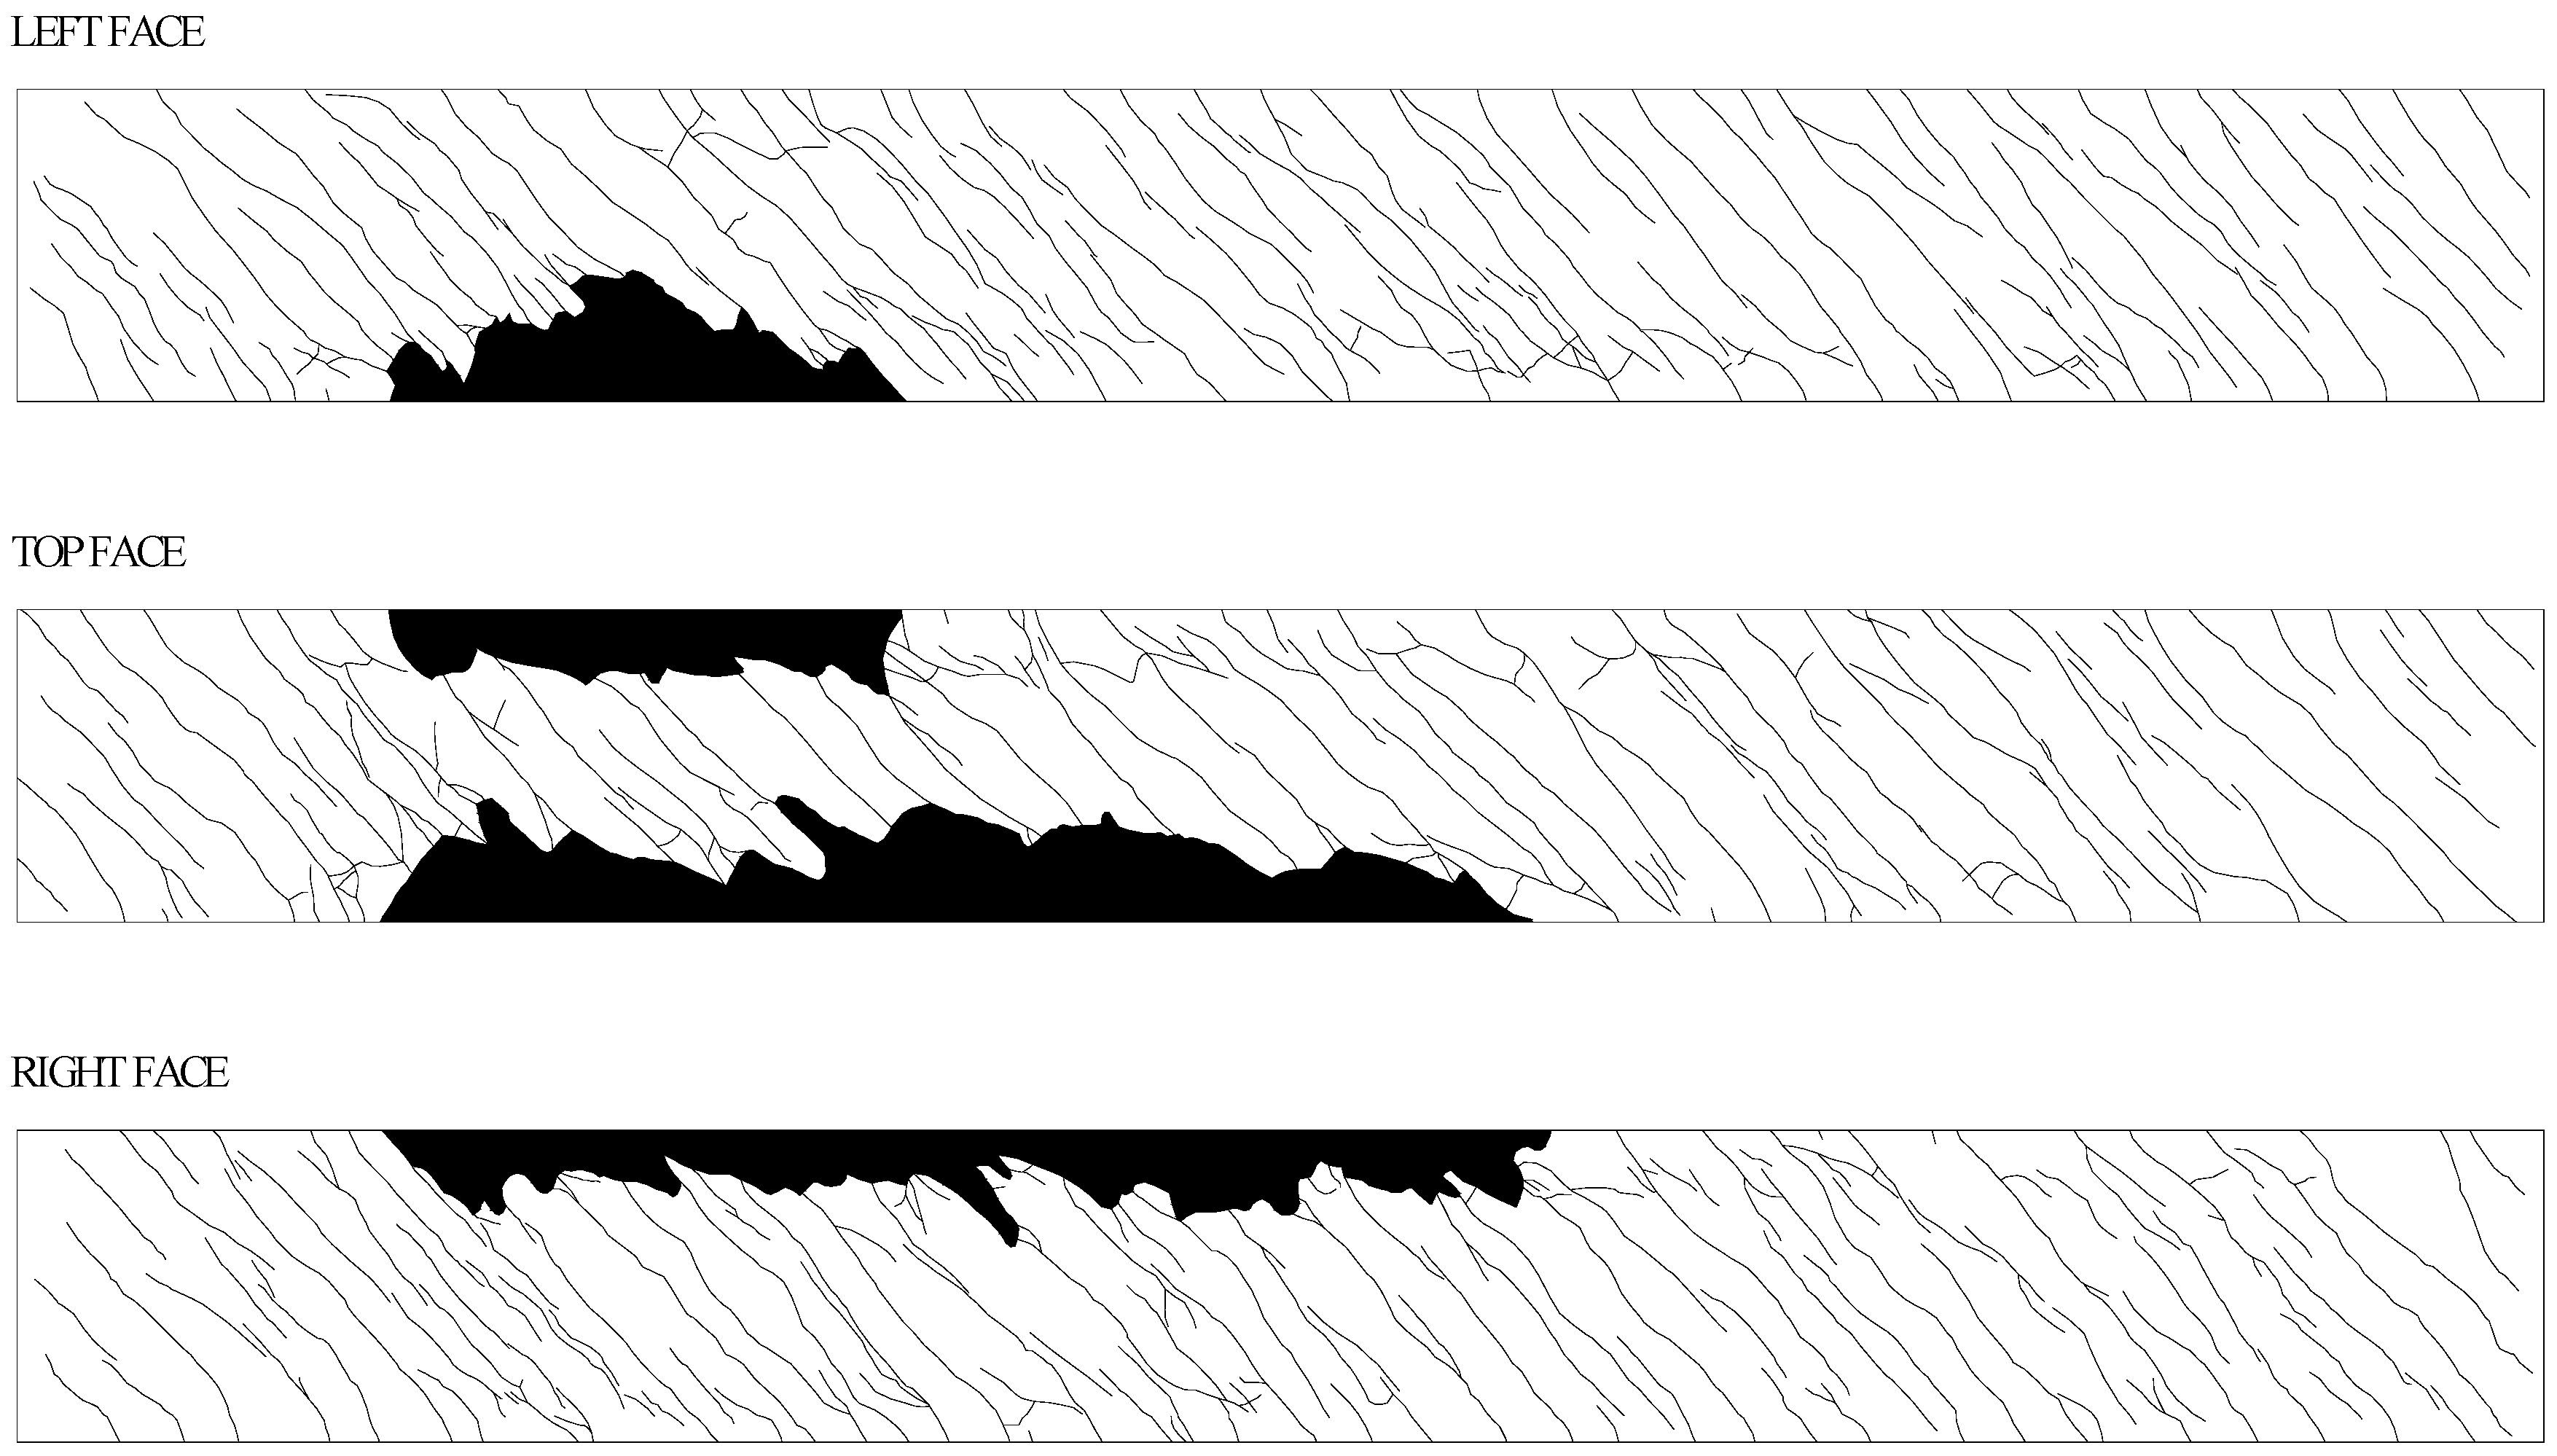
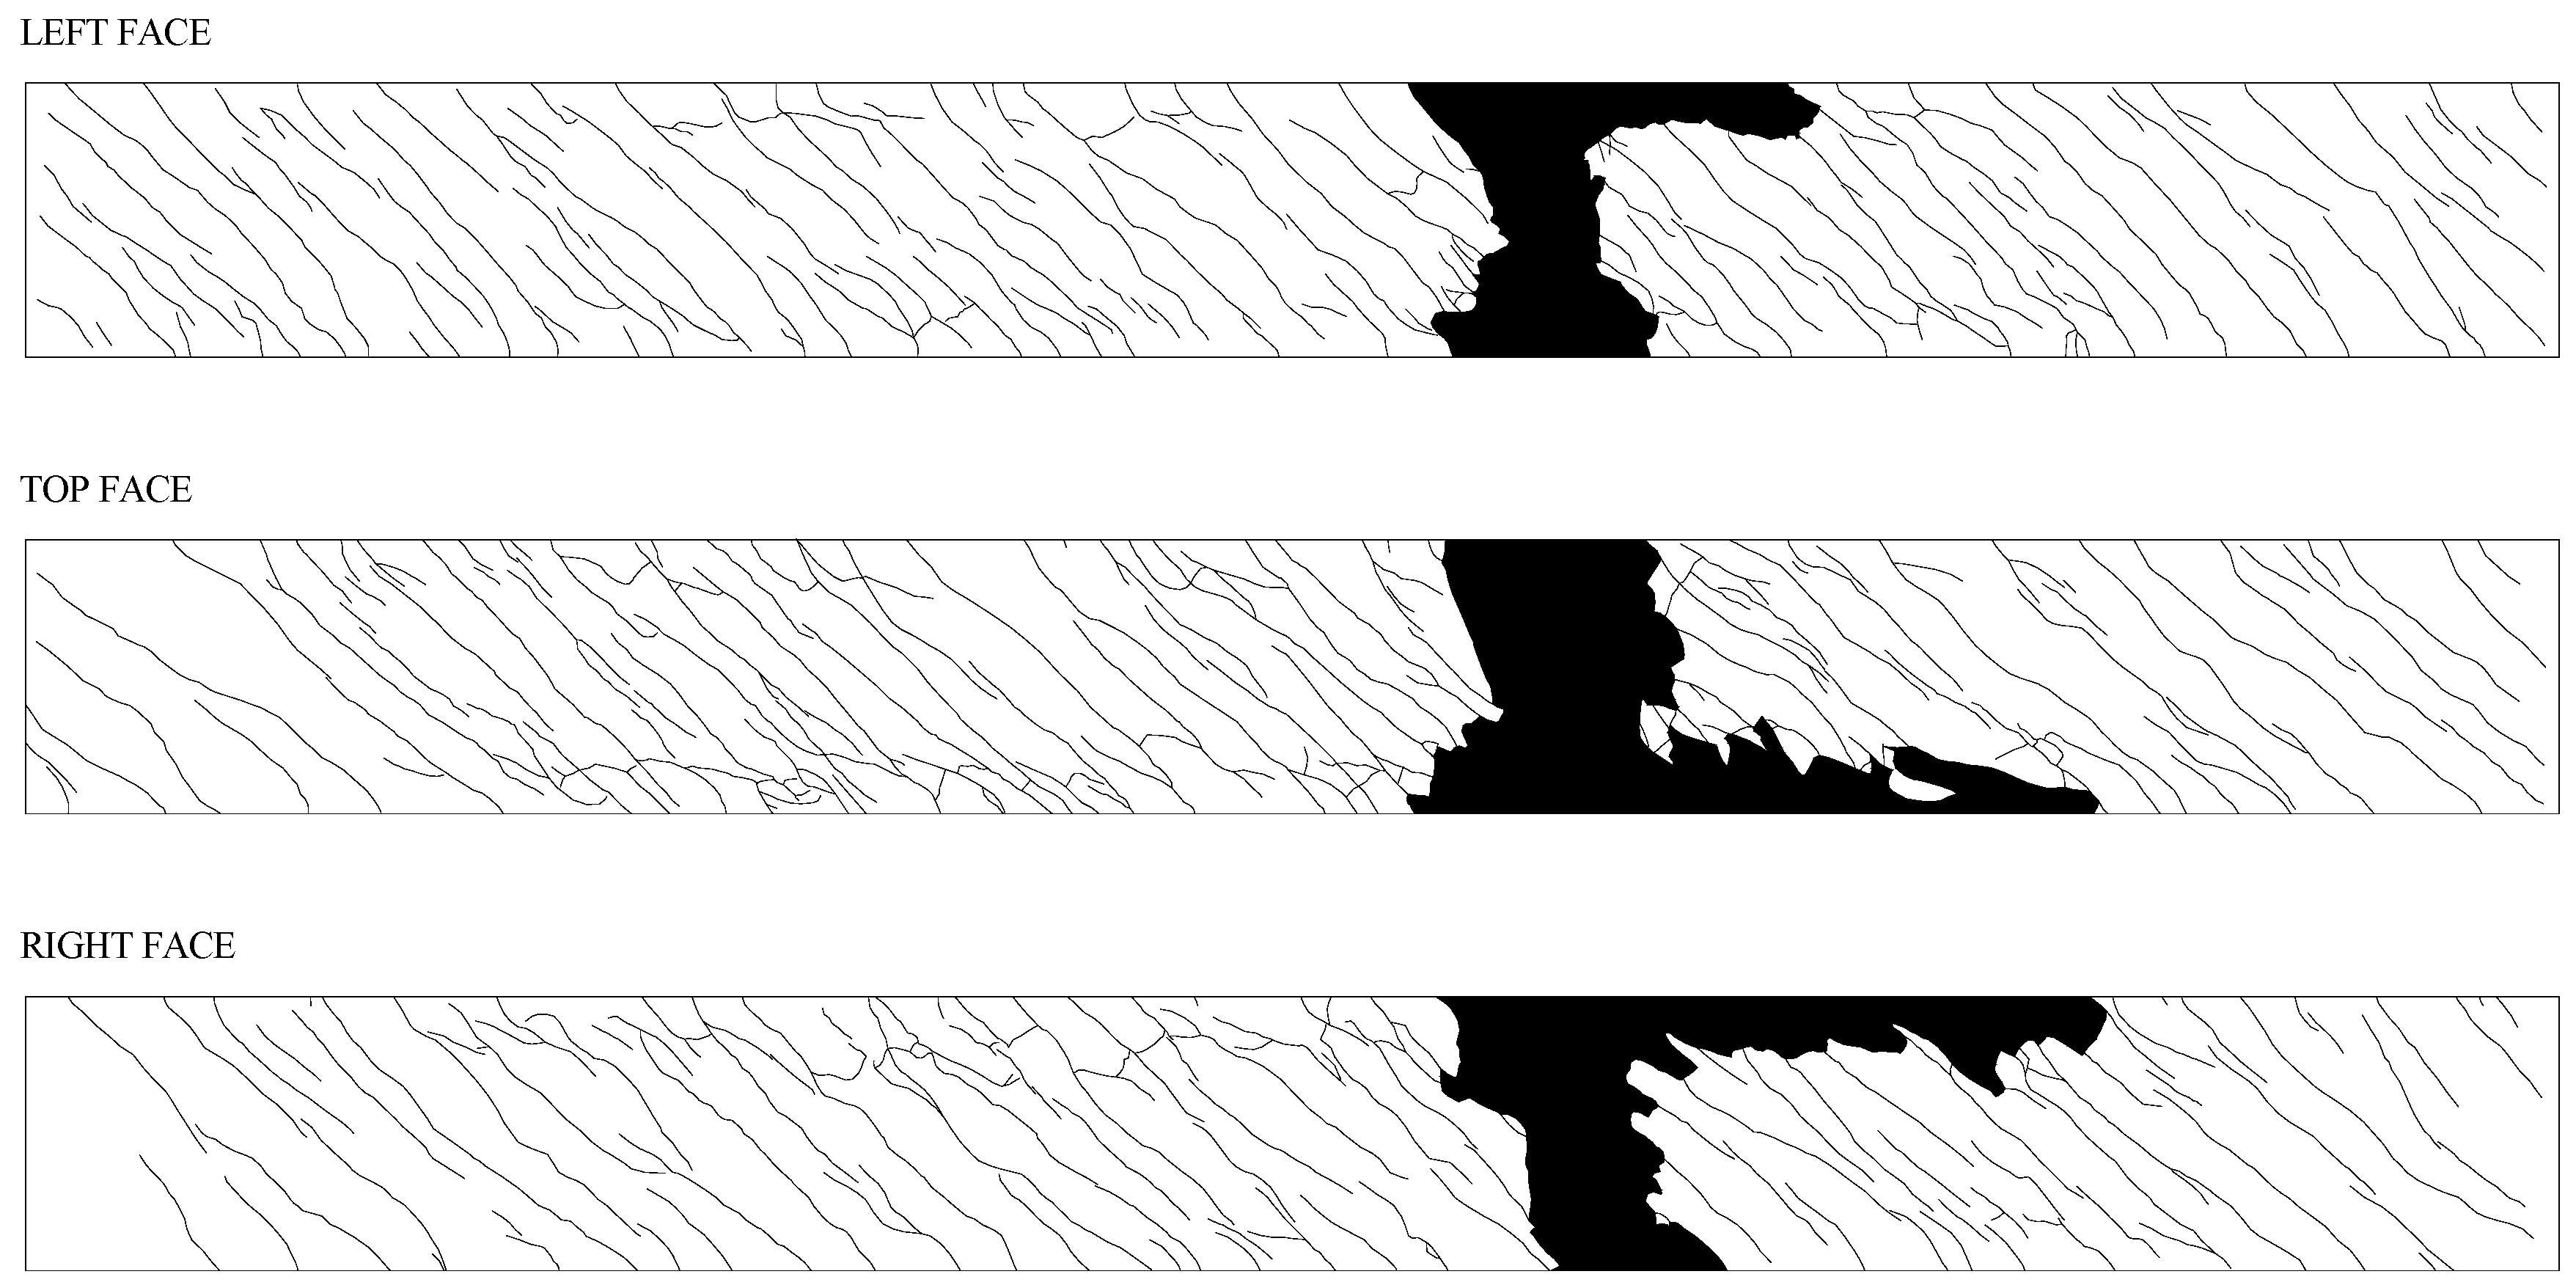
4. Failure Modes and Cracking Patterns

Figure 10 and Figure 11 show some photographic records of the failure zone of the tested beams. From these photos and from the analysis of the T θ m graphs at their final part it is possible to distinguish two failure modes.
With a low level of prestress (1.79 MPa), Beam D-1.79 had the same failure mode as Beam D-0 (with no prestress), characterized by concrete break off at the corners (Figure 10). It should be mentioned that this particular fragile failure mode, somehow frequent in hollow beams, was observed and reported in previous studies [6,10]. For a moderate prestress level (3.08 MPa), Beam D-3.08 clearly shows a fragile failure by crushing of concrete in the struts due to compression. This failure mode was particularly destructive and explosive (Figure 11). These results seem to show that the prestress level influences the failure mode. The results seem to indicate that, as the initial prestress increases, the failure becomes more fragile. This reveals an unfavourable effect of the prestress, which is observed for moderate levels of prestress.
To analyse the cracking pattern of the tested beams, photographs were taken and posterior graphic tools were used to produce graphic type images for the three visible faces (lateral faces and top face) for all the beams. Such illustrations are presented in Figure 12, Figure 13 and Figure 14.
Figure 12, Figure 13 and Figure 14 do not seem to show a significant influence of the prestress level in the distribution of cracking.
Table 4 presents, for each beam, the average longitudinal distance between cracks ( d m ) and the average angle of such cracks to the longitudinal axis of the beams ( α m ). Only diagonal cracks that cross the entire width of the faces were considered to compute d m . Minors cracks or those associated to localized concrete spalling were not accounted. The angles α m were taken at the mid-width of the faces.
Table 4 confirms that prestress does not seems to influence the distribution of cracking, since the values of d m are similar for the three beams. The values of α m varied from 44.2° to 46.3°, not far from the expected theoretical value of 45° for beams with balanced reinforcement and without prestress. For beams with prestress, the referred angle is slightly smaller to the one of the similar beam without prestress. This shows a small influence of prestress (the prestress levels were not high either). It is known that the existence of an axial compressive force in beams symmetrically reinforced under torsion causes the angle of the diagonal cracks to decrease [17].

5. Conclusions

The experimental results obtained with prestressed HSC hollow beams tested in this study showed the effectiveness of longitudinal prestress to delay the cracking and to increase their resistance to torsion. After cracking, the longitudinal prestress reinforcement starts to effectively behave as an ordinary reinforcement, contributing for the internal equilibrium state of the beams.
Despite the limited number of tested beams, the tests showed that the level of longitudinal prestress can influence the failure mode. It was observed that, as the level of prestress increases, the risk of a fragile failure by concrete crushing in the struts becomes higher. Therefore, the level of compressive stresses in the concrete struts must be carefully controlled and the contribution of the prestress reinforcement must not be neglected. This problem becomes more important in HSC beams when compared to NSC beams, because HSC is more fragile when compared to NSC. In fact, the range of the reinforcement ratios that leads to ductile hollow beams under torsion is larger in NSC beams when compared to HSC beams [6].
The use of longitudinal prestress did not result in high differences with respect to the cracking behaviour of the tested beams.
Despite the limited number of tests presented in this study, the reported results show that there are noticeable differences in the behaviour of the tested beams. After this research program, it became now obvious that some particular aspects of the behaviour of prestressed HSC hollow beams need to be further investigated.

Author Contributions

S.L. supervised the experimental program. L.B. supervised the construction of the test beams, performed the experimental tests and analysed the recorded data with the help of M.T.; L.B. wrote the article with review by S.L. and M.T. All authors have read and agreed to the published version of the manuscript.

Funding

No funding supported this work.

Conflicts of Interest

The authors declare no conflict of interest.

References

  1. Dahl, K.K.B. Uniaxial Stress-Strain Curve for Normal and High Strength Concrete; Report No. 182; Department of Structural Engineering, Technical University of Denmark: Kgs. Lyngby, Denmark, 1992; p. 58. [Google Scholar]
  2. Hsu, T.T.C. Torsion of Structural Concrete—Behavior of Reinforced Concrete Rectangular Members; Torsion of Structural Concrete, SP-18; American Concrete Institute: Detroit, MI, USA, 1968; pp. 261–306. [Google Scholar]
  3. Lampert, P.; Thürlimann, B. Essais de Poutre en Béton Armé Sous Torsion Simple et Flexion Combinées (Tests on Reinforced Concrete Beams under Pure Torsion and Combined Bending); Torsion, Bulletin d´Information Nº 71, Comitée Européen du Béton: Brussels, Belgium, 1969; pp. 177–207. [Google Scholar]
  4. Mitchell, D.; Collins, M.P. Behavior of Structural Concrete Beams in Pure Torsion; Civil Engineering Publication No.74-06; Department of civil Engineering, University of Toronto: Toronto, ON, Canada, 1974; p. 88. [Google Scholar]
  5. Leonhardt, F.; Schelling, G. Torsionsversuche na Stahlbetonbalken (Torsion Tests on Reinforced Concrete Beams); Bulletin No. 239; Deutscher Ausschuss für Stahlbeton: Berlin, Germany, 1974; p. 122. [Google Scholar]
  6. Bernardo, L.F.A.; Lopes, S.M.R. Torsion in HSC Hollow Beams: Strength and Ductility Analysis. ACI Struct. J. 2009, 106, 39–48. [Google Scholar]
  7. Jeng, C.H. Unified Softened Membrane Model for Torsion in Hollow and Solid Reinforced Concrete Members: Modeling Precracking and Postcracking Behavior. J. Struct. Eng. 2015, 141, 04014243. [Google Scholar] [CrossRef]
  8. Bernardo, L.F.A.; Lopes, S.M.R. Behaviour of Concrete Beams under Torsion—NSC Plain and Hollow Beams. Mater. Struct. 2008, 41, 1143–1167. [Google Scholar] [CrossRef]
  9. Bernardo, L.F.A.; Lopes, S.M.R. Theoretical Behaviour of HSC Sections under Torsion. Eng. Struct. 2011, 33, 3702–3714. [Google Scholar] [CrossRef]
  10. Lopes, S.M.R.; Bernardo, L.F.A. Twist Behaviour of High-Strength Concrete Hollow Beams—Formation of Plastic Hinges along the Length. Eng. Struct. 2009, 31, 138–149. [Google Scholar] [CrossRef]
  11. Lopes, S.M.R.; Bernardo, L.F.A. Plastic Rotation Capacity of High-Strength Concrete Beams. Mater. Struct. 2003, 36, 22–31. [Google Scholar] [CrossRef] [Green Version]
  12. Bernardo, L.F.A.; Lopes, S.M.R. Plastic Analysis of HSC Beams in Flexure. Mater. Struct. 2009, 42, 51–69. [Google Scholar] [CrossRef] [Green Version]
  13. El-Degwy, W.M.; McMullen, A.E. Prestressed Concrete Tests Compared with torsion Theories. PCI J. 1985, 30, 96–127. [Google Scholar]
  14. Hsu, T.T.C.; Mo, Y.L. Softening of Concrete in Torsional Members—Prestressed Concrete. J. Am. Concr. Inst. 1985, 82, 603–615. [Google Scholar]
  15. Wafa, F.F.; Shihata, S.A.; Ashour, S.A.; Akhtaruzzaman, A.A. Prestressed High-Strength Concrete Beams Under Torsion. J. Struct. Eng. 1995, 121, 1280–1286. [Google Scholar] [CrossRef]
  16. NP EN 1992–1-1. Eurocode 2: Design of Concrete Structures—Part 1: General Rules and Rules for Buildings; European Committee for Standardization—CEN: Brussels, Belgium, 2010.
  17. Hsu, T.T.C. Torsion of Reinforced Concrete; Van Nostrand Reinhold Company: New York, NY, USA, 1984; p. 516. [Google Scholar]
Figure 1. Example of a hollow (box) cross-section for the girder of a bridge deck.
Applsci 10 00642 g001
Figure 2. Geometry and detailing of test beams.
Applsci 10 00642 g002
Figure 3. Uniaxial σ ε curve for concrete.
Applsci 10 00642 g003
Figure 4. Uniaxial σ ε curves for reinforcement: (a) ordinary and (b) prestress.
Applsci 10 00642 g004
Figure 5. Test setup.
Applsci 10 00642 g005
Figure 6. Anchorage zones at both ends of the prestressed beams.
Applsci 10 00642 g006
Figure 7. Beam specimen in test position.
Applsci 10 00642 g007
Figure 8. T θ m curves.
Applsci 10 00642 g008
Figure 9. F p s θ m curves.
Applsci 10 00642 g009
Figure 10. Fragile failure by concrete break off at the corners: (a) Beam D-0 and (b) Beam D-1.79.
Applsci 10 00642 g010
Figure 11. Fragile failure by crushing of concrete: Beam D-3.08.
Applsci 10 00642 g011
Figure 12. Cracking pattern: Beam D-0.
Applsci 10 00642 g012
Figure 13. Cracking pattern: Beam D-1.79.
Applsci 10 00642 g013
Figure 14. Cracking pattern: Beam D-3.08.
Applsci 10 00642 g014
Table 1. Properties of test beams.
Beam. t cm x 1 cm y 1 cm A s l cm2 A s t cm2 A s p cm2 s cm ρ l % ρ t % ρ t o t % m b f c MPa f c t m MPa E c GPa
D-010.953.553.723.750.7907.00.660.671.330.9977.84.3340.7
D-1.7911.454.354.223.750.795.607.00.660.681.340.9780.84.4341.1
D-3.0811.555.054.623.750.795.607.00.660.681.340.9678.83.6637.4
Table 2. Concrete mix design (contents per m3).
ComponentsDosage
Thin sand164 kg
Thick sand908 kg
Crushed Granit 5–11 mm734 kg
Normal Portland Cement (C): Type I/42.5R375 kg
Admixture—Rheobuild 1000 4.8  
Silica Fume (Sikacrete HD)41 kg
Water (A) 145  
A/(C + Additions)0.35
Table 3. Properties of T θ m curves.
Beam T c r kNm θ c r °/m ( G C ) I kNm2 T II = a θ II + b ( G C ) I I kNm2 T t y kNm θ t y °/m T r kNm θ T r °/m
D-0130.50.04172,940a = 170.87; b = 119.439790--355.91.45
D-1.79172.90.07152,188a = 194.73; b = 142.9511,157314.90.87396.01.38
D-3.08184.70.08141,823a = 148.05; b = 132.3414,212430.01.34447.71.57
Table 4. Cracking parameters.
Beam d m cm α m °
D-013.046.3
D-1.7912.944.8
D-3.0813.644.2

