Abstract
Interests in strain gauge sensors employing stretchable patch antenna have escalated in the area of structural health monitoring, because the malleable sensor is sensitive to capturing strain variation in any shape of structure. However, owing to the narrow frequency bandwidth of the patch antenna, the operation quality of the strain sensor is not often assured under structural deformation, which creates unpredictable frequency shifts. Geometric properties of the stretchable antenna also severely regulate the performance of the sensor. Especially rugged substrate created by printing procedure and manual fabrication derives multivariate design variables. Such design variables intensify the computational burden and uncertainties that impede reliable analysis of the strain sensor. In this research, therefore, a framework is proposed not only to comprehensively capture the sensor’s geometric design variables, but also to effectively reduce the multivariate dimensions. The geometric uncertainties are characterized based on the measurements from real specimens and a Gaussian copula is used to represent them with the correlations. A dimension reduction process with a clear decision criterion by entropy-based correlation coefficient dwindles uncertainties that inhibit precise system reliability assessment. After handling the uncertainties, an artificial neural network-based surrogate model predicts the system responses, and a probabilistic neural network derives a precise estimation of the variability of complicated system behavior. To elicit better performance of the stretchable antenna-based strain sensor, a shape optimization process is then executed by developing an optimal design of the strain sensor, which can resolve the issue of the frequency shift in the narrow bandwidth. Compared with the conventional rigid antenna-based strain sensors, the proposed design brings flexible shape adjustment that enables the resonance frequency to be maintained in reliable frequency bandwidth and antenna performance to be maximized under deformation. Hence, the efficacy of the proposed design framework that employs uncertainty characterization, dimension reduction, and machine learning-based behavior prediction is epitomized by the stretchable antenna-based strain sensor.
1. Introduction
Structural health monitoring (SHM) is implemented to evaluate the physical conditions of structures with consistent surveillance. In accordance with the information garnered by an SHM system, engineers can identify the critical roots in structural damage or deterioration and provide applicable approaches to avoid structural failures. Compared with traditional fixed inspections with interval schedules that demand excessive maintenance [1], the SHM systems can operate for condition-based maintenance and reduce preventive maintenance cost, life cycle costs, and potential catastrophic failure [2]. Therefore, the systems can heighten both the capability and reliability of the monitoring system. Application of the SHM systems has been broadened from heavy mechanical equipment or civil structures to aerospace or bio-mechanical examples [3].
In the SHM systems, a strain is regarded as a vital factor, which should be rigorously examined. By measuring strain of structures, a strain gauge is able to predict certain failure modes such as crack propagation, deformation [4], vibration, or mechanical loading [5]. Between copious types of strain gauges, metallic foil pattern is mainly employed because it identifies electrical resistance connected to strain changes under structural deformation. In spite of the benefits of a foil gauge (e.g., simple circuit structure, lower fabrication cost, and applicability in various examples), its usability has been restrained owing to the reliance on long cables corresponding to the power supply and data transmission. An acceptable solution to the issue is to use sensors of passive wireless strain gauge, which reduces dependency on batteries and has lower installation costs. In recent years, great attention has been paid to passive wireless antennas on account of their compelling suitability to observe strain of structures [6].
An antenna installed on the surface of a deformable structure transfers details about the strain variations. It is approachable to evaluate the stability and physical circumstance of the structure with the transferred data of the strain variations. In the strain gauge markets, interests in micro-strip patch (MSP) antenna have increased because of lower fabrication cost, lighter load, lower profile planar configuration, and capability of multiband operation [7]. Thus, the majority have still exploited a rigid patch antenna to capture strain variation. However, the conventional rigid patch antenna often fails to deliver reliable information owing to two critical drawbacks: mediocre consideration for non-uniform geometric uncertainties [8] and limited bandwidth of resonance frequency (Rf) [9]. To assure the performance of the MSP antenna-based strain sensor, these two drawbacks should be meticulously examined.
The first drawback is about the geometric uncertainties on the surface of the substrate of an antenna shown in Figure 1a. As depicted in Figure 1b, a typical scanning electron microscope (SEM) shows that the substrate surface has certain scratched patterns, which makes the substrate rugged, so there exist obtrusive thickness variations on the substrate. Variation of the substrate roughness is unavoidable because the unstable fabrication process requires manual operation by engineers [10]. The geometric uncertainties due to this surface roughness are more critical for the stretchable antenna-based strain sensors, which broaden the applicability of such sensors for the wearable devices or human body. Compared with conventional rigid antennas, the uncertainties have a much stronger influence on the performance of the antenna along with the non-uniform changes under deformation [11,12,13]. Therefore, the substrate fabrication has been steadily operated with polydimethylsiloxane (PDMS) or other stretchable materials to be firmly attached to the surface of rough structures [14].
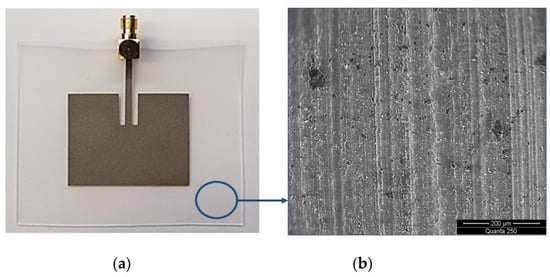
Figure 1.
Stretchable antenna. (a) The antenna (dark color) and the polydimethylsiloxane (PDMS) substrate (light color); (b) scratched surface of the substrate observed by FEI Quanta 250 scanning electron microscope (SEM) device.
In the computer-based design and analysis of stretchable antennas for a strain gauge, usually, an assumption of uniform thickness is made to reduce design complexity and computational burden. However, if the randomness corresponding to the thickness is overlooked, reliable response assessment of the MSP antenna-based strain sensor can be impeded. As already proven by various simulations and measurements [15,16,17,18,19,20], although the analysis of the non-uniform substrate-based antenna is always more complicated than that of constant substrate-based antenna, it involves better reliability predictions as the approach corresponding to the uneven substrate represents the real environment. Thus, it is absolutely imperative to examine the thickness variation to improve the reliability of the antenna-based sensor.
Unfortunately, however, considering the roughness would bring extremely increased computational costs as well as total number of design variables (DVs). It is indispensable to capture and propagate all possible critical variables and the corresponding uncertainties to ensure that the system is reliable, but such an approach would incur high dimensions of DVs, increasing computational complexity [21]. Furthermore, once the DVs are contaminated by the immensely correlated random behavior, the extravagant variables obstruct the reliability of the performance estimation [22,23]. To eliminate these issues, a rigorous design of stretchable electronics based on efficient capturing and modeling of correlated and high dimensional random variables is required [24]. Therefore, this study proposed a dimension reduction (DR) framework to effectively manage uncertainties especially occurring for the substrate thickness. In the framework, a Gaussian copula is utilized [25] to precisely model the intricacy of DVs. The intricacy can be described by a joint distribution that consists of manifold marginal distributions. After modeling the geometric uncertainties, a clear guideline engaging the entropy-based correlation coefficient was exploited to suggest a better decision between feature extraction and selection. Through the guideline, engineers can embrace a competent choice of an efficient DR method based on multivariate data properties. In accordance with the entropy-based correlation coefficient, two DR methods, particularly feature extraction and feature selection, diminish the overabundance of the DVs. Specifically, the performance of two feature extraction methods (principal component analysis (PCA) [26] and auto-encoder (AE) [27]) are evaluated to identify the one that gives the best predictions, while feature selection employs independent features test (IFT) [28]. Details will be addressed in the following sections.
The second drawback is about the narrow bandwidth, which often fails to warrant the operation of the MSP antenna for measuring strain. In general, information transferred by a radio frequency system is only trustworthy within the desired frequency bandwidth. Owing to the unforeseen structural deformation that produces extreme frequency shifts, the stretchable strain sensor cannot perform stable detection when the frequency deviates from an allowable bandwidth. To handle this issue, manifold solutions have been proposed. Specifically, the ultra-wideband (UWB) wireless system is used to facilitate multiple broadband and a high data rate, which enlarges the range for frequency activity [29]. However, the solution is not convincing owing to the complicated design process, power limitation, and standardization. Other approaches engaging optimization techniques also exist, but most have focused on sizing adjustment of the antenna [30]. Even though the sizing optimization can draw simple and efficient antenna update [31], the technique forces the antenna to maintain its original shape, which interrupts a fundamental solution regarding the narrow bandwidth. Furthermore, topology optimization with solid isotropic material with penalization or the level set method has been exploited to address the issue [32], but the efficiency of the suggested design is only identified when it is fabricated by special additive manufacturing process, which intensely increases the fabrication burden. Assorted studies have also suggested unique shape modification such as conical, pentagon, or even fractal geometry [33,34], but such modifications refuse to preserve an initial outline of the MSP antenna that has advantages of cheaper and easier fabrication process and diverse applicability, so their efficiency is only meaningful in a specialized example.
To address these issues of the existing design approaches for the stretchable antenna, a design optimization process that includes a structural shape optimization is proposed in this study. In comparison with the existing approaches, the proposed design process not only inherits the advantages of the MSP antenna, but also derives an innovative antenna shape to enhance functionality in the multi-physics domain. Owing to the mechanical flexibility and electrical radio frequency behavior, the stretchable MSP antenna for strain gauge requires a meticulous multidisciplinary design optimization. Thus, the proposed design maximizes the frequency stability and antenna performance, referring to a return loss under unexpected structural deformation. The optimum design is garnered in accordance with the basic shape of the MSP antenna, so that it can truncate an intense fabrication burden. The design also operates at dual bandwidth to keep the benefit of UWB, but it induces less design intricacy. For the system response prediction, the proposed framework employs the artificial neuron network (ANN)-based surrogate model under geometric uncertainties stemming from the stretchability and fluctuating antenna substrate. Finally, the reliability of the proposed design is evaluated by the probabilistic neuron network (PNN) and Monte Carlo simulation (MCS).
This paper is structured as follows. Section 2 introduces backgrounds of the Rf fluctuation under structural deformation and the DR methods. Section 3 introduces the proposed design framework employing the DR methods and shape optimization to determine the optimal new design of the stretchable antenna-based strain sensor. In Section 4, an example of the MSP antenna employed as a stretchable strain gauge is provided to represent the efficacy and merits of the proposed framework.
2. Micro-Strip Patch Antenna and DR Process
2.1. Micro-Strip Patch Antenna
An MSP antenna is composed of a patch, a feed line, a dielectric substrate, and a ground, as depicted in Figure 2a. Owing to the effect of the inductance and the capacitance, intrinsic resonance frequency (Rf) is produced where inductive and capacitive reactance offset each other, which results in a transfer of signal and power. The Rf fluctuates as the antenna geometry is changed, which directly indicates how much the antenna is distorted. The antenna employed in a strain gauge normally adheres to the fragile surface of a structure, and the antenna’s shape will be changed in which the structure is deformed. Rf is then promptly changed in accordance with the structural deformation of the antenna. Therefore, it is ineludible to monitor the Rf variation of the antenna to observe the status of the structured deformities [4]. As shown in Figure 2b, the Rf can be appraised based on the geometric information as follows:
where ∆Lle, Le, ԑre, and Cl indicate variation of the electrical length, the phase length, the effective dielectric constant, and the velocity of the light, respectively. Here, the phase length stands for the geometric dimension of the patch along the direction of antenna’s line extension and radiation mode. The effective dielectric constant is rephrased by
where We, H, and ԑr represent the patch’s electrical width, constant thickness, and substrate’s dielectric constant, respectively. On the basis of Equation (2), the phase length, ∆Lle, is denoted by the dimensions:
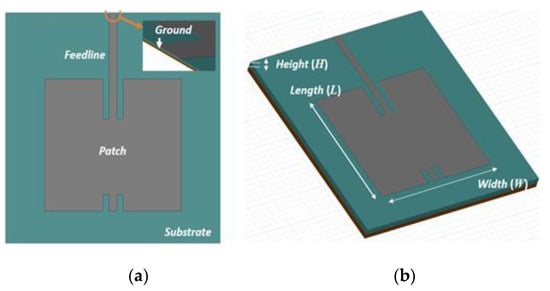
Figure 2.
Micro-strip patch (MSP) antenna. (a) Composition of the MSP antenna; (b) parts of the patch and the substrate.
The Rf fluctuation depends on the path of the tensile strain (ԑL). While an observed Rf that is higher than the initial Rf implies the strain was employed in the electrical width direction (Le), the value of the Rf should be less under the strain that is applied along electrical length direction (We). The frequency oscillation is caused by Poisson’s effect by
where vp, Wo, vs, and Ho denote the Poisson’s ratios of the patch, the original width, the Poisson’s ratios of the substrate, and the thickness, respectively. By a variation of the tensile strain, (We/H) is elucidated as independent in the case where the proportion of width to thickness is less than one. Here, the Poisson’s ratios, vp, and vs, will be the same, leading to the same ԑre and ԑr. Hence, the Rf when a strain, ԑ, is applied along the vertical direction will be denoted by
where Ro f indicates the Rf that is estimated by Wo and Ho. In this study, an example of the tensile strain applied along the width direction is demonstrated. The patch and substrate are able to derive significant effects on the antenna performance. Existing research has suggested ways to intensify the productivity of the antenna by modifying copious antenna components [35,36], but there exists no rigorous deliberation in terms of the variation of the substrates thickness so far [7]. Such deliberation regarding the variations is essential because most fabrication of the substrate is manual. Also, the interests in printable or wearable antenna applications make the deliberation of non-uniform surfaces valuable. Therefore, it is fairly necessary to assume that the substrate thickness varies; however, these additional concerns demand excessive growth in the number of corresponding responses and DVs. When the engineers decide to weight the additional intricacy, it is typical to encounter the curse of dimensionality, which demands the DR methods in the design process.
Copious DVs result in the curse of dimensionality, which triggers unreliable data assessment in classification and function approximation [37]. Furthermore, the multivariate variables are strongly correlated and arouse the redundancy of the data. The higher redundancy imposes negative impacts on the estimation of the system performance because the inter-correlated data is probably required to represent properties already taken into account. To describe the redundancy, Entropy [38] is often exploited. The uncertainties of a certain random variable are measured by Entropy (H) exploiting a probability distribution [39]. Here, x referring to a random variable H is represented by the following:
where p(xi) means the marginal probability of x. According to the H, the redundancy (Re) is able to be re-written as follows:
where log2 N indicates the maximum H with the entire samples (N). In order to elevate the assessment accuracy of the system performance, the DR approach is conducted in this research. The DR technique is generally conducted by the main methods: feature extraction (FE) [40] and feature selection (FS) [41]. While FE transforms the initial features located in the higher dimension to lower-dimensional new features, FS takes the most substantial subgroup of the raw features. Details of the DR methods will be explained in the following sections.
2.2. Feature Extraction (FE)
FE builds distinct features in the lower dimension using a conversion of the initial features. This DR method can be interpreted as a mapping, which reduces the Re of original data. The newly extracted features include most related properties from the initial data. Two major methods, principal component analysis (PCA) [26] and auto-encoder (AE) [42], are explained in this research.
2.2.1. Principal Component Analysis (PCA)
To draw independent and uncorrelated features from heavy correlation, PCA employs orthogonal transformation, which is represented by Y = PX. The transformed matrix, Y, is explained by a transformation matrix, P, and the original data set, X. In order to conduct a linear transformation, X and Y will contain numerous examinations and variables, which can be described as m and n, respectively. Specifically, PCA requires a decomposition of eigenvectors [26] to truncate the data dimension. A covariance matrix, CY, can be acquired by
In Equation (8), A = XXT, which implies a symmetric condition. A consists of the eigenvectors in the rows of the matrix, P, and is denoted by PTDP. Here, D stands for a diagonal matrix that should be connected to equivalent eigenvectors of matrix A. The property of an orthonormal matrix allows the inverse of the matrix P to be equal to its transpose. Thus, principal components corresponding to X will act as the eigenvectors of PCx = (n − 1)−1XXT, and the diagonal variables of CY should be the X’s variance.
2.2.2. Auto-Encoder (AE)
While PCA sometimes faces its limitation in non-linear data analysis [26], auto-encoder (AE) is not restricted by the drawback of data linearity. As a special case of the artificial neural network (ANN) [42], AE handles the DR by converting the raw data. AE generally includes three different layers, which are the input, output, and hidden layer, respectively. AE also contains a reconstruction process of the raw data in the output layers. The data will be transformed with a bias and a weight function in the hidden layer. To reduce the gap between the raw and newly recreated data, AE tries to minimize the mean squared error corresponding to the reconstruction [43]. The reconstruction error (re) is evaluated by the squared-error cost function,
where W, T, x, and b refer to the weights, transpose of the respective vector or matrix, input units, bias, and input vector, respectively. Here, X stands for input vector. A sparsity constraint exploits to minimize the total number of hidden units, so that AE can be conducted as the DR. Owing to the constraint, AE has a bottleneck shape. Some of AE’s neurons will be inoperative by applying the sparsity constraint to the hidden units. The hidden layer’s average activation can be defined by
where aj(k) denotes the activation of hidden layer k and the hidden unit j. To promote the sensitivity accuracy, an extra penalty term (P) is considered.
where s and ρ represent hidden layers and the sparsity parameter, respectively. When the activation value becomes zero, a relation of Ψ = ρ is acquired.
2.3. Feature Selection (FS)
Unlike FE, FS does not take into account the same dimension when the initial data are reconstructed. It just focuses on grabbing the most significant subgroup in the lower dimension. The importance of the elected subset may not be ensured if the subset contains meaningless properties of the initial data. Diverse studies have been achieved using the mutual information method, genetic algorithm, and single variable classifier method [43], but those methods still have handicaps, that is, huge computational complexity and untrustworthy assessment of the data distributions if the behavior of the distributions is not clearly provided [22]. On the other hand, independent features test (IFT), called the simple hypothesis test [27], is able to quickly discard unnecessary features. For this advantage, IFT will be employed in this proposed framework. The target data are assumed as categorical, so IFT allows all features to be assigned to two categories. This approach is conducted by a scoring value of informative features, SVIF.
From Equation (12), two data sets related to the feature (F)’s values can be described as A and B, where n1 and n2 denote the number of the features employed in the categories. With variance, v, and mean, μ, the significance value of data can be calculated. In accordance with a threshold, sv, indicating the significance value to eliminate unimportant features, IFT is able to get the best features. In general, it is suggested that the significance value is equal to or greater than 2 [27].
3. DR-integrated Framework for Optimized Design
On the basis of the developed framework, the DR procedure will be combined with the shape optimization. Even if the framework is expressed with an MSP antenna example, the framework is generalized to be applicable for different design applications, which can be affected by the issue of the curse of the dimensionality. The framework is composed of four steps, as represented in Figure 3. Step 1 shows multivariate input variables that will be randomly created. From Step 2, Re of the variables will be minimized by the DR, improving computational productivity. In Step 3, the framework integrated with the DR will find the optimal design. Finally, the reliability of the optimized design of an MSP antenna will be assessed.
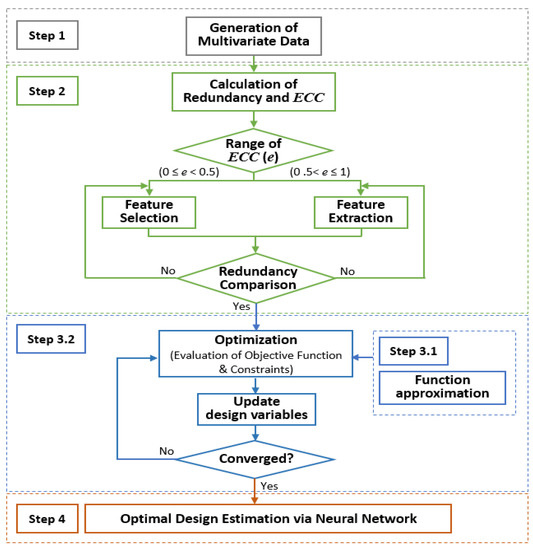
Figure 3.
Proposed optimum design framework with the dimension reduction (DR). ECC, entropy-based correlation coefficient.
3.1. Generation of Multivariate Data Random Thickness
The design framework in Figure 3 starts with the generation of random multivariate data including a strong correlation in Step 1. For example, in the design space of the antenna application in this study, the correlation will be considered for the substrate thickness. A Gaussian copula is proposed to be used in this study to meticulously create multi-dimensional random behavior. In comparison with the conventional methods that require a linear correlation coefficient [44], the copula takes two clear benefits: (1) it creates multi-dimensional data, although the DVs contain each distinct marginal distribution; and (2) it analyzes the correlation between the random variables that have non-linear behavior. Hence, in Step 1, the most realistic properties in the multi-dimensional space will be demonstrated. A joint distribution, JXY, is denoted by the two distinct marginal distributions, F1 and F2,
Here, CP represents the copula function (CP: [0,1]2 → [0,1]),
where, ρ, x, and y stand for the linear correlation coefficient, and the marginal distributions of both x and y. Moreover two different copula parameters are represented by h and k, and the standard univariate Gaussian distribution is denoted by Φ.
Therefore, the copula function builds the sample dataset by exploiting the parametric multivariate distribution. The samples can then be generated from the copula and can be utilized for stochastic analysis to model and simulate a complex engineering system.
3.2. Entropy-Based Correlation Coefficient (ECC)
Step 2 of the proposed framework involves the DR process. In the high dimensional system analysis, it is required to make an obvious guideline to decide which DR method (i.e., FE or FS) should be accurately employed. In the framework, an explicit criterion is presented to properly select either FE or FS. The criterion can be exploited in accordance with a status of random variables’ correlation. As a conventional method, linear correlation estimation [45] measures the degree of the correlation between the data sets. But the approach cannot be supported once features contain non-Gaussian distributions, non-linear correlation, or correlation coefficient of 0.5. To overcome these challenges, it is inevitable to provide a distinct criterion corresponding to an entropy-based correlation coefficient (ECC) denoted by e [46]. A joint entropy, HXY, is calculated by
where pjoint(xi) and pjoint(yj) are the joint probability distributions of xi and yj, which are the random variables. As a basic concept of mutual information (MI), entropy can be used to measure dependence, but it does not have a satisfactory scale as the maximum value depends on the size of samples [47]. Hence, the ECC from the normalized MI rescales the MI values to be between 0 and 1. The status of the dependence between the random variables is then calculated by e:
Here, 1 refers to heavy correlations, and vice versa. On the basis of two different ranges of e, 0 ≤ e < 0.5 and 0.5 ≤ e < 1, the proposed framework can provide a guidance to use either FE or FS. The first range indicates that the behavior of the variables is independent and uncorrelated. Thus, the FS will minimize the size of the multi-dimensional data. The second range, on the other hand, means that there is a correlation between multivariate data. Hence, FE will be suitable to reduce the redundancy of the data, Re, originated from the strong correlation between multivariate data. When the value of e in Equation (16) is close to 0.5, it suggests engineers may employ both DR methods. After the reduction proceeds, the comparison of Re values calculated by Equation (7) is required to confirm whether or not sparse features are sufficiently acquired. If the raw features still include higher Re compared with the gleaned new features, an additional DR process might be required. Thus, the combination of e with Re can be considered as a reliable solution that can draw independent and sparse features by reducing the computational cost.
3.3. Optimization
Once the DR process is conducted in Step 2, an optimization process is then utilized in Step 3 for the optimal design of the application structure or geometry. A function approximation of the actual physical calculations is often required to alleviate the computational burden during the iteration process of the optimization. Therefore, a machine learning-based surrogate modeling technique, namely the artificial neural network (ANN) [27], will be exploited in this research. Compared with the traditional surrogate modeling approaches conducted by linear programming [48], decision trees [49], and discriminant analysis [50], ANN possesses two major benefits: (1) the credibility of ANN is assured in which the decision domain holds complex shapes that are difficult to secure, and (2) ANN is able to be conducted for both classification and function approximation. Essentially, ANN is preferred to be used for the function approximation approach to take the complex contours in the decision domain.
3.4. Predicting Reliability of the Obtained Optimal Design
Once the DR and the optimization are exploited, the reliability of the acquired antenna’s optimum design will be checked. This might be a noncompulsory step based on the ascribed design problem. Generally, when a multi-dimensional system is evaluated, it is frequently computationally exorbitant to analyze further response statistics such as reliability of the system. Hence, although ANN is employed for the function approximation during the optimization process in Step 3, in Step 4, another neural network method, called the probabilistic neural network (PNN), is utilized as a classification process is needed for the reliability assessment. As a major advantage, PNN does not require expensive computational costs because of the fast and straightforward training procedure when compared with ANN. The performance of PNN is assured by the Parzen nonparametric estimator and the Bayes decision rule, which lessen the predicted risk of misclassification [51,52].
The following section presents the applicability of the proposed framework by a design example of the stretchable MSP antenna.
4. Stretchable MSP Antenna-Based Strain Sensor
In general, antennas that perform in a single frequency band become a barrier of careful surveillance because of the harmful radiation of wireless components and the interruption of data signal transmission. Hence, the efficacy of the single-band antenna cannot to be ensured. For this reason, a dual-band antenna should be utilized to improve the reliability of the stretchable strain-based MSP antenna. In this example, a dual-band antenna functioning at 2.5 GHz and 5 GHz, usually exploited for wireless fidelity, was regarded. On the basis of composition of the MSP antenna, as shown in Figure 2, vital DVs and the material properties are listed in Table 1. Here, μ and COV stand for mean and coefficient of variation, respectively.

Table 1.
Geometric and material properties of the stretchable micro-strip patch (MSP) antenna.
To investigate the behavior of stretchable antennas, a multi-physics analysis that includes both the strain estimation under mechanical deformation of the antenna and the Rf estimation by electrical analysis is required. In the previous research [8], such a multidisciplinary analysis was performed for a stretchable antenna geometry and it was shown that the fluctuating thickness of the substrate resulted in a high return loss. This result was because the uncertainties of the substrate thickness led to the escalation of forged feed radiation and surface waves, which limit the range of the bandwidth. Therefore, in this proposed framework, a design optimization process was also utilized to find the optimal contour of the antenna patch to maximize antenna efficiency by reducing the return loss. The existing geometry in the work of [8] was used as the starting geometry in the optimization process; therefore, first, the dimension reduction and prediction using Steps 1 and 2 of the proposed framework were used for the starting geometry.
In the analysis of the antenna, first, a displacement that results in a tensile strain along the width direction, which is denoted as the y direction on Cartesian coordinates, was applied on the antenna substrate, as demonstrated in Figure 4a. In the structural analysis to evaluate the deformation of the antenna under this tensile strain, a linear static finite element analysis (FEA) was employed in this study using the commercial software ANSYS®. As the geometry and the applied displacements are also symmetric, while the material properties are assumed to be isotropic, symmetry boundary conditions were utilized, as shown in Figure 4b. In this study, it was assumed that the maximum applied tensile displacement on the stretchable antenna is 12 mm. The deformation of the stretchable antennas might be larger, but for demonstration purposes, 12 mm was considered in this study as the bound of the displacement of the stretchable antenna. The application can easily be extended for larger displacements in a future study.
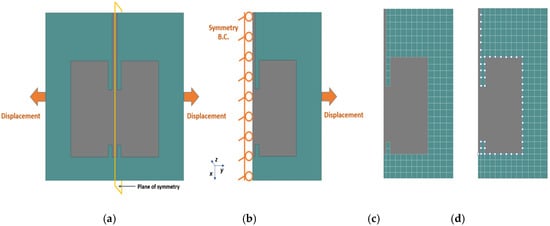
Figure 4.
Schematic of the stretchable MSP antenna. (a) Boundary conditions for the tensile test; (b) symmetry conditions; (c) 202 divided substrate parts containing different thickness and 1 patch with a constant thickness; (d) 57 Cartesian coordinates of the patch.
The substrate of the antenna was discretized into 202 rectangular regions that represent the fluctuating substrate thickness, as shown in Figure 4c by white bounds. The outer geometry of the patch shown by gray color was discretized into 57 points, as depicted by white nodes in Figure 4c. Once the deformed shape of the antenna was obtained from the FEA of the antenna model in Figure 4, the return loss and Rf of the deformed antenna geometry were calculated using a commercial software called High Frequency Structure Simulator (HFSS).
4.1. Generation of Multivariate Data for the Varying Thickness
To model the substrate thickness fluctuation, a stochastic representation of a random field was taken into account. For this purpose, a Gaussian copula was employed to generate the random behavior corresponding to the thickness variation. Figure 5 demonstrates how the copula builds a joint distribution including two distinct sampling sets of thickness variation. First, the roughness of the substrate made of PDMS material was measured by Contour GT-I 3D Optical Microscope. The measured roughness data were added onto the mean thickness of the substrate, which is 0.9705 mm, to describe the variation of the thickness of the whole substrate. In this process, the Gaussian copula generated the random thickness samples engaging several marginal distributions of each sampling set of the thickness variation. Thus, the antenna can be modeled with the substrate, containing 202 small parts that have random different thicknesses and the patch with a thickness of 0.03 mm. Specifically, 500 FEAs were performed with different displacements generated within the range from 0 mm to 12 mm. For each of these simulations, 202 inter-correlated random thickness values were created from the Gaussian copula.
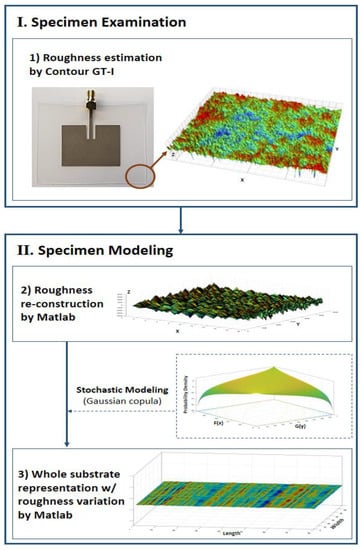
Figure 5.
The Gaussian copula employed to demonstrate a joint distribution of random sets of thickness variation.
4.2. DR Process for Variation of the Substrate Thickness
Before conducting the DR, e of the initial thickness variation was calculated as 0.684 using Equation (16). This value is greater than 0.5, indicating that the correlation between the thickness data set is strong. This result indicates that FE should be used as the DR according to the proposed framework shown in Figure 3. The performances of two different FE methods, namely PCA and AE, were evaluated in this study. PCA and AE took 32 and 103 dominant components, respectively. In Table 2, the error was calculated for each method by
where Dnew and Dorg stand for the redundancy of diminished data and that of initial data, respectively. Unlike PCA, AE had higher redundancy because it took extra neuron training processes. However, the dimension taken by AE drew a lower reconstruction error (2.71%) than that taken by PCA (3.27%).
Table 2.
Redundancy prediction and estimation error of the thickness coordinates. DR, dimension reduction; PCA, principal component analysis; AE, auto-encoder; ANN, artificial neural network.
4.3. ANN-Based Surrogate Model to Predict Antenna Deformation
Once the DR was conducted, ANN was constructed to predict Cartesian coordinates of geometry points of the antenna patch, shown in Figure 4d, referring to the shape of the antenna under structural distortion. In the process, the number of variables of thickness variation and simulation was 202 and 500, respectively. The data obtained from these simulations were used to train the ANN model without the DR, with PCA, and with AE. As listed in Table 2, the trained ANN without DR led to a prediction inaccuracy of 7.03% and 7.62% for the x and y coordinates, respectively. When PCA and AE were used as two different DR methods, on the other hand, this error was reduced, as seen in the results in Table 2.
4.4. Dimension Reduction of Coordinates of the Patch
In Section 4.2, the DR was employed to analyze the antenna’s mechanical behavior to obtain the coordinates of the geometry points of the deformed patch as the outputs. Then, these geometry points are used as the inputs for the electrical analysis of the deformed antenna to calculate the Rf value as the output. On the basis of the inputs, HFSS software was used to check the Rf behavior of the distorted antenna. As output data, 121 resonance frequencies were taken into account.
As this is a new analysis after the mechanical analysis, it was inevitable to conduct the DR for the electrical system behavior as well. The ECC value, e, was calculated as 0.442 for the deformed antenna inputs, which are the coordinates of the patch geometry points. This value was less than 0.5, indicating that FS should be used as the DR method in the electrical analysis step. The FS method used in this study was the IFT method and unnecessary coordinates were eliminated based on the significance value of 2. As a result of the IFT method, 28 meaningful coordinates were selected, as shown in Figure 6. Although the Re value for the initial coordinates was calculated as 8.382, it was calculated as 5.623 for the deformed coordinates. Thus, it indicates that IFT precisely achieved the Re reduction of 32.11% and the correlation of the original coordinates was changed to the independent and uncorrelated ones. In Figure 6, the white points represent the 28 points identified by the IFT method. It is seen that the number of input geometry points for the electrical analysis was reduced from 57 to 28. Although the total number of these selected points is still high, those are the necessary ones to accurately represent the geometry.
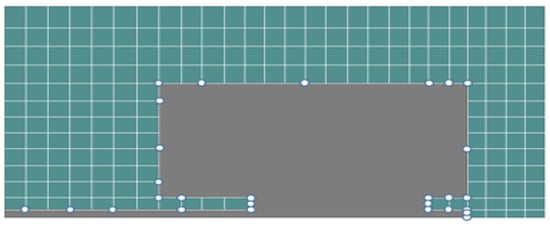
Figure 6.
Selected new significant coordinates.
4.5. Optimization
Once the analyses were conducted for the initial geometry and the necessary geometry points of the antenna patch were determined, a shape optimization was utilized to improve the performance of the antenna. As explained in the introduction, diverse studies on the strain patch antenna have already been conducted by optimization, but most of them have concentrated on the sizing optimization to take updated height, width, or length of the antenna systems. The optimization may fail to boost the productivity of the antenna because the optimized design almost maintains its original shape. Topology optimization has also been employed to develop a new design, but its efficiency is only considerable under expensive additive manufacturing fabrication. In this study, therefore, a shape optimization was used to find the optimal shape of the antenna patch that minimizes the variation of the Rf and the return loss. It implies that, not only can the possibility of frequency shift induced by structural deformation be decreased, but also the performance of the antenna corresponding to electrical return loss will be maximized. Here, the lower return loss is guaranteed, and the better antenna performance is expected. Unfortunately, however, the explained general equations (Equations (1)–(5)) corresponding to the Rf variation have an assumption that the substrate should have a constant thickness. This assumption only draws a linear relation between the shift of the Rf and the strain. With respect to the stretchable strain MSP antenna including the thickness variation of the substrate, the direction of the Rf shifts could be anticipated by the general equations, but a correct calculation of the shift will not be guaranteed. For those reasons, in this study, a surrogate model to establish a relation between mechanical and electrical behavior of the antenna system was developed, engaging detailed FEA for structural deformation in ANSYS® and electrical analysis in HFSS. The Rf shift and the return loss respecting the structural deformation with additional attention of thickness variation were analyzed with the help of this surrogate model.
To establish objective functions, the substrate thickness variation and distorted patch’s shape were considered. The function approximation modeled by ANN was combined with the shape optimization process. To escalate the capability of the antenna, an additional objective function was employed to truncate the return loss.
where Rff and Rfs stand for Rf of frequency samples and Rf under applied strain (ԑ). x, ɵ, S, and γ refer to a vector of the DVs, bandwidth regarding a return loss of −10 dB, the return loss, and acceptable return loss, respectively.
The bandwidth corresponding to −10 dB was employed to assure enough antenna operation, and the strain of 30% was established based on the boundary exploited in the FEA. This constraint enables linear static analysis. In order to utilize the benefit of UWB, dual bandwidths, 2.5 GHz and 5 GHz, which are preferred in a wireless fidelity (Wi-Fi) were considered. Moreover, a spline curve was used to model the geometry of the patch antenna with 28 geometry points. The spline coordinates were considered as the DVs, x, and the minimum and maximum boundaries of the coordinates were determined to bring optimum shape change of the initial MSP antenna. Particularly, the coordinates of feedline in the length direction were firmly restricted to keep the initial shape of the MSP antenna. The optimization process includes significant attention associated with the strain applied along the width direction. On the basis of the equation of the frequency shift, even though the strain occurs along the length direction, which can make the patch’s length varied owing to the Poisson’s ratio, the variation will not bring a major impact on the variation of the Rf. Thus, design space around the patch had much more design freedom to improve antenna’s operation than that around the feedline. To conduct multidisciplinary design optimization, genetic algorithm (GA) was exploited in accordance with the developed ANN-based surrogate model. For the algorithm, 1000 iterations, crossover probability of 0.96, and mutation probability of 0.01 were used. After conducting the optimization process, a butterfly-shaped antenna was garnered, as shown in Figure 7. Locations of the acquired spline coordinates by the optimization were slightly modified to have a smooth contour. As anticipated, it focused on reducing the variations of the width of the antenna patch, not on that of the length. It could boost the antenna’s operation under the applied longitudinal strain. The optimization process drew a reasonable outcome, coinciding with the equations mentioned above in Section 2.
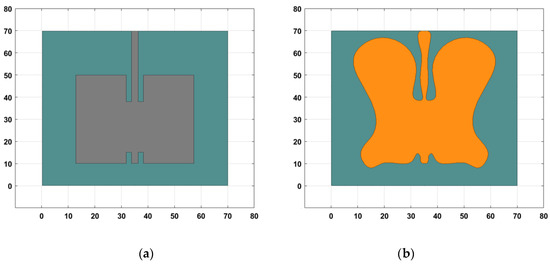
Figure 7.
Design of the MSP patch antenna. (a) Initial antenna design; (b) optimal antenna design.
To assure the exactness of the optimized butterfly-shaped design, HFSS was utilized to evaluate the frequency shift. The results of the undeformed antennas are shown in Figure 8. In accordance with the employed bandwidth of −10 dB, an acceptable Rf range of the antenna was assigned from 2.3454 GHz (a) to 2.6539 GHz (b) and from 4.9130 GHz (c) to 5.1070 GHz (d) under 0 mm displacement, as depicted in Figure 8.
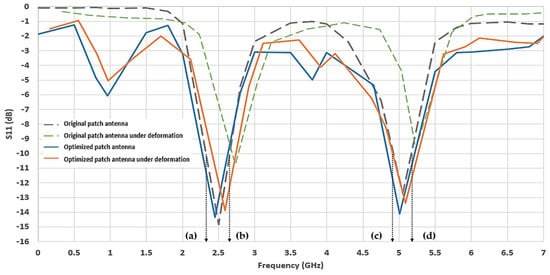
Figure 8.
Rf comparison of initial, deformed, non-deformed optimal antenna, and deformed optimal antenna. (a) 2.3454 GHz; (b) 2.6539 GHz; (c) 4.9130 GHz; (d) 5.1070 GHz.
First, the capability of the suggested optimum design was compared with the initial antenna design when the deformation exists for both. Once the deformation of 12 mm is applied to the initial antenna, Rf drastically shifts, ranging from 2.5 GHz to 2.73 GHz and from 5.05 GHz to 5.23 GHz, which states that the antenna functionality will not be ensured because they deviate from each acceptable Rf range regarding 2.5 and 5.0 GHz. The return loss also decreased by 27.6% and 31.8%, respectively. As expected, the performance of the antenna was deteriorated under the deformation. Especially the antenna design in 5 GHz should be restricted owing to miserable return loss, which is higher than −10 dB. Contrary to the initial antenna, on the other hand, the optimized antenna excluding the DR process acquired credits for its flexible possibility under the tensile strain by enabling the Rf to be maintained in the reliable range (ɵ) and the return loss to be kept under −10 dB, as elucidated in Table 3.
Table 3.
Comparison of resonance frequency (GHz) and return loss (dB) under strain test.
Also, a comparison of two additional designs regarding the DR process antenna was conducted. In Table 3, the design of the initial MSP antenna design including DR led to a better operation than that of the initial antenna itself. Although, its improvement is not enough to dominate the initial antenna design with an optimization. As predicted, the optimized antenna design with DR had notable improvement when compared with all other cases. Therefore, the uncertainty-reduced optimal MSP antenna design could be a dominant approach because general wireless receivers would be employed without any additional extension work on the bandwidth.
4.6. PNN for Classification of the Resonance Frequency
In the final step, the reliability of the optimal MSP antenna was analyzed in accordance with the reliable range of ɵ. The antenna must operate within the range even though it is under deformation. The range was estimated by the non-deformed MSP antenna. From the previous step, the dual bands antenna under no displacement took the following range (ɵ):
For reliable classification, the limit state function was exploited. According to the concept of the limit state function [53], the capacity or resistance of the antenna must be appointed to 2.5 GHz. However, if the absolute value of g is greater than 0.3085 (difference between 2.3454 GHz and 2.6539 GHz) and 0.194 (difference between 4.9130 GHz and 5.1070 GHz) at 2.5 GHz and 5 GHz, respectively, the designed strain MSP antenna will stay in class B, implying that the system must be ignored owing to the unreliable Rf. The Monte Carlo simulation (MCS) [53,54] was employed to estimate the probability of failure (Pf). On the basis of the Pf, the results of MCS with 10,000 random variables and PNN with 121 random variables were compared to assure results of the reliability estimation. As explained in Table 4, each Pf difference between PNN and MCS was 6.46% and 6.91% at 2.5 GHz and 5 GHz, respectively. In comparison with the original variables, the truncated coordinates obtained by IFT had a Pf of 0.291 and 0.325 by drawing 4.67% and 4.06% of Pf increase, respectively. Furthermore, the Pf acquired by IFT was close to that obtained by MCS (9.48% and 9.41%, respectively), which is less than 10%, so it can be a reliable threshold, eliminating computation-intensive tasks, for the classification process.
Table 4.
Probability of failure conducted by probabilistic neural network (PNN) and Monte Carlo simulation (MCS).
5. Conclusions
In this research, a design framework exploiting a DR approach, machine learning-based surrogate modeling, structural optimization, and reliability assessment was proposed to handle a multivariate and multidisciplinary engineering system. The efficiency of the proposed design framework was addressed by a stretchable MSP antenna-based strain sensor.
Compared with the conventional rigid antenna, the efficiency of the proposed stretchable antenna design was highlighted because it contains careful consideration for all possible mechanical flexibility, which weights realistic system prediction and estimation. Such consideration demands meticulous examination on the flexible substrate that includes non-uniform thickness. In this research, therefore, the non-uniformity was regarded as the DVs to represent geometric uncertainty captured by a Gaussian copula function. With the copula function, a non-uniform substrate thickness was represented by 202 subparts, taking the mean of 0.9705 mm and the COV of 0.05. However, a huge number of DVs escalate the redundancy and complexity of data, inhibiting precise system prediction and estimation. In order to resolve the issue, the proposed framework employed a DR process, particularly FE and FS. In the DR process, ECC (e) was exploited as a clear guideline that suggests a better DR method grounded on data behavior. On the basis of the ECC estimation, FE was employed to reduce data redundancy regarding the substrate non-uniformity in which e is greater than 0.5, whereas FS eliminated unnecessary coordinates of the patch within the specific case (0.5 ≤ e < 1). Both FE (PCA and AE) and FS (IFT) derived good redundancy reduction of 50.21%, 44.57%, and 32.11%, respectively. With the criterion, engineers can make a decision on the applicable DR process and management of multivariate data.
Moreover, owing to the limitation to formulate a relationship between structural deformation and electrical antenna’s response, the ANN-based surrogate model employing the multivariate data purified by the DR process was developed to predict a complex engineering system. As the second drawback of the stretchable MSP strain sensor, the narrow bandwidth that restricts the functionality of the sensor was handled by a structural shape optimization. Compared with the conventional antenna shape, the proposed optimum shape drew the antenna’s performance improvement of 5.77% at 2.5 GHz and 29.03% at 5 GHz within the reliable frequency range. A new optimum design implementing the DR process also escalated the performance improvement of 29.05% at 2.5 GHz and 35.08% at 5 GHz. Thus, it is confirmed that the developed optimal design maximized the frequency stability within a reliable bandwidth and antenna performance under structural deformation. In the final step, the reliability of the stretchable antenna for the strain sensor was assessed by PNN and validated by MCS. PNN evaluated the efficiency of the proposed design by showing the classification accuracy of 96%. The accuracy of PNN was validated by that of MCS. The results obtained for the stretchable strain MSP antenna show that the proposed design framework with the uncertainty characterization and dimension reduction is effective on multi-physics-based and multi-objective design processes.
Author Contributions
Conceptualization, S.-K.C.; methodology, S.H.; software, S.H.; validation, S.-K.C. and R.M.G.; formal analysis, S.H.; investigation, S.H.; resources, S.-K.C.; data curation, S.H.; writing—original draft preparation, S.H.; writing—review and editing, S.-K.C. and R.M.G.; visualization, S.H.; supervision, S.-K.C.; project administration, S.-K.C.; funding acquisition, S.-K.C. and H.-J.C. All authors have read and agreed to the published version of the manuscript.
Funding
This research was partially funded by Chung-Ang University Research Grants in 2016.
Conflicts of Interest
The authors declare no conflict of interest.
References
- Ye, X.; Su, Y.; Han, J. Structural health monitoring of civil infrastructure using optical fiber sensing technology: A comprehensive review. Sci. World J. 2014, 2014. [Google Scholar] [CrossRef] [PubMed]
- Liu, W.; Tang, B.; Han, J.; Lu, X.; Hu, N.; He, Z. The structure healthy condition monitoring and fault diagnosis methods in wind turbines: A review. Renew. Sustain. Energy Rev. 2015, 44, 466–472. [Google Scholar] [CrossRef]
- Memmolo, V.; Elahi, H.; Eugeni, M.; Monaco, E.; Ricci, F.; Pasquali, M.; Gaudenzi, P. Experimental and Numerical Investigation of PZT Response in Composite Structures with Variable Degradation Levels. J. Mater. Eng. Perform. 2019, 28, 3239–3546. [Google Scholar] [CrossRef]
- Zhu, M.; Xie, M.; Xu, W.; Cheng, L.K. A Nanocomposite-Based Stretchable Deformation Sensor Matrix for a Soft-Bodied Swallowing Robot. IEEE Sens. J. 2016, 16, 3848–3855. [Google Scholar] [CrossRef]
- Li, T.; Tan, Y.; Shi, C.; Guo, Y.; Najdovski, Z.; Ren, H.; Zhou, Z. A High-Sensitivity Fiber Bragg Grating Displacement Sensor Based on Transverse Property of a Tensioned Optical Fiber Configuration and Its Dynamic Performance Improvement. IEEE Sens. J. 2017, 17, 5840–5848. [Google Scholar] [CrossRef]
- Zhang, J.; Tian, G.Y.; Marindra, A.M.; Sunny, A.I.; Zhao, A.B. A review of passive RFID tag antenna-based sensors and systems for structural health monitoring applications. Sensors 2017, 17, 265. [Google Scholar] [CrossRef]
- Hwang, S.; Choi, S.-K. Optimal Design of Stretchable Electronics With the Consideration of Response Variability. In Proceedings of the ASME 2017 International Design Engineering Technical Conferences and Computers and Information in Engineering Conference, Cleveland, OH, USA, 6–9 August 2017; p. V009T07A054. [Google Scholar]
- Hwang, S.; Gorguluarslan, R.M.; Choi, S.-K.; Min, J.; Moon, J. Reliability Estimation of Stretchable Electronics Using a Dimension Reduction Framework. In Proceedings of the ASME 2016 International Design Engineering Technical Conferences and Computers and Information in Engineering Conference, Charlotte, NC, USA, 21–24 August 2016; p. V01AT02A025. [Google Scholar]
- Lee, K.F.; Luk, K.M.; Lai, H.W. Microstrip Patch Antennas; World Scientific: River Edge, NJ, USA, 2017. [Google Scholar]
- Chahat, N.; Zhadobov, M.; Sauleau, R. Antennas for body centric wireless communications at millimeter wave frequencies. In Progress Compact Antennas; IntechOpen: London, UK, 2014. [Google Scholar]
- Jang, K.-I.; Han, S.Y.; Xu, S.; Mathewson, K.E.; Zhang, Y.; Jeong, J.-W.; Kim, G.-T.; Webb, R.C.; Lee, J.W.; Dawidczyk, T.J.; et al. Rugged and breathable forms of stretchable electronics with adherent composite substrates for transcutaneous monitoring. Nat. Commun. 2014, 5, 4779. [Google Scholar] [CrossRef]
- Bosiljevac, M.; Casaletti, M.; Caminita, F.; Sipus, Z.; Maci, S. Non-uniform metasurface Luneburg lens antenna design. IEEE Trans. Antennas Propag. 2012, 60, 4065–4073. [Google Scholar] [CrossRef]
- Chen, C.C.; Volakis, J.L. Bandwidth broadening of patch antennas using nonuniform substrates. Microw. Opt. Technol. Lett. 2005, 47, 421–423. [Google Scholar] [CrossRef]
- Nakamoto, H.; Ootaka, H.; Tada, M.; Hirata, I.; Kobayashi, F.; Kojima, F. Stretchable strain sensor based on areal change of carbon nanotube electrode. IEEE Sens. J. 2015, 15, 2212–2218. [Google Scholar] [CrossRef]
- Suikkola, J.; Björninen, T.; Mosallaei, M.; Kankkunen, T.; Iso-Ketola, P.; Ukkonen, L.; Vanhala, J.; Mäntysalo, M. Screen-printing fabrication and characterization of stretchable electronics. Sci. Rep. 2016, 6, 25784. [Google Scholar] [CrossRef] [PubMed]
- Song, L.; Myers, A.C.; Adams, J.J.; Zhu, Y. Stretchable and reversibly deformable radio frequency antennas based on silver nanowires. ACS Appl. Mater. Interfaces 2014, 6, 4248–4253. [Google Scholar] [CrossRef] [PubMed]
- Huang, Y.; Wang, Y.; Xiao, L.; Liu, H.; Dong, W.; Yin, Z. Microfluidic serpentine antennas with designed mechanical tunability. Lab Chip 2014, 14, 4205–4212. [Google Scholar] [CrossRef] [PubMed]
- Kanaparthi, S.; Sekhar, V.R.; Badhulika, S. Flexible, eco-friendly and highly sensitive paper antenna based electromechanical sensor for wireless human motion detection and structural health monitoring. Extrem. Mech. Lett. 2016, 9, 324–330. [Google Scholar] [CrossRef]
- Ramli, M.R.; Ibrahim, S.; Ahmad, Z.; Abidin, I.S.Z.; Ain, M.F. Stretchable Conductive Ink Based on Polysiloxane–Silver Composite and Its Application as a Frequency Reconfigurable Patch Antenna for Wearable Electronics. ACS Appl. Mater. Interfaces 2019, 11, 28033–28042. [Google Scholar] [CrossRef]
- Xie, Z.; Avila, R.; Huang, Y.; Rogers, J.A. Flexible and Stretchable Antennas for Biointegrated Electronics. Adv. Mater. 2019, 32, 1902767. [Google Scholar] [CrossRef]
- Vijayakumar, S.; D’souza, A.; Schaal, S. Incremental online learning in high dimensions. Neural Comput. 2005, 17, 2602–2634. [Google Scholar] [CrossRef]
- Chandrashekar, G.; Sahin, F. A survey on feature selection methods. Comput. Electr. Eng. 2014, 40, 16–28. [Google Scholar] [CrossRef]
- Kang, M.; Islam, M.R.; Kim, J.; Kim, J.-M.; Pecht, M. A hybrid feature selection scheme for reducing diagnostic performance deterioration caused by outliers in data-driven diagnostics. IEEE Trans. Ind. Electr. 2016, 63, 3299–3310. [Google Scholar] [CrossRef]
- Lei, Y.; Jia, F.; Lin, J.; Xing, S.; Ding, S.X. An intelligent fault diagnosis method using unsupervised feature learning towards mechanical big data. IEEE Trans. Ind. Electr. 2016, 63, 3137–3147. [Google Scholar] [CrossRef]
- Durante, F.; Sempi, C. Principles of Copula Theory; Chapman and Hall/CRC: London, UK, 2015. [Google Scholar]
- Shlens, J. A tutorial on principal component analysis. arXiv 2014, arXiv:1404.1100. [Google Scholar]
- Witten, I.H.; Frank, E.; Hall, M.A.; Pal, C.J. Data Mining: Practical Machine Learning Tools and Techniques; Morgan Kaufmann: Burlington, MA, USA, 2016. [Google Scholar]
- Roiger, R.J. Data Mining: A Tutorial-Based Primer; Chapman and Hall/CRC: London, UK, 2017. [Google Scholar]
- Taylor, J.D. Ultra-Wideband Radar Technology; CRC Press: Boca Raton, FL, USA, 2018. [Google Scholar]
- Singh, V.; Ali, Z.; Ayub, S.; Singh, A. Bandwidth optimization of compact microstrip antenna for PCS/DCS/bluetooth application. Open Eng. 2014, 4, 281–286. [Google Scholar] [CrossRef]
- Sato, Y.; Campelo, F.; Igarashi, H. Fast shape optimization of antennas using model order reduction. IEEE Trans. Magn. 2015, 51, 1–4. [Google Scholar] [CrossRef]
- Wang, J.; Yang, X.-S.; Ding, X.; Wang, B.-Z. Topology Optimization of Conical-Beam Antennas Exploiting Rotational Symmetry. IEEE Trans. Antennas Propag. 2018, 66, 2254–2261. [Google Scholar] [CrossRef]
- Bhatt, S.; Mankodi, P.; Desai, A.; Patel, R. Analysis of ultra wideband fractal antenna designs and their applications for wireless communication: A survey. In Proceedings of the 2017 International Conference on Inventive Systems and Control (ICISC), Coimbatore, India, 19–20 January 2017; pp. 1–6. [Google Scholar]
- Xu, R.; Jang, K.I.; Ma, Y.; Jung, H.N.; Yang, Y.; Cho, M.; Zhang, Y.; Huang, Y.; Rogera, J.A. Fabric-based stretchable electronics with mechanically optimized designs and prestrained composite substrates. Extreme Mech. Lett. 2014, 1, 120–126. [Google Scholar] [CrossRef]
- Shapira, J. Active Antenna Array Configuration and Control for Cellular Communication Systems. U.S. Patent 20030073463A1, 31 May 2005. [Google Scholar]
- Chen, S.-C.; Wang, Y.-S.; Chung, S.-J. A decoupling technique for increasing the port isolation between two strongly coupled antennas. IEEE Trans. Antennas Propag. 2008, 56, 3650–3658. [Google Scholar] [CrossRef]
- Har-Peled, S.; Indyk, P.; Motwani, R. Approximate nearest neighbor: Towards removing the curse of dimensionality. Theory Comput. 2012, 8, 321–350. [Google Scholar] [CrossRef]
- Sricharan, K.; Wei, D.; Hero, A.O. Ensemble estimators for multivariate entropy estimation. IEEE Trans. Inf. Theory 2013, 59, 4374–4388. [Google Scholar] [CrossRef]
- Ince, R.A.; Giordano, B.L.; Kayser, C.; Rousselet, G.A.; Gross, J.; Schyns, P.G. A statistical framework for neuroimaging data analysis based on mutual information estimated via a gaussian copula. Hum. Brain Mapp. 2017, 38, 1541–1573. [Google Scholar] [CrossRef]
- Guyon, I.; Gunn, S.; Nikravesh, M.; Zadeh, L.A. Feature Extraction: Foundations and Applications; Springer: Berlin, Germany, 2008. [Google Scholar]
- Tang, J.; Alelyani, S.; Liu, H. Feature selection for classification: A review. In Data Classification: Algorithms and Applications; Springer: Berlin, Germany, 2014; p. 37. [Google Scholar]
- Hinton, G.E.; Salakhutdinov, R.R. Reducing the dimensionality of data with neural networks. Science 2006, 313, 504–507. [Google Scholar] [CrossRef]
- Melingui, A.; Lakhal, O.; Daachi, B.; Mbede, J.B.; Merzouki, R. Adaptive neural network control of a compact bionic handling arm. Mechatron. IEEE ASME Trans. 2015, 20, 2862–2875. [Google Scholar] [CrossRef]
- Höhndorfa, L.; Sembiringa, J.; Holzapfela, F. Copulas applied to Flight Data Analysis. In Proceedings of the Probabilistic Safety Assessment and Management PSAM, Honolulu, HI, USA, 22–27 June 2014; Volume 12. [Google Scholar]
- Eid, H.F.; Hassanien, A.E.; Kim, T.; Banerjee, S. Linear correlation-based feature selection for network intrusion detection model. In International Conference on Security of Information and Communication Networks; Springer: Sydney, Australia, 2013; pp. 240–248. [Google Scholar]
- Numata, J.; Ebenhöh, O. Measuring correlations in metabolomic networks with mutual information. Genome Inf. 2008, 20, 112–122. [Google Scholar]
- Nga, N.T.T.; Khanh, N.K.; Hong, S.N. Entropy based correlation clustering for wireless sensor network in multi-correlated regional environment. In Proceedings of the 2016 International Conference on Electronics, Information, and Communications (ICEIC), Da Nang, Vietnam, 27–30 January 2016; pp. 1–4. [Google Scholar]
- Min, J.H.; Lee, Y.-C. Bankruptcy prediction using support vector machine with optimal choice of kernel function parameters. Expert Syst. Appl. 2005, 28, 603–614. [Google Scholar] [CrossRef]
- Nock, R.; Nielsen, F. Bregman divergences and surrogates for learning. IEEE Trans. Pattern Anal. Mach. Intell. 2008, 31, 2048–2059. [Google Scholar] [CrossRef] [PubMed]
- Han, J.; Pei, J.; Kamber, M. Data Mining: Concepts and Techniques; Elsevier: Burlington, MA, USA, 2011. [Google Scholar]
- Mason, C.; Twomey, J.; Wright, D.; Whitman, L. Predicting engineering student attrition risk using a probabilistic neural network and comparing results with a backpropagation neural network and logistic regression. Res. High. Educ. 2018, 59, 382–400. [Google Scholar] [CrossRef]
- Arnaiz-González, Á.; Fernández-Valdivielso, A.; Bustillo, A.; de Lacalle, L.N.L. Using artificial neural networks for the prediction of dimensional error on inclined surfaces manufactured by ball-end milling. Int.J. Adv. Manuf. Technol. 2016, 83, 847–859. [Google Scholar] [CrossRef]
- Choi, S.-K.; Grandhi, R.; Canfield, R.A. Reliability-Based Structural Design; Springer Science & Business Media: Berlin, Germany, 2006. [Google Scholar]
- Coro, A.; Abasolo, M.; Aguirrebeitia, J.; de Lacalle, L.L. Inspection scheduling based on reliability updating of gas turbine welded structures. Adv. Mech. Eng. 2019, 11, 1687814018819285. [Google Scholar] [CrossRef]


© 2020 by the authors. Licensee MDPI, Basel, Switzerland. This article is an open access article distributed under the terms and conditions of the Creative Commons Attribution (CC BY) license (http://creativecommons.org/licenses/by/4.0/).