On the Control of Low-Frequency Audible Noise from Electrical Substations: A Case Study


Abstract
Featured Application
Abstract
1. Introduction
2. Methods
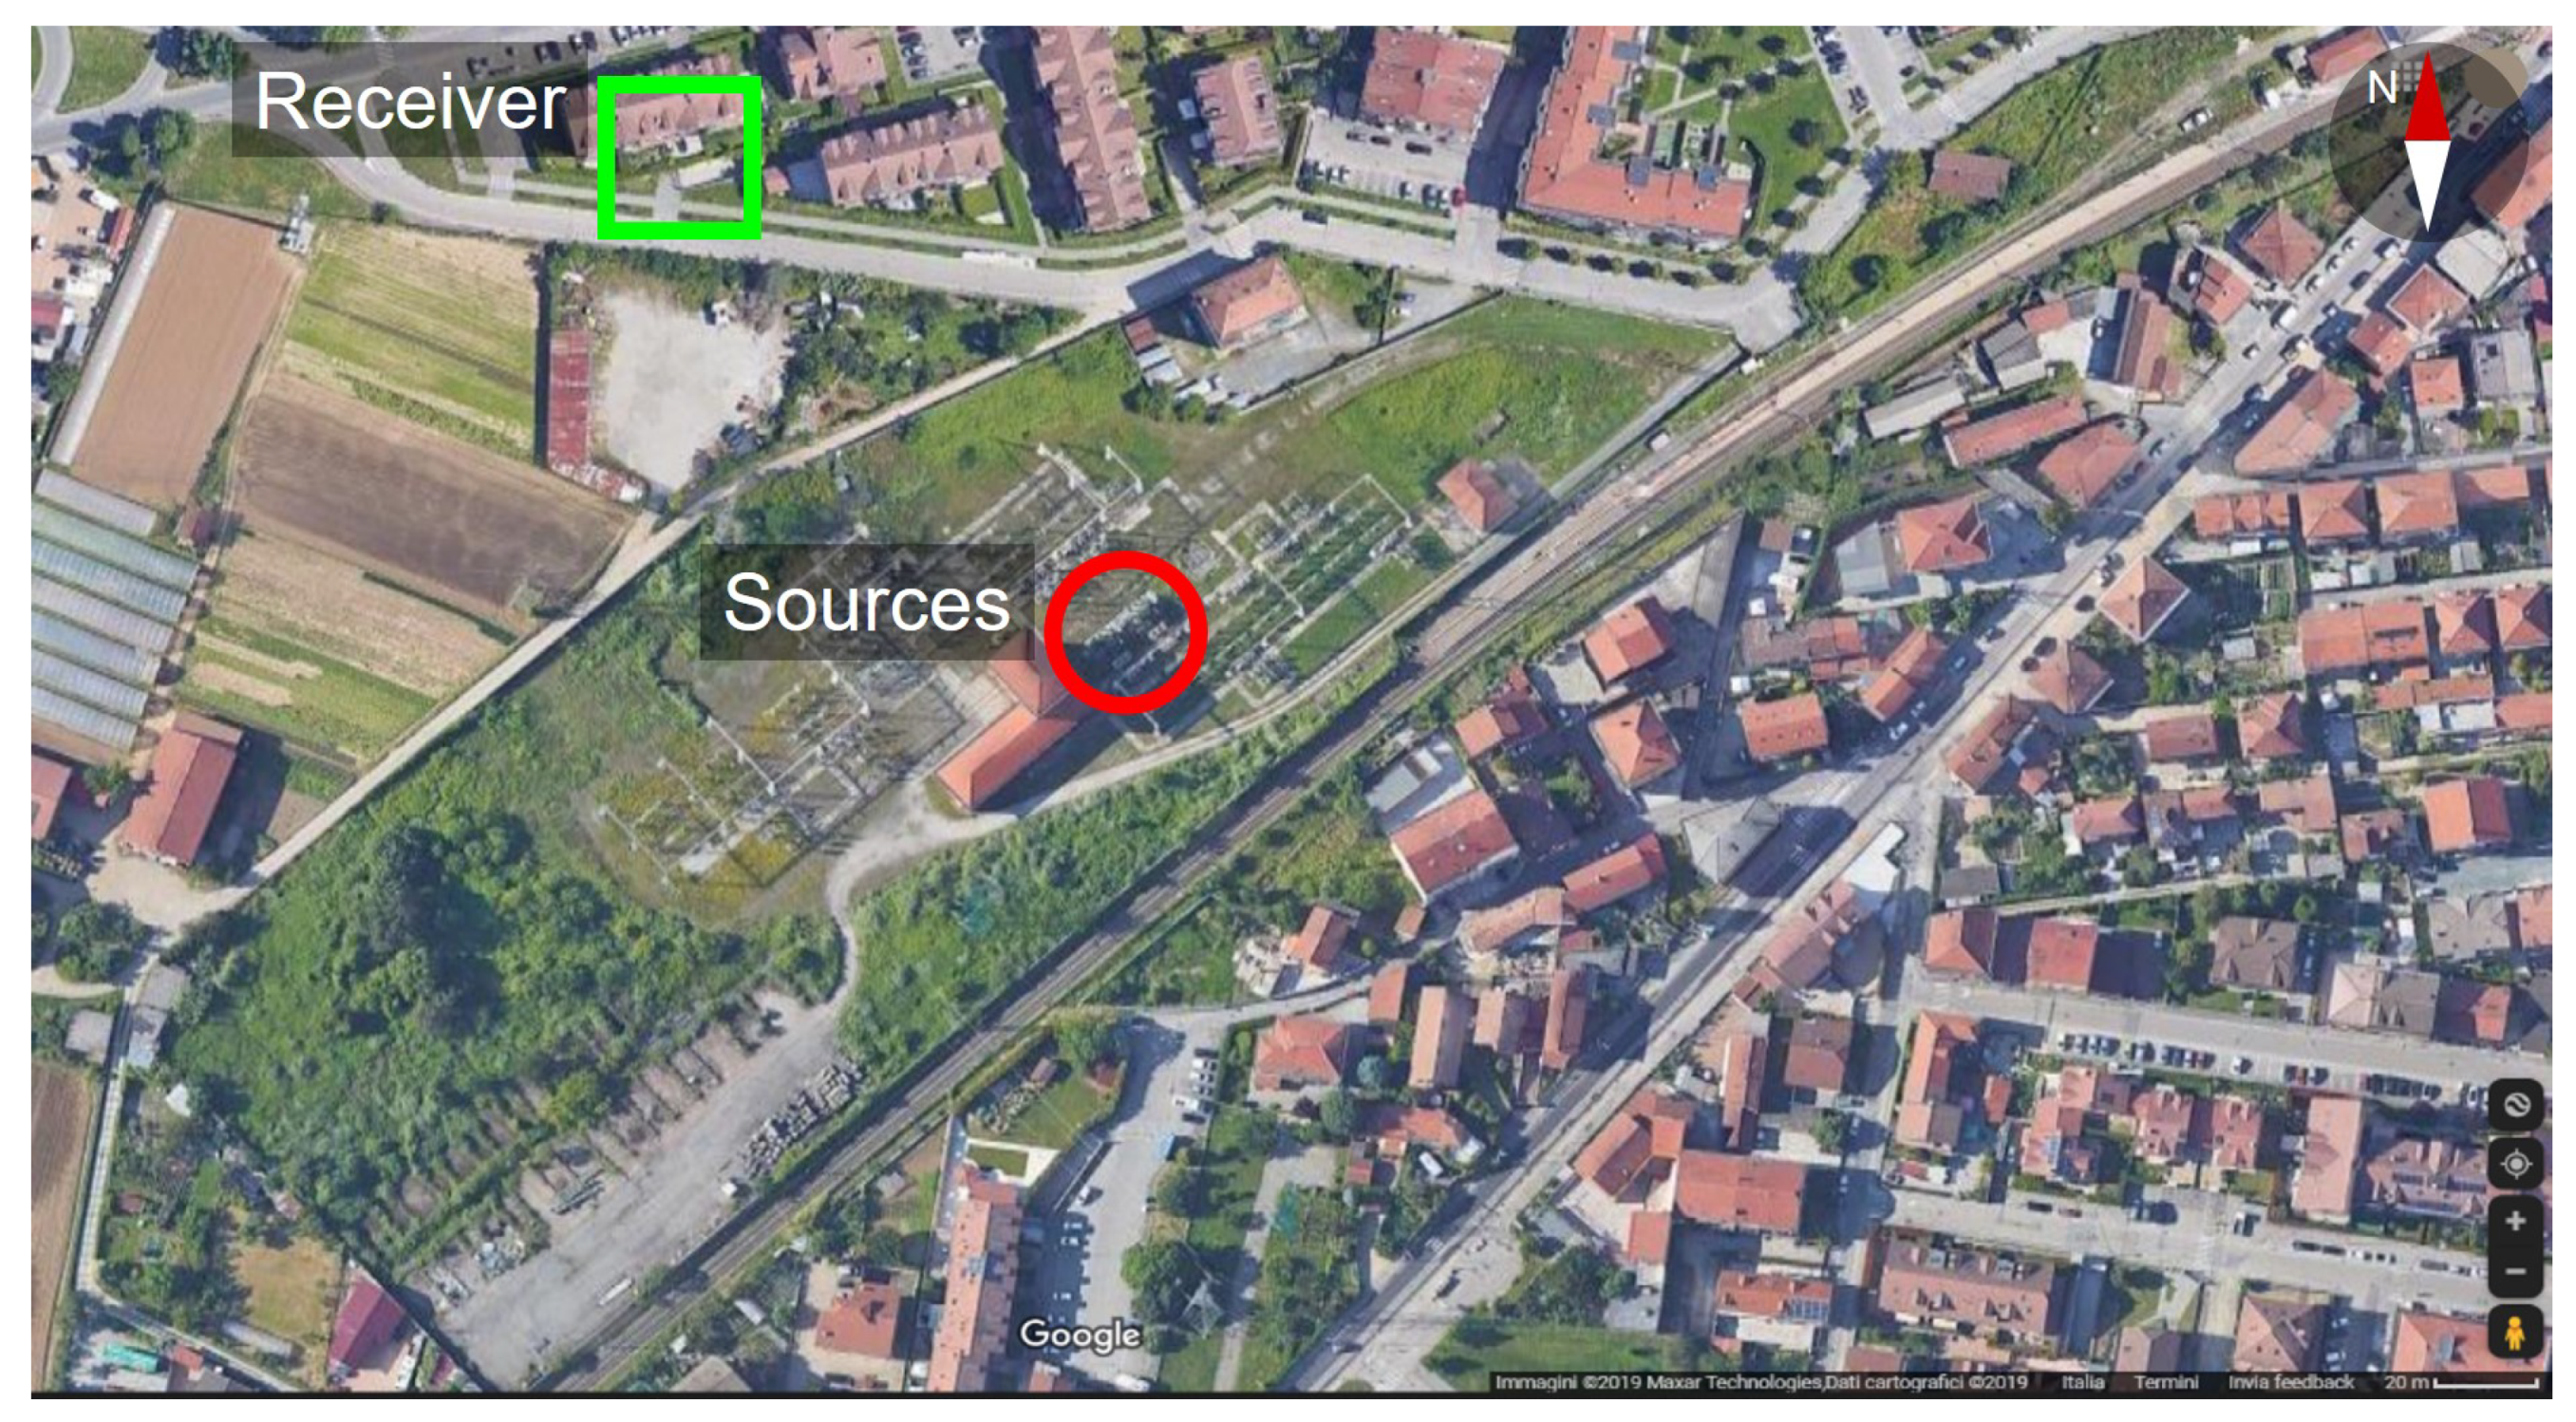
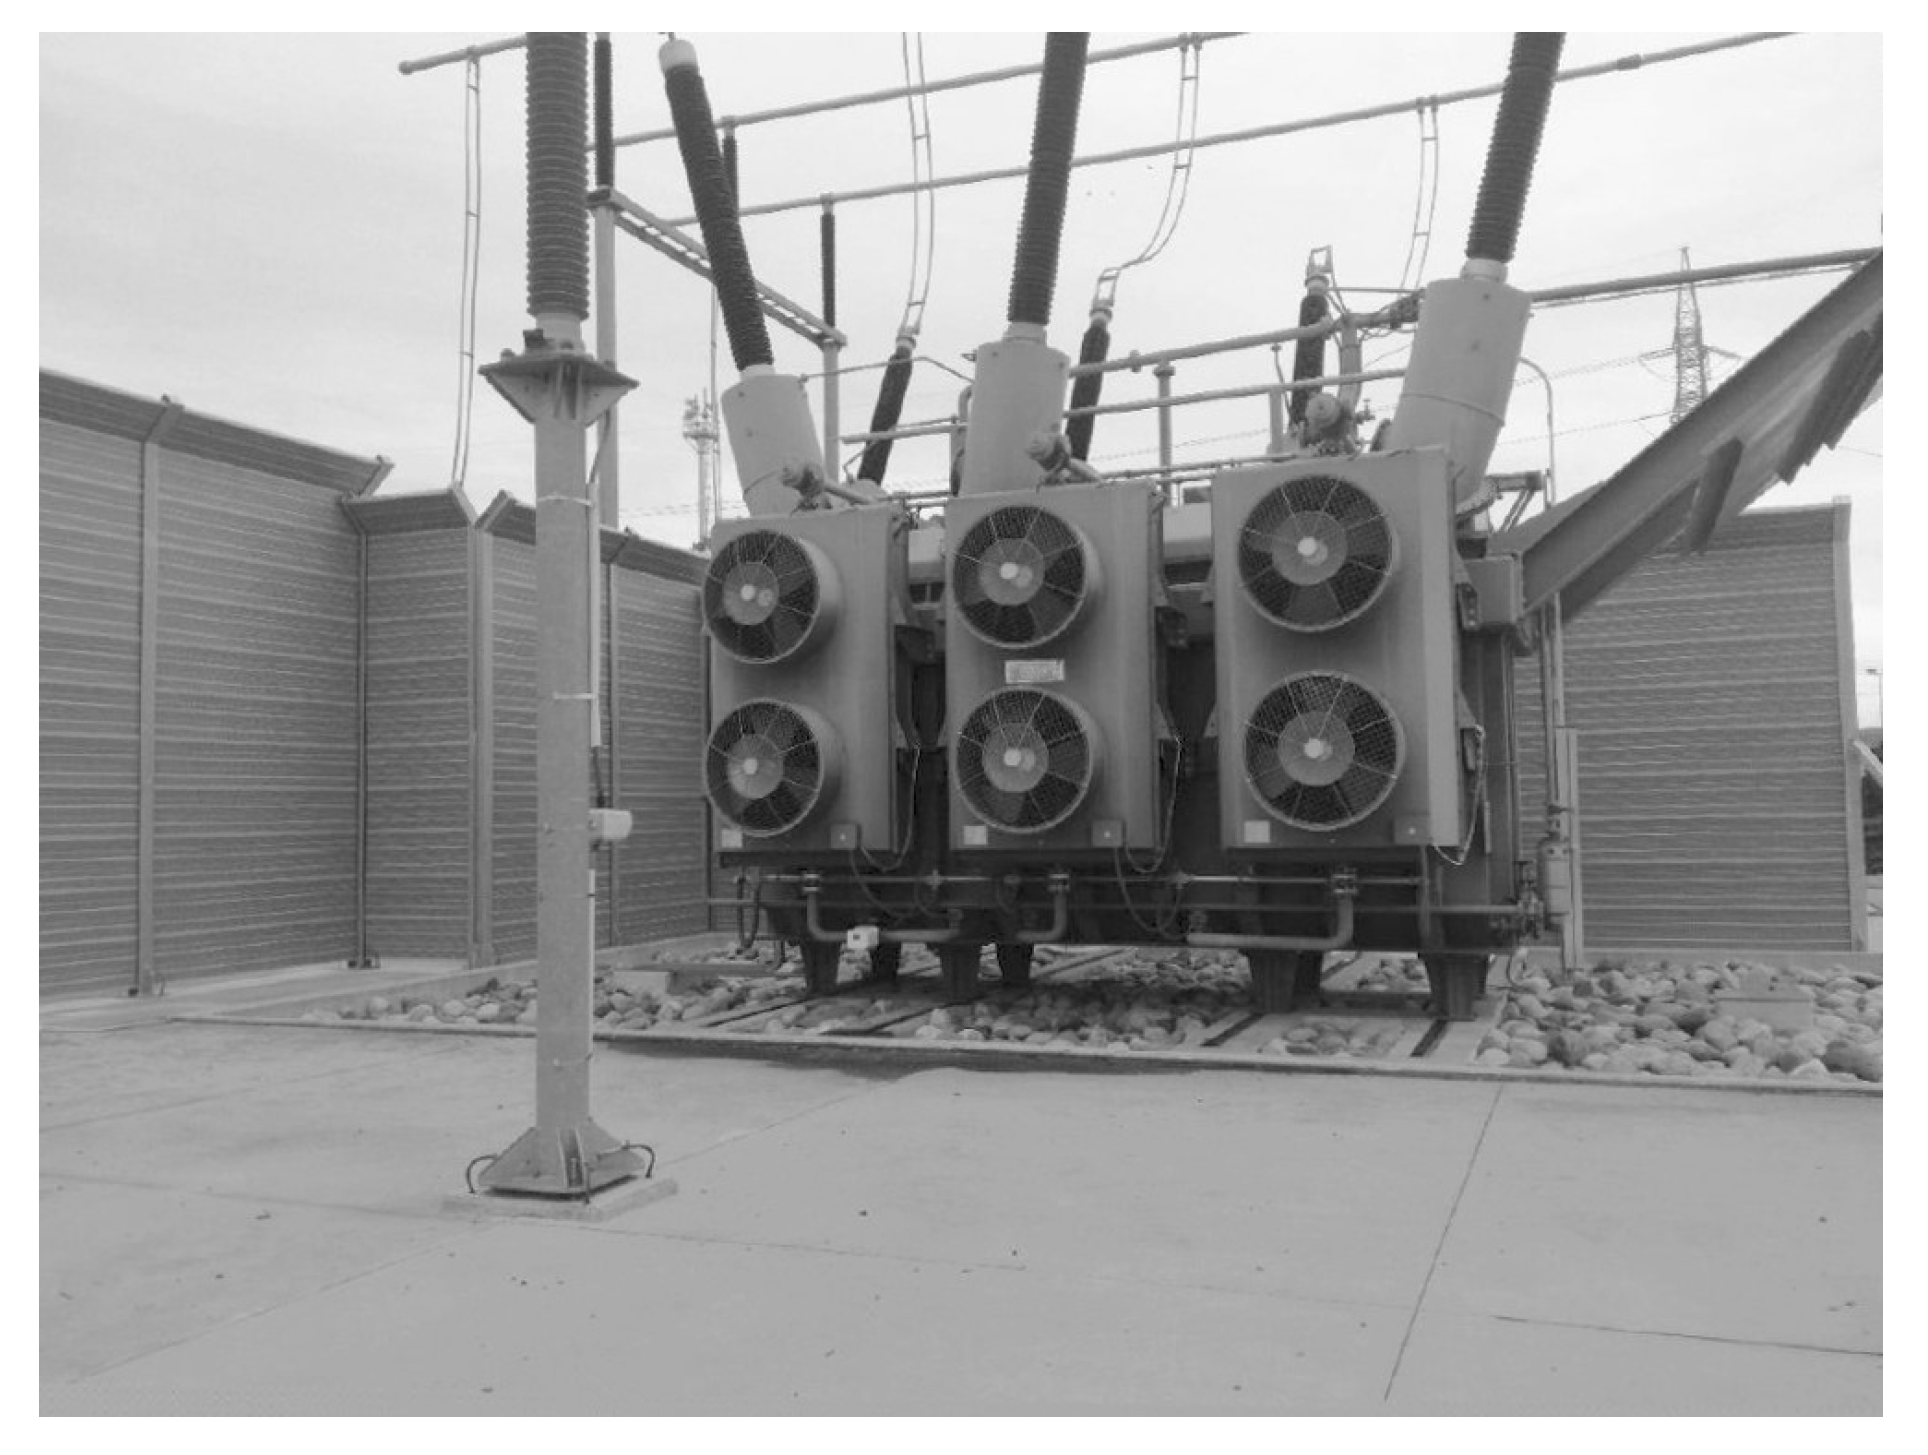
2.1. Description of the Case and Noise Control Strategy
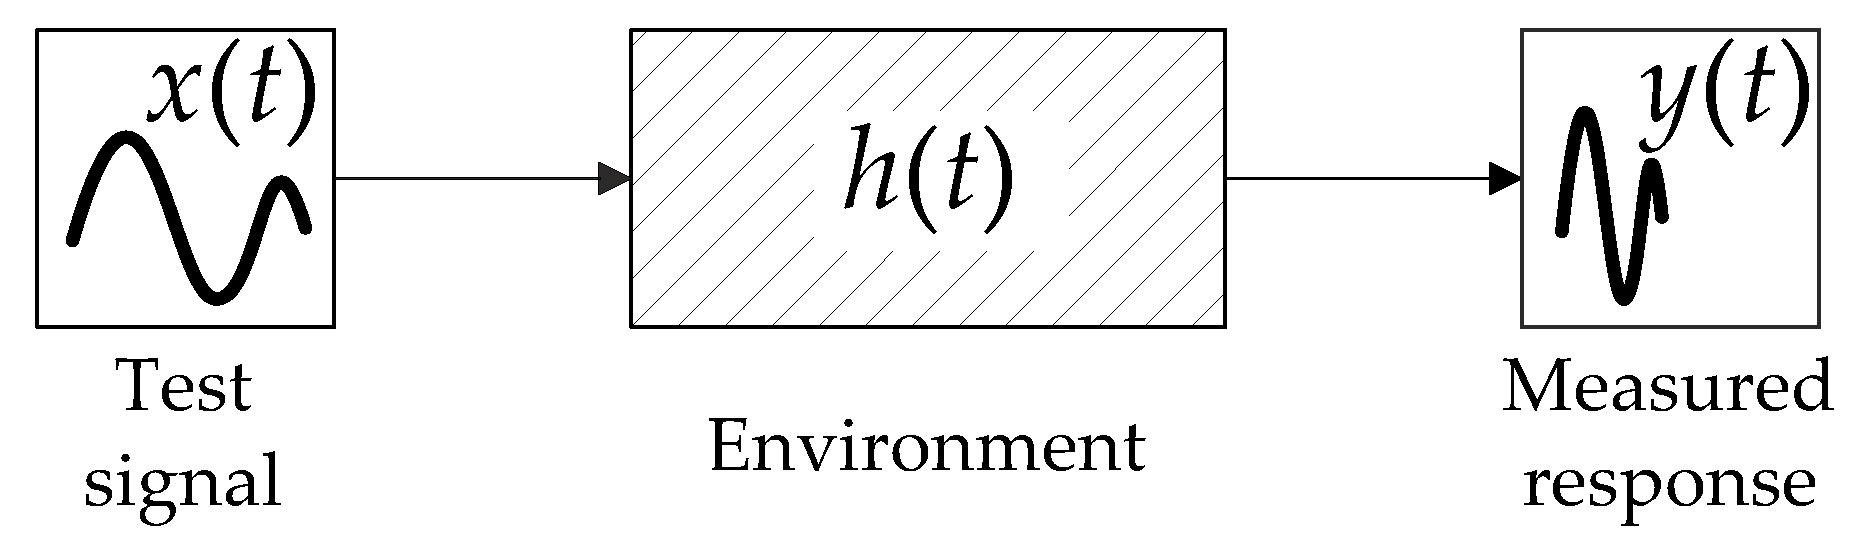
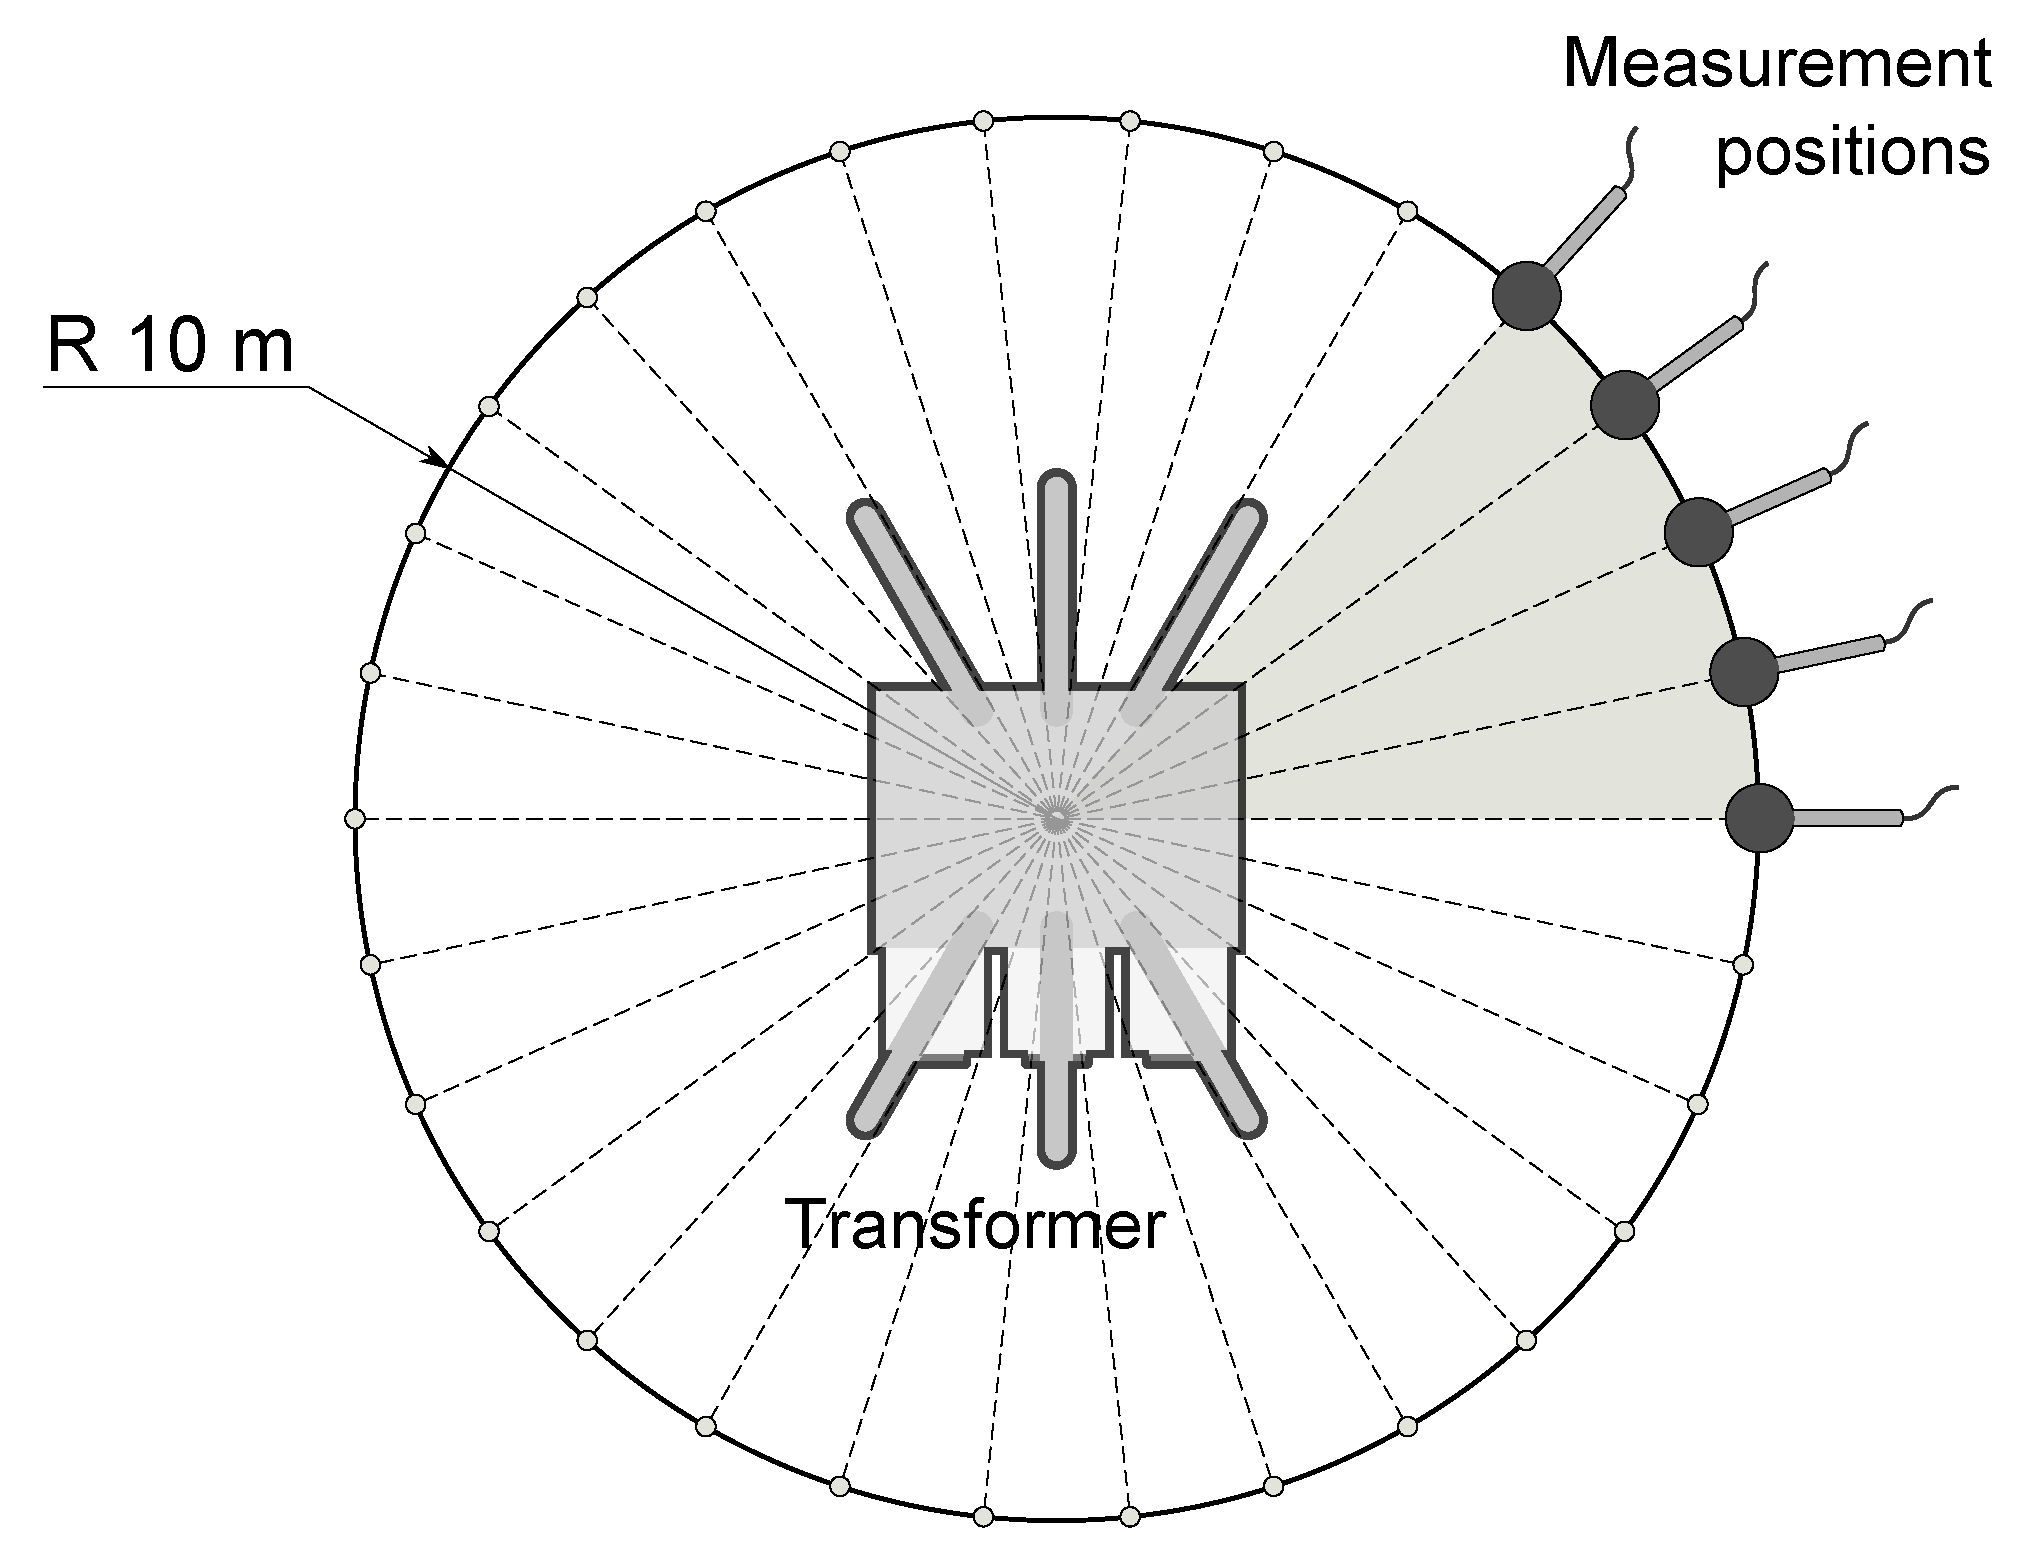
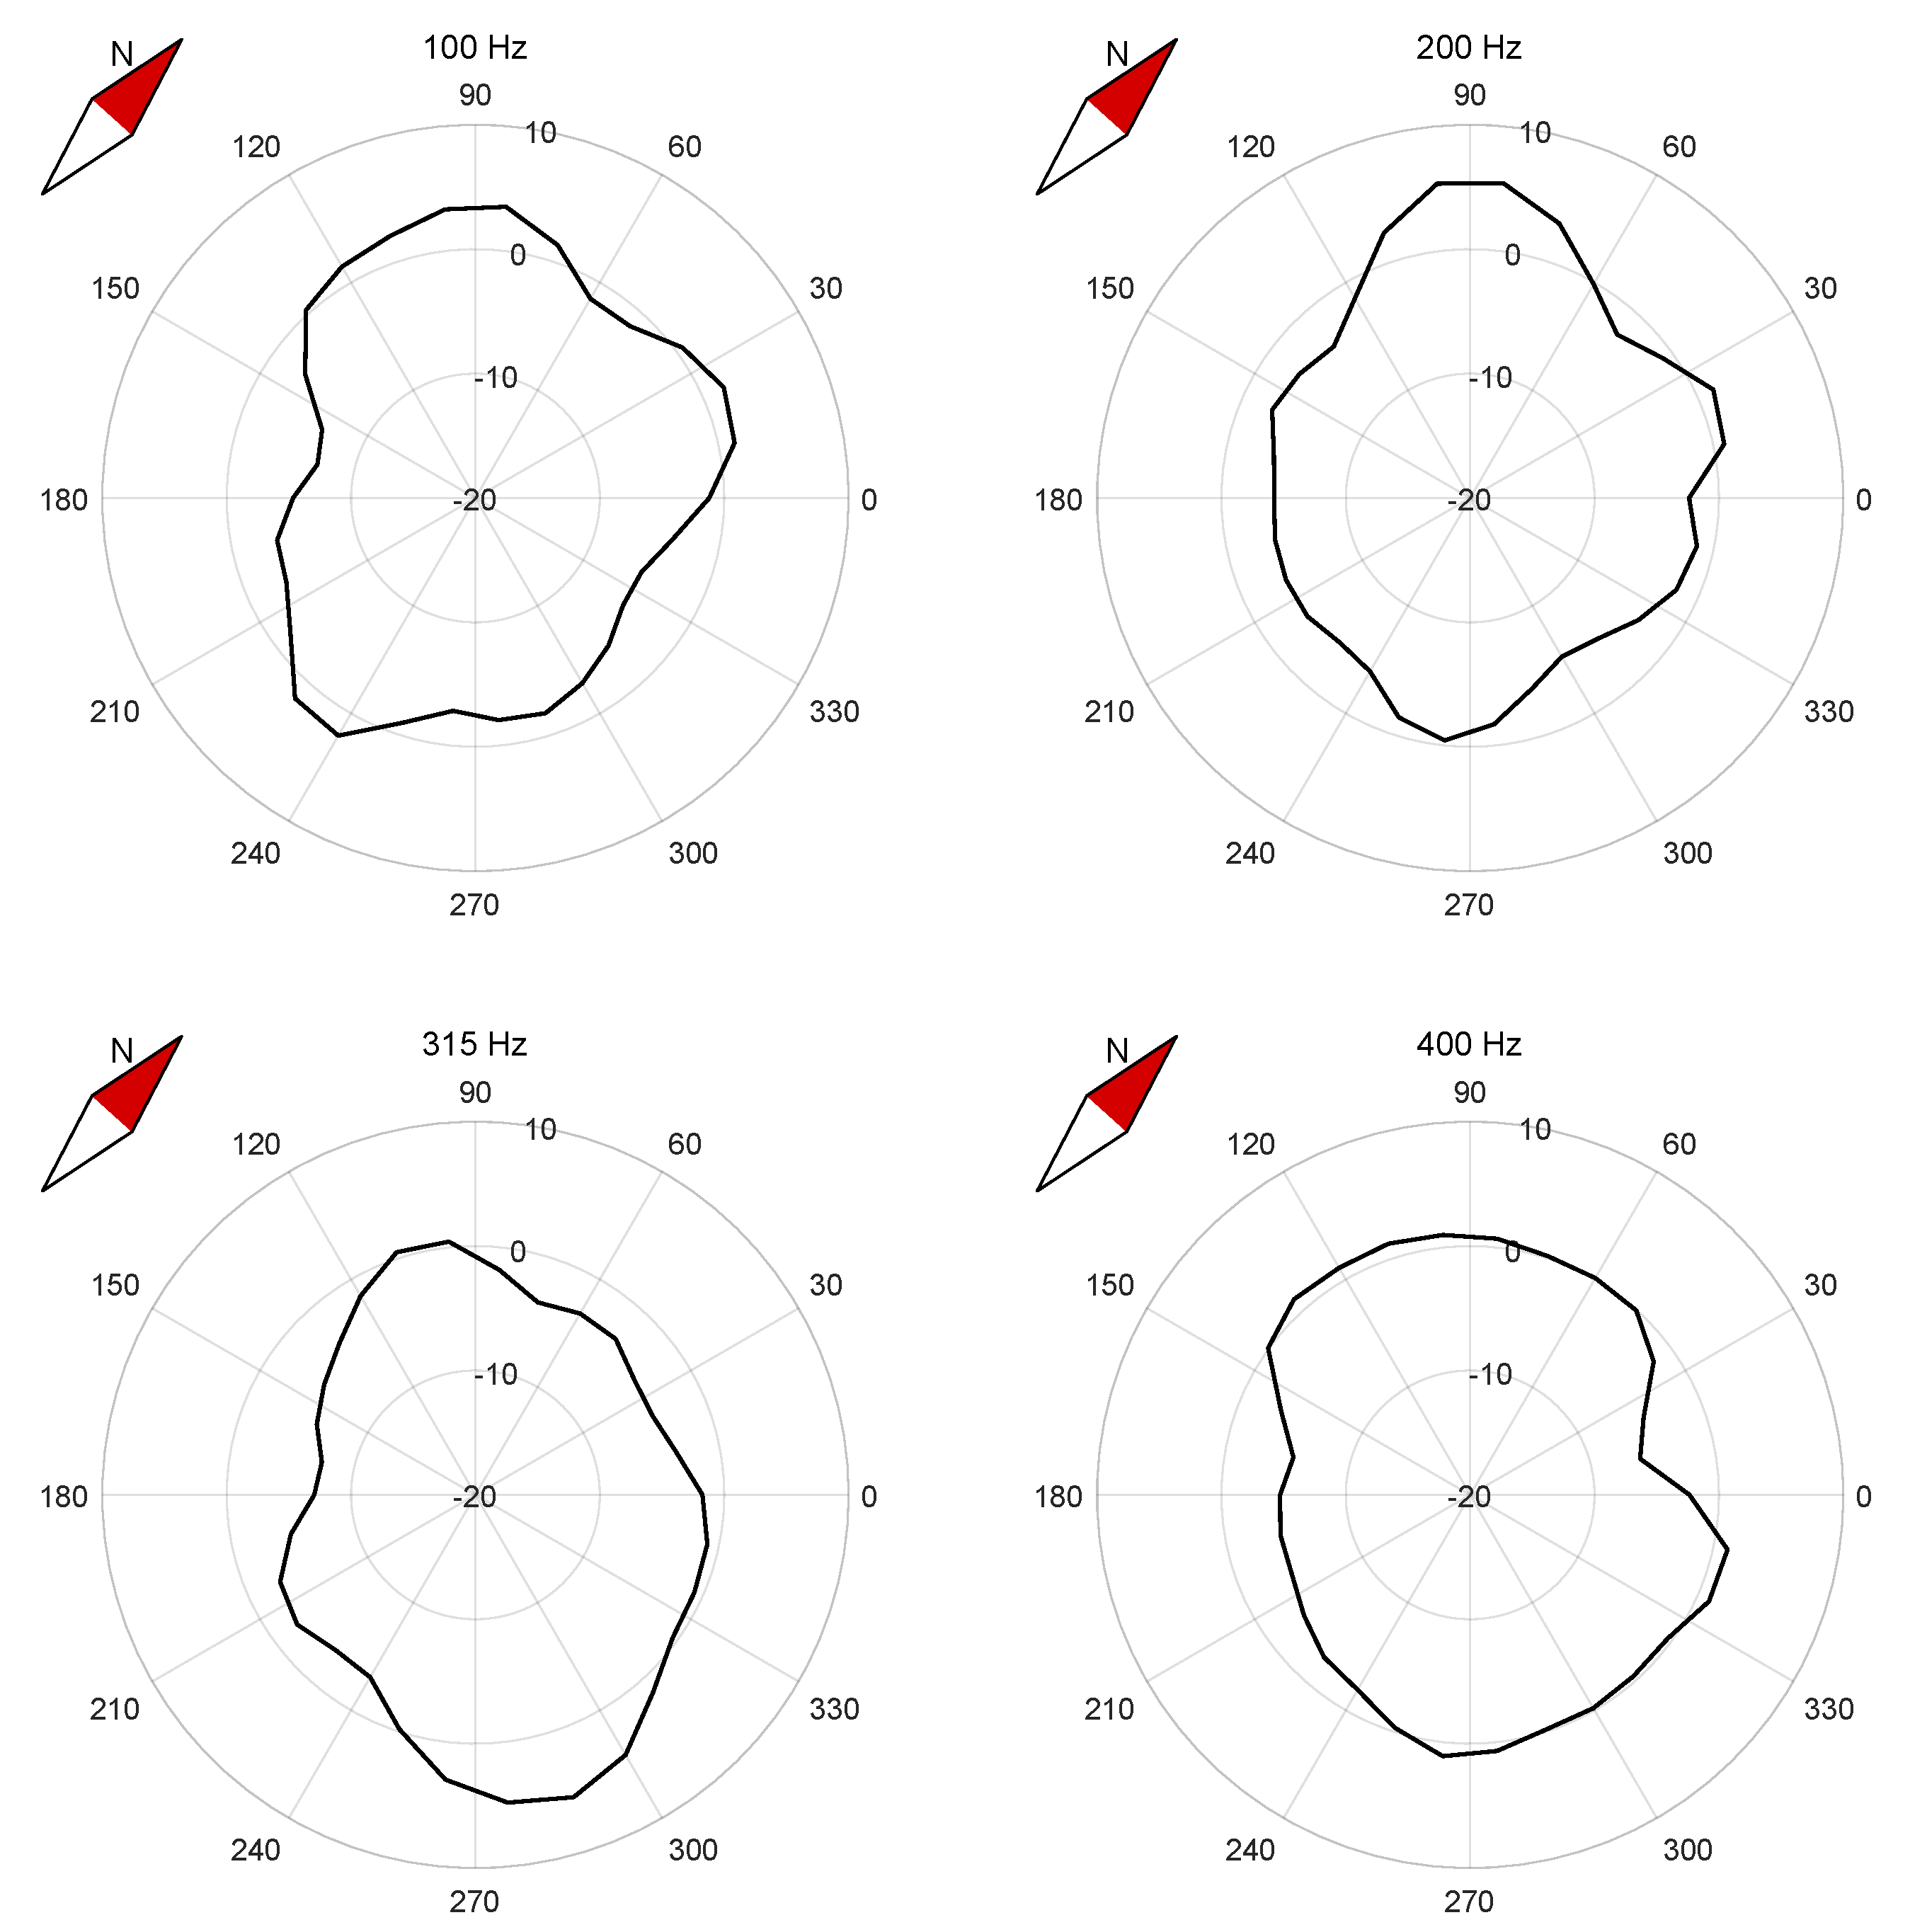
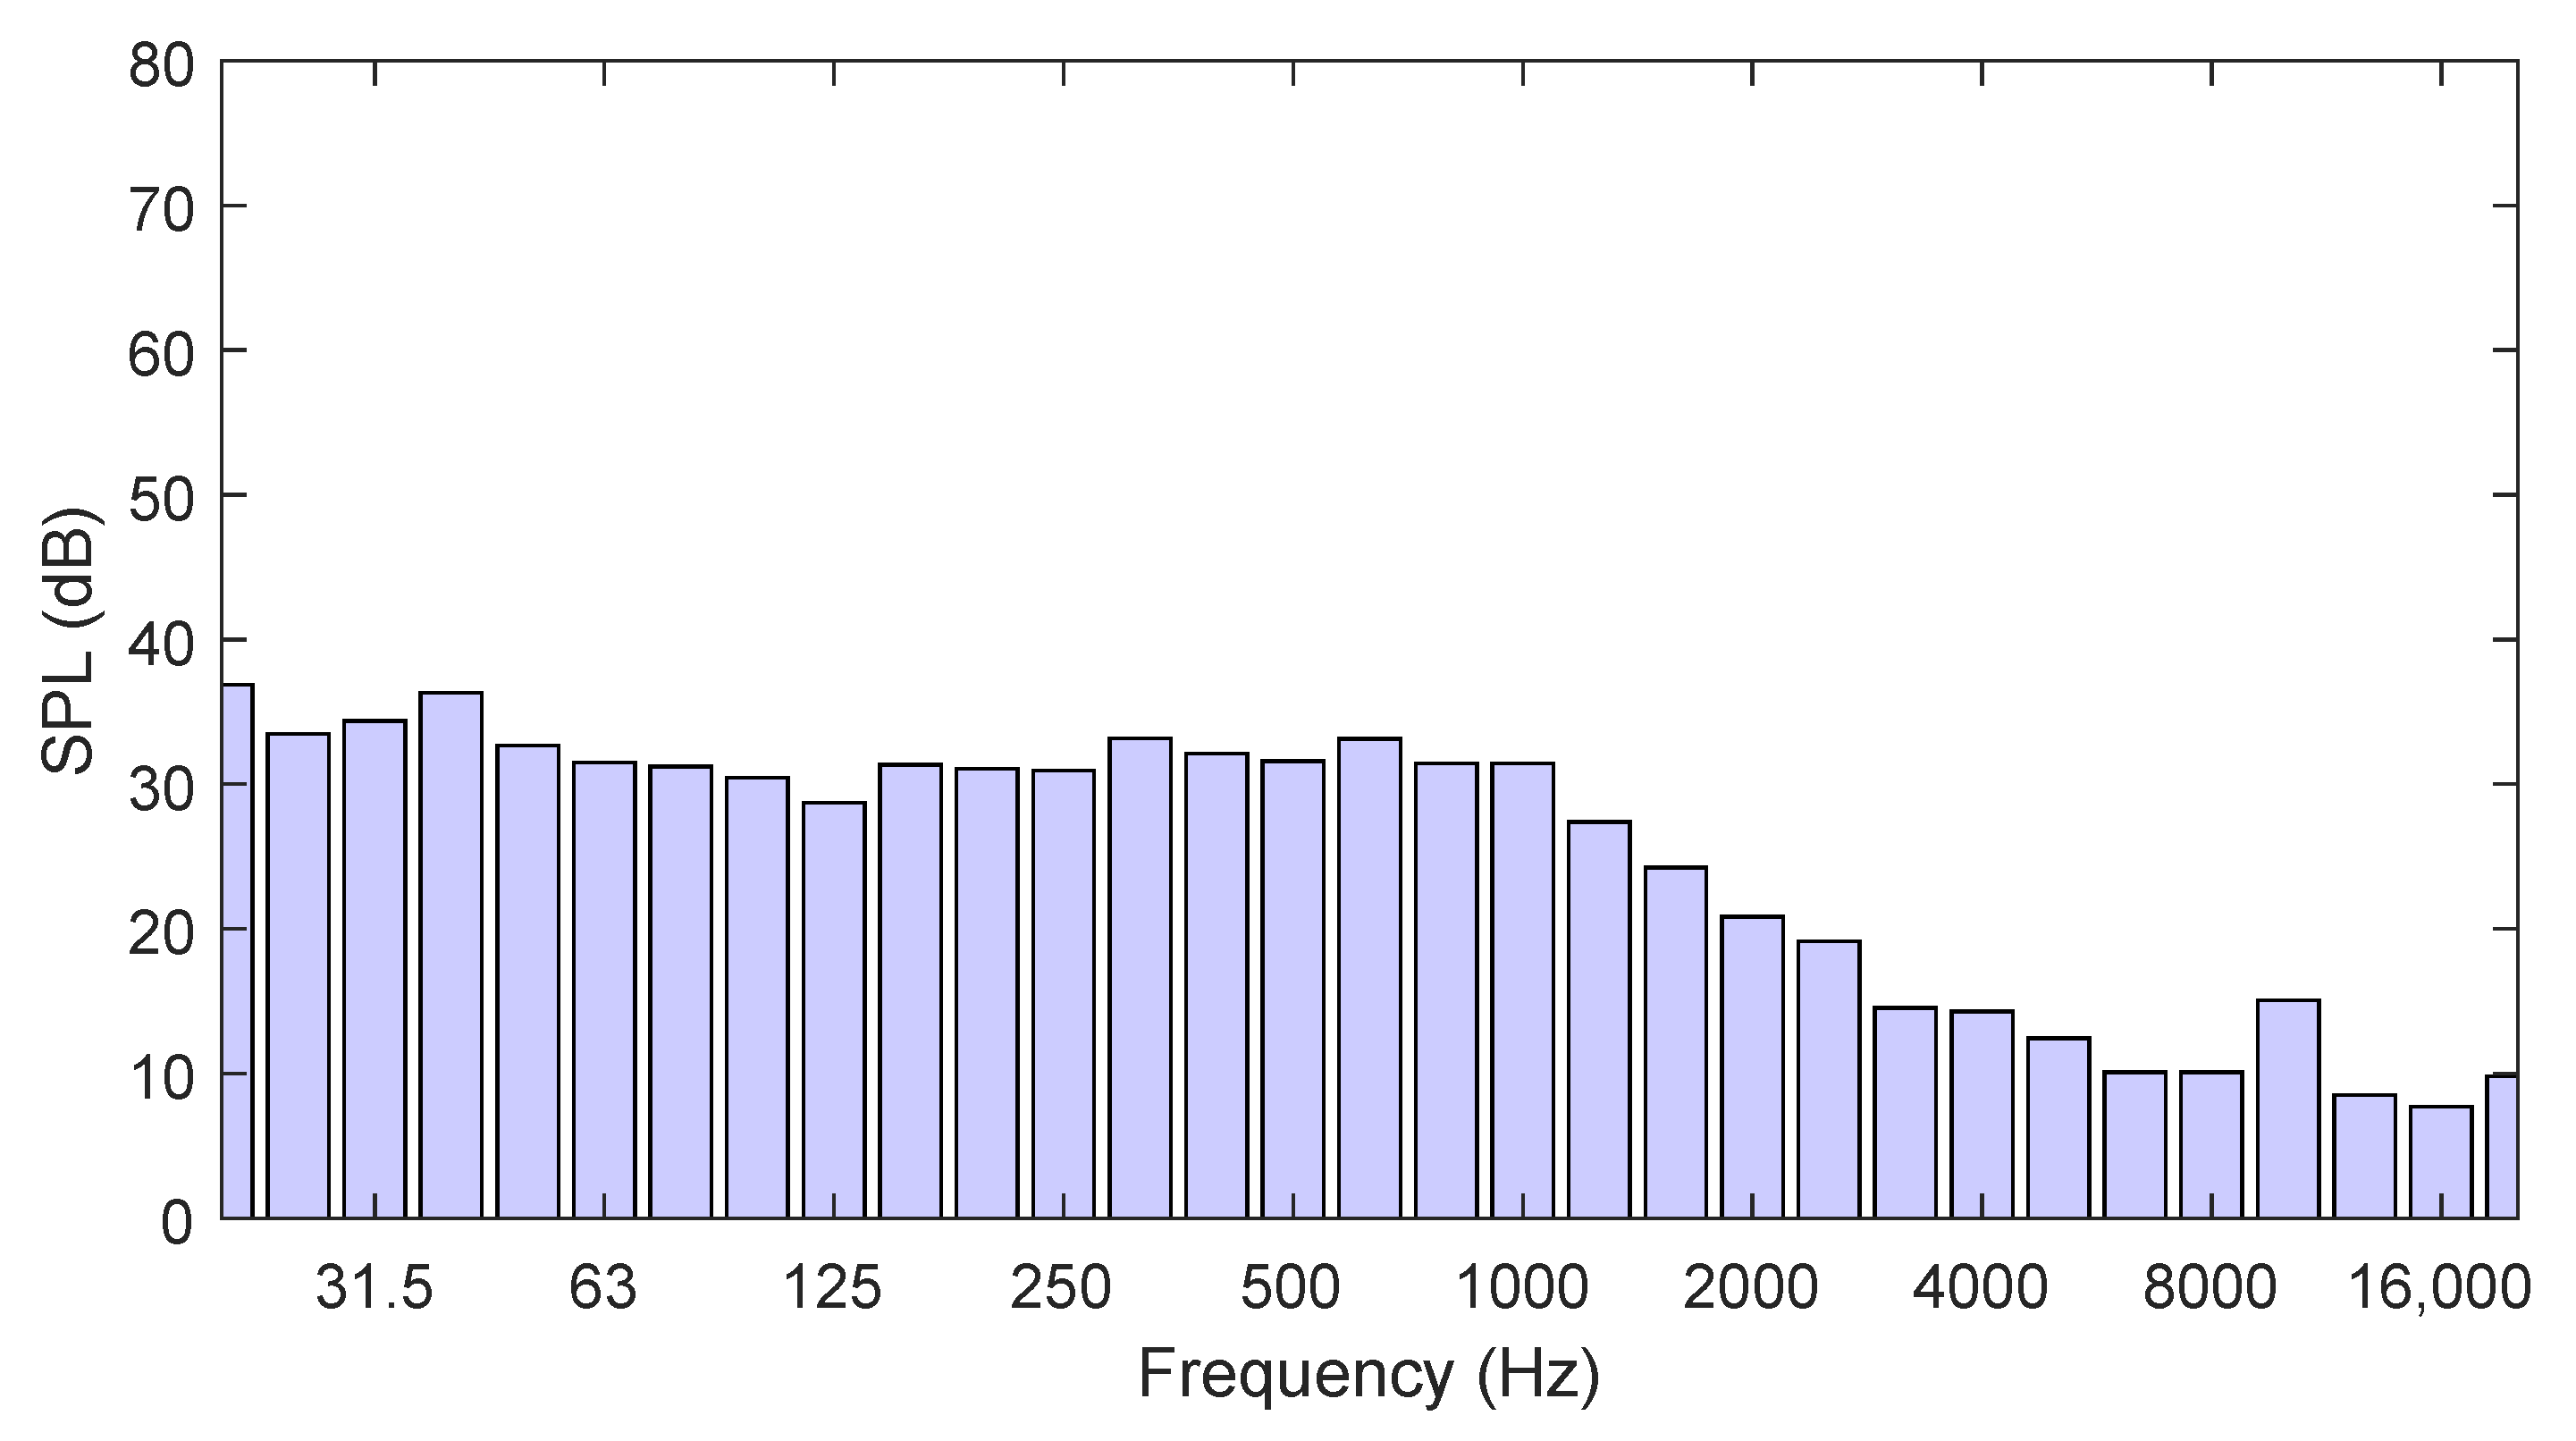
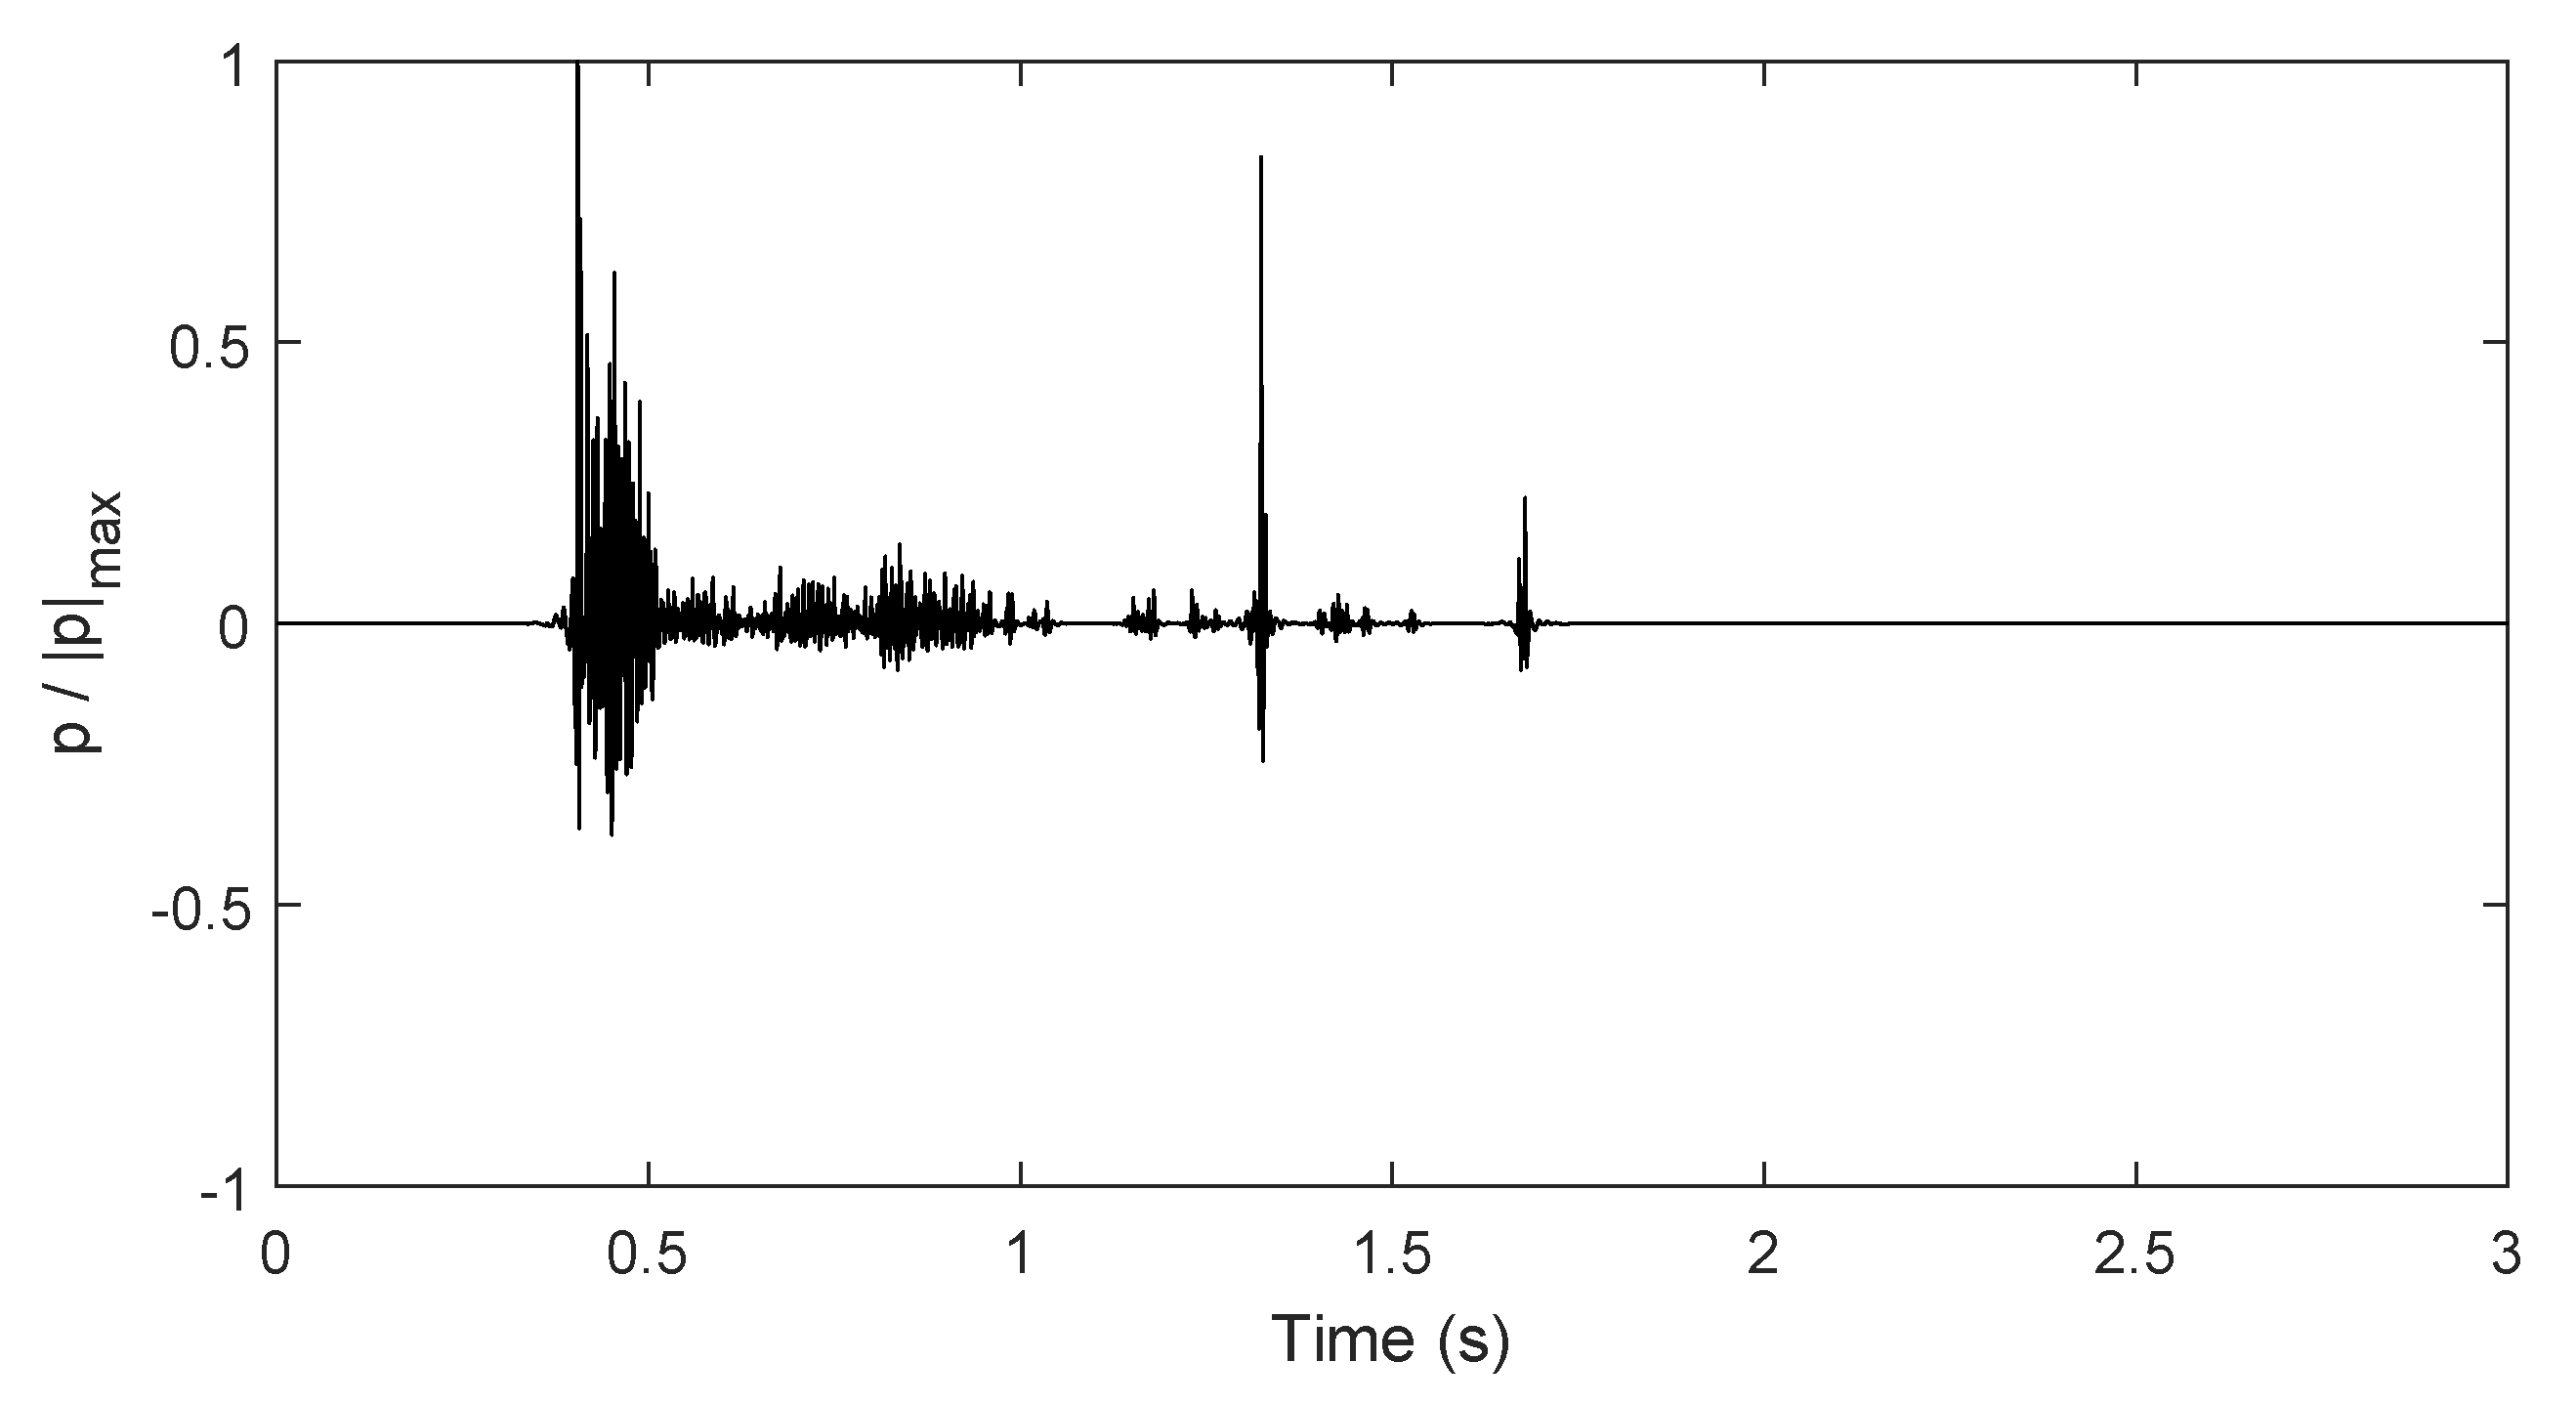
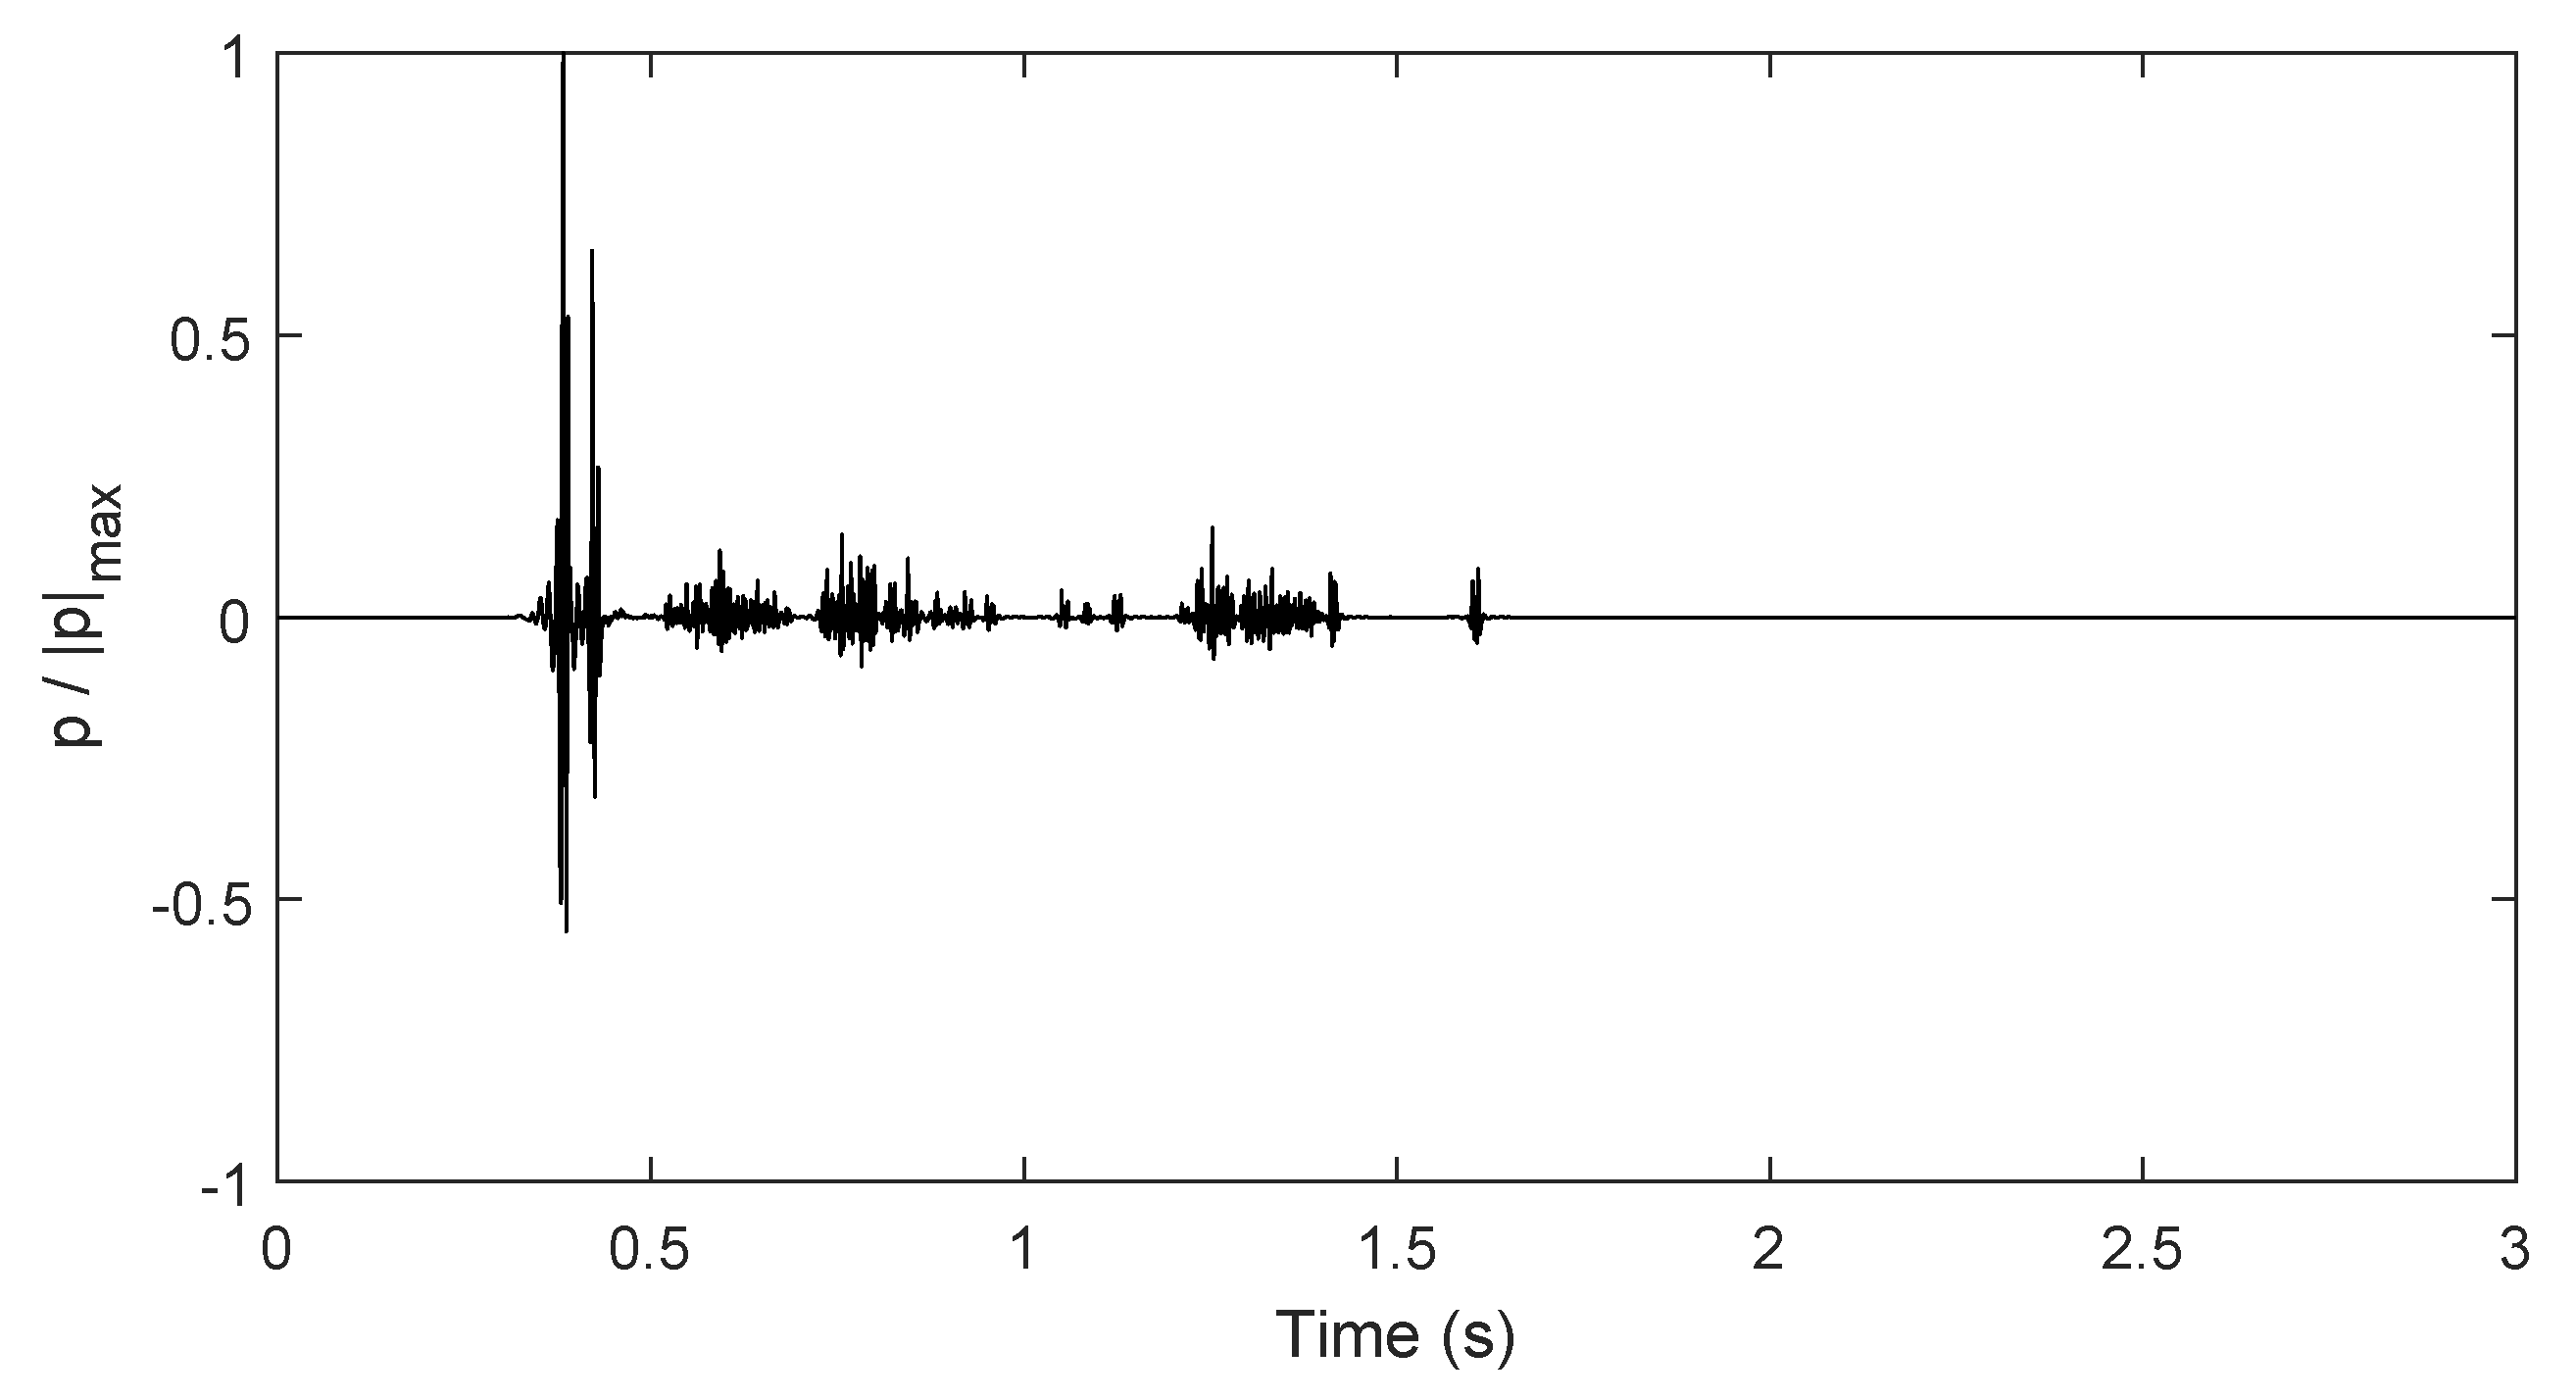
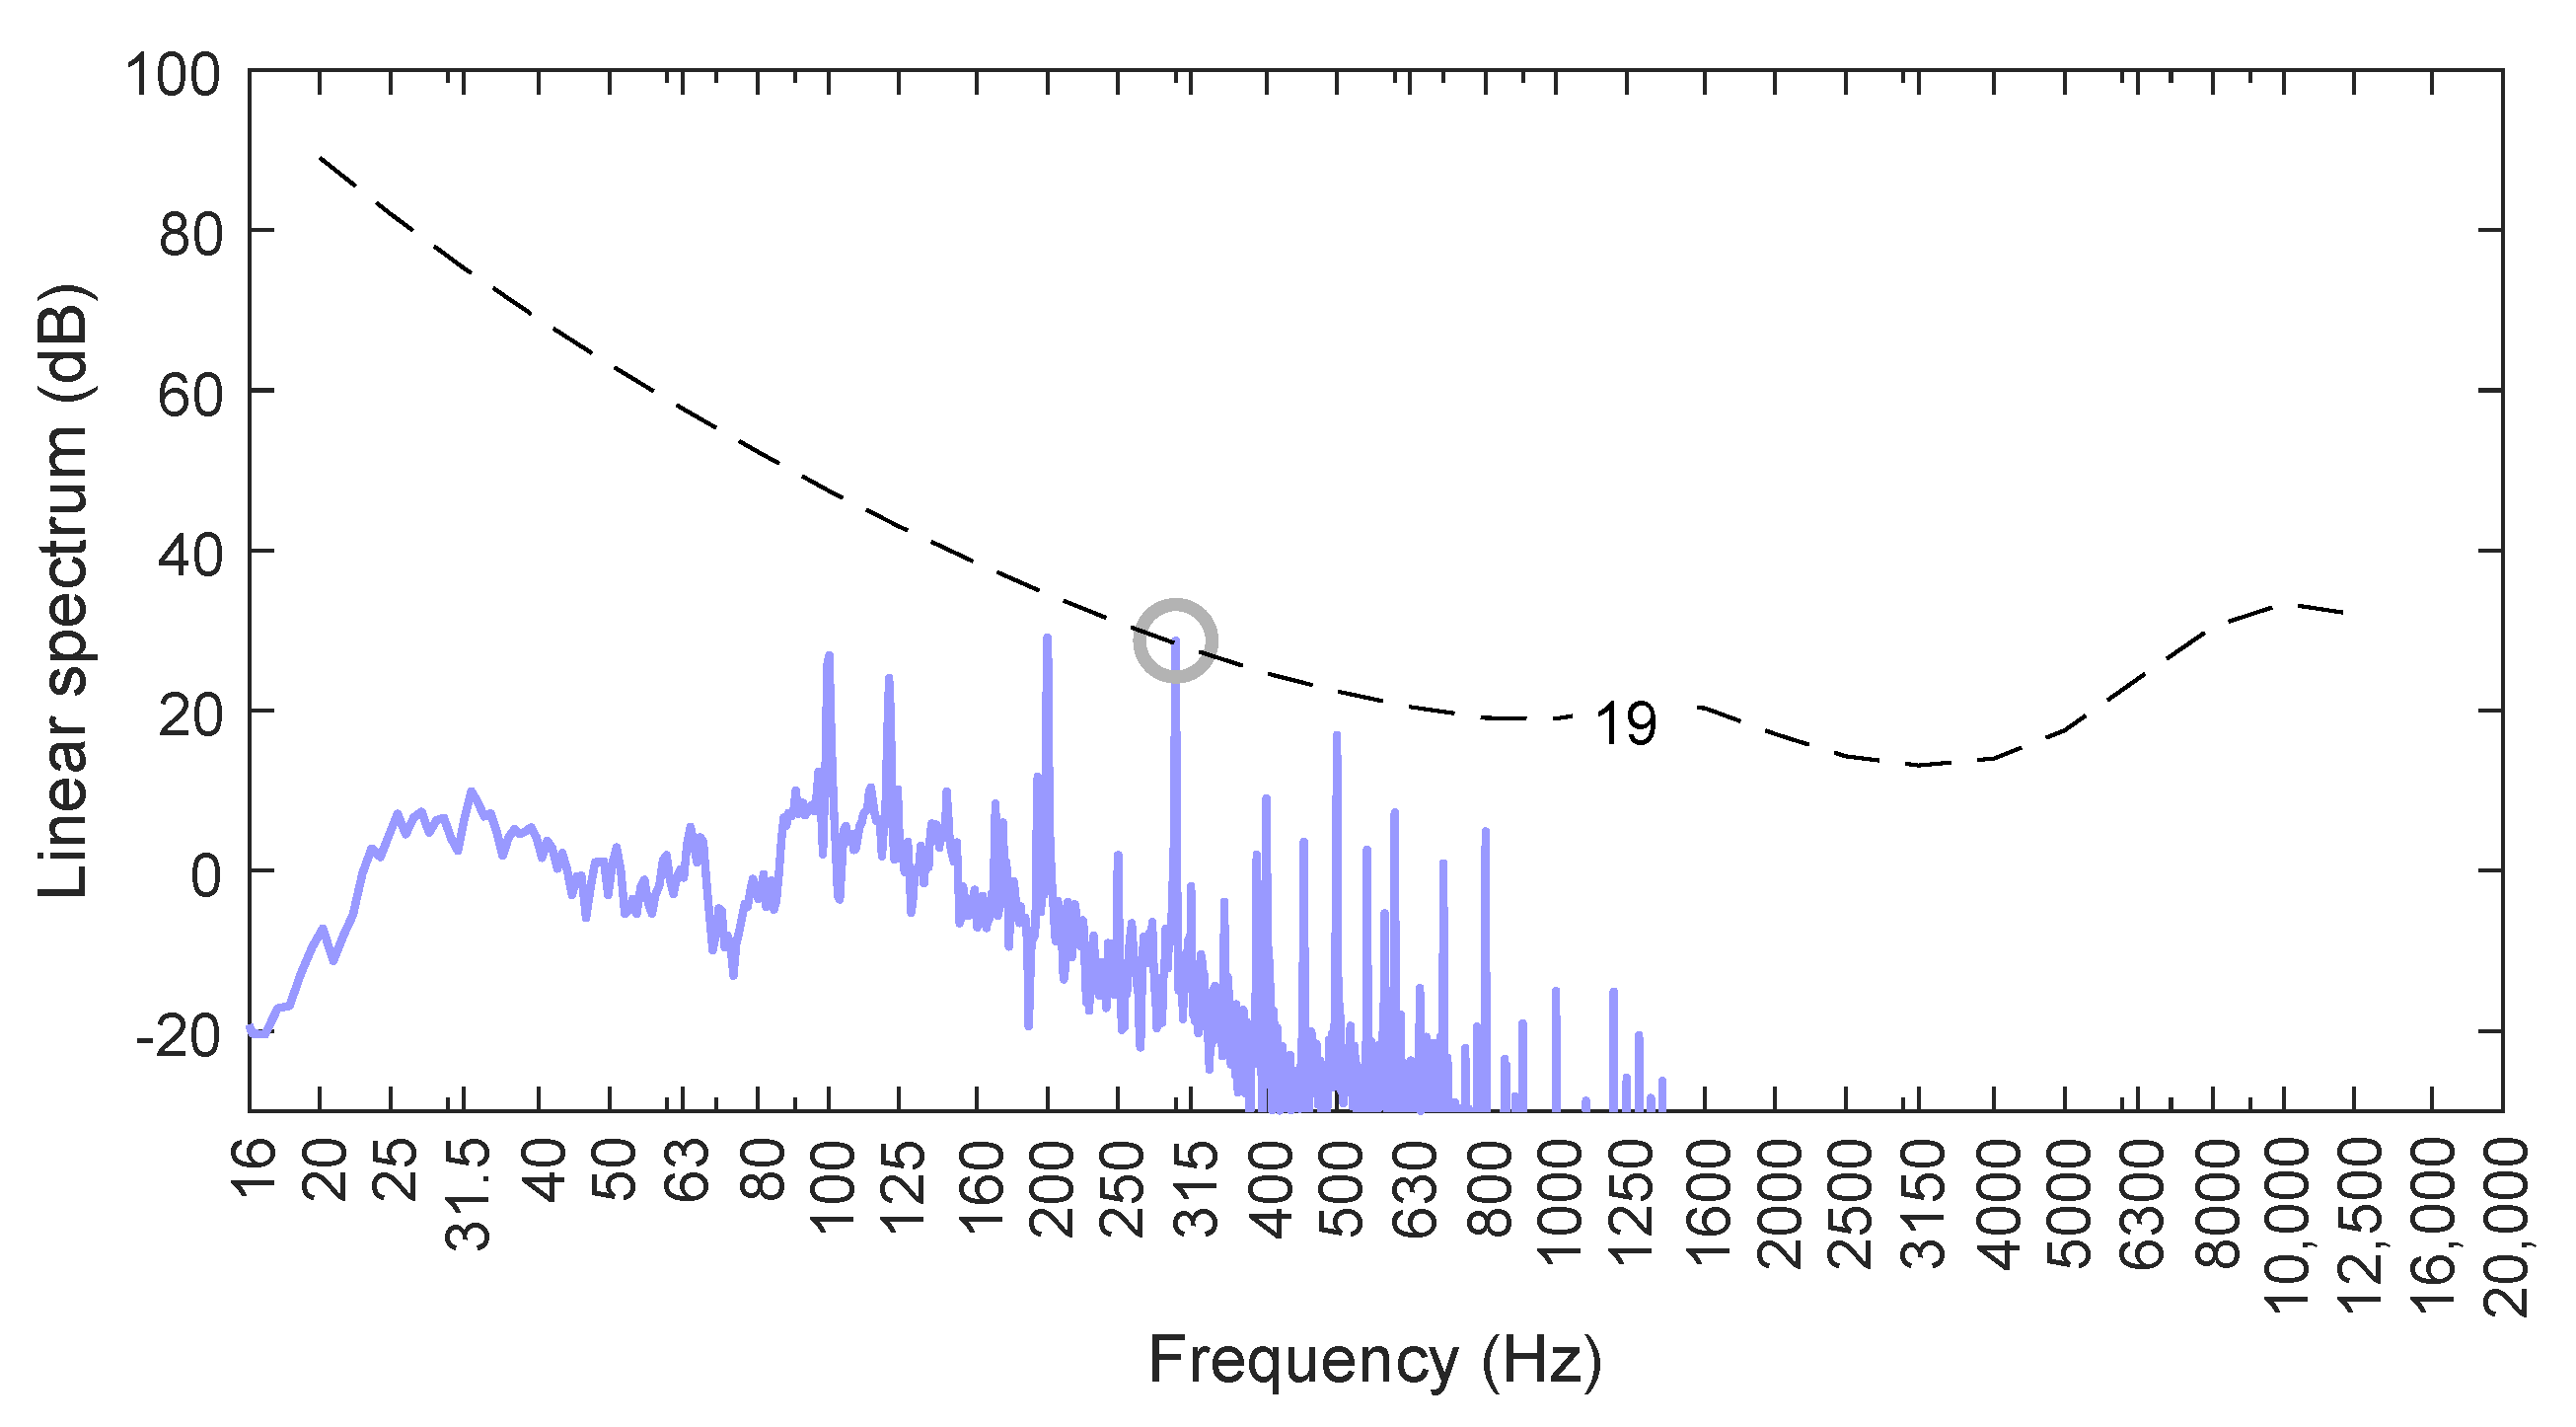
2.2. Characterization of the Sound Source
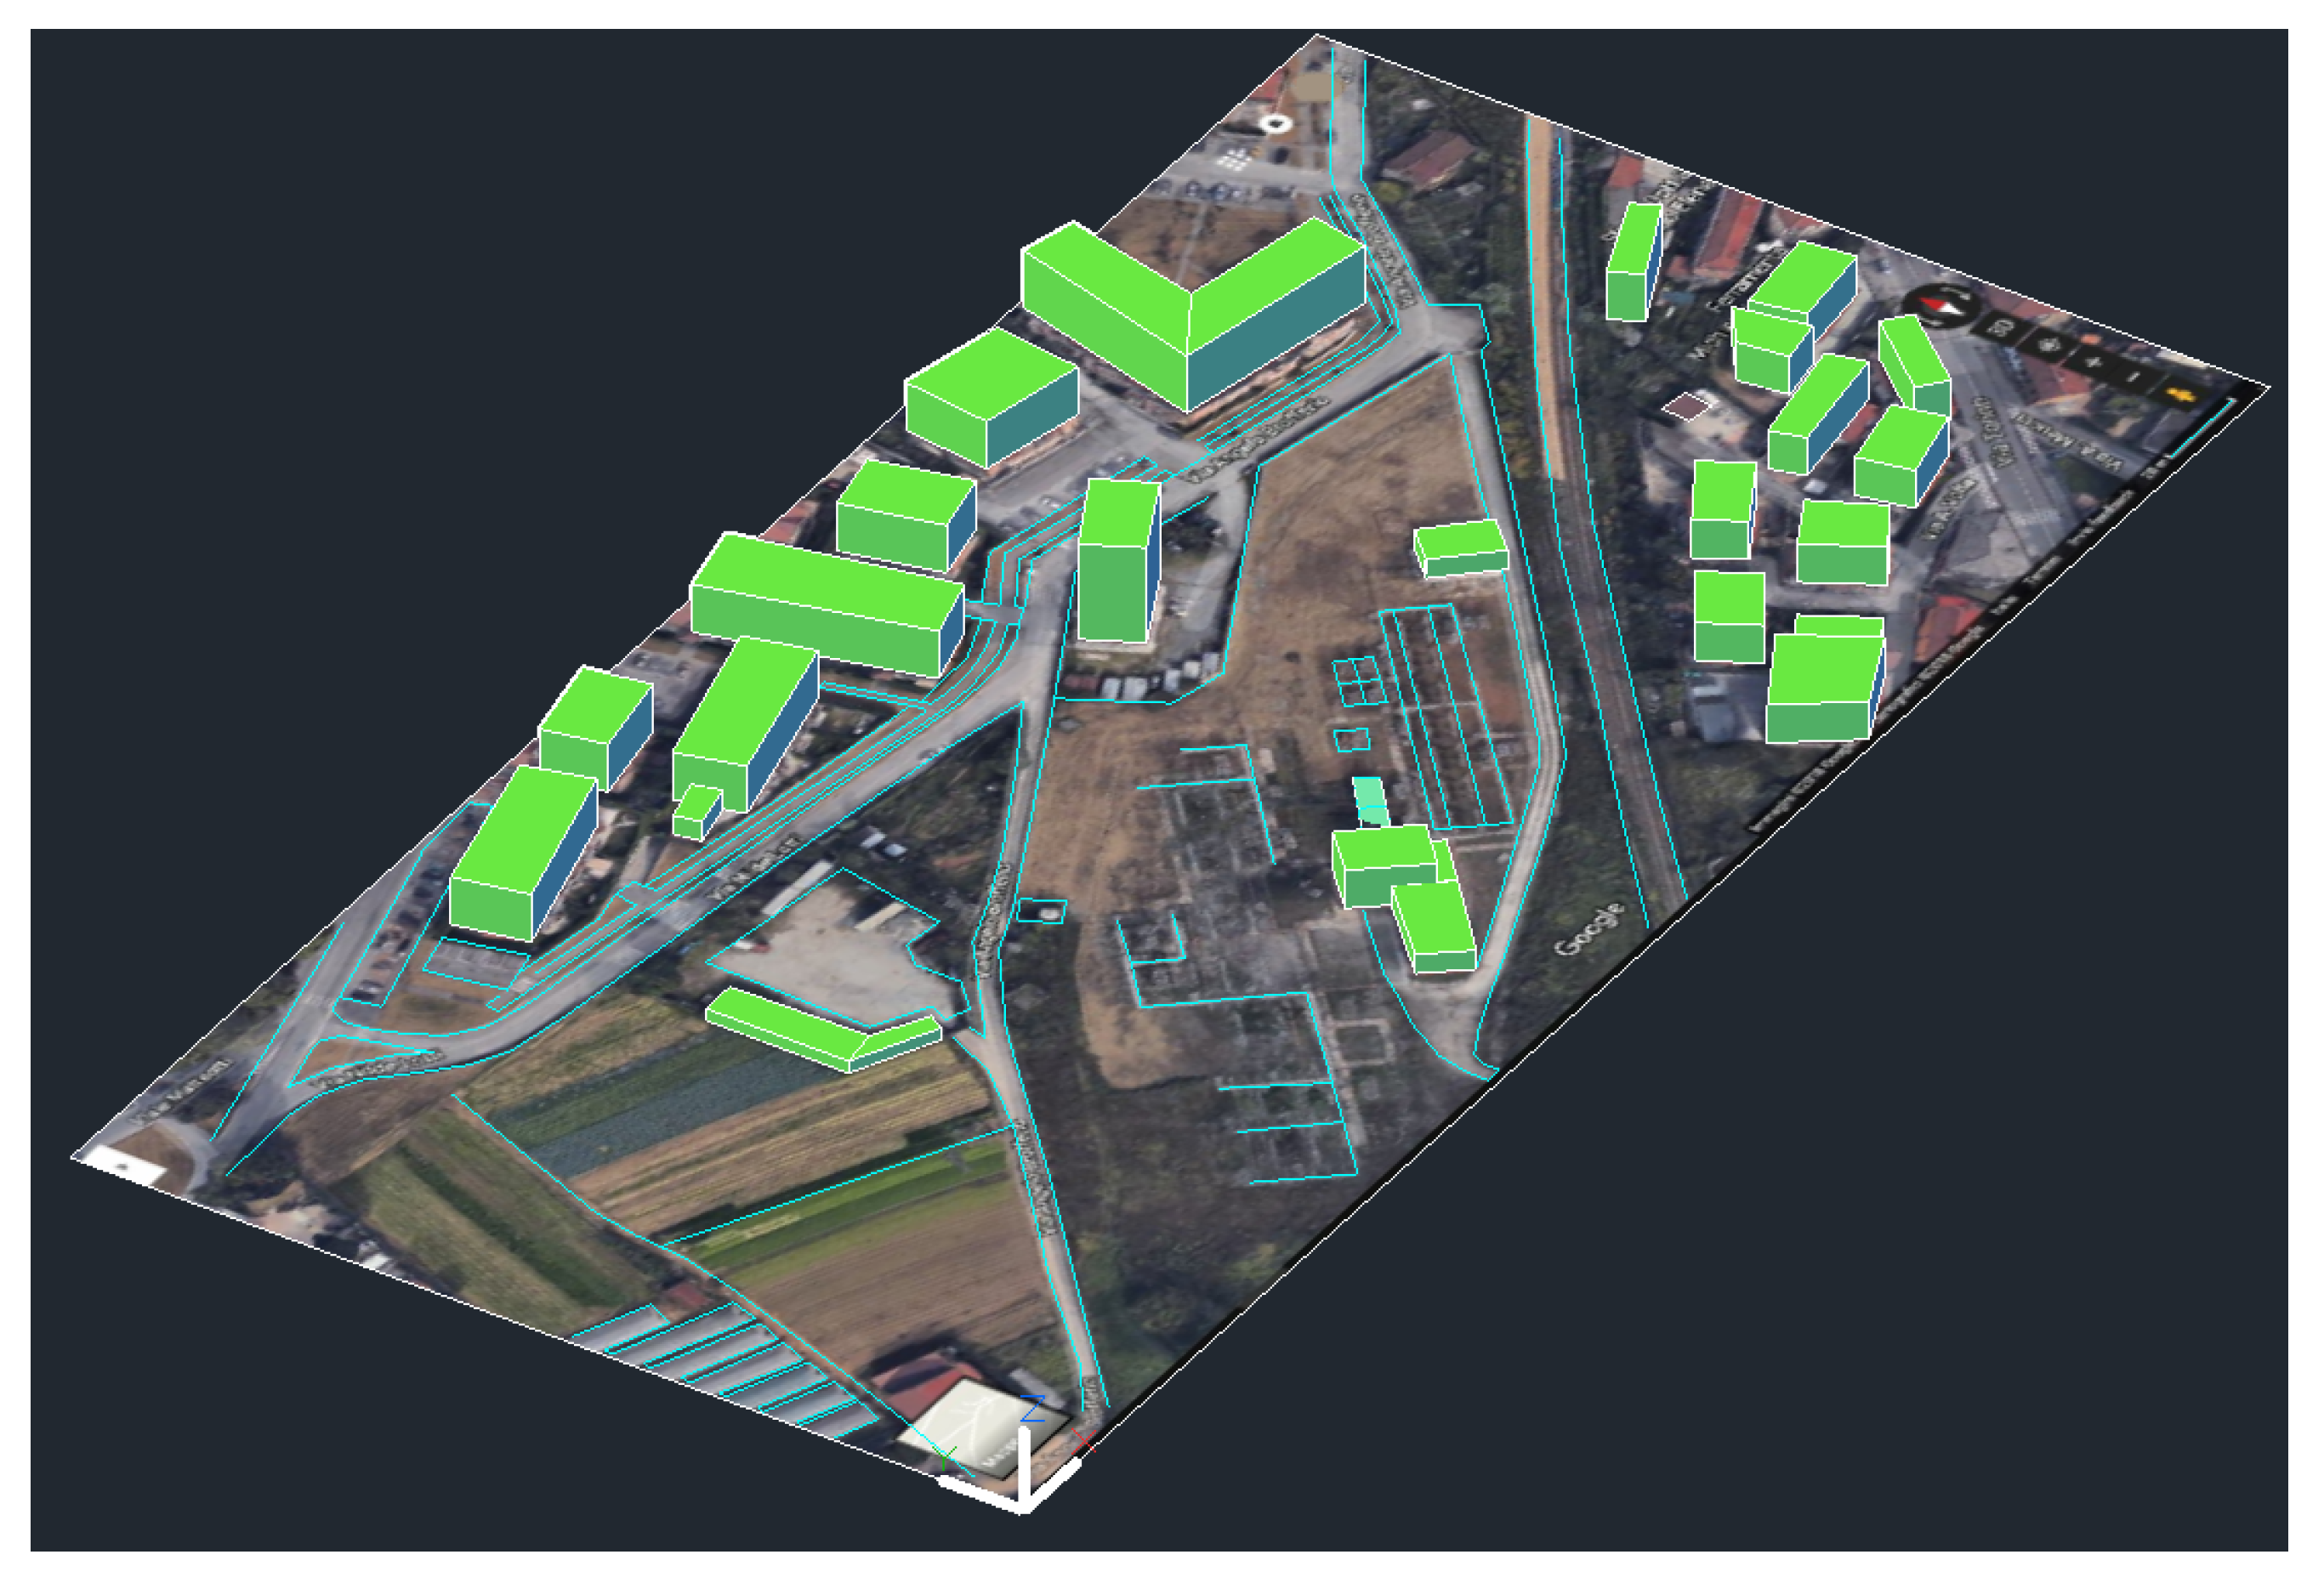
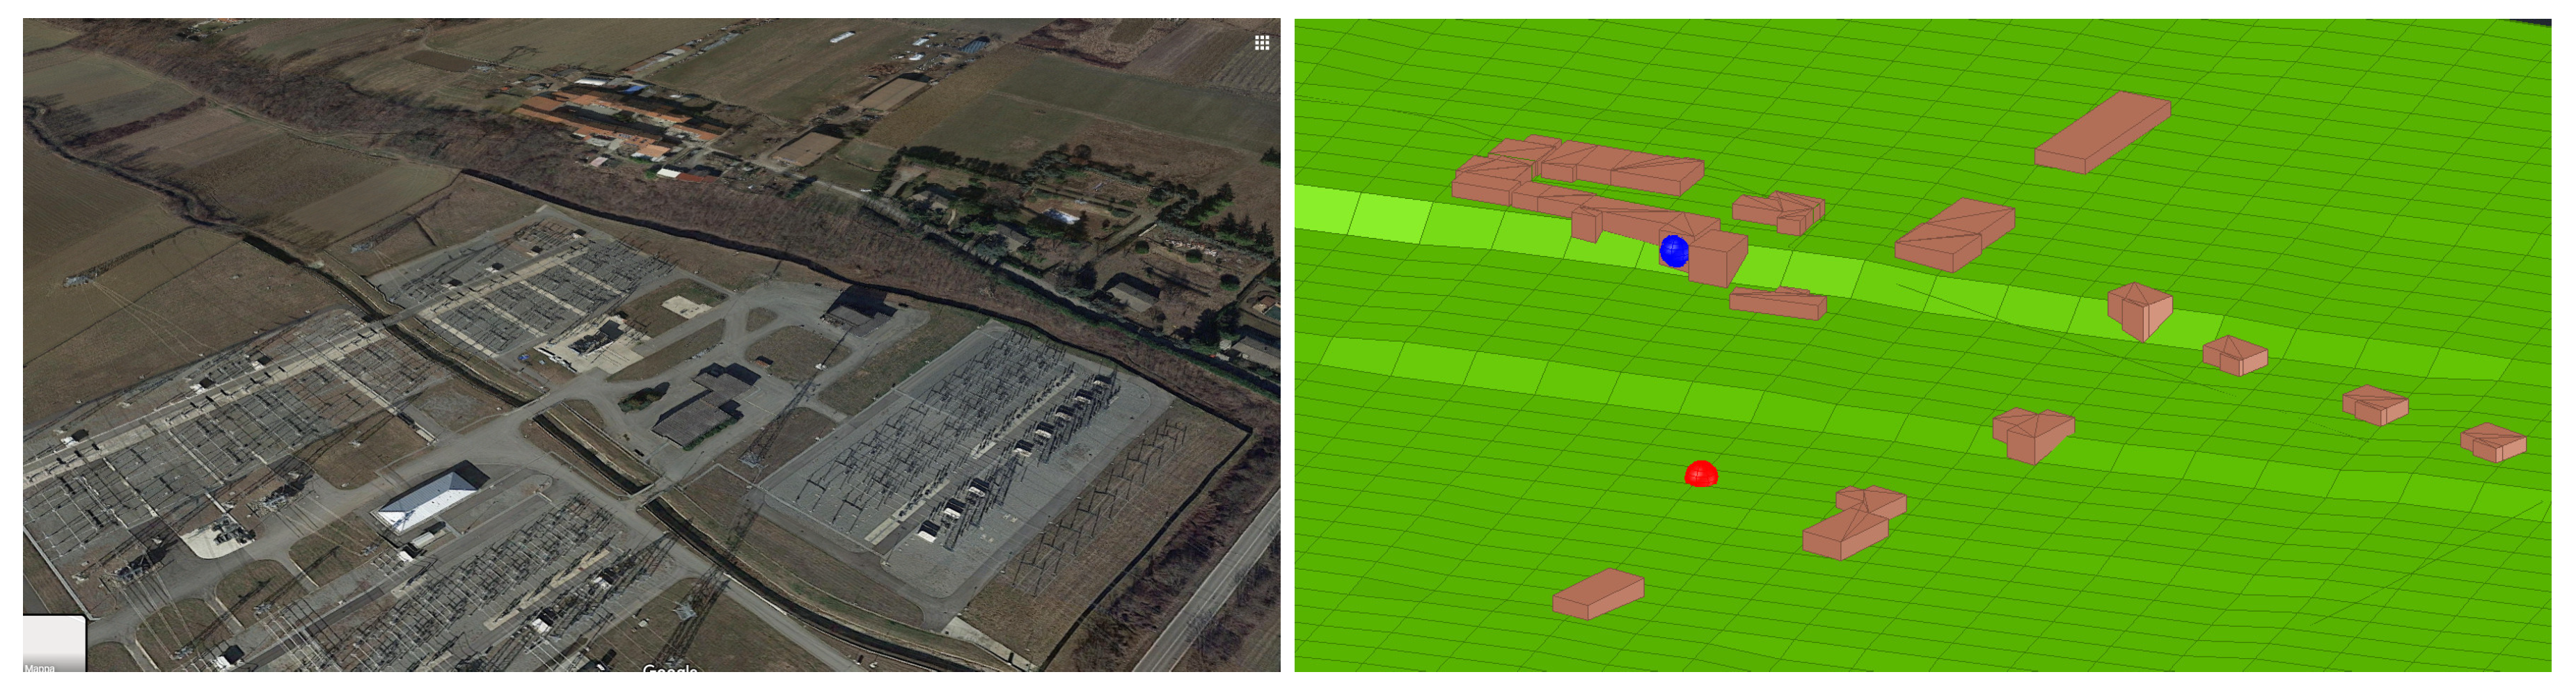
2.3. Noise Propagation Modeling
2.4. Preliminary Validation
3. Results and Discussion
3.1. Before Situation
3.2. Noise Barrier
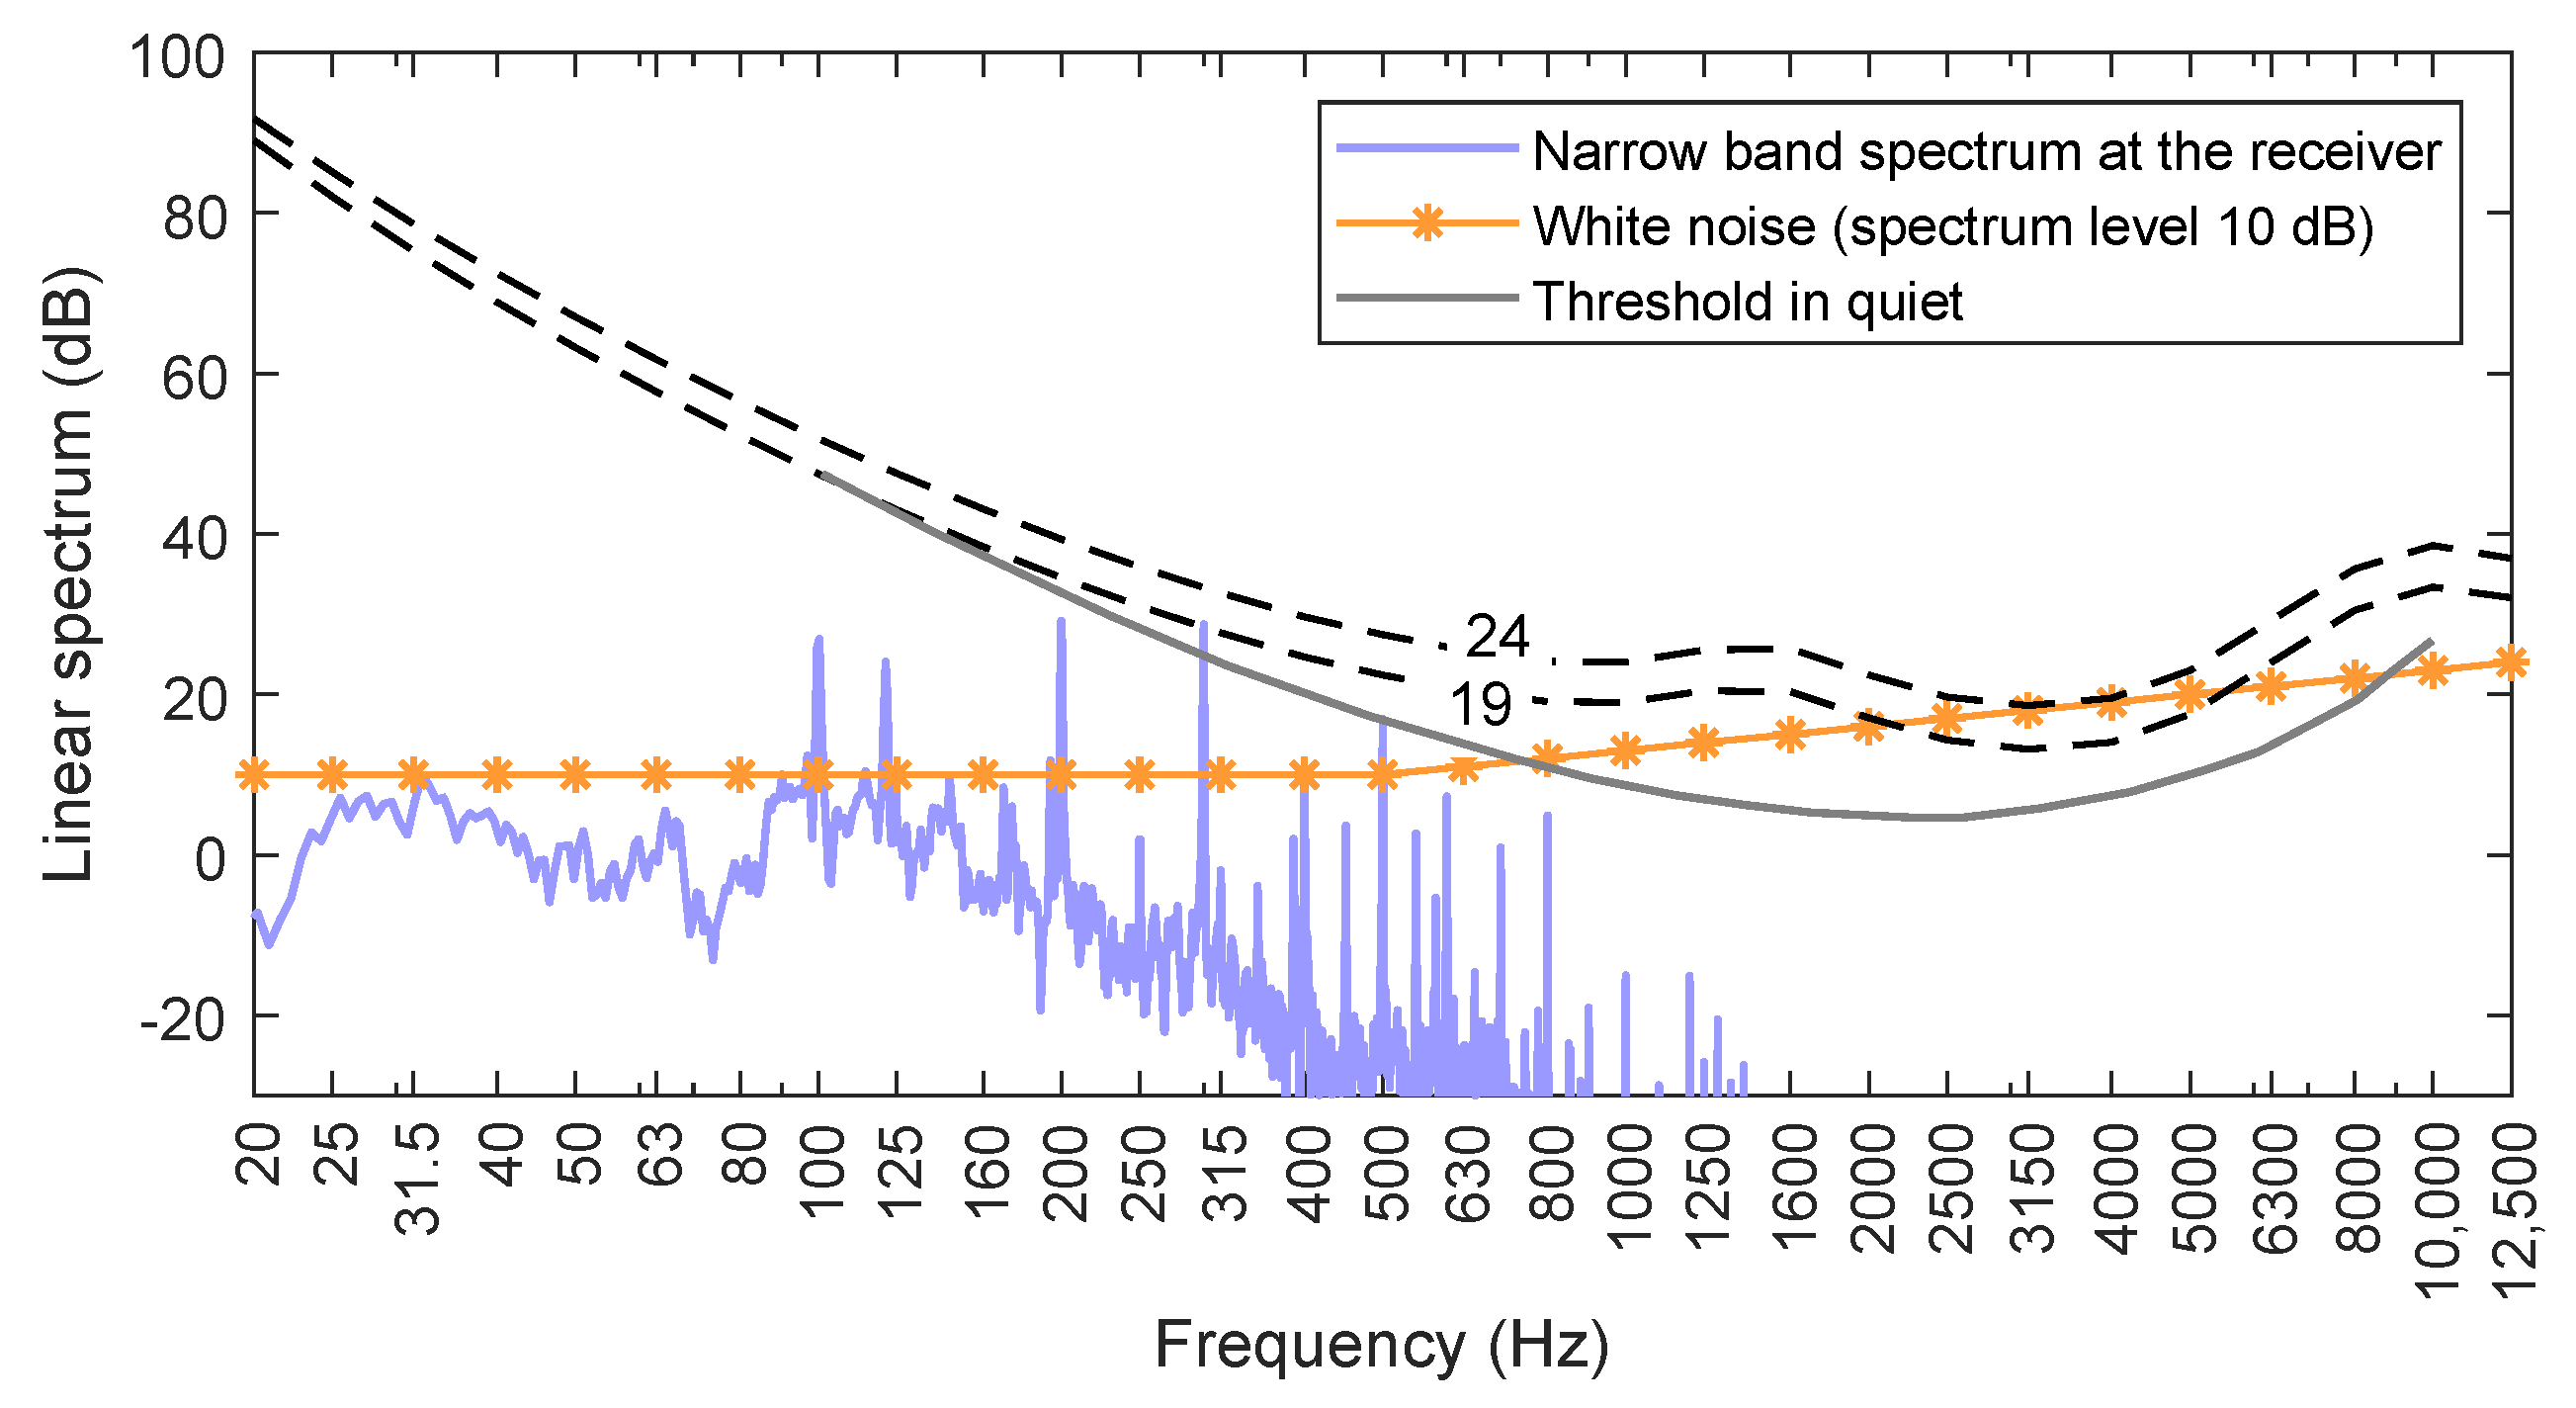
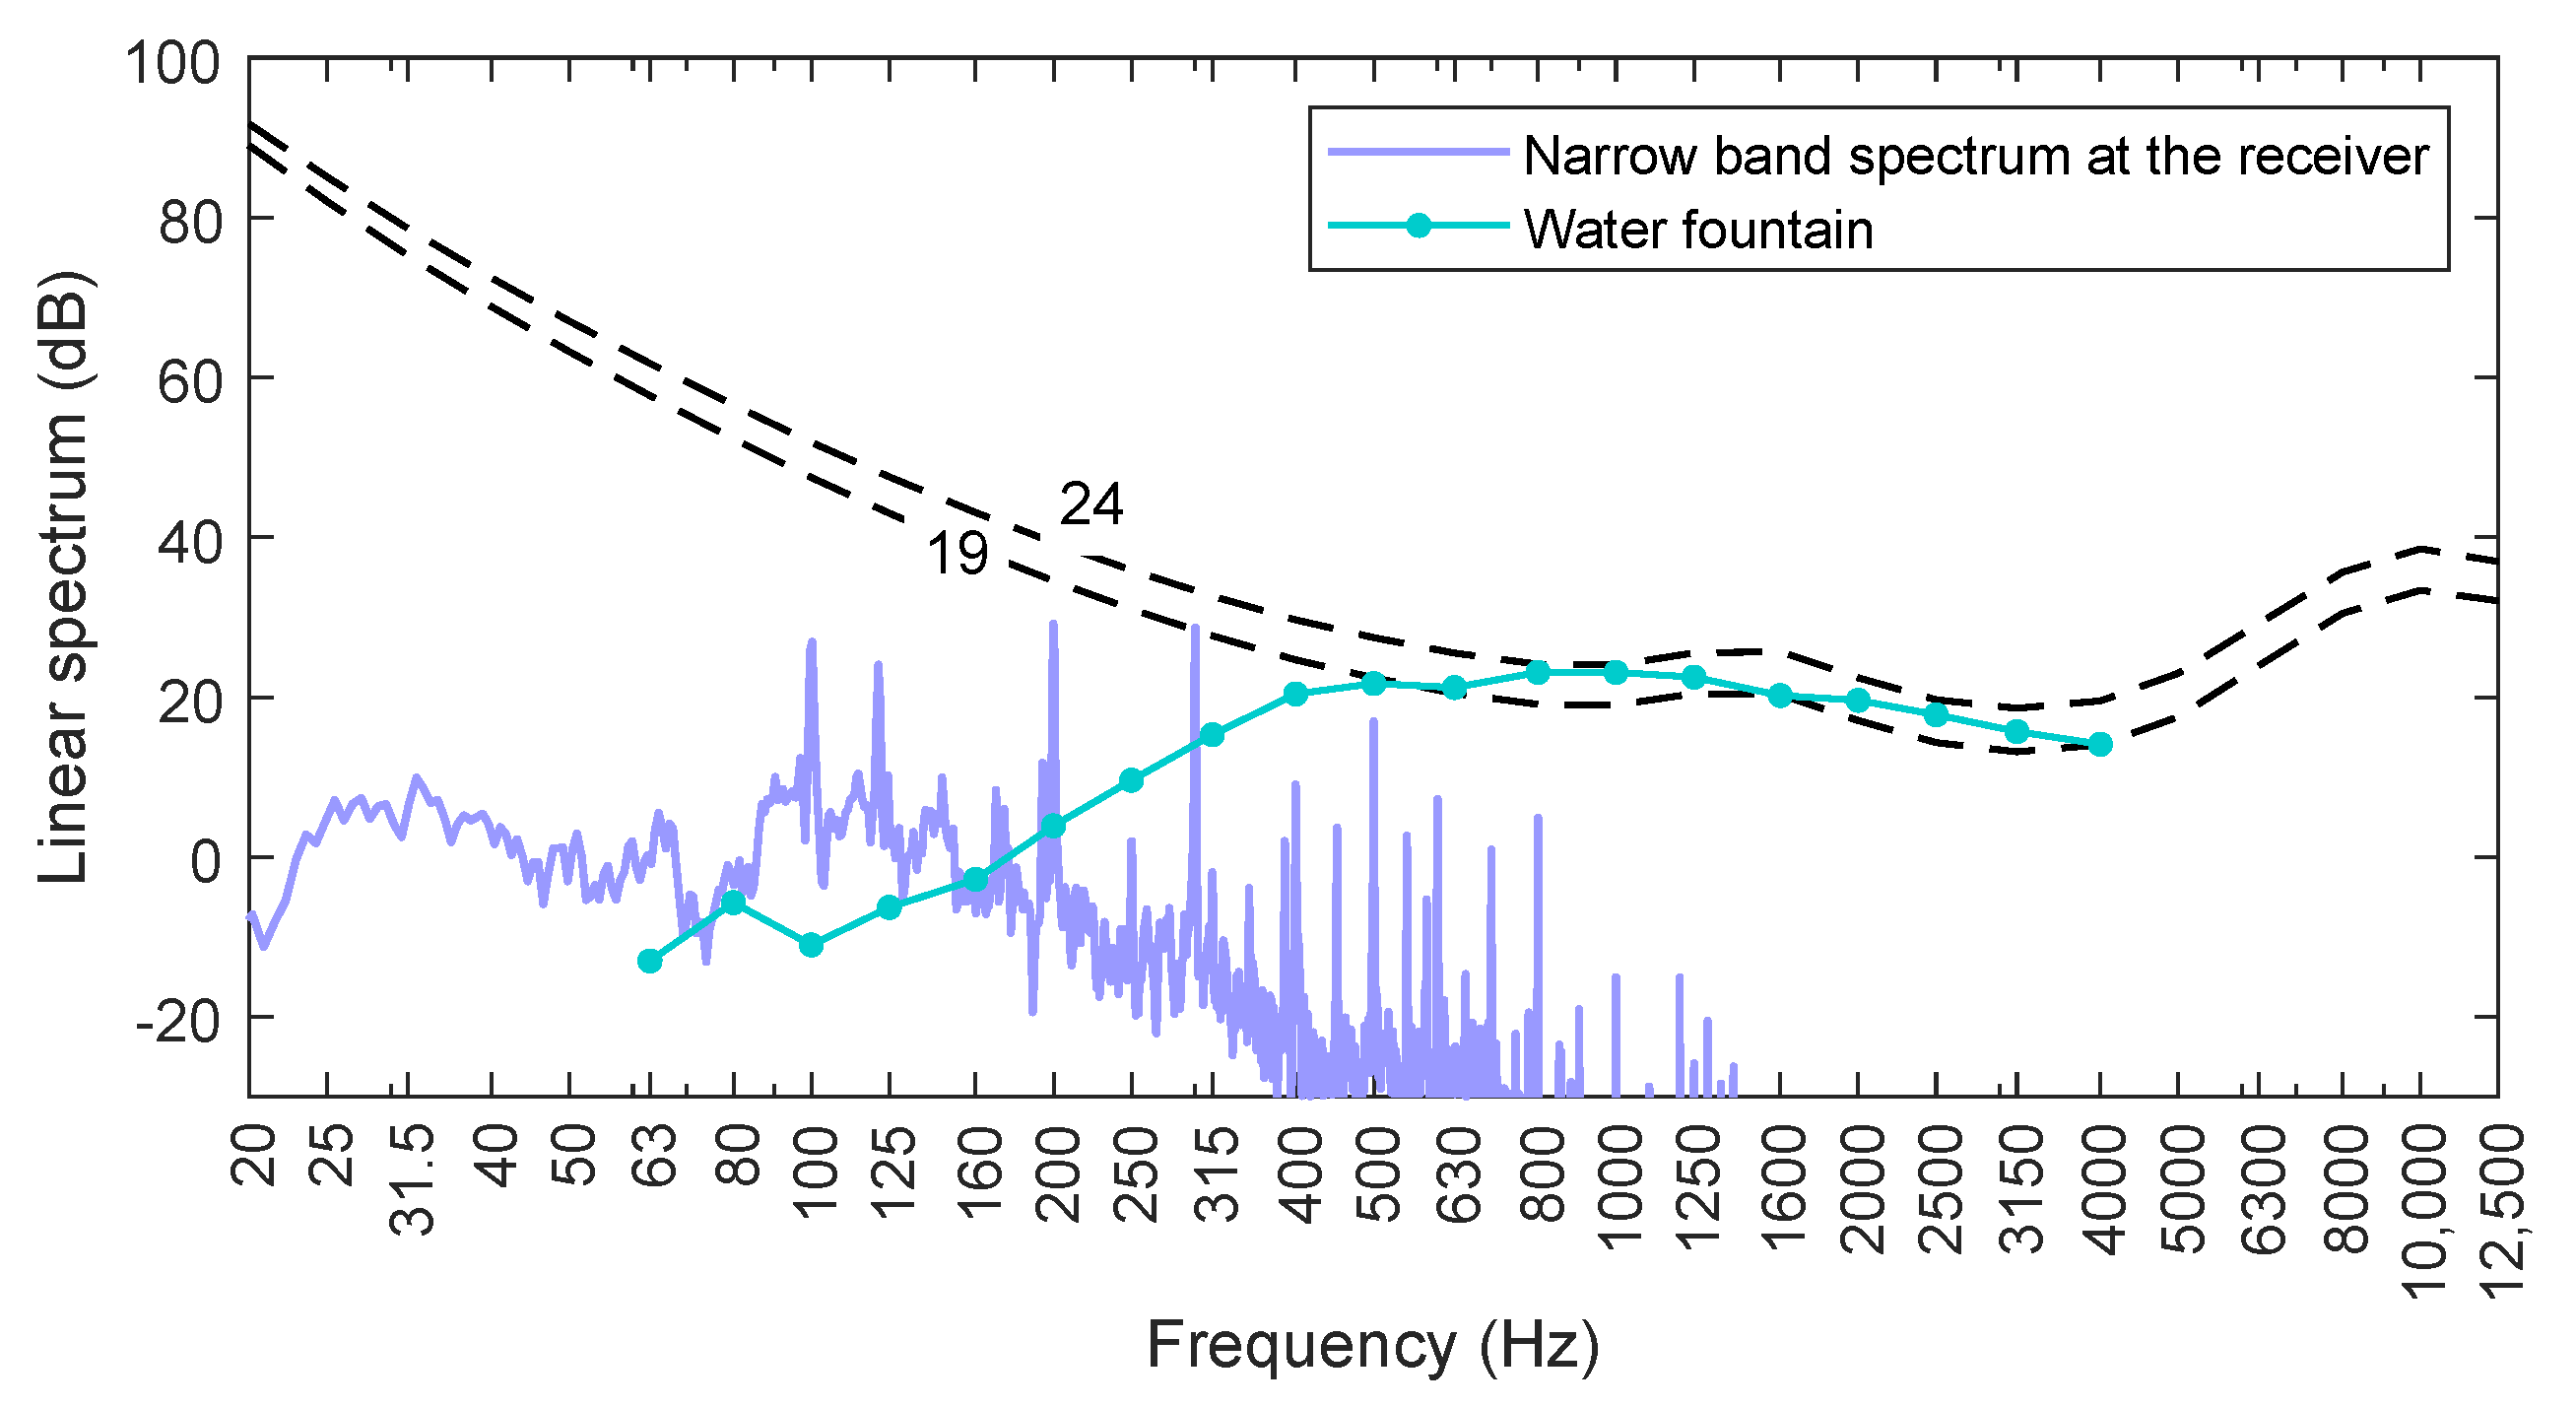
3.3. Noise Masking
4. Conclusions
Author Contributions
Funding
Conflicts of Interest
References
- Pellerin-Carlin, T.; Vinois, J.A.; Rubio, E.; Fernandes, S. Making the Energy Transition A European Success. Tackling the Democratic, Innovation, Financing and Social Challengers of the Energy Union; Technical Report 114; Jacques Delors Institute: Paris, France, 2017. [Google Scholar]
- Buck, M.; Graf, A.; Graichen, P. European Energy Transition 2030: The Big Picture. In Ten Priorities for the Next European Commission to Meet the Eu’S 2030 Targets and Accelerate towards 2050; Technical Report; Agora Energiewende: Berlin, Germany, 2019. [Google Scholar]
- European Network of Transmission System Operators for Electricity, ENTSO-E. Ten-Year Network Development Plan 2010–2020; Technical Report; European Network of Transmission System Operators for Electricity, ENTSO-E: Brussels, Belgium, 2010. [Google Scholar]
- European Network of Transmission System Operators for Electricity, ENTSO-E. TYNDP 2018 Executive Report. Connecting Europe: Electricity; Technical Report; European Network of Transmission System Operators for Electricity, ENTSO-E: Brussels, Belgium, 2018. [Google Scholar]
- Ghaffarpour, R.; Jannati Oskuee, M.; Ranjbar, A. Resilience-oriented distribution network optimal planning to improve the continuity of power supply. Int. J. Amb. Energy 2018. [Google Scholar] [CrossRef]
- United Nations. World Urbanization Prospects: The 2018 Revision. In Key Facts; Technical Report; United Nations: New York, NY, USA, 2018. [Google Scholar]
- Buchholz, B.M.; Styczynski, Z. Modern Technologies and the Smart Grid Challenges in Transmission Networks. In Smart Grids—Fundamentals and Technologies in Electricity Networks; Buchholz, B.M., Styczynski, Z., Eds.; Springer: Berlin/Heidelberg, Germany, 2014; pp. 61–119. [Google Scholar] [CrossRef]
- McDonald, J.D. Electric Power Substations Engineering, 3rd ed.; CRC Press: Boca Raton, FL, USA, 2012. [Google Scholar]
- Sanders, H.; Van Waes, J.; Van De Rijt, P.; Sibbel, H.; Wassens, M.; Megens, E. Added value of integrated substations in improving social acceptance of power system infrastructure. In Proceedings of the 44th International Conference on Large High Voltage Electric Systems 2012, Paris, France, 26–31 August 2012. [Google Scholar]
- Piana, E.; Bignucolo, F.; Donini, A.; Spezie, R. Maintenance of a high-voltage overhead transmission line: Sustainability and noise impact assessment. Sustainability 2018, 10, 491. [Google Scholar] [CrossRef]
- Donini, A.; Spezie, R.; Cortina, R.; Piana, E.; Turri, R. Accurate prediction of the corona noise produced by overhead transmission lines. In AEIT 2016—International Annual Conference: Sustainable Development in the Mediterranean Area, Energy and ICT Networks of the Future; Institute of Electrical and Electronics Engineers Inc.: Naples, Italy, 2016; p. 7892760. [Google Scholar] [CrossRef]
- Danesi, G.; Giorgi, A. Considerazioni sul Silenziamento dei Trasformatori delle Stazioni di Interconnessione (Notes on Reducing the Noise in EHV Transforming Substations). Elettrotecnica 1975, 62, 951–956. (In Italian) [Google Scholar]
- Institute of Electrical and Electronic Engineers. IEEE 1127-2013—IEEE Guide for the Design, Construction, and Operation of Electric Power Substations for Community Acceptance and Environmental Compatibility; Institute of Electrical and Electronics Engineers: Piscataway, NJ, USA, 2013. [Google Scholar]
- Tupov, V.; Semin, S.; Tupov, B.; Taratornin, A.; Rozanov, D. Noise barriers for power-plant equipment. Power Technol. Eng. 2017, 50, 649–652. [Google Scholar] [CrossRef]
- Belderrain, M.; Montemurro, W. A new solution of environmental noise control of a transforming station. In Proceedings of the 41st International Congress and Exposition on Noise Control Engineering 2012, INTER-NOISE 2012, New York, NY, USA, 19–22 August 2012; Volume 9, pp. 7247–7255. [Google Scholar]
- Ostiguy, P.C.; Pearson, M.; L’Espérance, A.; Gérard, A.; Gosselin, F. Transformer noise reduction using acoustical blankets installed with magnetic mounting bracket. In Proceedings of the 47th International Congress and Exposition on Noise Control Engineering: Impact of Noise Control Engineering, INTER-NOISE 2018, Chicago, IL, USA, 26–29 August 2018; pp. 5567–5576. [Google Scholar]
- Ying, L.; Wang, J.; Liu, Q.; Wang, D. Application study of adaptive tracking algorithm in active noise control system of transformer. Appl. Sci. 2019, 9, 2693. [Google Scholar] [CrossRef]
- Zou, H.; Tao, J.; Qiu, X. Present status and future development for active control of transformer noise. In Proceedings of the 46th International Congress and Exposition on Noise Control Engineering: Taming Noise and Moving Quiet, INTER-NOISE 2017, Hong Kong, China, 27–30 August 2017; pp. 3607–3613. [Google Scholar]
- Qiu, X.; Zhou, H. Recent progress in research on virtual sound barriers. In Proceedings of the 2nd Australasian Acoustical Societies Conference, ACOUSTICS 2016, Brisbane, Australia, 9–11 November 2016; Volume 1, pp. 244–253. [Google Scholar]
- Hu, S.; Chen, S.; Zou, H.; Li, T. Research on the application of active sound barriers for the transformer noise abatement. In Proceedings of the MATEC Web of Conferences, 2016 International Conference on Electronic, Information and Computer Engineering, ICEICE 2016, Hong Kong, China, 26–27 April 2016; Volume 44. [Google Scholar] [CrossRef]
- Borchi, F.; Carfagni, M.; Martelli, L.; Turchi, A.; Argenti, F. Design and experimental tests of active control barriers for low-frequency stationary noise reduction in urban outdoor environment. Appl. Acoust. 2016, 114, 125–135. [Google Scholar] [CrossRef]
- Nilsson, M.; Alvarsson, J.; Rådsten-Ekman, M.; Bolin, K. Auditory masking of wanted and unwanted sounds in a city park. Noise Control Eng. J. 2010, 58, 524–531. [Google Scholar] [CrossRef]
- Cai, J.; Liu, J.; Yu, N.; Liu, B. Effect of water sound masking on perception of the industrial noise. Appl. Acoust. 2019, 150, 307–312. [Google Scholar] [CrossRef]
- Coensel, B.; Vanwetswinkel, S.; Botteldooren, D. Effects of natural sounds on the perception of road traffic noise. J. Acoust. Soc. Am. 2011, 129, EL148–EL153. [Google Scholar] [CrossRef] [PubMed]
- Jeon, J.; Lee, P.; You, J.; Kang, J. Acoustical characteristics of water sounds for soundscape enhancement in urban open spaces. J. Acoust. Soc. Am. 2012, 131, 2101–2109. [Google Scholar] [CrossRef] [PubMed]
- Fastl, H.; Zwicker, E. Psychoacoustics: Facts And Models, 3rd ed.; Springer-Nature Inc.: Berlin, Germany; New York, NY, USA, 2007. [Google Scholar]
- Gelfand, S.A. Hearing: An Introduction to Psychological and Physiological Acoustics, 5th ed.; Informa Healthcare: New York, NY, USA, 2009. [Google Scholar]
- International Organization for Standardization. ISO 9613-2:1996—Acoustics—Attenuation of Sound during Propagation Outdoors—Part 2: General Method of Calculation; International Organization for Standardization: Geneva, Switzerland, 1996. [Google Scholar]
- Farina, A. Validation of the pyramid tracing algorithm for sound propagation outdoors: Comparison with experimental measurements and with the ISO-DIS 9613 standards. Adv. Eng. Softw. 2000, 31, 241–250. [Google Scholar] [CrossRef]
- Farina, A. Ramsete Home Page. Available online: http://www.ramsete.com/ (accessed on 13 December 2019).
- International Electrotechnical Commission. IEC 60076-10:2016—Power Transformers—Part 10: Determination of Sound Levels; International Electrotechnical Commission: Geneva, Switzerland, 2016. [Google Scholar]
- Badino, E.; Manca, R.; Shtrepi, L.; Calleri, C.; Astolfi, A. Effect of façade shape and acoustic cladding on reduction of leisure noise levels in a street canyon. Build. Environ. 2019, 157, 242–256. [Google Scholar] [CrossRef]
- Italian Parliament. Legge 26/10/1995, n. 447—Legge Quadro sull’inquinamento Acustico (Law 26/10/1995, n. 447—Framework Law on Environmental Noise); Italian Official Gazette General Series n. 254 of 30-10-1995, Ordinary Supplement n. 125; Istituto Poligrafico e Zecca dello Stato: Rome, Italy, 1995. (In Italian) [Google Scholar]
- Italian Presidency of the Council of Ministers. D.P.C.M. 14/11/97—Valori Limite delle Sorgenti Sonore (Decree by the Prime Minister of Italy 14/11/1997—Limit Values for Noise Sources); Italian Official Gazette General Series n. 280 of 1-12-1997; Istituto Poligrafico e Zecca dello Stato: Rome, Italy, 1997. (In Italian) [Google Scholar]
- Italian Ministry of the Environment. D.M. 16/03/1998—Tecniche di Rilevamento e di Misurazione dell’Inquinamento Acustico (Ministerial Decree 16/03/1998—Techniques for Noise Pollution Detection and Measurement); Italian Official Gazette General Series n. 76 of 01-04-1998; Istituto Poligrafico e Zecca dello Stato: Rome, Italy, 1998. (In Italian) [Google Scholar]
- International Electrotechnical Commission. IEC 61672-1:2013—Electroacoustics—Sound Level Meters—Part 1: Specifications; International Electrotechnical Commission: Geneva, Switzerland, 2013. [Google Scholar]
- Kurze, U.; Anderson, G. Sound attenuation by barriers. Appl. Acoust. 1971, 4, 35–53. [Google Scholar] [CrossRef]
- LecaSistemi. SoundLeca 20 (SL20) Technical Datasheet. Available online: www.lecasistemi.it (accessed on 14 December 2019).
- Hawkins, T., Jr.; Stevens, S. The Masking of Pure Tones and of Speech by White Noise. J. Acoust. Soc. Am. 1950, 22, 6–13. [Google Scholar] [CrossRef]
- Hong, J.; Lam, B.; Ong, Z.T.; Ooi, K.; Gan, W.S.; Kang, J.; Yeong, S.; Lee, I.; Tan, S.T. The effects of spatial separations between water sound and traffic noise sources on soundscape assessment. Build. Environ. 2020, 167. [Google Scholar] [CrossRef]


| Frequency (Hz) | Grass (Ground) | Ballast (Ground Around the Source) | Asphalt (from [32]) (Roads) | Plaster (from [32]) (Façades) |
|---|---|---|---|---|
| 31.5 | 0.04 | 0.11 | 0.02 | 0.01 |
| 63 | 0.09 | 0.34 | 0.02 | 0.01 |
| 125 | 0.12 | 0.58 | 0.02 | 0.01 |
| 250 | 0.15 | 0.96 | 0.03 | 0.01 |
| 500 | 0.42 | 0.96 | 0.03 | 0.01 |
| 1000 | 0.49 | 0.89 | 0.03 | 0.03 |
| 2000 | 0.58 | 0.70 | 0.03 | 0.06 |
| 4000 | 0.64 | 0.70 | 0.02 | 0.06 |
| 8000 | 0.70 | 0.07 | 0.02 | 0.07 |
| 16,000 | 0.83 | 0.70 | 0.02 | 0.07 |
© 2020 by the authors. Licensee MDPI, Basel, Switzerland. This article is an open access article distributed under the terms and conditions of the Creative Commons Attribution (CC BY) license (http://creativecommons.org/licenses/by/4.0/).
Share and Cite
Piana, E.A.; Roozen, N.B. On the Control of Low-Frequency Audible Noise from Electrical Substations: A Case Study. Appl. Sci. 2020, 10, 637. https://doi.org/10.3390/app10020637
Piana EA, Roozen NB. On the Control of Low-Frequency Audible Noise from Electrical Substations: A Case Study. Applied Sciences. 2020; 10(2):637. https://doi.org/10.3390/app10020637
Chicago/Turabian StylePiana, Edoardo Alessio, and Nicolaas Bernardus Roozen. 2020. "On the Control of Low-Frequency Audible Noise from Electrical Substations: A Case Study" Applied Sciences 10, no. 2: 637. https://doi.org/10.3390/app10020637
APA StylePiana, E. A., & Roozen, N. B. (2020). On the Control of Low-Frequency Audible Noise from Electrical Substations: A Case Study. Applied Sciences, 10(2), 637. https://doi.org/10.3390/app10020637