Article

Measuring Quality of Service in a Robotized Comprehensive Geriatric Assessment Scenario

by
Adrián Romero-Garcés
1,
Jesús Martínez-Cruz
1,
Juan F. Inglés-Romero
2,
Cristina Vicente-Chicote
3,
Rebeca Marfil
1 and
Antonio Bandera
1,*
1
University of Málaga, 29071 Málaga, Spain
2
Biometric Vox S.L., 30100 Murcia, Spain
3
Quercus Software Engineering Group, University of Extremadura, 10003 Cáceres, Spain
*
Author to whom correspondence should be addressed.
Appl. Sci. 2020, 10(18), 6618; https://doi.org/10.3390/app10186618
Submission received: 1 August 2020 / Revised: 11 September 2020 / Accepted: 18 September 2020 / Published: 22 September 2020
(This article belongs to the Special Issue Cognitive Robotics)

Abstract

:
Comprehensive Geriatric Assessment (CGA) is an integrated clinical process to evaluate frail elderly people in order to create therapy plans that improve their quality and quantity of life. The whole process includes the completion of standardized questionnaires or specific movements, which are performed by the patient and do not necessarily require the presence of a medical expert. With the aim of automatizing these parts of the CGA, we have designed and developed CLARC (smart CLinic Assistant Robot for CGA), a mobile robot able to help the physician to capture and manage data during the CGA procedures, mainly by autonomously conducting a set of predefined evaluation tests. Using CLARC to conduct geriatric tests will reduce the time medical professionals have to spend on purely mechanical tasks, giving them more time to develop individualised care plans for their patients. In fact, ideally, CLARC will perform these tests on its own. In parallel with the effort to correctly address the functional aspects, i.e., the development of the robot tasks, the design of CLARC must also deal with non-functional properties such as the degree of interaction or the performance. We argue that satisfying user preferences can be a good way to improve the acceptance of the robot by the patients. This paper describes the integration into the software architecture of the CLARC robot of the modules that allow these properties to be monitored at run-time, providing information on the quality of its service. Experimental evaluation illustrates that the defined quality of service metrics correctly capture the evolution of the aspects of the robot’s activity and its interaction with the patient covered by the non-functional properties that have been considered.

1. Introduction

The Comprehensive Geriatric Assessment (CGA) is a clinical procedure designed to capture information on medical, psycho-social and functional resources and problems of elderly people. The collected data is subsequently used to personalize the treatment prescription, allowing the creation of an overall plan for follow-up. CGA is an interdisciplinary effort, requiring the coordination of several clinical professionals such as occupational therapists, physiotherapists, social workers, or medical doctors. At the end, a typical CGA session takes about three hours of clinicians’ time, and it should be repeated every six months to be really efficient [1]. The CGA comprises three different types of activities: a clinical interview, a multidimensional assessment and a customized care plan. First, a clinical interview allows the patient and their relatives to discuss the elder health problems. Next, multidimensional clinical tests are performed to evaluate the overall patient status. Finally, clinical professionals can create a personalized care plan after taking into account the evidence gathered during the two previous phases and the patient’s evolution since the last CGA session. The multidimensional clinical tests include questionnaires (functional tests such as the Barthel one [2]), cognitive exercises (e.g., the Mini-Mental State Examination or MMSE  [3]), and motion analysis exercises (as the Get Up & Go test [4]). This important part of the CGA procedure could be automated, which has been considered by the European Union ECHORD++ (European Coordination Hub for Open Robotics Development) project as one of the initiatives to be covered within its Public end-user Driven Technological Innovation (PDTI) program (http://echord.eu/pdti/pdti-healthcare/).
CLARC (http://echord.eu/essential_grid/clark/) is an autonomous robotic solution designed to support CGA in hospitals and retirement homes [5,6,7]. It was designed by a multidisciplinary team including robotics and software engineers, medical doctors and physiotherapists from the Hospital Virgen del Rocio (Seville, Spain), and experts on user-centered design from the University of Troyes. Users were involved during each phase of the design and development of the system [8]. CLARC is currently able to perform several kinds of tests, but in this paper, it was used for performing a functional test (the Barthel one), and a motion analysis test (the Get Up & Go one). These tests include closed-answer questions (“Select one option: 1, 2, 3 or 4”), and monitoring of patient movements (“get up from the chair and walk three meters”). While deploying CLARC in larger evaluation pilots, its suitability with real patients in real-life hospital environments has already been demonstrated [5,6,7].
However, CLARC is not limited to just executing multidimensional tests. For instance, some kinds of tests are usually conducted at different rooms in the care centre. Therefore, CLARC is a mobile robot that must be able to guide patients and go to rooms when required, while avoiding static or dynamic obstacles. It must also be able to detect and adapt to exogenous events during the execution of a test, such as the patient asking for help or leaving the room. Moreover, and before conducting the tests, the CLARC robot will need to introduce itself as an accessible and helpful assistant (or, at least, tool). Last but not least, elderly people undergoing CGA procedures are usually not familiar at all with robotic technologies and, therefore, it will be also crucial for CLARC to make them feel comfortable and reassured, and to offer them natural and intuitive ways to interact. These described behaviors of CLARC comprise many requirements. Some of them are typical functional aspects (e.g., going to a room, avoiding an obstacle, conducting the tests) but other are non-functional aspects such as safety, performance, engagement or interaction, which are considered as key requirements for the validation of CLARC as a whole.
This paper describes a methodology for the integration of key non-functional requirements in CLARC that are monitored and verified during the robot operation, thus providing semantic information about the quality of its service. Instead of synthesizing valuable or expected results of these properties from records collected in the testing or deployment phases, our non-functional properties will be now modelled at design-time. This enables the specification of global Quality of Service (QoS) metrics defined in terms of the (internal and external) contextual information available in the the robot. We refer to QoS as a way to express non-functional properties in terms of their quantifiable (through the use of metrics) fulfillment. In addition to modeling these QoS metrics, the component in charge of providing them at run-time will be integrated in the CLARC software architecture. This so-called QoS metrics provider component is a probabilistic reasoner, which will compute a numeric estimation for each metric (e.g., a real value between 0 and 1, indicating its degree of fulfillment). In future work, these estimations could be used: (1) to determine how patients have performed or interacted with the robot during these tests, (2) as a benchmarking tool to decide the best algorithm to use in some cases (for instance, which speech recognition algorithm is better for a specific patient), and (3) to adapt the test to a particular patient (even at run-time) depending on how she has performed the test (time consumed, interaction mechanism use, etc.).
The rest of the paper is organized as follows: Section 2 introduces how the robot CLARC helps to automatize the multidimensional clinical testing in the CGA, and it also provides some details about the two tests considered in this work (Barthel and Get Up & Go). Section 3 describes the model designed to provide the QoS metrics for the CLARC scenario, including the probabilistic framework deployed for computing these metrics. The platform description and the software architecture in charge of controlling CLARC is presented in Section 4. This design is based on the cognitive software architecture CORTEX [9,10], which will be augmented with the software components in charge of providing the expected QoS metrics. Section 5 details and discusses the execution of several tests and how our framework is able to monitor the specified non-functional properties at run-time. Section 6 focuses on related work. Finally, Section 7 draws the main conclusions and future work.

2. Using CLARC for Automatizing a CGA Session

CLARC is waiting in the Charging Room and Jaime, an 85-year old patient is with Dr. Gálvez passing his evaluation. When Dr. Gálvez presses the Start button corresponding to the programmed CGA session for Jaime on his mobile phone, CLARC goes out of standby, navigates to the room where the patient is with the doctor, and looks for Jaime. It is the first time that Jaime is going to make a session with CLARC. This time the session will consist of a Barthel test. When CLARC sees Jaime, it greets him and presents itself. Before starting the test, CLARC proposes the patient to answer some simple questions to get Jaime familiar with the different interfaces of CLARC and learn to interact with it. At the same time CLARC evaluates if the patient is able to correctly use the interaction devices: whether the patient can hear, see what is written on the interface, and select the appropriate answer. After this CLARC explains to Jaime what the test will be about, and then, the test starts. After 10–15 min of efficient patient-CLARC interaction, the test ends. It is time to thank and say goodbye to Jaime. CLARC sends an internal message to Dr. Gálvez on his mobile phone, indicating that Jaime’s Barthel test results are stored on the CGAmed server, waiting for his validation.
This brief summary provides a global snapshot on how the CLARC robot helps a clinician when conducting a CGA test, in this case the Barthel one. The aim is that, meanwhile the robot is interviewing the patient, the doctor has time for addressing other tasks, such as meeting with the relative/s. In order to drive the test, CLARC is equipped with specific sensors and actuators and is endowed with a cognitive software architecture. Both issues will be covered in Section 4.1 and Section 4.2 respectively. It should be noted that CLARC is also included within a more global framework that provides the tools that, for instance, allow Dr. Gálvez to launch the test and to review all the vast amount of data (video files) associated with a session. This framework is responsible for connecting our system with the Clinical Data Management System (CDMS). More details can be found in [5].
As CLARC works with real patients in real-life hospital environments, it needs to be much more than a simple survey tool. Thus, it has to demonstrate its performance in terms of usefulness, usability and accessibility [11]. It needs to be a helpful tool for both patients and clinicians, taking into account that elderly people are usually not familiar at all with robotic technologies and that they must feel comfortable and reassured during the whole CGA procedure [8]. One solution for achieving this goal is that the robot can adapt at run-time the session to the preferences of the user. The first step is then to be able to capture some metrics related to these topics. In this paper, we have considered at design time some QoS metrics about performance and interaction of the patient with the system. Their run-time computation has been integrated in the software architecture of the robot and evaluated with real patients. The two tests considered in our experimental evaluation were the Barthel [2] and the Get Up & Go [4] ones. Next we provide some details about them:
  • The Barthel test. The Barthel test [2] is a heteroadministered test composed of 10 questions about daily life activities, following a Likert scale structure, where each situation is described. It usually lasts about 10–15 min. The test must be undertaken by the patient, but it is also conducted to relatives and/or caregivers. It can also be related to present or past conditions. CLARC is currently able to ask questions using natural interaction channels (i.e., voice output and text on screen). For each question, two, three or four possible answers can be chosen. The person can answer the questions either speaking, touching the option on the screen, or by using a specially designed remote control (Figure 1 (Right)). For each question, the patient has two opportunities to answer. If the patient has not answered after these two opportunities, it will advance to the next question.
  • The Get Up & Go test. In this test, the patient is asked to stand up from a chair, walk a short distance (around three meters) following a straight line, turn back, return to the chair and sit down. The goal is to measure balance, detecting deviations from a confident, normal performance. In its current implementation, the test has two main parts. In the first one, the patient is sitting next to CLARC to receive the instructions to correctly perform the test. In the second one, the patient is asked to go to the position where the test will be done, and the robot positions itself in a proper location to observe the complete motion. After that, the robot provides a signal to start the test. For a successful automation of the test, the robot needs to perceive the gait and to analyze balance and timing issues.

3. Modelling QoS Metrics for the CLARC Scenario

Non-functional properties relate to how a system performs rather than to what it does. Examples of non-functional properties include timing, dependability, safety or resource consumption, among others. In this paper, we will consider that a QoS metric expresses the degree of fulfilment of a non-functional property as a real number in the range [0,1]. In other words, a QoS metric will be a score of how well the system performs according to, e.g., safety. If the metric is 1, the system is optimal in terms of this property, while 0 indicates the opposite. Besides, this value can change as the behavior of the robot evolves during its operation.
In parallel to the work on CLARC, our team carried out the RoQME project (https://robmosys.eu/roqme) aimed at providing robotics software engineers with a model-driven framework to: (1) model system-level non-functional properties in terms of contextual information; and (2) generate runtime software artifacts to evaluate the specified properties as QoS metrics [12,13,14]. In RoQME, the modelling of QoS metrics involves three major concepts:
  • The non-functional properties relevant to the scenario. At run-time, the QoS metrics provider, whose code is generated from the models, will update the estimates (the value of the metrics) for those properties.
  • The context information available to the robot. The fulfilment of a property evolves over time according to the evidences collected by the robot from its context.
  • The observations, which are specific context patterns whose occurrence reinforces or undermines the fulfilment of non-functional properties.
The following three Sections describe the RoQME specification of the above elements to include QoS metrics in the CLARC scenario. Finally, Section 3.4 presents the probabilistic framework behind this specification.

3.1. Non-Functional Properties

The aim of CLARC is to perform CGA tests to elderly people. For measuring the degree to which the robot is successful in closing a test, we will define the Performance property. As aforementioned, the fulfilment of a property will range from 0 to 1. In the Barthel test, it is close to 1 if the patient remains sitting on the chair and answers all the robot’s questions on the first try. In the Get Up & Go test, a value close to 1 means that the patient correctly follows the robot’s commands and performs the required task, allowing the robot to score the test. On the other hand, values close to 0 indicate that the robot could not end the session. For example, the robot had to call the doctor because the patient got up from the chair during a Barthel test.
As will be introduced in the description of the experiments (see Section 5.2), we have a close collaboration with several medical institutions, where clinicians provide us with professional advice. In this sense, we were asked to customize how the robot interacts with a patient. For instance, if a patient always answers Barthel’s questions using the remote control, there is no point in waiting for a verbal response, therefore, the robot could disable voice interaction to speed up the test and improve the patient experience. For that, we introduce the VoiceInteractionQuality property, which evaluates the patient’s preference for verbal interaction against non-verbal (touch screen and remote control). A value close to 1 will result when verbal interaction is preferred. Moreover, it is also important to quickly detect when a patient is not interacting properly with the robot. We will consider the Interaction property, which expresses whether the patient is actively interacting with the robot in an efficient way. If so, a value close to 1 will be obtained, regardless of whether or not the patient follows the robot’s instructions (which is captured by Performance). Listing 1 shows the declaration of the non-functional properties specified for the scenario.
Listing 1: Non-functional properties for CLARC.
Applsci 10 06618 i001

3.2. Context Information

The evaluation of non-functional properties relies on the monitoring of (1) the scenario where the test is addressed (including the external factors, such as the behavior of the person interacting with CLARC) and (2) the information from the robot’s sensors (e.g., battery level).
Listing 2 shows the context variables for the scenario. BatteryLevel, TestState, PersonDetected and CallingDoctor are used in the Barthel and Get Up & Go tests. BatteryLevel indicates the remaining battery of the robot. The CLARC system provides a five-level quantification, which offers enough detail for our use case. PersonDetected represents whether the patient has been detected by the robot. TestState shows the current state of the test and CallingDoctor is an event fired when the patient presses the calling doctor button. It is worth noting that the REPEATING state is used only in the Get Up & Go test and indicates that the robot is repeating the instructions because the patient did not perform the test successfully. Regarding the contexts that only concern the Barthel test, the CLARC system provides information on whether a patient has answered a question on the first attempt (FirstAttemptAnsewerd = true), on the second attempt (FirstAttemptAnswered = false and SecondAttemptAnswered = true) or if the patient has not answered (FistAttemptAnswered = false and SecondAttemptAnswered = false). Finally, UserInteraction stores the interaction mechanism used by a patient to answer a question.
Scored, PersonIsNextToChair, PersonIsSeated and PersonGetsUp are contexts used in the Get Up & Go test. Scored indicates whether the evaluation of last task returns a score, whereas PersonGetsUp, PersonIsNextToChair and PersonIsSeated show if the patient is following the robot instructions. These contexts allow us to determine how well the patient is doing the test.
Listing 2: Definition of contexts.
Applsci 10 06618 i002

3.3. Observations

An observation provides contextual evidence that the robot is optimal (or not) in terms of a property. It is defined as a context pattern whose occurrence improves (reinforces) or worsens (undermines) the QoS estimate of a property, to some degree (very high, high, medium, low, very low). In addition, the language offers a wide range of event sequence operators and aggregate functions that allow users to express complex contextual patterns.
Listing 3 shows the observations specified for the CLARC scenario. We have captured fourteen observations that defines the relationship between contexts and non-functional properties. It is worth noting that we involved two experts (a physiotherapist and an engineer specialized in usability/accessibility of human-computer interfaces) to assist us in the modeling process.
An observation will be triggered when its context pattern becomes true. For example, the O2 observation acts when the patient has answered a Barthel question on the first attempt or the test is finished. In this case, O2 impacts on Performance by increasing (reinforcing) its estimate. Moreover, the observations related to Performance and Interaction can be activated during the Barthel or Get Up & Go test. However, observations O13 and O14 are triggered only during the Barthel test, as they establish which interaction mechanism the patient is using.
Listing 3: Observations for both tests.
Applsci 10 06618 i003

3.4. QoS Metrics

RoQME aims at providing a way to specify system-level non-functional properties at design-time, whose fulfilment is expressed as QoS metrics at runtime. The dynamic estimation of these metrics, in terms of the contextual information available, is solved through a probabilistic framework based on the use of Bayesian Networks [15].

3.4.1. Our Model as a Probabilistic Network

The specification defined in previous Sections for the CLARC scenario abstracts a probabilistic network, in which properties, such as Performance or Interaction, are represented by hidden Boolean variables. Therefore, a property has two possible states, i.e., the system may or may not be optimal in terms of the property, which cannot be observed directly, but rather what one has is the belief of being in a particular state based on observable evidence. The runtime quantification of this belief results in the corresponding QoS metric values. For example, a resulting value of 0.67 for Performance can be understood as the probability of the robot being optimal in terms of this property. On the other hand, observations are evidence Boolean variables given that a contextual situation may or may not occur but it can be perceived. These variables exhibit a direct probabilistic dependence with one or more hidden variables.
Figure 2 (left) illustrates the Bayesian Network associated with Performance—other properties in our model will produce similar networks. The graph shows the causal interactions (arcs) among a set of variables (nodes). Any pair of unconnected nodes indicates (conditional) independence between variables. So that, an observation is a variable that depends on a property. In other words, the probability of the occurrence of an observation (i.e., observation = true) depends on whether the system is optimal in terms of the property (property = true) or not (property = false). In addition, although the concept of time is not an inherent characteristic of Bayesian Networks, we have considered a continuous-time Markov chain [15] to manage the internal dynamics of each observation (Figure 2 (Right) shows the transition graph). This allows properties to evolve over time according to the sequence of past observations. Further details will be provided in the following Section.

3.4.2. Deriving Probabilities

In order to complete the probabilistic network, we need to define the probabilities associated with the variables. It should be noted that probabilities will be derived transparently from the high-level descriptions provided in the previous Sections, which means that users do not have to deal with this complexity and can focus on the application of their QoS metrics.
The “observation” sentences in the model allows users to establish dependencies on properties, whose quantification is expressed as P ( O b s e r v a t i o n | P r o p e r t y ) .
observation NAME: (PATTERN EXPRESSION) [survival T]
     (reinforces | undermines) Property [VERY_HIGH | HIGH | LOW | VERY_LOW]
We obtain this probability by assuming that the intensity of an observation (VERY_HIGH, HIGH, etc.) indicates the Likelihood Ratio (LR). See its definition in Equation (1). Table 1 maps the all intensity values with the corresponding LR. Although other assignments are possible, this one has been shown to be effective in our experiments.
L R = P ( O b s e r v a t i o n = t r u e | P r o p e r t y = f a l s e ) P ( O b s e r v a t i o n = t r u e | P r o p e r t y = t r u e )
Operating on Equation (2), and assuming P ( P r o p e r t y ) and P ( O b s e r v a t i o n ) equal to 0.5, we can obtain Equations (3) and (4), which allows us to calculate the conditional probabilities based on LR. Although we could choose a more elaborate method to initialize the a priori probabilities, the above assumption is a simplification that seems to make sense. For example, in this case, when there is no evidence, the belief of being optimal in terms of a property is reduced to 0.5, which expresses maximum uncertainty. Therefore, 0.5 will be the baseline value for QoS metrics.
P ( O b s e r v a t i o n = t r u e ) = P ( O b s e r v a t i o n = t r u e | P r o p e r t y = t r u e ) P ( P r o p e r t y = t r u e ) + + P ( O b s e r v a t i o n = t r u e | P r o p e r t y = f a l s e ) P ( P r o p e r t y = f a l s e )
P ( O b s e r v a t i o n = t r u e | P r o p e r t y = t r u e ) = 1 1 + L R
P ( O b s e r v a t i o n = t r u e | P r o p e r t y = f a l s e ) = L R 1 + L R
As mentioned in Section 3.4.1, we will consider a continuous-time Markov chain to describe the internal dynamics of the observations. When declaring an observation, we can use the option “survival” to specify its average survival time in seconds (denoted as T). Observations gradually lose their significance as time passes, so this parameter configures how long the effect of an observation will last on the estimation of a property. For instance, consider the observation O9 in Listing 3, it undermines Interaction when the calling-the-doctor button is pressed. As soon as the patient presses the button, the urgency is maximum, but as time passes the effect weakens until it eventually disappears. It does not seem very important that a patient pressed the button weeks ago. For the CLARC scenario, we have set the default value of T to 100 min. This value has been chosen to maintain the importance of the observations throughout the test, stabilizing the QoS metrics and making them more robust to the time differences between patients.
The transition graph shown in Figure 2 (right) describes how the state of an observation variable evolves over time. Considering that an observation can be in two states: true, if it is active, or false, when it is not, we can describe the transition rates between states as λ (from true to false) and μ (from false to true). Expression (5) is the resulting transition rate matrix (Q), where μ =0 since the effect of an observation always fades, as we have already mentioned above.
Q = λ λ μ μ
Finally, the conditional probability of an observation after a period t from its activation ( P t ( O b s e r v a t i o n | P r o p e r t y ) ) can be determined from Q with the Kolmogorov forward equation, whose particular solution for our problem is shown in Equation (6). The parameter λ can be calculated using this result by considering the survival value T and setting the probability P T ( O b s e r v a t i o n = t r u e | P r o p e r t y = t r u e ) , see Equation (7).
P t ( O b s e r v a t i o n = t r u e | P r o p e r t y ) = P ( O b s e r v a t i o n = t r u e | P r o p e r t y ) 1 2 · e 2 λ t + 1 2 i f ( P ( O b s e r v a t i o n = t r u e | P r o p e r t y ) < 0.5 ) 1 2 ( 1 2 P ( O b s e r v a t i o n = t r u e | P r o p e r t y ) ) · e 2 λ t ( o t h e r w i s e )
λ = 1 2 T l o g P T ( O b s e r v a t i o n = t r u e | P r o p e r t y = t r u e ) 1 2 P ( O b s e r v a t i o n = t r u e | P r o p e r t y = t r u e ) 1 2

4. Implementation

4.1. Platform Description

Figure 1 and Figure 3a show the external aspect of the first version of the CLARC robot. Internally, the robot is built over the MetraLabs SCITOS G3 platform (http://www.metralabs.com/en/). This base is fitted with a LIDAR sensor for localization, navigation and obstacle avoidance. The robot’s locomotion is based on a differential drive system consisting of two powered wheels and a caster wheel for stability. This enables the robot to rotate on the spot and drive at a speed of up to 1 m/s, if necessary. The platform contains a 40 Ah lithium battery which allows for up to 18 h of autonomous operation, and can be recharged fully within 4 h. A safety bumper socket sensor is used to prevent the robot from exerting force against animate or inanimate objects.
For solving the use cases involved in the current scenario, CLARC has been equipped with additional sensors and interfaces for human-robot interaction. Thus, the robot is equipped with a Microsoft Kinect V2 sensor, a shotgun microphone, a touch screen, speakers, and a web-cam for recording the sessions. The touch screen located in the torso of the robot includes tactile buttons for allowing the patient to pause/restart the session or to call the doctor. There are also buttons for controlling the audio volume. Looking at Figure 3a, we can note that all the devices needed for providing interaction or recording abilities are mounted over the external chassis of the robot. The major disadvantage of this scheme is the fragility of the coupling of these devices on the chassis. A minor hit can provoke an unexpected turn of the device, being the consequence that the microphone does not allow now to hear the patient or that the IP camera is not recording the session. With the aim of providing a more robust coupling of these devices on the robot’s structure, the chassis of CLARC was redesigned. The aims were (i) to include the web-cam and IP camera inside the head of the robot (the small monitor providing the ‘face’ of CLARC was then removed) and (ii) to attach the microphone to the chassis, locating it over the Kinect sensor. The disposition of the two cameras within the head and their fields of view are shown in Figure 4.
The robot is also fully connected to an external device equipped with large buttons for facilitating the interaction with the elderly people. Figure 1 (Right) and Figure 3b show two different versions of this external device. The one in Figure 1 (Right) includes a tactile touchscreen, allowing the user to complete Barthel test and also cognitive tests such as the MMSE one [5]. The device in Figure 3b is a lighter version, which can be used for performing the Barthel test. Both devices include buttons for controlling the audio volume and also for calling the doctor.

4.2. Software Architecture

CLARC is a social assistive robotic platform which has to deal with complex tasks in its everyday work. In these scenarios, cognitive architectures for robotics try to provide a reasonable structure where all the functionalities of the robot can be adapted. Specifically, the CLARC robot is endowed with the CORTEX cognitive architecture. Briefly, CORTEX can be described as a collection of agents that interact and cooperate to achieve a global goal using the so-called Deep State Representation (DSR) data structure [9,10]. The DSR is a short-term, graph-based dynamic representation of the space surrounding the robot, the objects and humans in it, and the robot itself. All these entities are perceived and internalized in the DSR by transforming them into different levels of abstraction, ranging from the raw data provided by the sensors to high-level symbolic relationships. Contrary to approaches like KnowRob [16], where symbolic facts are evaluated when needed, the DSR is cooperatively built and kept updated by all the agents. They are continuously running in the background, computing and asserting the knowledge representation. Moreover, agents are not hierarchically organized as in the 3T-based architectures [17]. In CORTEX, agents can be anywhere in the reactive-deliberative spectrum, but each of them is in charge of a basic robotic functionality affecting a specific domain.
Figure 5 shows an overview of the instantiation of the CORTEX architecture in CLARC. Surrounding the representation provided by the DSR there are nine agents marked as grey-coloured boxes: PELEA, Speech, Panel, Remote Control, CogniDrive, Recorder, HMC, Person and QoS Metric Provider. Internally, agents are implemented as a network of software components. Some of these components are perceptive ones, which transform sensor information into internal representations. Other components are actuators, which activate the robot end-effectors. Further components are planners, which compute the plans needed to meet a goal or a desired behaviour. Sensors and actuators in CLARC are marked as yellow-coloured boxes in the figure, linked to the agents in charge of their management. For continuously capturing all the information of the Kinect V2 sensor, the architecture includes an additional software component, the WinKinectComp. This component provides a stream of information (e.g., human faces and skeletons) to the HMC and Person agents.
Next Sections provide a more detailed description of the DSR and of the QoS Metric Provider agent. The rest of agents are only briefly introduced in Section 4.2.2.

4.2.1. The Deep State Representation (DSR)

The Deep State Representation (DSR) is a multi-labeled directed graph that holds symbolic and geometric information within a shared data structure. Symbolic tokens are stated as logic attributes related with predicates that are stored in nodes and edges within the graph, respectively. Geometric information is stored as predefined object types linked by 4 × 4 homogeneous matrices. Again, they are respectively stored as nodes and edges of the graph. Figure 6 shows a reduced view of the state associated with the execution of a Barthel test. The person and robot nodes are geometrical entities, both linked to the world (a specific anchor providing the origin of coordinates) by a rigid transformation. But, at the same time that we can compute the geometrical relationship between both nodes ( R T 1 × R T ), the person can be located (is_with) close to the robot. Furthermore, an agent can annotate that currently the robot is speaking. More details about the DSR can be found in Marfil et al. [10].
The information available in the DSR will provide the context background that the QoS metrics provider needs. In the reduced view on Figure 6, we can see four of the context items associated to a Barthel test (for instance, the Battery level is LOW and the person used the TOUCHSCREEN for the last response). As described in Section 4.2.3, a specific module will bridge the gap between the DSR and a complex event detector module.

4.2.2. Software Agents in CLARC

The PELEA agent is an instantiation of the Planning, Learning and Execution Architecture (PELEA) [18], which is in charge of providing the deliberative skills to the architecture. The Recorder agent manages an IP camera, which provides a stream of video for online supervision and also records the session for offline visualization.
The different channels for patient-robot interaction are provided by the Speech, Panel and Remote Control agents. The Speech agent is in charge of generating the voice of CLARC from text using the Text-To-Speech (TTS) software provided by Microsoft Speech Platform SDK. This software is also used to recognize the answers of the patient with the help of specific grammars that are loaded for each question, in order to maximize recognition rates. The robot is currently able to interact with patients in French, English or Spanish. The verbal channel is enhanced by using a touchscreen on the torso of the robot [19]. The Panel agent manages the tactile interaction and the information shown in this touchscreen, which has been carefully designed for dealing with elderly people [20,21]. The intense use of this quasi-vertical touchscreen forces the patient to adopt an uncomfortable position, not only because of keeping the arm extended, but also because the robot cannot be so close to the patient to avoid that s/he is continually approaching/moving away from the screen to touch it. Therefore, and in order to avoid this problem, we added a third element to the interface: an external device with large buttons (see Figure 3b) for answering the typical questions in a Barthel test, which is managed by the Remote Control agent.
All navigation and localisation are provided by the CogniDrive software running over the MIRA middleware (http://www.mira-project.org/joomla-mira/). The CogniDrive agent implements a bridge for connecting these software modules to our cognitive architecture.
The Person agent is in charge of detecting and tracking the people in the environment of the robot. But this information is not sufficient for the Get Up & Go test. In this test, we need to capture and process the motion of the full body joints of the patient. The HMC agent implements a framework able to describe and evaluate human motion. The framework is based on parametric segmentation and evaluation of action primitives, requiring the complete gait to be perceived before evaluating it. Once the gait is captured the analytic nature of the algorithm allows producing fast responses. It has been successfully used for the autonomous evaluation of human gait in the Get Up & Go test (see [7] for further details). The Person and the HMC agents are connected to the WinKinectComp module. This module is in charge of capturing the preprocessed data provided by a Kinect sensor v2 (i.e., joints and face of the person).
Details about the QoS Metrics Provider agent are given in the next subsection.

4.2.3. The QoS Metrics Provider Agent

The QoS Metrics Provider agent computes the QoS metrics explained in Section 3 using the context information monitored from the DSR. As Figure 7 shows, this contextual information will be sequentially processed by four modules:
  • The Context Monitor module reads the contextual data from the DSR and sends contexts to the Complex Event Processor (e.g., changes in the battery level).
  • The Context Event Processor module searches for event patterns that were specified in the model (Listing 3). If there is a match, it will produce observations (e.g., battery is draining too fast) that will be sent to the Probabilistic Reasoner. Specifically, this Complex Event Processor: (1) supports the creation of derived context variables, i.e, if a user defines a derived context, the Complex Event Processor comes into play to calculate its value each time the primitive contexts on which it depends are updated; (2) evaluates observations as event-typed expressions, which produces an event whenever the pattern is satisfied; and (3) allows the computation of aggregate functions, such as, sum, average, maximum and minimum and the use of timers.
  • The Probabilistic Reasoner module implements the mathematics described in Section 3. It reinforces or undermines the properties according to the observation definitions available with the model. As stated before, it computes a numeric estimation for each metric (i.e., the degree of fulfillment of each non-functional property) returning a value between 0 and 1.
  • The QoS metric server module reads estimations sent by the probabilistic reasoner and forwards them to any external software in charge of interpreting these estimations (e.g., for benchmarking or for robot’s self-adaptation, among others).

5. Experimental Evaluation

The runtime updating of the QoS metrics is based on the detection of certain context patterns (observations). These patterns and their influence on the metrics must be captured in advance from experts. In our case, an initial list of observations was defined with the help of one physiotherapist and one software engineer with a large experience on usability/accessibility of human-computer interfaces. Both researchers were involved in the CLARC project from the first phase. For evaluating this initial model, a test-bench was designed. This test-bench consists of several completed tests, where the human responses are simulated. Thus, executing one of these tests using the same model will generate the same metrics. The possibility of repeating these tests until the experts agree with the evolution of the obtained QoS metrics allowed us to tune the list of observations. Section 5.1 describes the test-bench and the final QoS metrics obtained from their execution. The observations in Listing 3 are the result of this tuning procedure. They were then employed in the tests conducted to real patients described in Section 5.2.

5.1. Preliminary Experiments

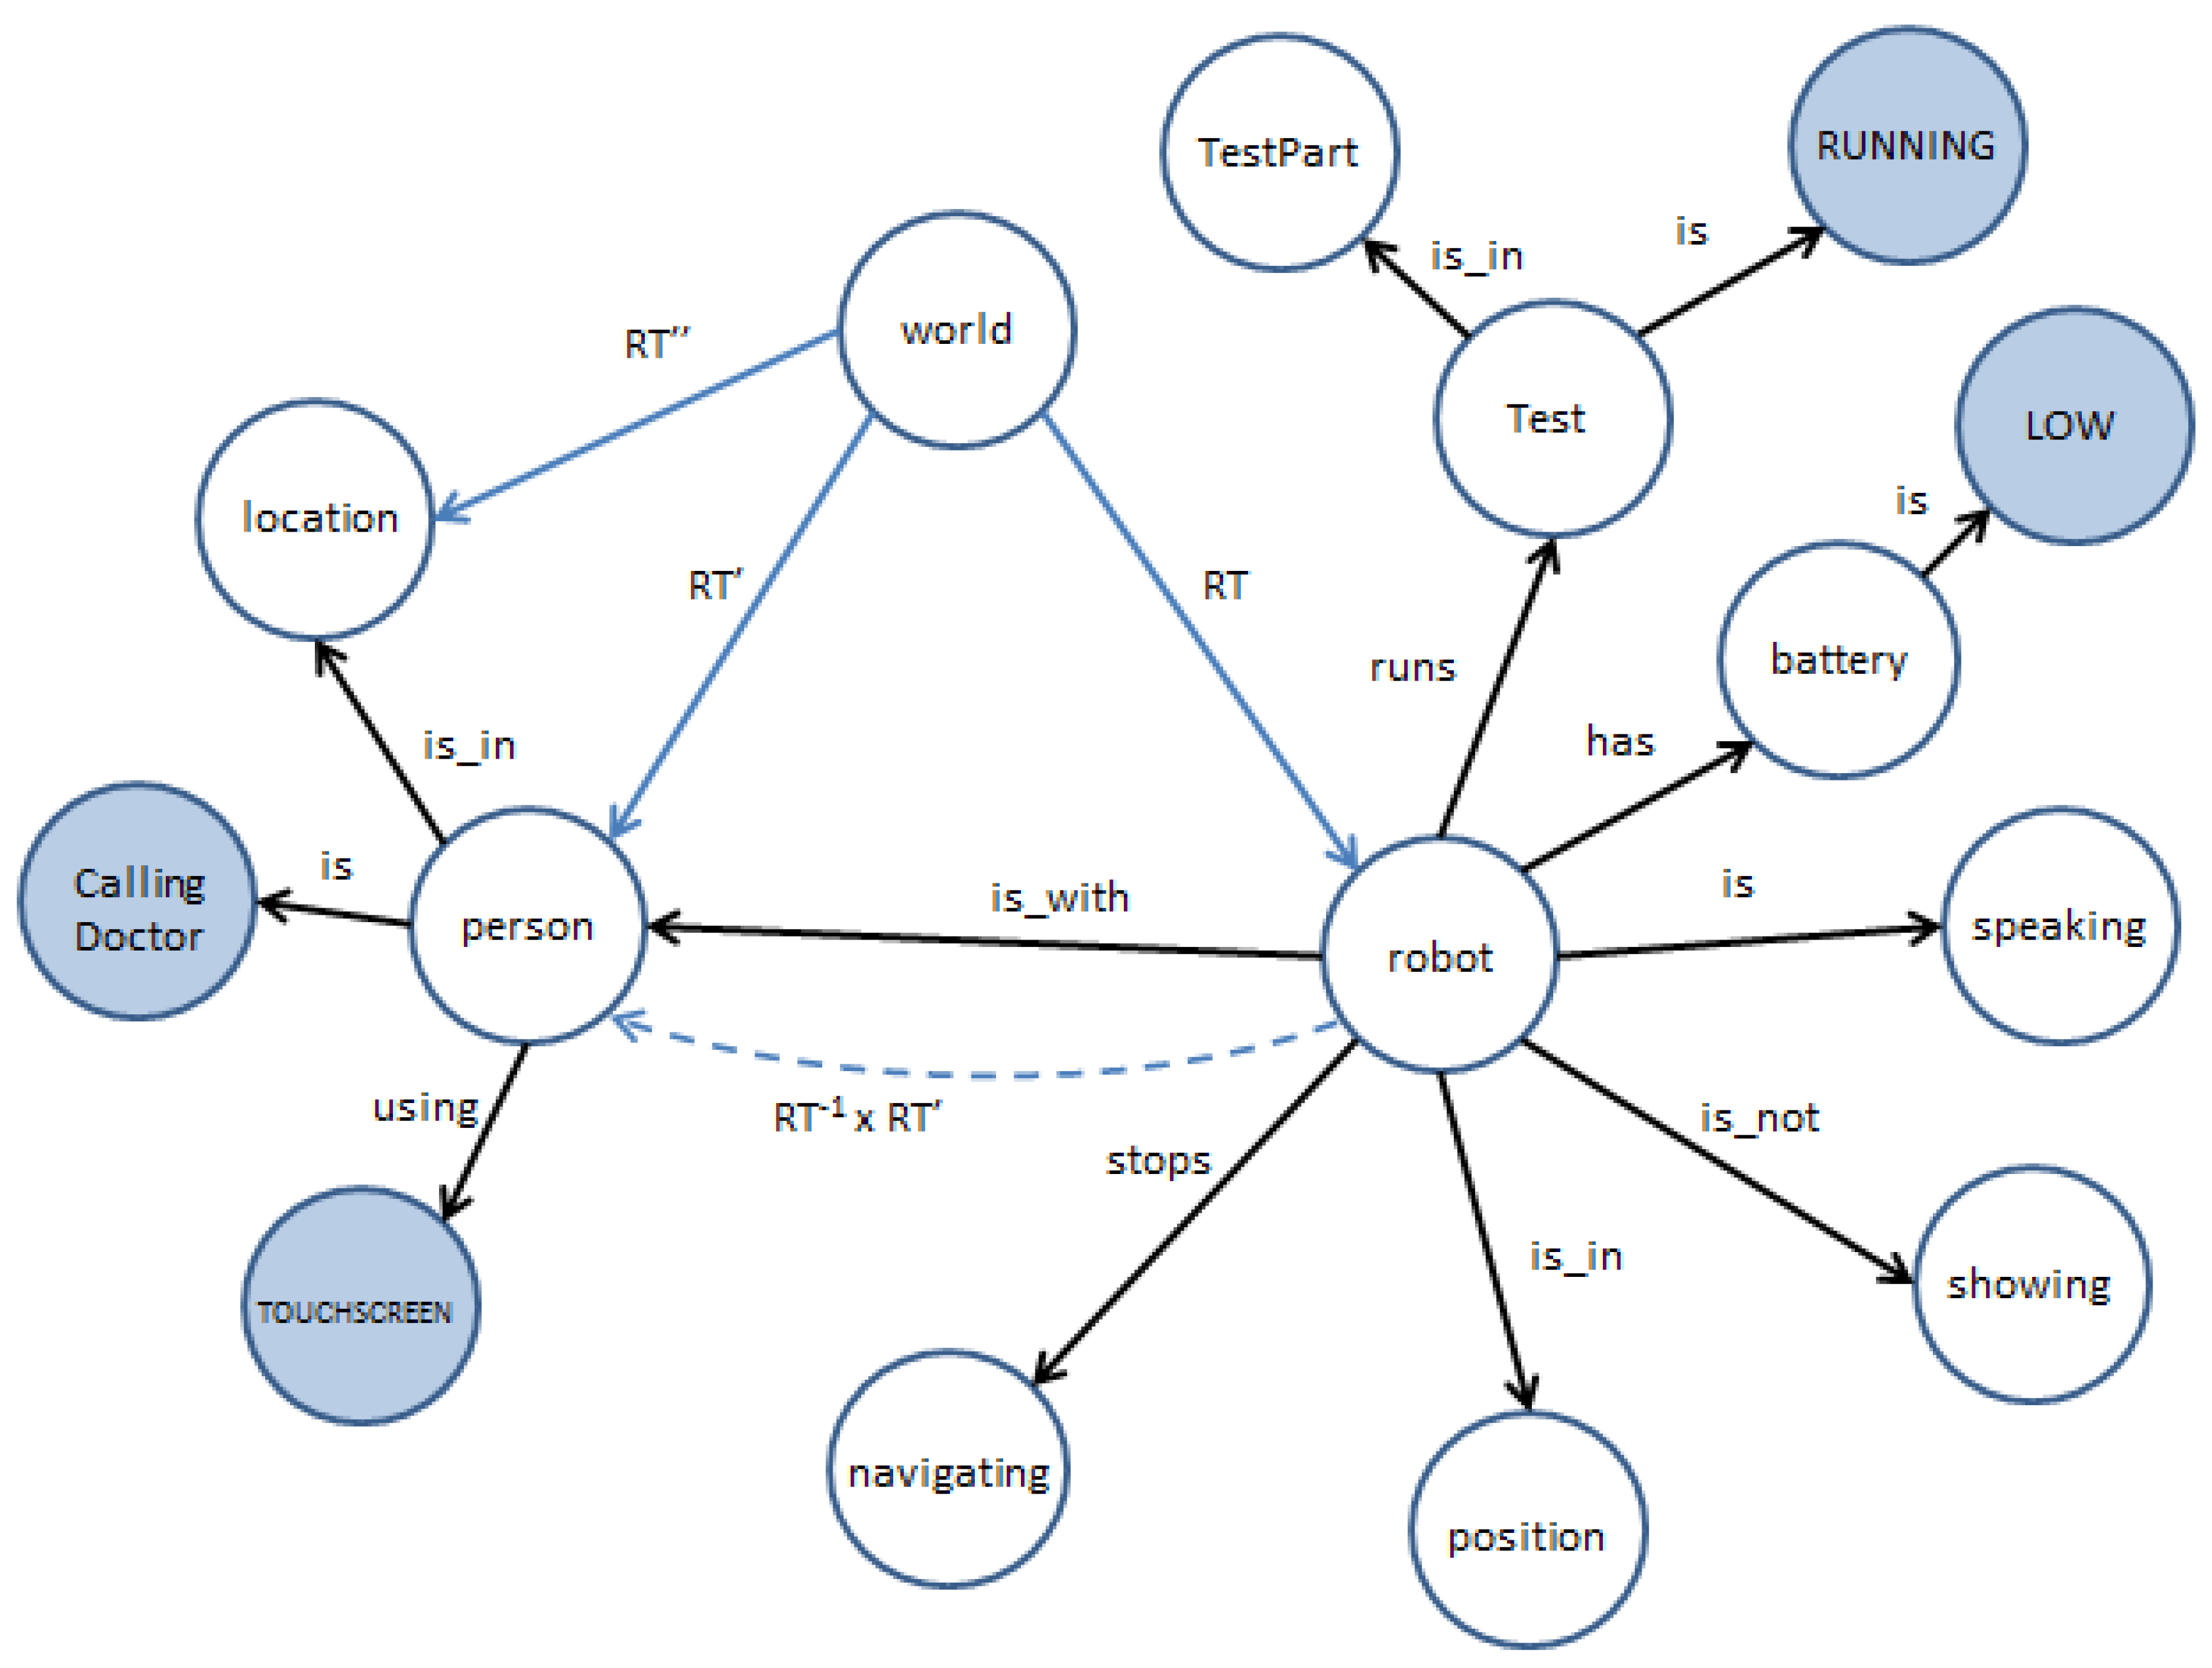
In order to test the QoS metrics provider agent and the model describing non-functional properties, we have created a test-bench consisting of six and nine executions of Barthel and Get Up & Go tests, respectively. As aforementioned, these tests were artificially created, being the responses of the human to the questions, or to commands emanated from the robot, entered by hand. These closed tests have been designed taking into account the most common scenarios that we found during the execution of real Barthel or Get Up & Go tests, and they cover situations that affect the non-functional properties defined in this paper. As aforementioned, this test-bench allows us to intensively validate the correct response of the whole framework.
The relevant features of the Barthel tests included in the test-bench are depicted in Table 2. The test-bench allows us to monitor the evolution of the properties defined in Listing 1 simulating that the patient answers each one of the questions using voice (VR), the Remote Control device (RC), or the touch screen (TS). We include situations where the patient answers in the first attempt (1st), in the second attempt (2nd), or just does not answer a question (QNA). We have also included situations where the patient presses the pause button or calls the doctor. In both cases we consider that the session is posteriorly restarted (PR and CDR, respectively). Finally, we also consider spurious failures on the detection of the person (NPD).
The properties to monitor when running a Barthel test are Performance, Interaction and VoiceInteractionQuality. After choosing a final list of observations, Table 3 details the statistical features of these properties when running the six Barthel tests in Table 2. As statistical features we choose the minimum (min), maximum (max), average (avg), standard deviation (sd) and the final value of the property when the test is finished (last). It is worth noting that all the properties have a default value of 0.5 if they were not initialized explicitly (see Listing 1). In Barthel #1 test, where the simulated user always answered in the first attempt using the verbal channel, results show how the reference value for each property increase up to a maximum (and last) value of 0,98 (Performance) and 1 (Interaction and VoiceInteractionQuality), the average value is also very high, around 0.8. This clearly demonstrates to the decision making agent in the software architecture that the test is going well and that the patient is proactively interacting with the robot. Moreover, this agent could also appreciate that this user prefers the verbal channel for interaction. On the other hand, in Barthel #2 (third column, Table 2), simulated answers were always captured using the touch screen on the torso of the robot or the remote control. In this case, we can note the significant difference on the VoiceInteractionQuality property. It starts with a reference value of 0.5 which, during the test, decreases until 0.0 (last value). The robot correctly captured the responses to the questionnaire and the patient-robot interaction was fluent. But the VoiceInteractionQuality metric shows that this user prefers to not use the verbal channel.
Barthel #3 (fourth column, Table 2) shows a scenario where the user answers all the questions, but in the second attempt and using the touch screen interface. The behaviour of the VoiceInteractionQuality property is similar to the one obtained in Barthel #2 (meaning that a non-verbal channel for interaction is preferred). However, the last values of the Performance and Interaction metrics are less than 0.18. This can be interpreted as correct: the robot must repeat all questions to the patient for capturing a response, and the patient-robot interaction was not fluent. Barthel #4, #5 and #6 (fifth-seventh columns, Table 2) incorporate new situations, such as questions not answered (QNA), patients suddenly undetected (NPD), calls to the doctor (CDR) and patients that pause the test (PR). We also emulate the scenario where patients sometimes answer in the first attempt but, in other cases, they answer in the second attempt. For example, in Barthel #4, the average and last values of the Performance metric are similar to the ones obtained in the execution of the Barthel #3. However, the standard deviation of this metric in the execution of the Barthel #4 is greater. The reason is that the patient in Barthel #4 sometimes answers in the first attempt and sometimes in the second attempt (or does not answer). All these situations have an impact on the evolution of the Performance property. Significantly, the fact that the simulated patient in Barthel #4 answered four of the questions in the first attempt provokes that the Interaction metric provides an average value of 0.61. This value is greater than the one obtained for the patient that run the Barthel #3. But it is a low value. Sometimes the patient answered fluently, and sometimes she needed a second attempt or did not provide an answer. The metrics associated to the execution of the Barthel #5 and #6 are affected by the multitude of uncommon situations included in both executions. In the execution of the Barthel #5, the simulation includes one call to the doctor and two pauses on the session. The result is a very poor Performance (these situations implied that the robot was not able to perform the complete test by itself). However, having a look to the evolution of Barthel #5 (sixth column, Table 2) we can infer that, after receiving help by the doctor (question 6), the human-robot interaction was fluent. The final Interaction value is therefore high (0.94), correctly capturing this fact. Finally, Barthel #6 shows the typical response when the robot deals with a patient that is really uncomfortable in the interaction with the robot.
As the QoS metrics are being continuously monitored, it is important to analyse their evolution over time. Table 4 (Right) depicts how the Performance, Interaction and VoiceInteractionQuality metrics evolve during the execution of the test Barthel #4. Table 4 (Left) summarizes the observations detected by the Complex Event Processor, linked to the instant of time on which they were generated, and to the context stored in the DSR. With respect to Table 2, we can note the presence of two new context values in the Table 4 (Left): PD indicates that the person is detected and the session can start; and FINISHED states that the 10 questions were captured and the session can end. For instance, ten seconds after starting the test the PersonDetected (PD) context is annotated by the Person agent in the DSR, firing the observations two and eight (O2:O8). Both observations reinforce Performance and Interaction (as defined in Listing 3). Then, about two minutes later (t = 135 s), the user answered the first question of the Barthel test in the first attempt using the voice recognition system (fifth column, Table 2). These contexts fire the O13, O2, and O7 observations, increasing the three QoS properties. Observations that decrease these properties are, for instance, O6, O11 that are fired when the patient does not answer the question in the first attempt (t = 205 s), or O5 and O10 in the case the patient does not answer the question after the two attempts (t = 340 s).
Regarding the Get Up & Go test, we have added to the test-bench nine simulated tests. Table 5 provides a brief description of each test. It can be seen that they consider different execution alternatives, such as the Person agent losing the patient for a few seconds, or the patient calling the doctor during the visual presentation of how she must perform the test.
For the Get Up & Go test, the framework only computes two metrics: Performance and Interaction. It is worth noting that the VoiceInteractionQuality is not used in this test because the user does not have to answer any question. Statistical features of the obtained metrics when we execute the nine tests are illustrated in Table 6. Specifically, the table shows the minimum (min), maximum (max), and the final value (last) of the two properties. In contrast to Barthel tests, we have not considered the average and deviation values. The reason for discarding them is that, contrary to the Barthel test where the robot maintains the control over the time slots for answering a question, in the Get Up & Go test, the time is controlled by the patient. That is, a patient has a maximum time of 300 s to perform all the movements on the Get Up & Go test, i.e., sitting on the chair, getting up, walking and sitting on the chair again. But, within this interval of time, she will decide for instance when she sits on or gets up off the chair. As the observations are typically generated in the transition between two actions, the metrics can maintain their values during a few seconds. The result is that the metrics associated with two correctly executed tests can present very different average and deviation features. As the minimum, maximum and last values are not affected by the test duration or the temporal distance between consecutive performed actions, they can be used for characterizing the Performance and Interaction metrics.
As Table 5 shows, the first Get Up & Go test was successfully performed. Hence, both metrics only growed with time. We can note that the minimum value for Performance and Interaction is 0.5 (the initial reference value), whereas the maximum value is the same as the final value. In this test, Performance and Interaction increased their values during the test execution until reaching 0.9987 and 0.9857 respectively. This means that the session was successfully addressed and that the patient correctly responded to the commands from the robot. The second Get Up & Go test is similar to the first one. However, the robot lost the patient for a few seconds at the beginning of the test. As a result, Performance and Interaction decreased their values falling below 0.5. The maximum and final values are also close to 1.0, meaning that the patient successfully finished the test and correctly interpreted the commands from the robot.
In the Get Up & Go #3 the robot also lost the patient at the beginning of the session (!PersonDetected). Moreover, when detected, she did not stay next to the chair in a first attempt (!PersonIsNextToChair). The robot was forced to repeat the instructions. This decreased the Performance and Interaction metrics, but, as the test was correctly executed, the final values are close to 1.0. As expected (the commands from the robot were not correctly understood for the first attempt), the last value of the Interaction metric is lower than the last value of the Performance one. The same initial situations were simulated for the Get Up & Go #4. However, in this case, the patient does not stay next to the chair in the last attempt. This implies a severe penalty in the Performance and Interaction metrics since the robot was forced to repeat the instructions and wait for the patient. As it is described in Table 5, the test ends before the robot can assess the test. This provokes very final values for the Performance and Interaction metrics. In the test Get Up & Go #5 the patient performed the test after not following correctly the robot instructions (she sat down on the chair in the second attempt). That implies that the robot had to repeat instructions and, therefore, there was a penalty for the Performance and Interaction metrics. As was the case for the execution of the Get Up & Go #3, this situation affected a little more to the Interaction metric.
Get Up & Go #6 and #7 describe two examples where the system does not return a score. This may be caused by a problem related to the tracking system (Person agent) or, as it occurred in these two cases, when the patient has not completed one of the actions asked by the CLARC robot. Finally, tests #8 and #9 are similar. The difference lies in the button pressed by the patient. While in the execution of the Get Up & Go #8 the patient pressed the pause button, in the test #9 the patient pressed the CallingDoctor button. In the first case, the patient restarted the test using the resume button. However, in the test #9, it was the doctor who pressed the continue button.
Table 7 shows the response of the framework (context, observations and metrics) during the execution of the Get Up & Go #9. In this example, after visualizing the introductory video (t = 120 s), the patient called the doctor for help. This decreased the Performance and Interaction metrics because of the observations five (O5) and nine (O9) generated by the Complex Event Processor. We can assume that, after describing the test to the patient, the doctor pressed the continue button (RESTARTED). This action (t = 140 s) triggered observations that increase both metrics. For the rest of the test, the patient followed the robot instructions (as detailed in Table 5). Thus, the generated observations increased the Performance and Interaction metrics until reaching values close to 1.0 for the end of the test.

5.2. Experiments in Real Scenarios

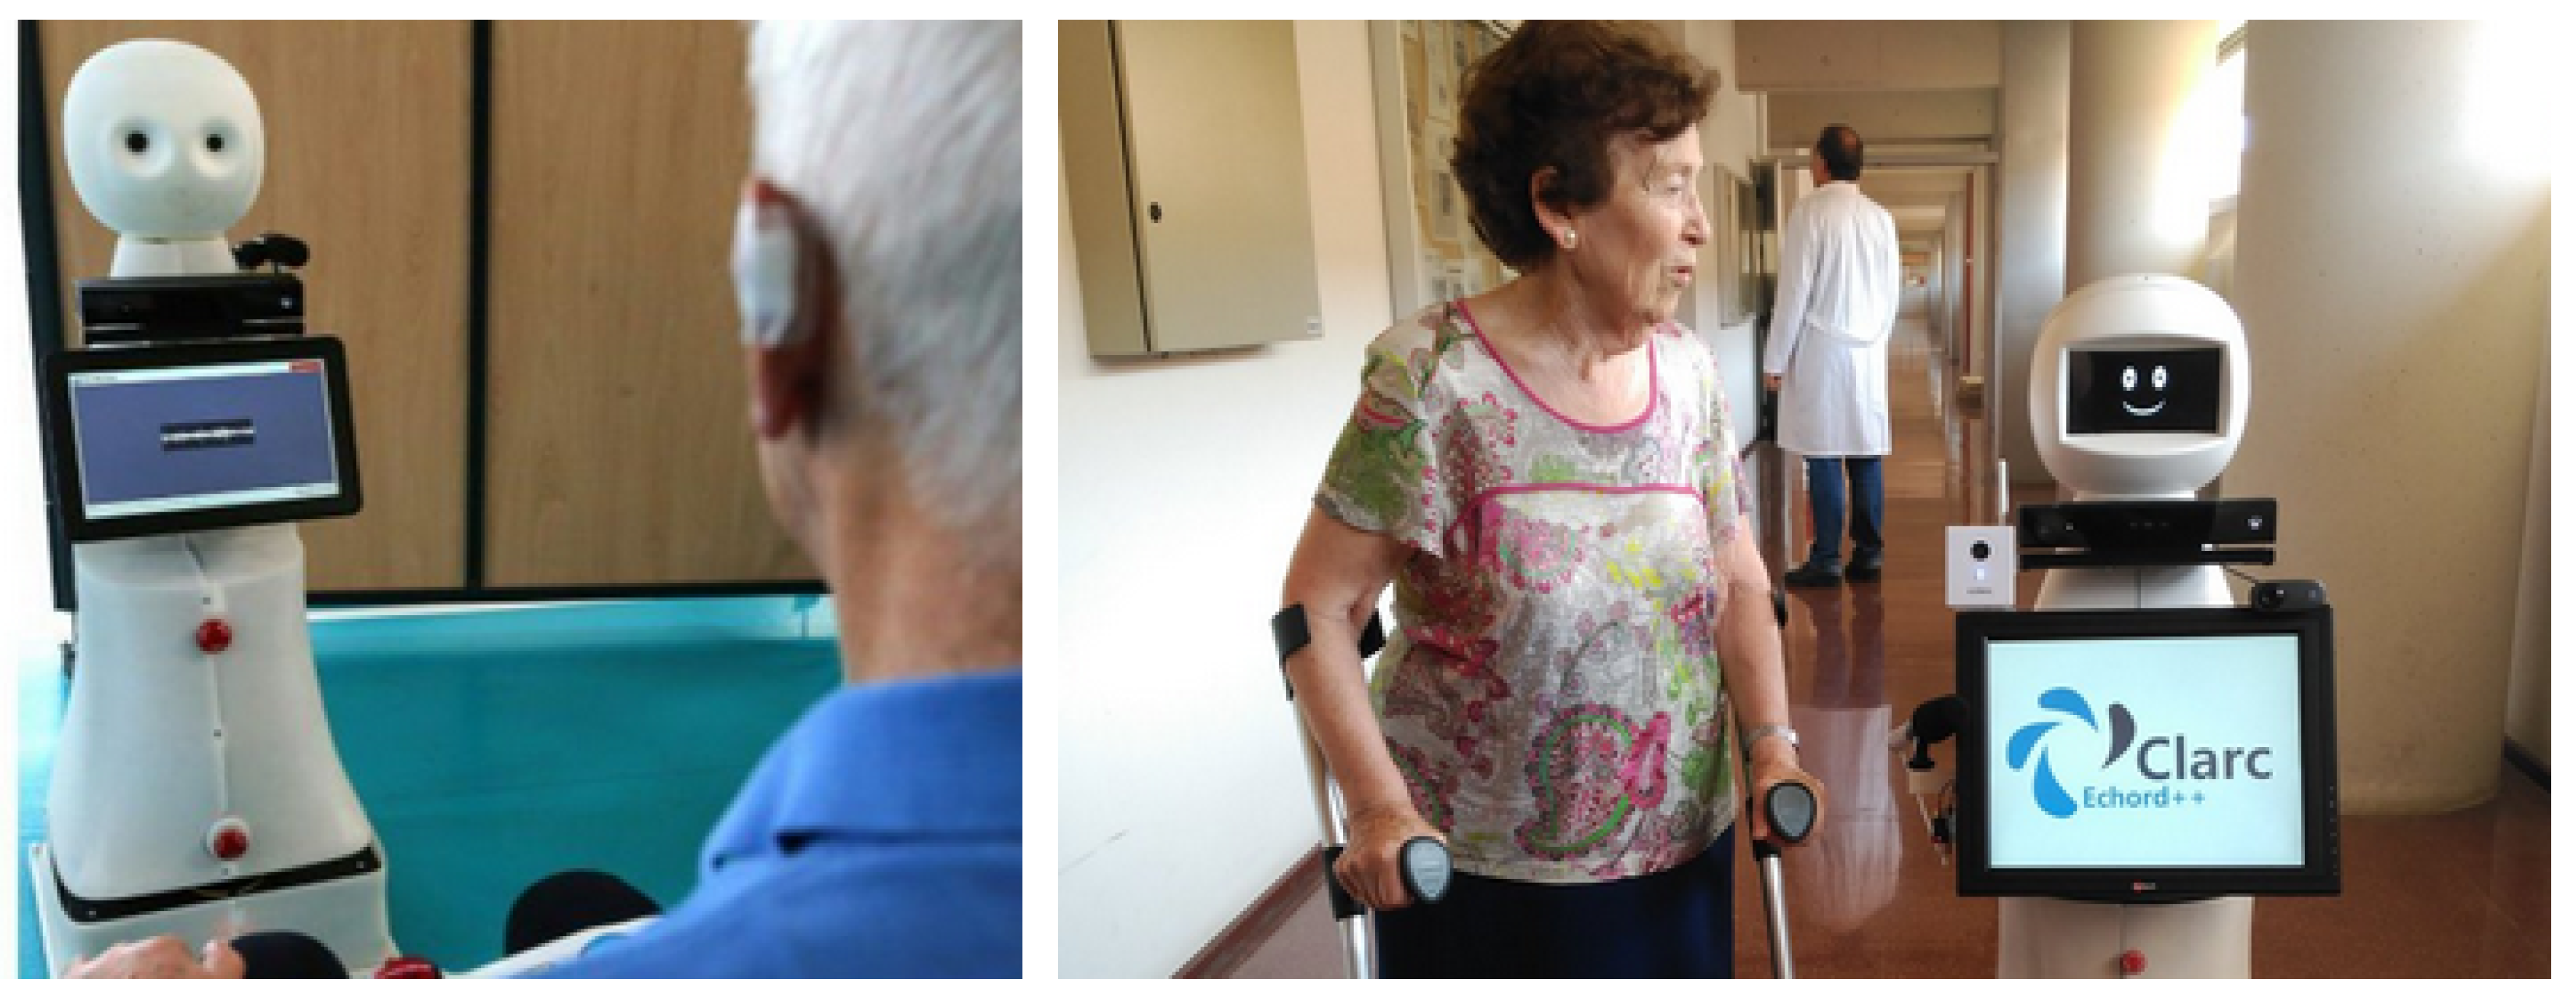
In the consortium of the CLARC project, there are two research groups that are very close to end-users. One of them is a research group of the Hospital Virgen del Rocio of Seville (Spain), and the other one is from the University of Troyes (France), which has strong links with the Hospital of Reims (France). Thus, from January 2019 to March 2019, a CLARC robot (in its final version) was deployed at the Hospital of Reims (see Figure 8 (left)) and two others (first versions of CLARC) at the Hospital Virgen del Rocio (see Figure 8 (right)). The one at Reims worked in the geriatric unit, but those in Seville were tested in several care centres. Several complete test executions were recorded in both scenarios and deeply analyzed. The experimental evaluation on this Section is built using 22 Barthel tests and 13 Get Up & Go tests.
Table 8 details the Barthel tests performed with real patients. Each column provides the patient’s response to each question on the test. As in the previous Section, we detail how patients answered each question: if they used the remote control (RC), the touch screen (TS) or the voice interface (VR), and if they answered in the first (1st) or second (2nd) attempt (or did not answer (QNA)). We can also know if they pressed the pause/restart buttons (PR) or the calling doctor/restart buttons (CDR), or if they were undetected for a while (NPD). We are grouped in the same row of the table the patients that completed the test exhibiting the same behaviour. For instance, patients #3, #5, #7, #17, and #22 completed the tests in the same way: answering all the questions in the first attempt (1st) using the touch screen (TS). From the point-of-view of our system, the evolution of the QoS metrics for the group of users in each one of the rows of the table is practically identical, regardless of the small differences in the response time of the patients.
Table 9 depicts the results obtained on these tests. Considering each row of Table 8 as a group, the groups of patients G#1, G#4, and G#10 (3 patients in total) answered using the voice recognition system, groups G#2, G#3, G#5, and G#6 (9 patients) used the touchscreen, whereas the rest of patients (10 patients) answered using the Remote Control device. Regarding Group G #1 (Table 9), the patient answered all questions in the first attempt except question 4. The Performance and Interaction metrics provide last values close to 1.0. Moreover, the VoiceInteractionQuality property never decreases below the initial value (0.5) and it reaches a maximum value of 1. This shows that the patient always answered using voice. As for the Performance, there was a penalty due to an unanswered question (Q4). This is illustrated in a minimum value of 0.45, as well as the fact that the maximum value reached is 0.91, with an average value of 0.68 (the optimal average value is 0.82, as we can see in the data associated with G #3, the perfect case where the patient answered all questions in the first attempt). Finally, the Interaction property for G #1 was also influenced by the question not answered by the patient. However, it recovered quickly to almost reach the optimal value obtained during these tests. The evolution of the three properties (Performance, Interaction and VoiceInteractionQuality) are depicted in Table 10 (Right). The observations provided by the Complex Event Processor are shown in Table 10 (Left). This table also describes the context information captured from the DSR.
The rest of patients that used voice recognition to answer questions obtained uneven results. For instance, Patient #4 did not answer seven questions. Although the remaining questions were answered on the first attempt, the Performance and Interaction values are very low. However, this did not affect the VoiceInteractionQuality property, which decreases its value only when the patient answered using the Remote Control device or the touch screen. Patient #19 (G #10) performed the test perfectly, answering questions on the first attempt. The metrics obtained by this patient can be considered a reference value for validating other patients.
Patients in the group G #3 also performed the test answering questions on the first attempt but using the touch screen on the torso of the robot. Due to this, the VoiceInteractionQuality decreased during the test until it reached a value of 0, indicating that these patients used a non-verbal channel for interacting with the robot. Patients #6 and #8 did not answer question four and two, respectively. Comparing these two patients, we can see how the maximum and the final value are nearly identical, as expected. The minimum and the average differ slightly as the observations associated with the Question non Answered occurred in different instants of time. Both patients always used the touchscreen (the VoiceInteractionQuality metric ends close to 0.0).
The remaining 10 patients have completed the test using the Remote Control device. Patients in group G #7 obtain identical results that the ones in G #3. Although the only difference was the interaction mechanism used, the values obtained for the VoiceInteractionQuality property are identical, since neither used voice interaction. Patients #11 (G #8) and #15 (G #9) also performed the test in a similar way, as they both answered the first question at the second chance. However, Patient #11, before answering, paused the test and then resumed it. If we observe the model (Listing 3), we can see how pausing and resuming the test significantly affects Performance but very little Interaction. This is the reason why worse results are obtained for Performance and practically identical for the Interaction property.
Table 11 and Table 12 show how patients performed the Get Up & Go tests and the results obtained, respectively. Twelve patients performed the tests properly: they followed the robot instructions and the robot was able to detect all the movements and return a score. In that case, results show how the Performance and the Interaction properties reach almost 1.0, as expected. More details are available in Table 13. Only Patient #4 did not complete the test. The robot only detected the patient standing next to the chair and sat down. Thus, the minimum values for Performance and Interaction remain at 0.5 and the maximum values reach 0.93, although the latest values are lower than those obtained by the other patients.

6. Related Work

Assessing non-functional properties is gaining attention as systems become more complex and need to fulfill qualities of service at run-time. In robotics, QoS metrics have been applied to different domains, such as Human-Robot Interaction (HRI) [22,23] or human-machine teams [24], focusing on different non-functional properties, such as performance [25] or safety [26]. In general, QoS metrics are based on the observation of low-level contextual data to elaborate a more abstract perception of how the system works in terms of certain non-functional properties. For example, the metrics presented in [23] focus on productivity, efficiency, reliability, safety, and co-activity; Schreckenghost et al. [25] and Ma et al. [27] on performance; and Adam et al. [26] on safety. Moreover, QoS metrics can be useful for system evaluation and benchmarking [24,28], requirements checking [26,27], and run-time adaptation [29].
Despite all the attention, there seems to be a lack of tools to support the specification of non-functional properties and the generation of the robot run-time artefacts to estimate QoS. In the following we describe approaches dealing with non-functional properties. The UML MARTE [30] profile provides a common way to model hardware and software aspects of real-time embedded systems. It allows users to annotate models with information relevant for performing quantitative predictions and performance analysis. The usual workflow is to: (1) annotate information about non-functional properties directly in the software models; (2) use a model transformation for generating analysis-domain models; and (3) perform formal analysis using specialized tools. This process provides engineers with the means to evaluate the system designs and to take informed action if necessary. In the same line, Winiarski et al. [31] propose a modeling language to support the development of the robot control system based on SysML [32]. As MARTE, SysML is a UML profile that enables the specification of traceable requirements and analytical models. Other works propose modeling languages for specific non-functional concerns, for example, Lotz et al. [33] extend a model-driven software development process to include performance specifications associated with the robot components, which enables system-level timing analysis. Juez Uriagereka et al. [34] present a model-based tool for safety assessment in robotic systems by using fault injection simulations. It is built on Papyrus4Robotics [35] (a UML profile) and allows expressing context situations that can cause hazardous effects.
Unfortunately, all these approaches do not seem to provide much benefit when it comes to non-standardized application-dependent properties, such as the “voice interaction quality” considered in our work. In many cases, developers end up opting for custom solutions, with the consequent increase in time, cost and complexity. On the contrary, our approach does not limit the properties that can be defined, it is independent to the purpose (e.g., QoS metrics can be used for the robot adaptation, for analysis, benchmarking, etc.) and it allows the automatic code generation for context monitoring, patterns detection and the probabilistic estimation of the robot QoS.
Finally, it is worth noting that, differently from the above works, our approach also promotes the application of probabilistic techniques to address uncertainty and thus estimate the QoS associated with non-functional properties. In this sense, there are many probabilistic programming languages [36] that could be used to apply Bayesian inference. However, in general, their use is complex, mainly, because they require to accurately quantify probabilities, which does not fit well with the natural way people express things. Therefore, our approach provides a simpler way to define QoS metrics, where qualitative descriptions predominate over quantitative ones.

7. Conclusions and Future Work

Service robots are called to play a relevant role in the years to come. They will not just tackle repetitive or intense tasks, but will also share with us our daily scenarios, as co-workers or assistants. The importance of being able to perform these tasks is well assumed and, therefore, much of the research in service robotics focuses on the functional aspects. However, the non-functional properties, which describe how the robot performs its tasks, cannot be overlooked. Safety, performance, engagement or usability, among other requirements, must be taken into account and monitored during robot operation, providing information about its quality of service. Furthermore, it is worth noting that these non-functional properties should also guide the design, implementation, and testing of the robot’s software and hardware components prior to deployment in real-world scenarios.
This paper has proposed and evaluated a framework for considering non-functional properties in a robotics scenario. The framework allows the users to model quality of service metrics at design-time in three steps: (1) what is the relevant information to monitor (contexts); (2) how to identify relevant context patterns; and (3) how to estimate the value of each non-functional property in terms of the positive or negative influence of the identified context patterns. This model is instantiated into a QoS metrics provider, a software agent that is able to estimate the metrics at run-time by considering the context information captured by the robot. For validating this proposal, we have integrated this framework in CLARC. In this scenario, our objective is to be able to engage end-users in the interaction with the robot and all end-users (patients but also physicians) in the center of our design [6,8]. When we asked the care professionals in charge of testing CLARC what aspects should be improved, they requested us to extend the solution with the possibility to personalize the interaction according to the preferences of the users. This is the reason for considering in our pilot study properties related to the interaction. However, it is important to note that our approach is general enough to be used with other robotic systems that have different service requirements. A simple example of using the model for considering safety is described in Vicente-Chicote et al. [13].
Our results showed that this technique has been effective in detecting compliance with non-functional requirements, including the validation of the provided model itself. The evolution of the QoS metrics show that they are correctly capturing how the patient is interacting with the robot. Our current research focuses on using these QoS metrics to allow the robot to adapt itself to the expected requirements without external supervision. To address this task, we are extending our framework with capabilities to model and express adaptation policies and the selection of alternative behaviors at run-time. This recommender will be linked to the decision making (the PELEA agent) for adapting the course of action to the preferences of the user. Future work will also focus on adding other properties such as safety to the model in CLARC. In the current implementation, safety issues were addressed from our first designs by the Automated planning module (e.g., it autonomously takes the decision of calling the doctor when the patient gets up off the chair during a Barthel test). But the decision is actually a one-time action, and the robot is not aware that things may go wrong in advance. Therefore, if we model safety as a QoS metric, the system will be able to have that perception, and will be able to react accordingly. It is clear that the system will not only have to incorporate new properties to the model, but also observations and contexts (such as emotion detection and even biometric signals captured with sensors on the patient). Our efforts in this line are being carried out as part of the MIRoN research project (https://robmosys.eu/miron/), where we are validating the proposal with intensive testing in real environments.

Author Contributions

Software, A.R.-G., J.M.-C., J.F.I.-R., C.V.-C., R.M. and A.B.; Supervision, C.V.-C. and A.B.; Validation, A.R.-G., J.M.-C., J.F.I.-R. and R.M. All authors have read and agreed to the published version of the manuscript.

Funding

This work has been partially funded by the EU ECHORD++ project (FP7-ICT-601116), the RoQME Integrated Technical Project funded, in turn, by the EU RobMoSys project (H20202-732410), and the RTI2018-099522-B-C41 and the RTI2018-094591-B-I00 projects, both funded by the Spanish Ministerio de Ciencia, Innovación y Universidades and FEDER funds.

Acknowledgments

The authors warmly thank the members of the “Amis du Living Lab” community for their participation in this research.

Conflicts of Interest

The authors declare no conflict of interest.

References

  1. Ellis, G.; Whitehead, M.A.; Robinson, D.; O’Neill, D.; Langhorne, P. Comprehensive geriatric assessment for older adults admitted to hospital: Meta-analysis of randomised controlled trials. BMJ 2011, 343. Available online: https://www.bmj.com/content/343/bmj.d6553.full.pdf (accessed on 31 July 2020). [CrossRef] [Green Version]
  2. Mahoney, F.; Barthel, D. Functional evaluation: the Barthel index. Maryland State Med. J. 1965, 14, 56–61. [Google Scholar]
  3. Folstein, M.F.; Folstein, S.E.; McHugh, P.R. Mini-mental state: A practical method for grading the cognitive state of patients for the clinician. J. Psychiatr. Res. 1975, 12, 189–198. [Google Scholar] [CrossRef]
  4. Mathias, S.; Nayak, U.; Isaacs, B. Balance in Elderly Patients: The “Get-up and Go” Test. Arch. Phys. Med. Rehabil. 1986, 34, 119–126. [Google Scholar]
  5. Voilmy, D.; Suarez, C.; Romero-Garcés, A.; Reuther, C.; Pulido, J.; Marfil, R.; Manso, L.; Lan Hing Ting, K.; Iglesias, A.; González, J.; et al. CLARC: A Cognitive Robot for Helping Geriatric Doctors in Real Scenarios. ROBOT (1). In Advances in Intelligent Systems and Computing; Springer: Cham, Switzerland, 2017; Volume 693, pp. 403–414. [Google Scholar]
  6. Martínez, J.; Romero-Garcés, A.; Suarez, C.; Marfil, R.; Ting, K.L.H.; Iglesias, A.; García, J.; Fernández, F.; Dueñas-Ruiz, A.; Calderita, L.V.; et al. Towards a robust robotic assistant for Comprehensive Geriatric Assessment procedures: Updating the CLARC system. In Proceedings of the 27th IEEE International Symposium on Robot and Human Interactive Communication, RO-MAN 2018, Nanjing, China, 27–31 August 2018; pp. 820–825. [Google Scholar] [CrossRef]
  7. Bandera, J.P.; Marfil, R.; Romero-Garcés, A.; Voilmy, D. A new paradigm for autonomous human motion description and evaluation: Application to the Get Up & Go test use case. Pattern Recogit. Lett. 2019, 118, 51–60. [Google Scholar] [CrossRef]
  8. Lan Hing Ting, K.; Voilmy, D.; Iglesias, A.; Pulido, J.C.; García, J.; Romero-Garcés, A.; Bandera, J.P.; Marfil, R.; Dueñas, A. Integrating the users in the design of a robot for making Comprehensive Geriatric Assessments (CGA) to elderly people in care centers. In Proceedings of the 2017 26th IEEE International Symposium on Robot and Human Interactive Communication (RO-MAN), Lisbon, Portugal, 28 August–1 September 2017; pp. 483–488. [Google Scholar]
  9. Bustos, P.; Manso, L.; Bandera, A.; Bandera, J.; García-Varea, I.; Martínez-Gómez, J. The CORTEX cognitive robotics architecture: Use cases. Cogn. Syst. Res. 2019, 55, 107–123. [Google Scholar] [CrossRef] [Green Version]
  10. Marfil, R.; Romero-Garces, A.; Bandera, J.; Manso, L.; Calderita, L.; Bustos, P.; Bandera, A.; Garcia-Polo, J.; Fernandez, F.; Voilmy, D. Perceptions or Actions? Grounding How Agents Interact Within a Software Architecture for Cognitive Robotics. Cogn. Comput. 2019, 12, 479–497. [Google Scholar] [CrossRef]
  11. Iglesias, A.; Viciana-Abad, R.; Pérez-Lorenzo, J.M.; Ting, K.L.H.; Tudela, A.J.; Marfil, R.; Dueñas-Ruiz, A.; Rubio, J.P.B. Towards long term acceptance of Socially Assistive Robots in retirement houses: Use case definition. In Proceedings of the 2020 IEEE International Conference on Autonomous Robot Systems and Competitions, ICARSC 2020, Ponta Delgada, Portugal, 15–17 April 2020; pp. 134–139. [Google Scholar] [CrossRef]
  12. Vicente-Chicote, C.; Inglés-Romero, J.F.; Martínez, J.; Stampfer, D.; Lotz, A.; Lutz, M.; Schlegel, C. A Component-Based and Model-Driven Approach to Deal with Non-Functional Properties through Global QoS Metrics. In CEUR Workshop Proceedings, Proceedings of MODELS 2018 Workshops: ModComp, MRT, OCL, FlexMDE, EXE, COMMitMDE, MDETools, GEMOC, MORSE, MDE4IoT, MDEbug, MoDeVVa, ME, MULTI, HuFaMo, AMMoRe, PAINS Co-Located with ACM/IEEE 21st International Conference on Model Driven Engineering Languages and Systems (MODELS 2018), Copenhagen, Denmark, 14 October 2018; Hebig, R., Berger, T., Eds.; CEUR-WS.org.: Copenhagen, Denmark, 2018; Volume 2245, pp. 40–45. [Google Scholar]
  13. Vicente-Chicote, C.; García-Pérez, D.; García-Ojeda, P.; Inglés-Romero, J.F.; Romero-Garcés, A.; Martínez, J. Modeling and Estimation of Non-functional Properties: Leveraging the Power of QoS Metrics. In From Bioinspired Systems and Biomedical Applications to Machine Learning; Vicente, J.M.F., Álvarez-Sánchez, J.R., de la Paz López, F., Moreo, J.T., Adeli, H., Eds.; Springer International Publishing: Cham, Switzerland, 2019; pp. 380–388. [Google Scholar] [CrossRef]
  14. Lutz, M.; Inglés-Romero, J.F.; Stampfer, D.; Lotz, A.; Vicente-Chicote, C.; Schlegel, C. Managing variability as a means to promote composability: A robotics perspective. In New Perspectives on Information Systems Modeling and Design; Rosado da Cruz, A.M., Ferreira da Cruz, M.E., Eds.; IGI Global: Hershey, PA, USA, 2019; Chapter 12; pp. 274–295. [Google Scholar] [CrossRef] [Green Version]
  15. Russel, S.; Norvig, P. Artificial Intelligence: A Modern Approach; Prentice Hall Press: Upper Saddle River, NJ, USA, 2009. [Google Scholar]
  16. Beetz, M.; Mösenlechner, L.; Tenorth, M. CRAM—A Cognitive Robot Abstract Machine for Everyday Manipulation in Human Environments. In Proceedings of the IEEE/RSJ International Conference on Intelligent Robots and Systems, Taipei, Taiwan, 18–22 October 2010; pp. 1012–1017. [Google Scholar]
  17. Gat, E. Three-Layer Architectures. In Artificial Intelligence and Mobile Robots: Case Studies of Successful Robot Systems; MIT Press: Cambridge, MA, USA, 1998; pp. 195–210. [Google Scholar]
  18. Alcázar, V.; Madrid, I.; Guzmán, C.; Prior, D.; Borrajo, D.; Castillo, L.; Onaindía, E. PELEA: Planning, learning and execution architecture. In Proceedings of the 28th Workshop of the UK Planning and Scheduling Special Interest Group (PlanSIG’10), Brescia, Italy, 1–2 December 2010. [Google Scholar]
  19. Romero-Garcés, A.; Calderita, L.V.; Martínez-Gómez, J.; Rubio, J.P.B.; Marfil, R.; Manso, L.J.; Bandera, A.; Bustos, P. Testing a Fully Autonomous Robotic Salesman in Real Scenarios. In Proceedings of the 2015 IEEE International Conference on Autonomous Robot Systems and Competitions, ICARSC 2015, Vila Real, Portugal, 8–10 April 2015; pp. 124–130. [Google Scholar] [CrossRef] [Green Version]
  20. Kurniawan, S.; Zaphiris, P. Research-derived Web Design Guidelines for Older People. In Proceedings of the 7th International ACM SIGACCESS Conference on Computers and Accessibility; ACM: New York, NY, USA, 2005; pp. 129–135. [Google Scholar] [CrossRef]
  21. Tsui, K.M.; Dalphond, J.M.; Brooks, D.J.; Medvedev, M.S.; McCann, E.; Allspaw, J.; Kontak, D.; Yanco, H.A. Accessible Human-Robot Interaction for Telepresence Robots: A Case Study. Paladyn 2015, 6. [Google Scholar] [CrossRef]
  22. Murphy, R.R.; Schreckenghost, D. Survey of metrics for human-robot interaction. In Proceedings of the 8th ACM/IEEE International Conference on Human-Robot Interaction (HRI 2013), Tokyo, Japan, 3–6 March 2013; pp. 197–198. [Google Scholar] [CrossRef]
  23. Anzalone, S.; Boucenna, S.; Ivaldi, S.; Chetouani, M. Evaluating the Engagement with Social Robots. Int. J. Soc. Robot. 2015, 7, 465–478. [Google Scholar] [CrossRef]
  24. Damacharla, P.; Javaid, A.; Gallimore, J.; Devabhaktuni, V. Common Metrics to Benchmark Human-Machine Teams (HMT): A Review. IEEE Access 2018, 6, 38637–38655. [Google Scholar] [CrossRef]
  25. Schreckenghost, D.; Fong, T.; Utz, H.; Milam, T. Measuring robot performance in real-time for NASA robotic reconnaissance operations. In Proceedings of the 9th Workshop on Performance Metrics for Intelligent Systems (PerMIS’09), Gaithersburg, MD, USA, 21–23 September 2009; pp. 194–202. [Google Scholar] [CrossRef]
  26. Adam, S.; Larsen, M.; Jensen, K.; Schultz, U. Rule-based Dynamic Safety Monitoring for Mobile Robots. JOSER 2016, 7, 120–141. [Google Scholar]
  27. Ma, M.; Stankovic, J.; Feng, L. Runtime Monitoring of Safety and Performance Requirements in Smart Cities. In Proceedings of the 1st ACM Workshop on the Internet of Safe Things (SafeThings’17), Delft, The Netherlands, 5 November 2017; pp. 44–50. [Google Scholar] [CrossRef]
  28. Bardsiri, A.; Hashemi, S. QoS Metrics for Cloud Computing Services Evaluation. Int. J. Intell. Syst. Appl. 2014, 12, 27–33. [Google Scholar] [CrossRef]
  29. Epifani, I.; Ghezzi, C.; Mirandola, R.; Tamburrelli, G. Model evolution by run-time parameter adaptation. In Proceedings of the 31st IEEE International Conference on Software Engineering (ICSE 2009), Vancouver, BC, Canada, 16–24 May 2009; pp. 111–121. [Google Scholar] [CrossRef] [Green Version]
  30. Object Management Group. Modeling and Analysis of Real-Time and Embedded Systems (MARTE). Available online: https://www.omg.org/omgmarte/ (accessed on 31 July 2020).
  31. Winiarski, T.; Węgierek, M.; Seredyński, D.; Dudek, W.; Banachowicz, K.; Zielinski, C. EARL—Embodied Agent-Based Robot Control Systems Modelling Language. Electronics 2020, 9, 379. [Google Scholar] [CrossRef] [Green Version]
  32. Object Management Group. Systems Modeling Language (SysML). Available online: http://www.omgsysml.org/ (accessed on 31 July 2020).
  33. Lotz, A.; Hamann, A.; Lange, R.; Heinzemann, C.; Staschulat, J.; Kesel, V.; Stampfer, D.; Lutz, M.; Schlegel, C. Combining robotics component-based model-driven development with a model-based performance analysis. In Proceedings of the 2016 IEEE International Conference on Simulation, Modeling, and Programming for Autonomous Robots (SIMPAR), San Francisco, CA, USA, 13–16 December 2016; pp. 170–176. [Google Scholar]
  34. Juez Uriagereka, G.; Amparan, E.; Martinez Martinez, C.; Martinez, J.; Ibanez, A.; Morelli, M.; Radermacher, A.; Espinoza, H. Design-Time Safety Assessment of Robotic Systems Using Fault Injection Simulation in a Model-Driven Approach. In Proceedings of the 2019 ACM/IEEE 22nd International Conference on Model Driven Engineering Languages and Systems Companion (MODELS-C), Munich, Germany, 15–20 September 2019; pp. 577–586. [Google Scholar]
  35. Eclipse Foundation. Papyrus for Robotics. Available online: https://www.eclipse.org/papyrus/ (accessed on 31 July 2020).
  36. Gordon, A.; Henzinger, T.; Nori, A.; Rajamani, S. Probabilistic programming. In Proceedings of the FOSE 2014: Future of Software Engineering, Hyderabad, India, 31 May–7 June 2014; pp. 167–181. [Google Scholar] [CrossRef] [Green Version]
Figure 1. (Left) CLARC interacting with a patient for performing a Barthel test. (Right) The external remote control.
Applsci 10 06618 g001
Figure 2. (Left) Qualitative specification of the Bayesian Network for Performance. (Right) The transition graph for observations.
Applsci 10 06618 g002
Figure 3. (a) The CLARC robot; and (b) External device used for interacting with the robot.
Applsci 10 06618 g003
Figure 4. (Left) The bottom part of the final head of CLARC showing the camera disposition; and (Right) the fields of view of both cameras.
Applsci 10 06618 g004
Figure 5. Overview of the software architecture within the CLARC robot.
Applsci 10 06618 g005
Figure 6. Unified representation of the Deep State Representation (DSR) as a multi-labeled directed graph. For instance, edges labeled as is_with or is_not denote logic predicates between nodes. On the other hand, edges starting at world and ending at person and robot are geometric and they encodes a rigid transformation ( R T and R T respectively) between them. Geometric transformations can be chained or inverted to compute changes in coordinate systems (see text).
Applsci 10 06618 g006
Figure 7. A sequence diagram showing data exchange within modules in the Quality of Service (QoS) Metrics Provider agent.
Applsci 10 06618 g007
Figure 8. The CLARC robot interacting with elderly people. (Left) The final version deployed in Reims; and (Right) The first version of the robot, which was one of the platforms tested in Seville.
Applsci 10 06618 g008
Table 1. Mapping between Likelihood Ratios and intensities.
IntensityLR (Reinforcing)LR (Undermining)
VERY HIGH0.11/0.1
HIGH0.31/0.3
(DEFAULT VALUE)0.51/0.5
LOW0.71/0.7
VERY LOW0.91/0.9
Table 2. Bathel tests used to validate our model. Legend: 1st (FirstAttemptAnswered), 2nd (SecondAttemptAnswered), VR (UserInteraction::VOICE_RECOGNITION), RM (UserInteraction::REMOTE_CONTROL), TS (UserInteraction::TOUCH_SCREEN), CDR (CallingDoctor and then TestState::RESTARTED), PR (TestState::PAUSED and then TestState::RESTARTED), QNA (Question not answerered. Defined as SecondAttemptAnswered=false) and NPD (PersonDetected=false and then PersonDetected=true).
QuestionBarthel #1Barthel #2Barthel #3Barthel #4Barthel #5Barthel #6
11st, VR 1st, TS 2nd, TS 1st, VR 2nd, TS QNA
21st, VR 1st, TS 2nd, TS 2nd, VR QNAQNA
31st, VR 1st, TS 2nd, TS QNAPR, 1st, TS NPD, 2nd, TS 
41st, VR 1st, TS 2nd, TS 1st, TS 2nd, TS 2nd, TS 
51st, VR 1st, TS 2nd, TS 2nd, TS PR, 2nd, RC NPD, 1st, TS 
61st, VR 1st, RC 2nd, TS QNACDR, 1st, TS QNA
71st, VR 1st, RC 2nd, TS 1st, VR 1st, TS CDR, 1st, TS
81st, VR 1st, RC 2nd, TS 2nd, VR 1st, TS 2nd, TS 
91st, VR 1st, RC 2nd, TS 1st, TS 1st, TS PR, 1st, TS
101st, VR 1st, RC 2nd, TS 2nd, TS 1st, TS 2nd, TS
Table 3. Barthel test results associated to the tests in Table 2 (see text for details).
Barthel #1Barthel #2Barthel #3Barthel #4Barthel #5Barthel #6
Performancemin0.50000.50000.11470.07870.00170.0031
max0.98220.98230.58820.66920.58820.5882
avg0.81880.81870.33510.32480.16710.1357
sd0.13630.13670.14740.21080.23510.1944
last0.98220.98230.17270.16860.04000.0082
Interactionmin0.50000.50000.11470.26530.03030.0342
max1.00001.00000.58820.82520.94740.5882
avg0.90840.90760.33490.61070.40260.1893
sd0.15450.15530.14770.14330.21750.1776
last1.00001.00000.12750.69380.94700.2259
VIQualitymin0.50000.00000.0000.41550.00010.0006
max1.00000.50000.50000.91410.50000.5000
avg0.88700.11390.10550.68700.14540.2098
sd0.18590.18690.17690.17110.18260.2200
last1.00000.00000.00000.41590.00010.0006
Table 4. Barthel #4: (Left) Contexts and observations generated by the system. PD (PersonDetected), 1st (FirstAttemptAnswered=true), !1st (FirstAttemptAnswered=false), 2nd (SecondAttemptAnswered=true), !2nd (SecondAttemptAnswered=false), VR (UserInteraction::VOICE_RECOGNITION), TS (UserInteraction::TOUCH_SCREEN), FINISHED (TestState::FINISHED). (Right) Graphical evolution of the properties values during the test.
Time (s)ObservationsContexts
10O2:O8PD Applsci 10 06618 i004
135O13:O2:O71st,VR
205O6:O11!1st
230O13:O12:O32nd,VR
310O6:O11!1st
340O5:O10!2nd
400O2:O14:O71st,TS
485O6:O11!1st
505O12:O14:O32nd,TS
595O6:O11!1st
630O5:O10!2nd
690O13:O2:O71st,VR
790O6:O11!1st
810O13:O12:O32nd,VR
890O12:O14:O71st,TS
965O6:O11!1st
990O12:O14:O32nd,TS
1000O2FINISHED
Table 5. Get Up & Go tests used to validate our model.
TestDescription
Get Up & Go #1The patient performs the test successfully
Get Up & Go #2Starting the test, the robot lost the person during a few seconds. Then the test is performed successfully.
Get Up & Go #3Starting the test, the robot lost the person during a few seconds. In the first attempt, the person does not stay next to the chair. In the second attempt he stays next to the chair and the test is performed successfully.
Get Up & Go #4Starting the test, the robot lost the person during a few seconds. The person does not stay next to the chair. The test finishes
Get Up & Go #5The patient stays next to the chair but he sits on the chair in the second attempt (the robot must repeat the instructions). Then, the test is performed successfully.
Get Up & Go #6The patient stays next to the chair, sits on chair but he does not get up. The robot does not give him a score.
Get Up & Go #7The patient stays next to the chair, sits on chair, gets up but does not sit on the chair again. The robot does not give him a score.
Get Up & Go #8During the test introduction the patient presses the pause and the restart button. The test is performed successfully.
Get Up & Go #9During the test introduction the patient presses the calling doctor button. The doctor presses the restart button. The test is performed successfully.
Table 6. Get Up & Go test results associated to the tests in Table 5 (see text for details).
PerformanceInteraction
minmaxlastminmaxlast
Get Up & Go #10.50000.99870.99870.50000.98610.9857
Get Up & Go #20.49820.99870.99870.49820.98610.9857
Get Up & Go #30.29780.98080.98080.29780.95670.9567
Get Up & Go #40.15500.58820.15550.08240.58820.0828
Get Up & Go #50.50000.99560.99560.48790.93720.9361
Get Up & Go #60.50000.93870.83100.50000.93870.7067
Get Up & Go #70.50000.98060.93430.50000.95590.8270
Get Up & Go #80.12420.99040.99040.49810.98230.9818
Get Up & Go #90.29840.99630.99630.12420.90580.9055
Table 7. Get Up & Go #9: (Left) Contexts and observations generated by the system. (Right) Graphical evolution of the properties values during the test.
Time (s)ObservationsContexts
10O2:O8PersonDetected Applsci 10 06618 i005
120O5:O9CallingDoctor
140O12:O3RESTARTED
170O1:O7PersonIsNextToChair
225O1:O7PersonIsSeated
235O1:O8PersonGetsUp
250O1:O7PersonIsSeated
270O1:O2Scored,FINISHED
Table 8. Barthel tests performed in real scenarios. 1st (FirstAttemptAnswered), 2nd (SecondAttemptAnswered), VR (UserInteraction::VOICE_RECOGNITION), RC (UserInteraction::REMOTE_CONTROL), TS (UserInteraction::TOUCH_SCREEN), CDR (CallingDoctor and then TestState::RESTARTED), PR (TestState::PAUSED and then TestState::RESTARTED), QNA (Question not answered. Defined as NOT SecondAttemptAnswered) and NPD (not PersonDetected and then PesonDetected).
GroupPatient #Q1Q2Q3Q4Q5Q6Q7Q8Q9Q10
111st,VR1st,VR1st,VRQNA1st,VR1st,VR1st,VR1st,VR1st,VR1st,VR
22, 142nd,TS1st,TS1st,TS1st,TS1st,TS1st,TS1st,TS1st,TS1st,TS1st,TS
33,5,7,17,221st,TS1st,TS1st,TS1st,TS1st,TS1st,TS1st,TS1st,TS1st,TS1st,TS
44QNA1st,VRQNA1st,VRQNAQNA1st,VRQNAQNAQNA
561st,TS1st,TS1st,TSQNA1st,TS1st,TS1st,TS1st,TS1st,TS1st,TS
681st,TSQNA1st,TS1st,TS1st,TS1st,TS1st,TS1st,TS1st,TS1st,TS
79,10,12,13,16,18,201st,RC1st,RC1st,RC1st,RC1st,RC1st,RC1st,RC1st,RC1st,RC1st,RC
811PR,2nd,RC1st,RC1st,RC1st,RC1st,RC1st,RC1st,RC1st,RC1st,RC1st,RC
9152nd,RC1st,RC1st,RC1st,RC1st,RC1st,RC1st,RC1st,RC1st,RC1st,RC
10191st,VR1st,VR1st,VR1st,VR1st,VR1st,VR1st,VR1st,VR1st,VR1st,VR
1121PR,2nd,RC1st,RC2nd,RC1st,RC2nd,RC2nd,RCNPD,1st,RC1st,RCNPD,2nd,RC1st,RC
Table 9. Barthel test results associated to the tests in Table 8 (see text for details).
G #1G #2G #3G #4G #5G #6G #7G #8G #9G #10G #11
Performancemin0.45720.49840.50000.00020.45220.29580.50000.12410.49760.50000.1071
max0.91200.97220.98220.58820.91090.91630.98220.92780.97010.98220.5882
avg0.68000.74330.82040.16020.67740.60830.81910.55860.74820.81820.2647
sd0.11220.15490.13640.20600.11330.15550.13660.21670.14940.13650.1423
last0.91200.97220.98220.00030.91090.91630.98220.92780.97010.98220.4833
Interactionmin0.50000.49840.50000.00170.50000.48540.50000.49780.49760.50000.4352
max0.99991.00001.00000.58820.99980.99981.00001.00000.99991.00000.9861
avg0.89460.83990.90940.24230.90030.83720.90810.88790.85140.90780.7596
sd0.14980.19470.15440.21280.14470.17970.15490.17050.18970.15480.1639
last0.99991.00001.00000.00170.99980.99981.00001.00000.99991.00000.9860
VIQualitymin0.50000.00000.00000.50000.00010.00010.00000.00000.00000.50000.0000
max1.00000.50000.50000.96420.50000.50000.50000.50000.50001.00000.5000
avg0.88030.13860.11170.81260.11030.14010.11330.12840.13160.88620.1278
sd0.18370.20170.18580.17470.17810.18050.18640.19710.20030.18630.1978
last1.00000.00000.00000.94710.00010.00010.00000.00000.00001.00000.0000
Table 10. Barthel(patient) #1: (Left) Contexts and observations generated by the system: 1st (FirstAttemptAnswered=true), !1st (FirstAttemptAnswered=false), 2nd (SecondAttemptAnswered=true), !2nd (SecondAttemptAnswered=false), VR (UserInteraction::VOICE_RECOGNITION), FINISHED (TestState::FINISHED). (Right) Graphical evolution of the properties values during the test.
Time (s)ObservationsContexts
10O2:O8PD Applsci 10 06618 i006
90O13:O2:O71st,VR
135O13:O2:O71st,VR
180O13:O2:O71st,VR
225O6:O11!1st
245O5:O10!2nd
280O13:O2:O71st,VR
325O13:O2:O71st,VR
365O13:O2:O71st,VR
415O13:O2:O71st,VR
460O13:O2:O71st,VR
500O13:O2:O71st,VR
505O2FINISHED
Table 11. Get Up & Go tests description.
Patient #Description
1,2,3,5,6,7,8,9,10,11,12,13The patient performs the test successfully
4The robot detects that the patient stays next to the chair, sits on chair but he does not get up. The robot does not give him a score.
Table 12. Get Up & Go real test results associated to the tests in Table 11 (see text for details).
Patient #PerformanceInteraction
maxminlastmaxminlast
1,2,3,5,6,7,8,9,10,11,12,130.99870.50000.99870.98620.50000.9858
40.93870.50000.83100.93870.50000.7067
Table 13. Get Up & Go #1: (Left) Contexts and observations generated by the system. (Right) Graphical evolution of the properties values during the test.
Time (s)ObservationsContexts
10O2:O8PersonDetected Applsci 10 06618 i007
145O1:O7PersonIsNextToChair
195O1:O7PersonIsSeated
205O1:O8PersonGetsUp
215O1:O7PersonIsSeated
235O1:O2Scored,FINISHED

