Laboratory Investigation of the Mechanical Properties of a Rubber–Calcareous Sand Mixture: The Effect of Rubber Content

Abstract
1. Introduction
2. Experimentation
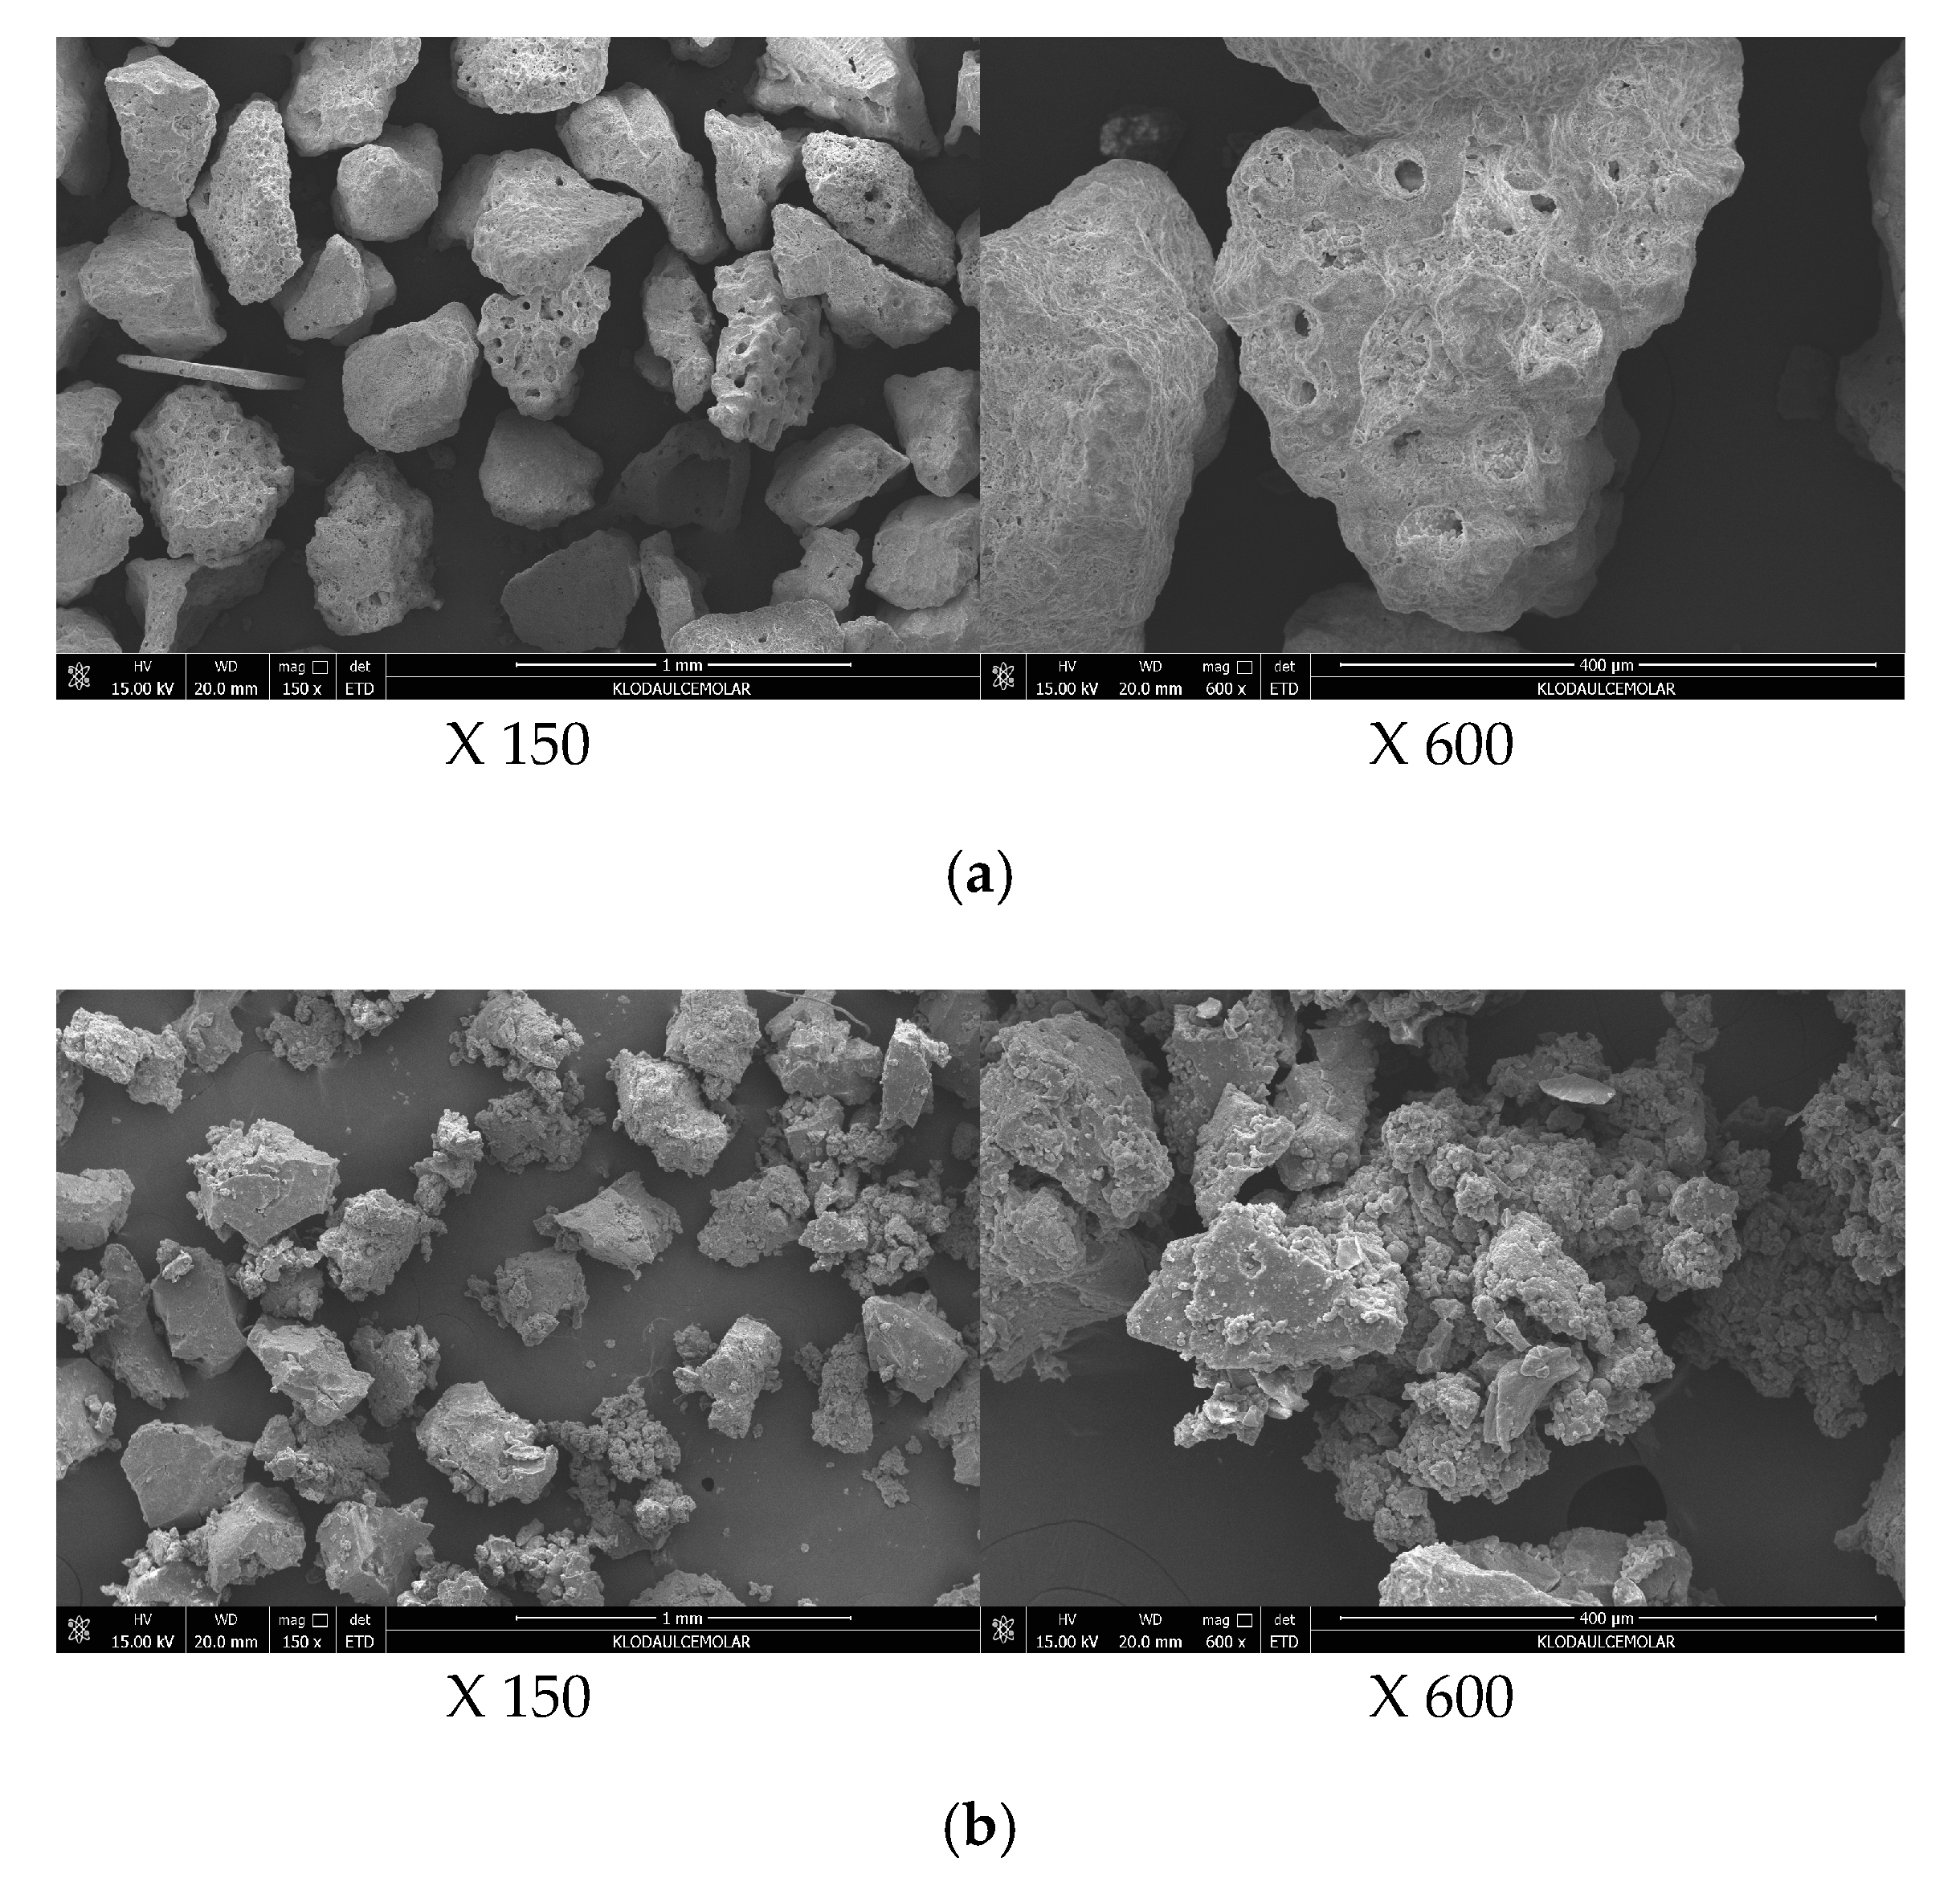
2.1. Test Materials
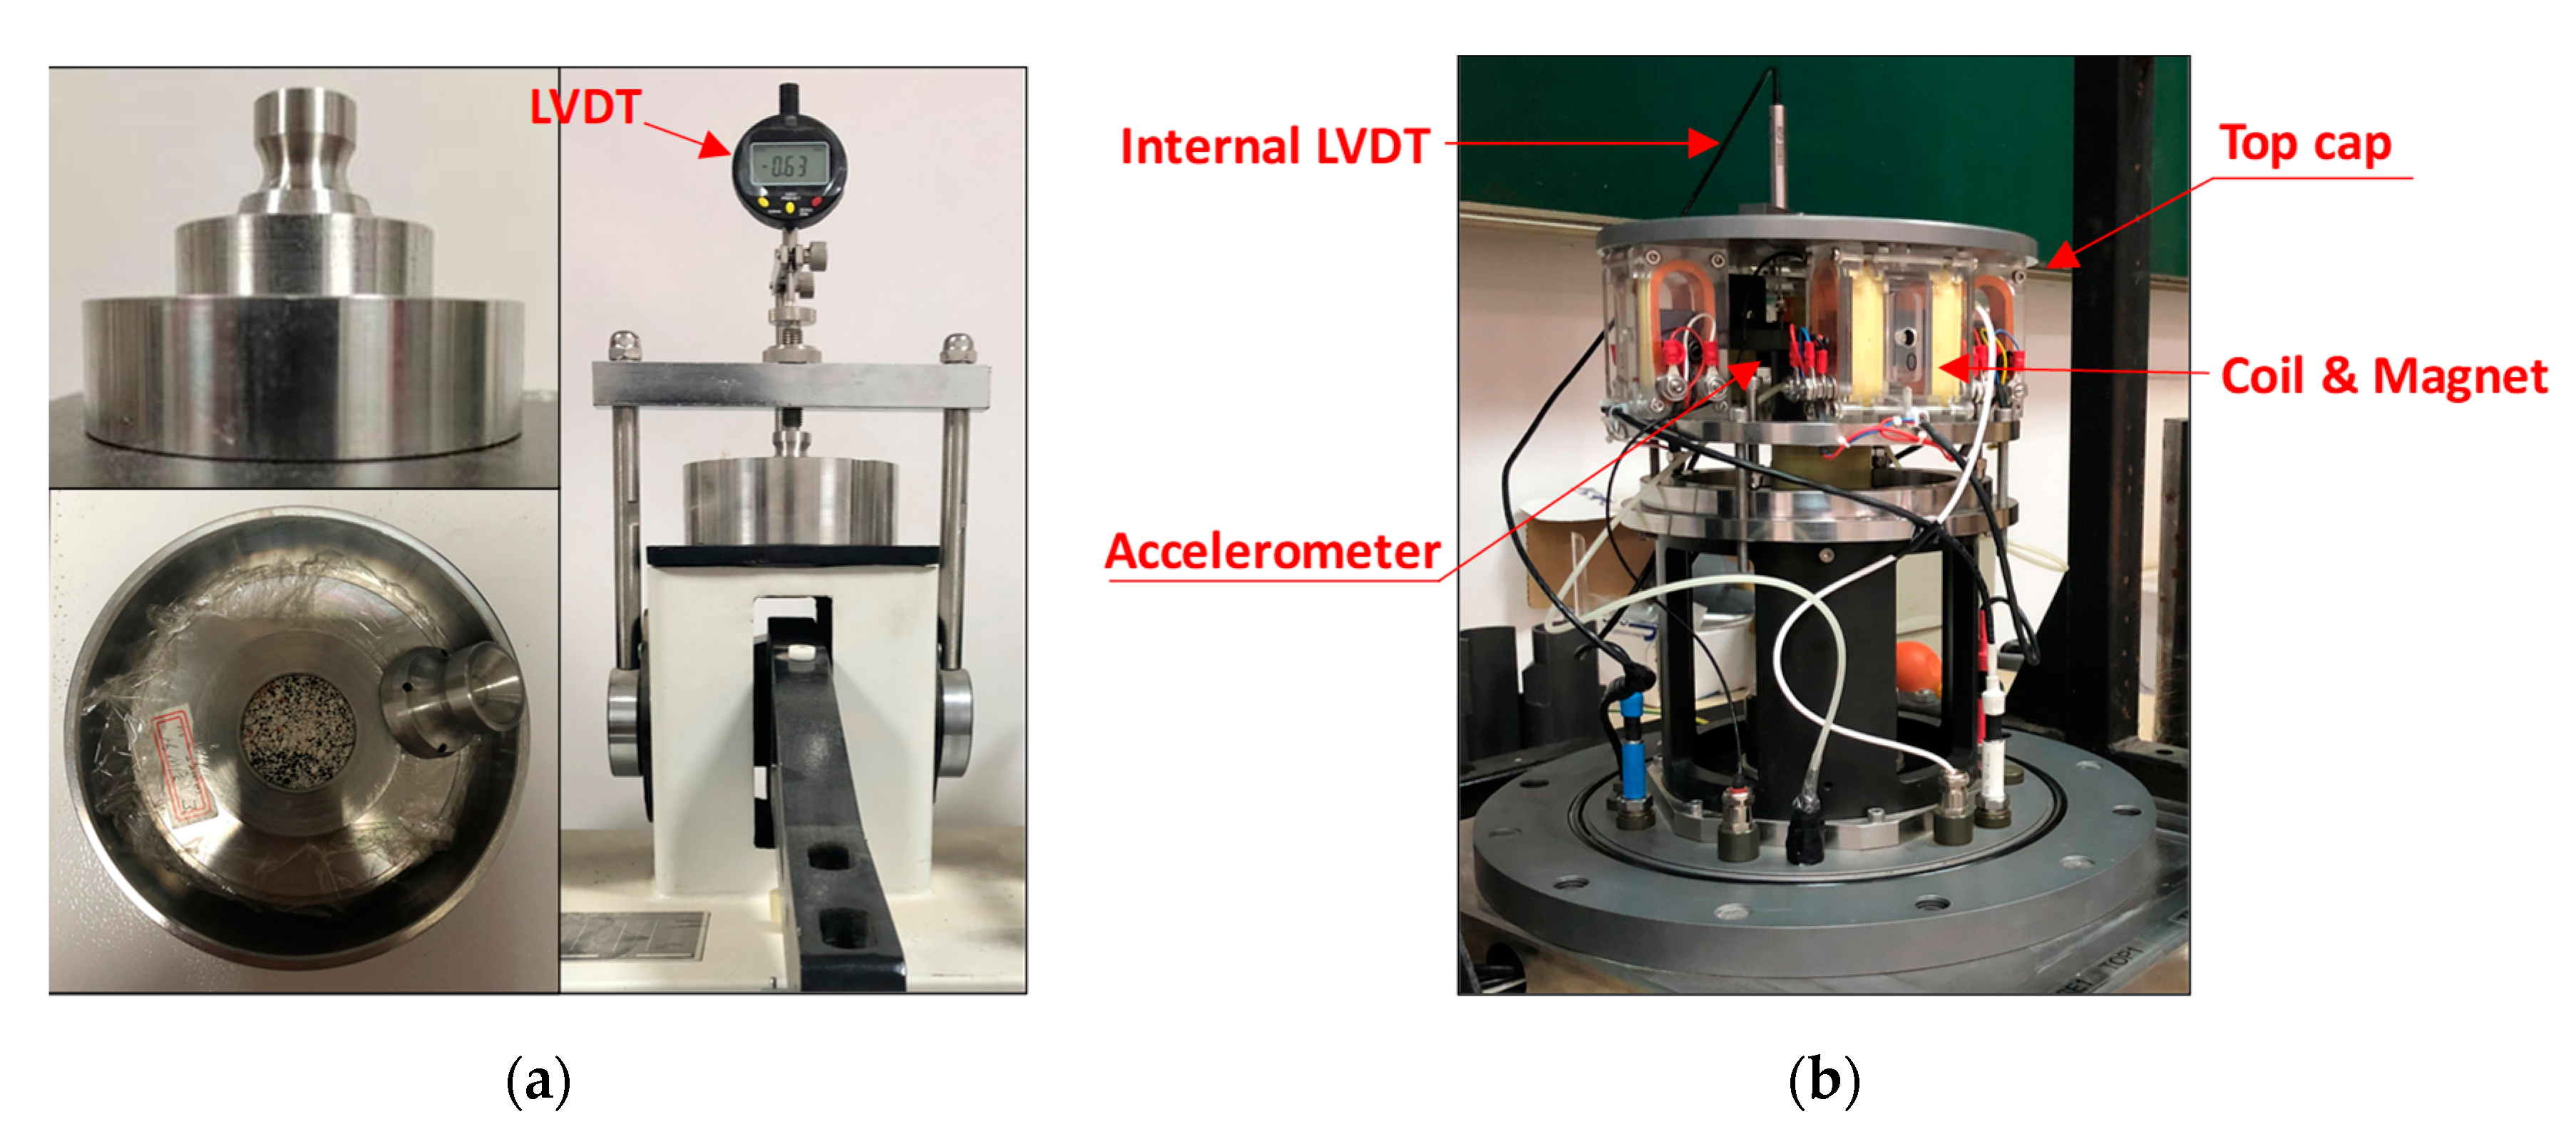
2.2. Sample Preparation and Test Methods
3. Test Results and Discussion
3.1. Compression Properties
3.2. Grain Breakage
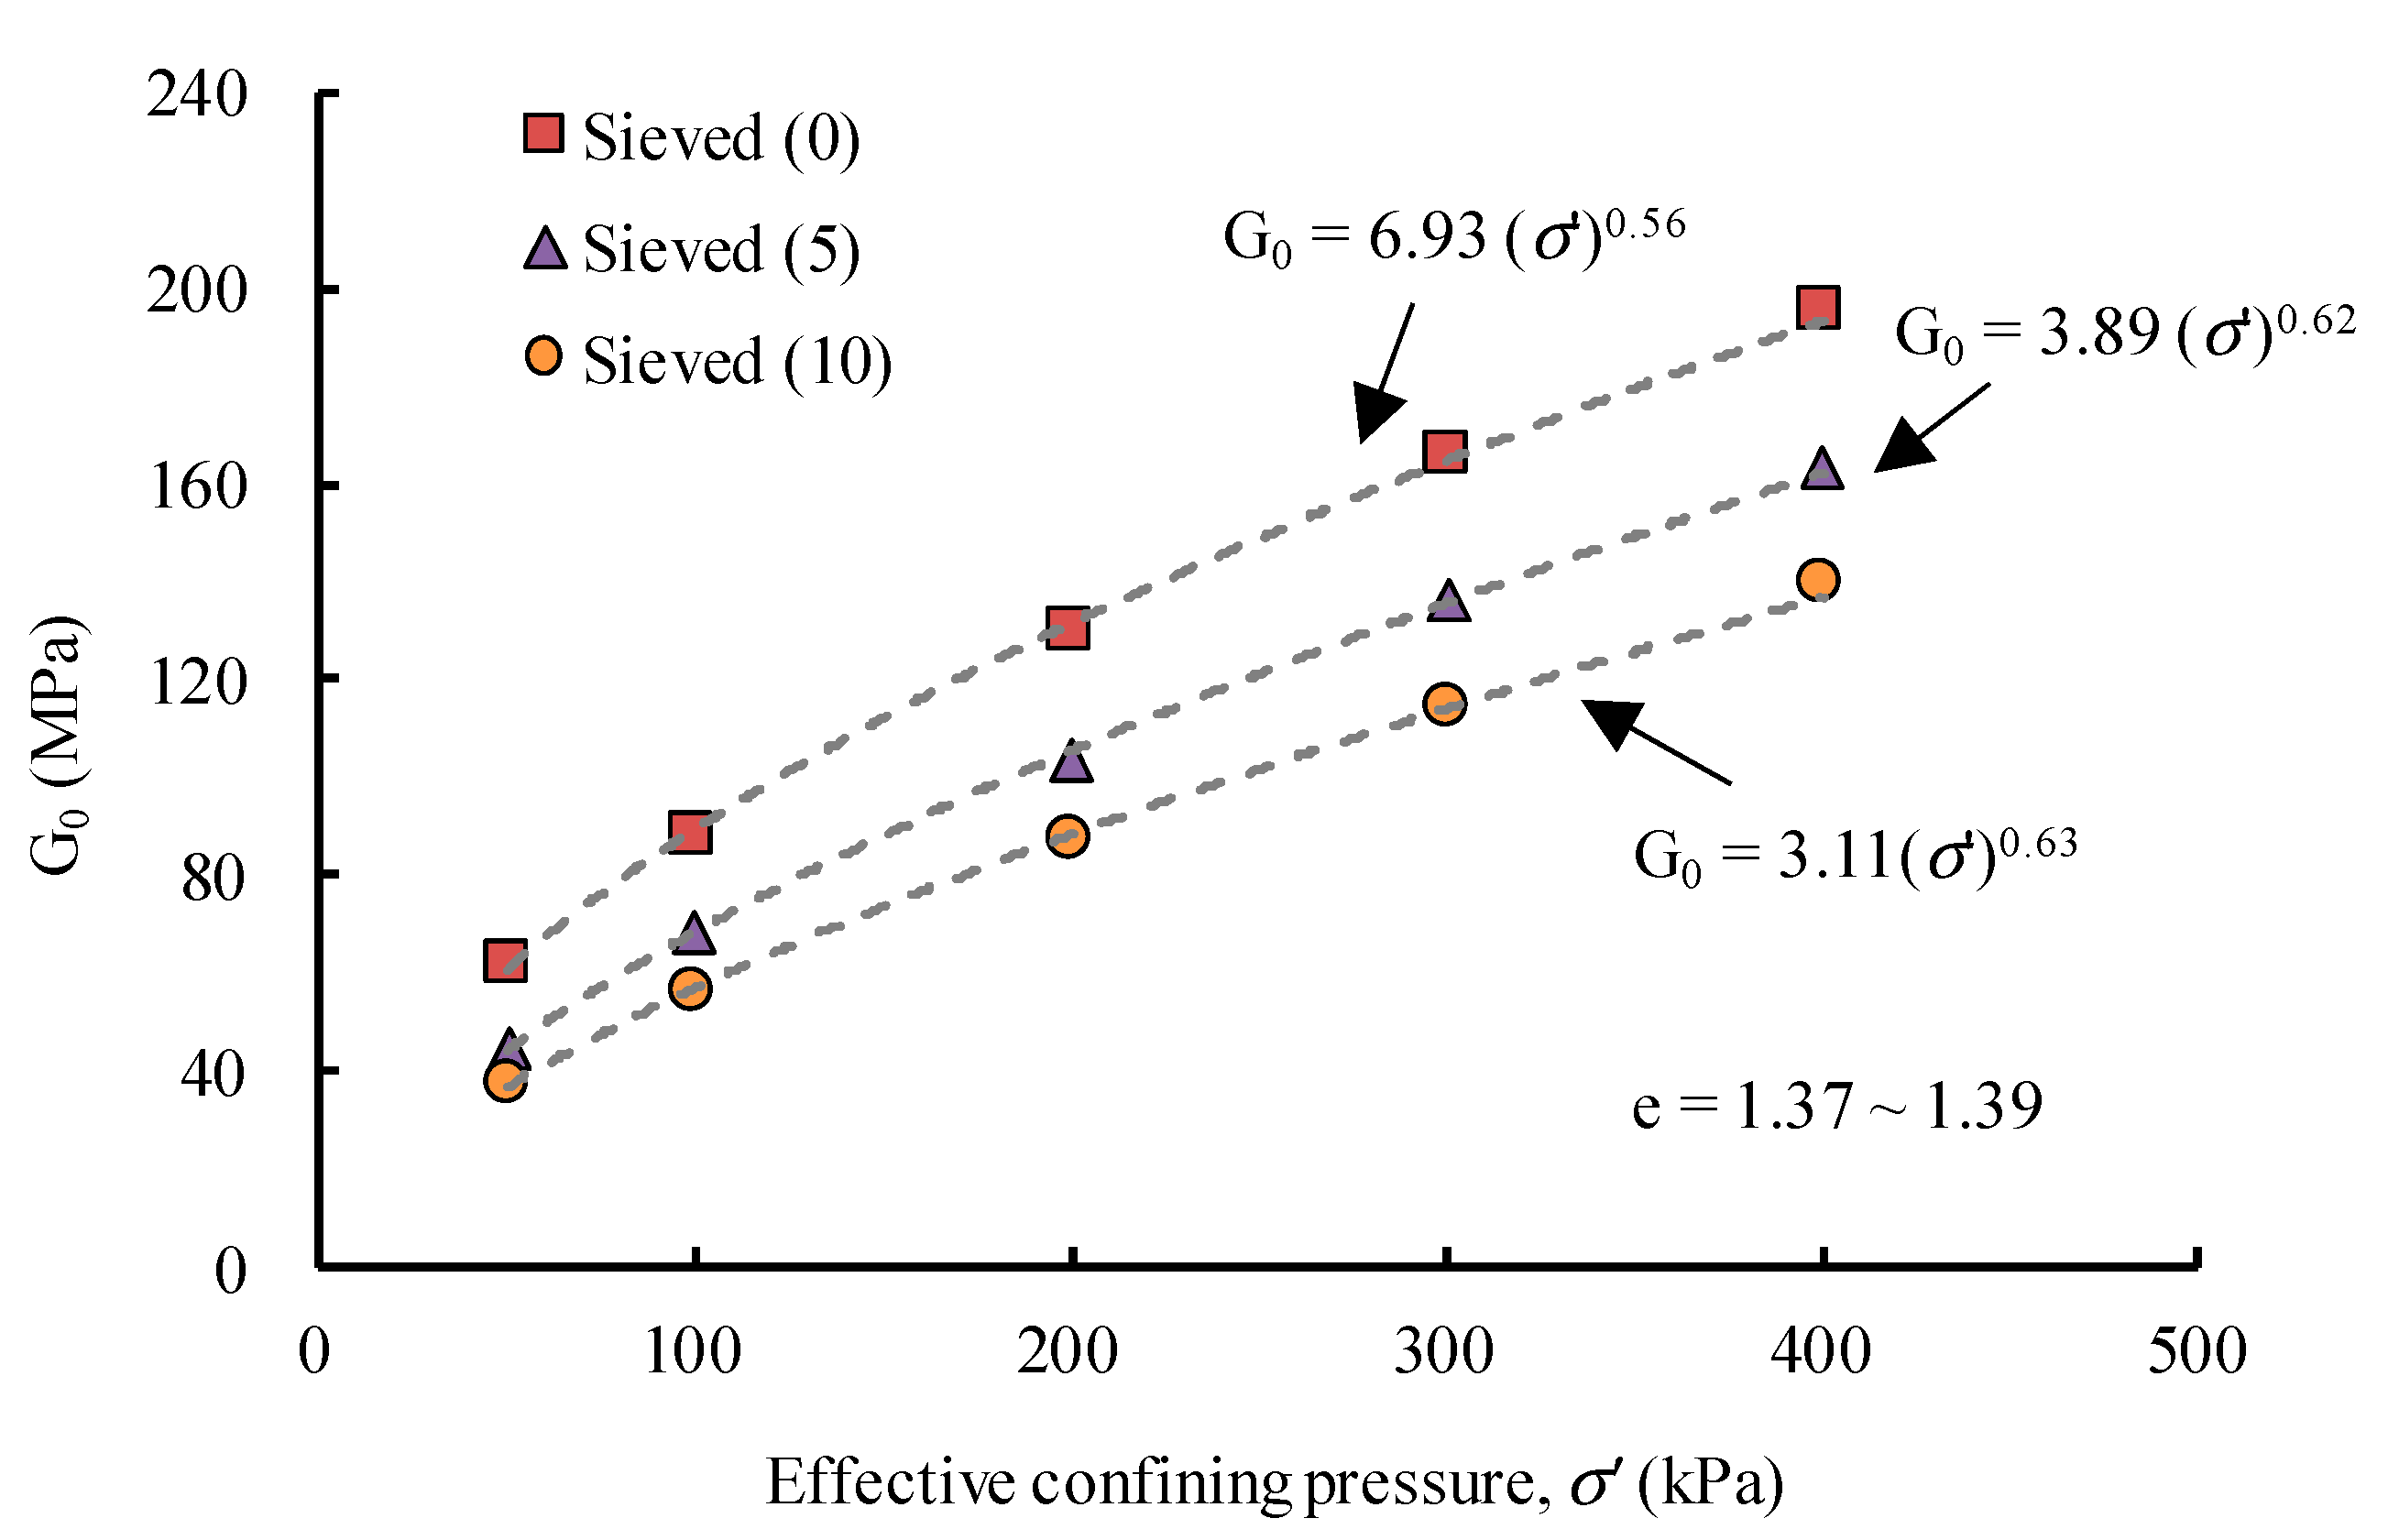
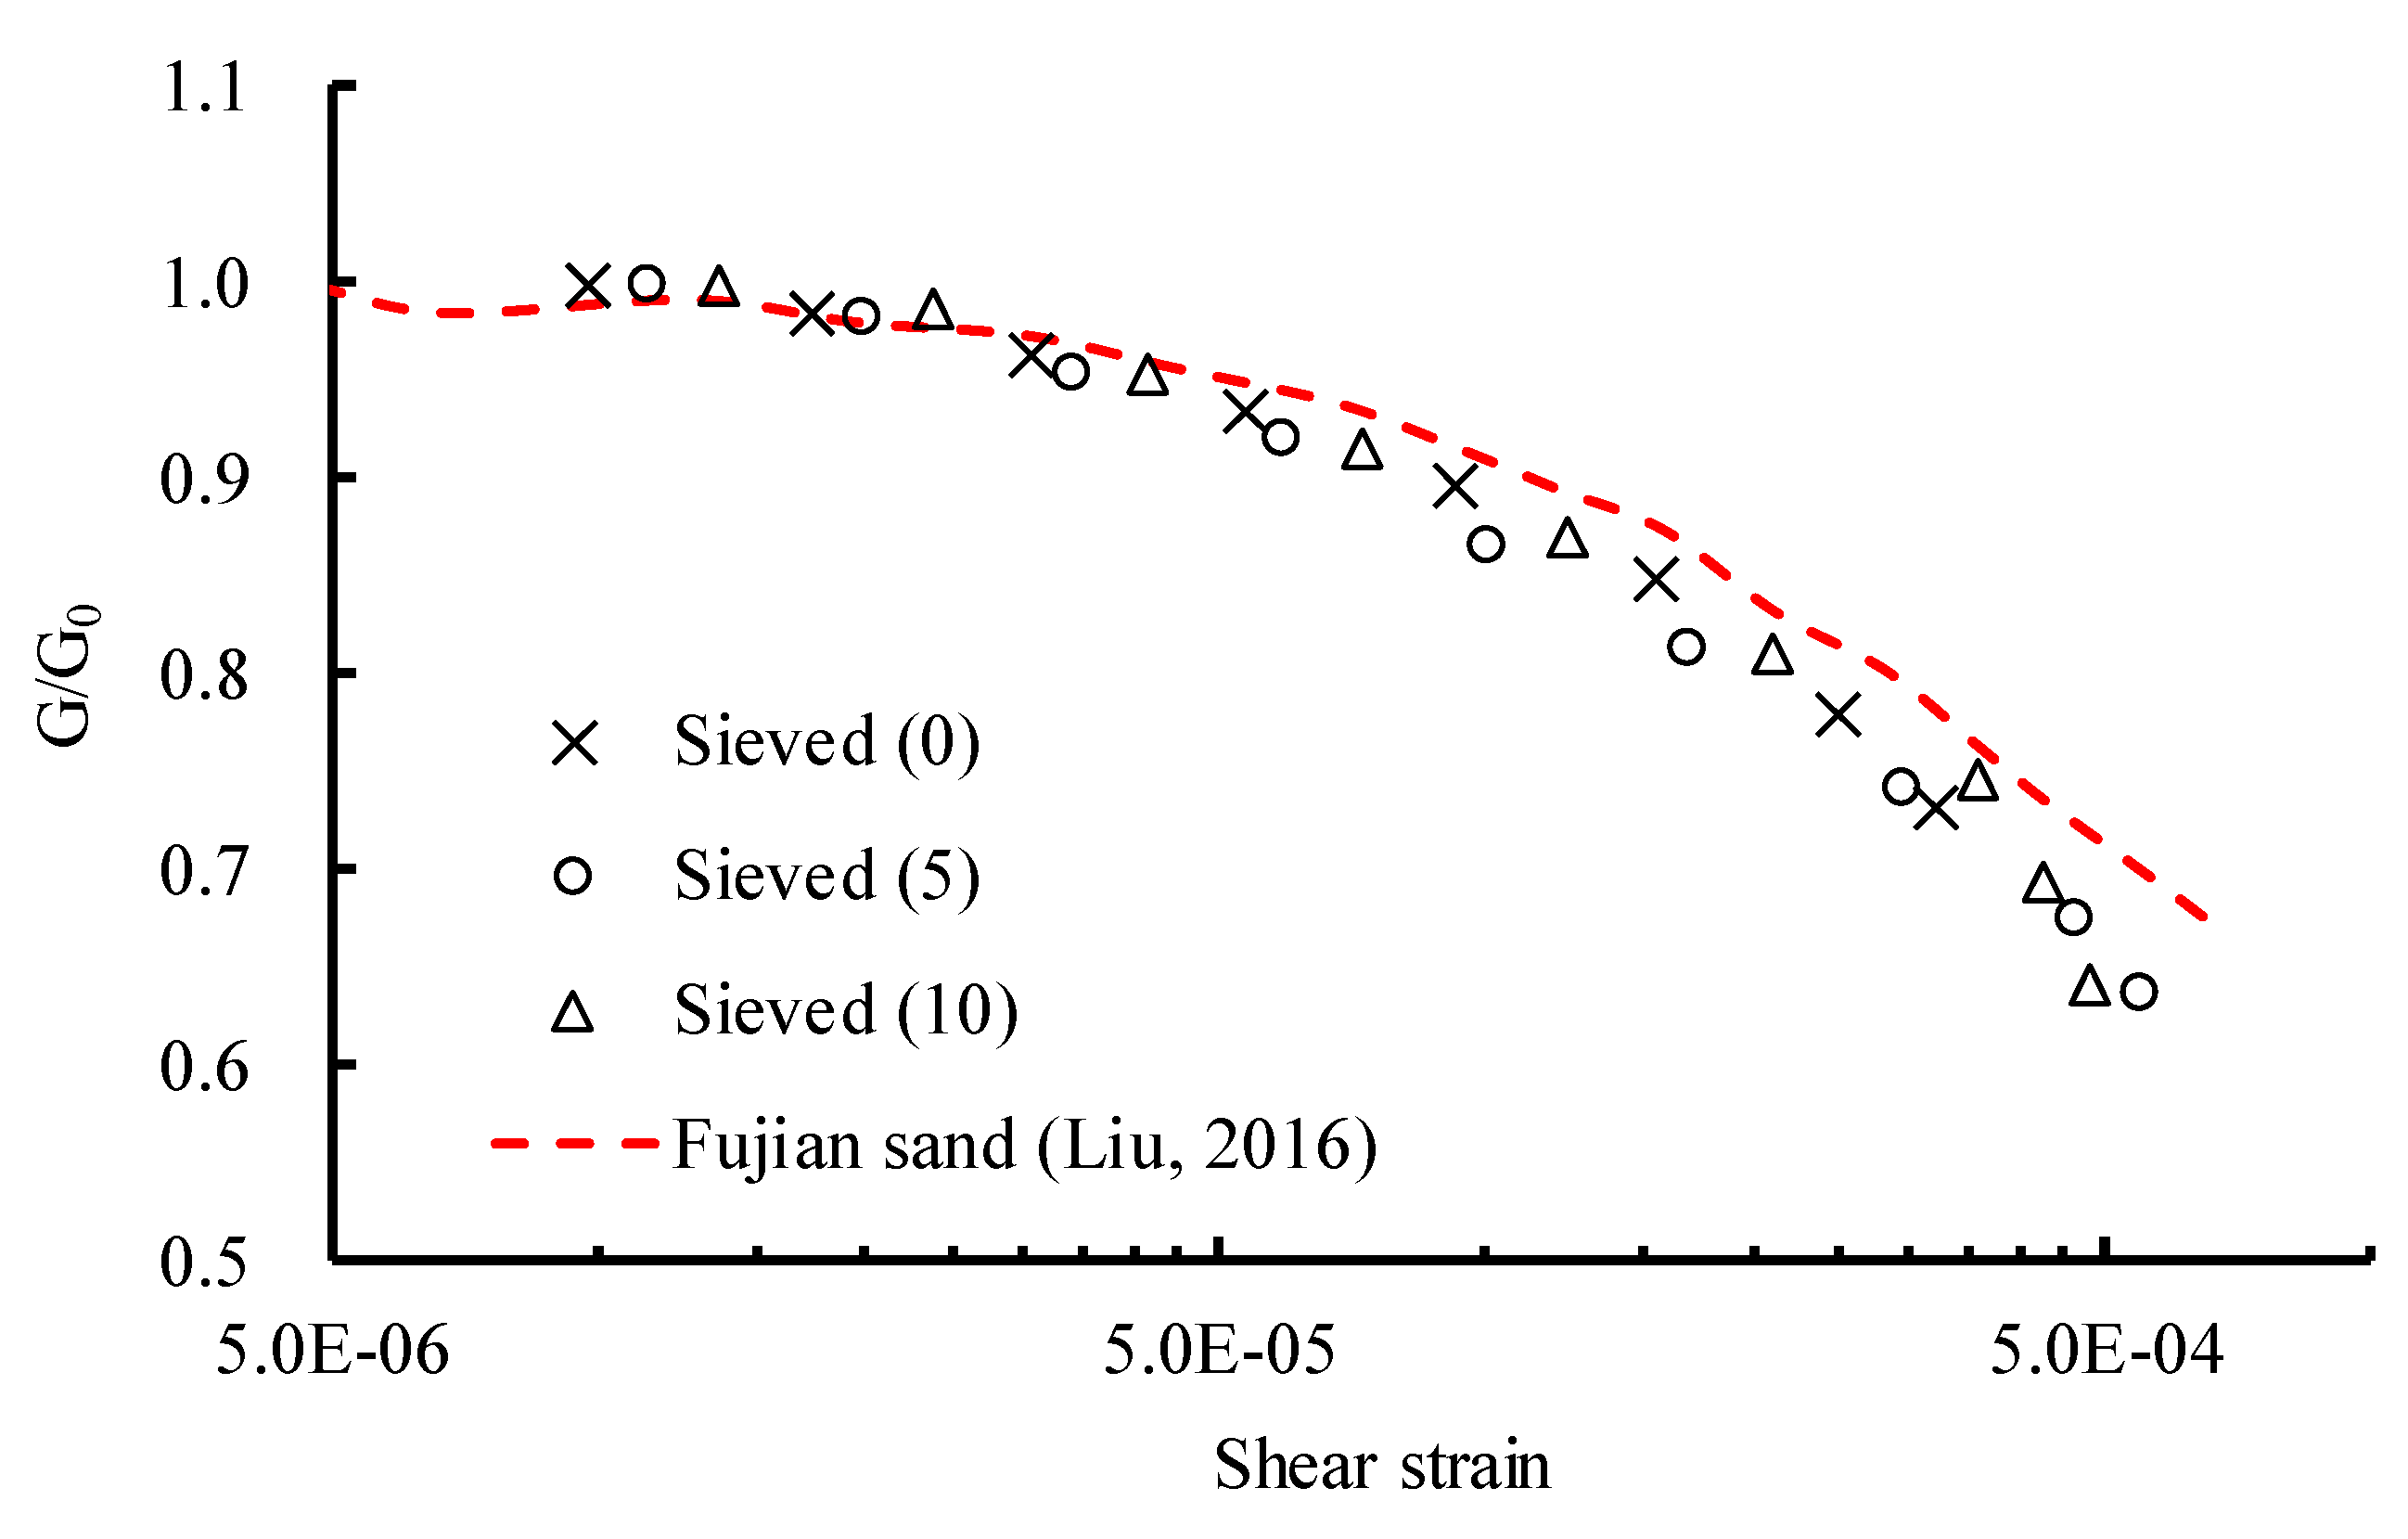
3.3. Small Strain Modulus and Modulus Reduction
4. Conclusions
- (a)
- The virgin compression curves of the rubber–calcareous sand mixtures tended to converge in the stress range investigated. This implies that all specimens were compressed to a unique state not associated with the initial conditions. However, the results also show that the location of the converging point depends on the rubber content.
- (b)
- The grain crushing of the mixtures was evaluated using a parameter of relative breakage (Br). While the Br value of the pure calcareous sand was significantly greater than that of the Fujian sand, it reduced pronouncedly with the inclusion of rubber chips. At a rubber content of 10%, the Br value of the mixtures was very similar to that of the Fujian sand.
- (c)
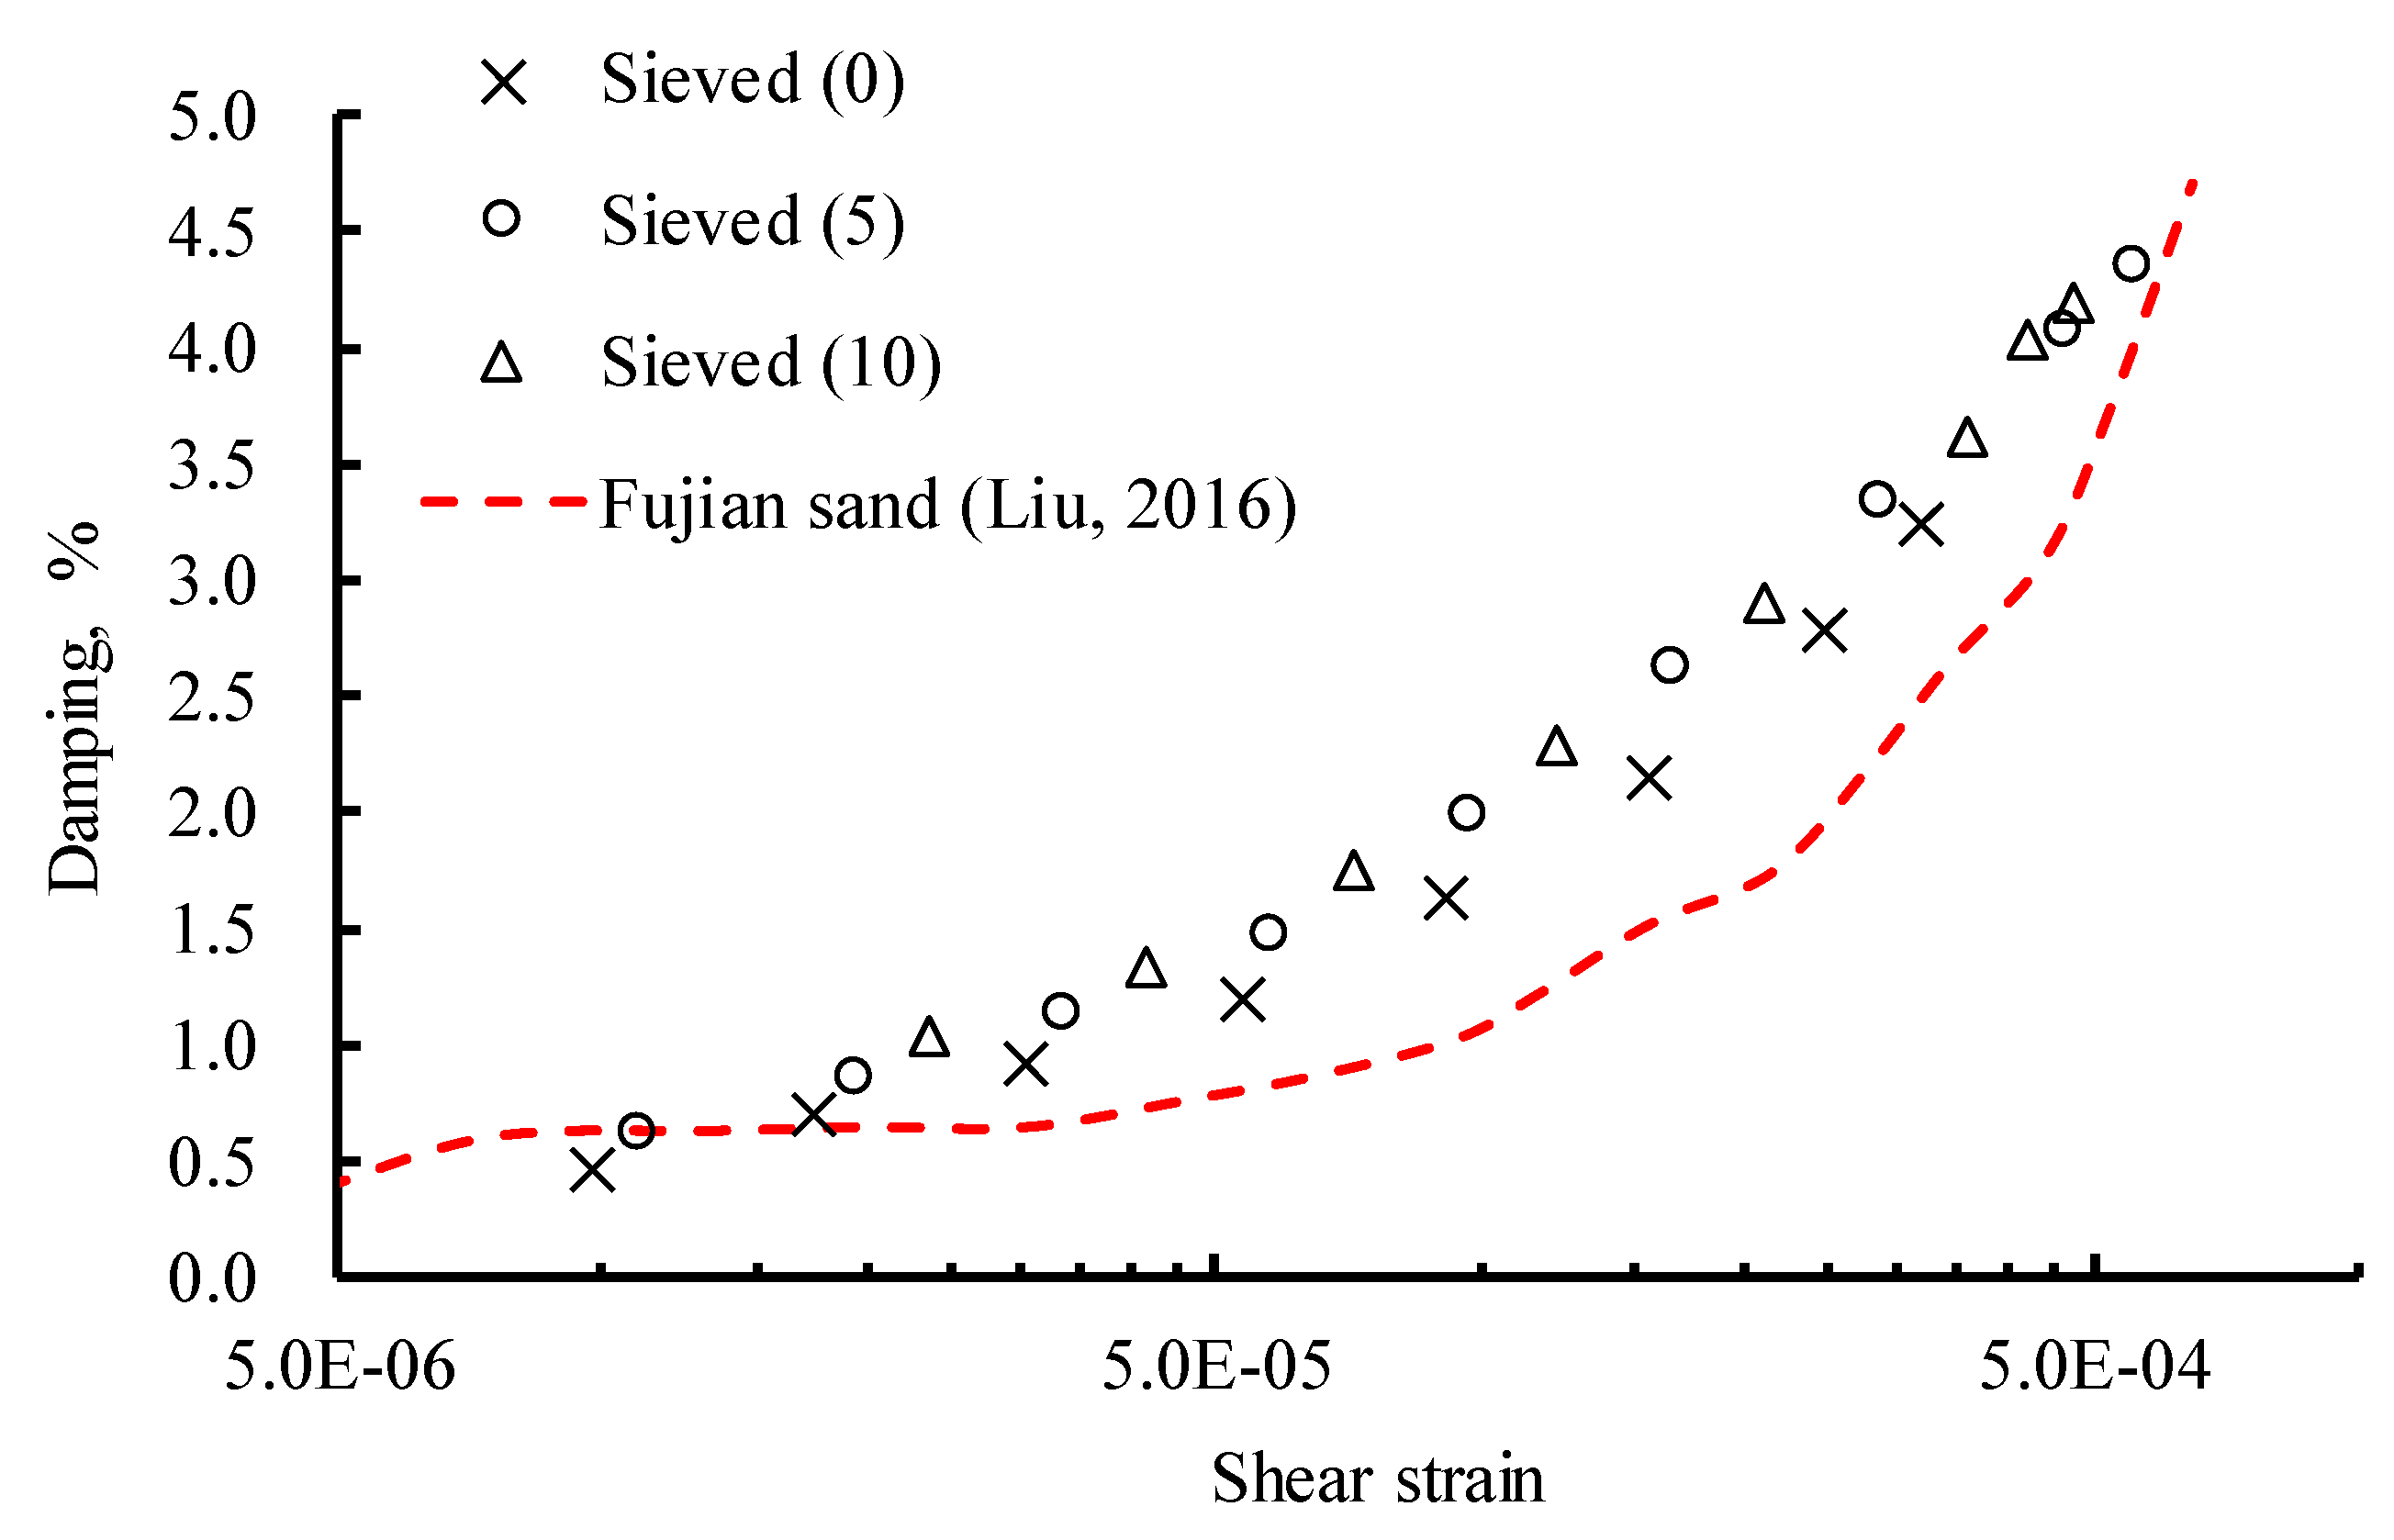
- The small strain shear modulus (G0) decreased for the specimens with add-in rubber chips. Moreover, the modulus reduction and damping curves exhibited little difference for the specimens of varying rubber contents. Although the inclusion of rubber chips lowered the shear stiffness of the calcareous sand, it is still considered a useful building material since it can mitigate the adverse impact of grain crushing. The shear stiffness of the mixtures could be reinforced and further improved by using a geomembrane or geogrid.
Author Contributions
Funding
Conflicts of Interest
References
- Ackleson, S.; Moses, W.; Montes, M. Remote sensing of coral reefs: Uncertainty in the detection of benthic cover, depth, and water constituents imposed by sensor noise. Appl. Sci. 2018, 8, 2691. [Google Scholar] [CrossRef]
- Al-Douri, R.H.; Poulos, H.G. Cyclic behaviour of pile groups in calcareous sediments. Soils Found. 1994, 34, 49–59. [Google Scholar] [CrossRef]
- Wang, X.Z.; Jiao, Y.Y.; Wang, R.; Hu, M.J.; Meng, Q.S.; Tan, F.Y. Engineering characteristics of the calcareous sand in Nansha islands, South China Sea. Eng. Geol. 2011, 120, 40–47. [Google Scholar] [CrossRef]
- Giretti, D.; Been, K.; Fioravante, V.; Dickenson, S. CPT calibration and analysis for a carbonate sand. Géotechnique 2018, 68, 345–357. [Google Scholar] [CrossRef]
- Wang, X.; Cui, J.; Wu, Y.; Zhu, C.; Wang, X.Z. Mechanical properties of calcareous silts in a hydraulic fill island-reef. Mar. Georesour. Geotechnol. 2020, 38, 1–14. [Google Scholar] [CrossRef]
- Lan, H.X.; Zhao, X.X.; Wu, Y.M.; Li, L.P. Settlement and deformation characteristics of calcareous island-reef. J. Ocean Univ. China 2017, 47, 1–8. [Google Scholar]
- Lv, Y.; Liu, J.; Xiong, Z. One-dimensional dynamic compressive behavior of dry calcareous sand at high strain rates. J. Rock. Mech. Geotech. Eng. 2019, 11, 192–201. [Google Scholar] [CrossRef]
- Wei, H.; Zhao, T.; Meng, Q.; Wang, X.; He, J. Experimental evaluation of the shear behavior of fiber-reinforced calcareous sands. Int. J. Geomech. 2018, 18, 04018175. [Google Scholar] [CrossRef]
- Donohue, S.; O’Sullivan, C.; Long, M. Particle breakage during cyclic triaxial loading of a carbonate sand. Géotechnique 2009, 59, 477–482. [Google Scholar] [CrossRef]
- Xiao, Y.; Desai, C.S.; Daouadji, A.; Stuedlein, A.W.; Liu, H.L.; Abuel-Naga, H. Grain crushing in geoscience materials–key issues on crushing response, measurement and modeling: Review and preface. Geosci. Front. 2020, 59, 363–374. [Google Scholar] [CrossRef]
- Liu, H.S.; Mead, J.L.; Stacer, R.G. Environmental effects of recycled rubber in light-fill applications. Rubber Chem. Technol. 2000, 73, 551–564. [Google Scholar] [CrossRef]
- Liu, L.; Cai, G.; Liu, S. Compression properties and micro-mechanisms of rubber-sand particle mixtures considering grain breakage. Constr. Build. Mater. 2018, 187, 1061–1072. [Google Scholar] [CrossRef]
- Deng, A.; Feng, J.R. Experimental study on sand-shredded tire lightweight fills. J. Build. Mater. 2010, 13, 116–120. [Google Scholar]
- Lee, J.H.; Salgado, R.; Bernal, A.; Lovell, C.W. Shredded tires and rubber-sand as lightweight backfill. J. Geotech. Geoenviron. Eng. 1999, 125, 132–141. [Google Scholar] [CrossRef]
- Zheng, Y.F.; Sutter, K.G. Dynamic properties of granulated rubber/sand mixtures. Geotech. Test. J. 2000, 23, 338–344. [Google Scholar]
- Falborski, T.; Jankowski, R. Experimental study on effectiveness of a prototype seismic isolation system made of polymeric bearings. Appl. Sci. 2017, 7, 808. [Google Scholar] [CrossRef]
- Lee, C.; Truong, Q.H.; Lee, W.; Lee, J.S. Characteristics of rubber-sand particle mixtures according to size ratio. J. Mater. Civ. Eng. 2010, 22, 323–331. [Google Scholar] [CrossRef]
- Lopera Perez, J.C.; Kwok, C.Y.; Senetakis, K. Effect of rubber size on the behaviour of sand-rubber mixtures: A numerical investigation. Comput. Geotech. 2016, 80, 199–214. [Google Scholar] [CrossRef]
- Liu, X.; Yang, J. Influence of size disparity on small-strain shear modulus of sand-fines mixtures. Soil Dyn. Earthq. Eng. 2018, 115, 217–224. [Google Scholar] [CrossRef]
- Lan, H.X.; Chen, J.H.; Macciotta, R. Universal confined tensile strength of intact rock. Sci. Rep. 2019, 9, 6170. [Google Scholar] [CrossRef]
- Dullien, F.A. Porous Media: Fluid Transport and Pore Structure; Academic Press: Cambridge, MA, USA, 2012. [Google Scholar]
- Liu, X.; Yang, J. Shear wave velocity in sand: Effect of grain shape. Géotechnique 2018, 68, 742–748. [Google Scholar] [CrossRef]
- Guida, G.; Sebastiani, D.; Casini, F.; Miliziano, S. Grain morphology and strength dilatancy of sands. Geotech. Lett. 2019, 9, 245–253. [Google Scholar] [CrossRef]
- British Standard Institute (BSI). Methods of Test for Soils for Civil Engineering Purpose; BS1377; British Standard Institute: London, UK, 1990. [Google Scholar]
- Liu, X.; Yang, J.; Wang, G.H.; Chen, L.Z. Small-strain shear modulus of volcanic granular soil: An experimental investigation. Soil Dyn. Earthq. Eng. 2016, 86, 15–24. [Google Scholar] [CrossRef]
- Yang, J.; Liu, X. Shear wave velocity and stiffness of sand: The role of non-plastic fines. Géotechnique 2016, 66, 1–15. [Google Scholar] [CrossRef]
- Liu, X.; Zhang, N.; Lan, H.X. Effects of sand and water contents on the small-strain shear modulus of loess. Eng. Geol. 2019, 260, 105–202. [Google Scholar] [CrossRef]
- Hardin, B.O. Crushing of Soil Particles. J. Geotech. Eng. 1985, 111, 1177–1192. [Google Scholar] [CrossRef]
- Peng, Y.; Ding, X.; Xiao, Y.; Deng, X.; Deng, W. Detailed amount of particle breakage in non-uniformly graded sands under one-dimensional compression. Can. Geotech. J. 2020, 57, 1239–1246. [Google Scholar] [CrossRef]
- Han, L.; Wei, H.; Wang, F. Study on the vibration isolation performance of composite subgrade structure in seasonal frozen regions. Appl. Sci. 2020, 10, 3597. [Google Scholar] [CrossRef]
- Liu, H.; Luo, G.; Gong, Y.; Wei, H. Mechanical properties, permeability, and freeze–thaw resistance of pervious concrete modified by waste crumb rubbers. Appl. Sci. 2018, 8, 1843. [Google Scholar] [CrossRef]
- Liu, X. Laboratory Investigation of Dynamic Properties of Sand with Fines. Ph.D. Thesis, The University of Hong Kong, Hong Kong, China, 2016. [Google Scholar]
- Ishihara, K. Soil Behaviour in Earthquake Geotechnics; Oxford Science Publications: Oxford, UK, 1996. [Google Scholar]
- Liu, X.; Qin, H.; Lan, H.X. On the relationship between soil strength and wave velocities of sandy loess subjected to freeze-thaw cycling. Soil Dyn. Earthq. Eng. 2020, 136, 106216. [Google Scholar] [CrossRef]


© 2020 by the authors. Licensee MDPI, Basel, Switzerland. This article is an open access article distributed under the terms and conditions of the Creative Commons Attribution (CC BY) license (http://creativecommons.org/licenses/by/4.0/).
Share and Cite
Liu, X.; Tian, C.; Lan, H. Laboratory Investigation of the Mechanical Properties of a Rubber–Calcareous Sand Mixture: The Effect of Rubber Content. Appl. Sci. 2020, 10, 6583. https://doi.org/10.3390/app10186583
Liu X, Tian C, Lan H. Laboratory Investigation of the Mechanical Properties of a Rubber–Calcareous Sand Mixture: The Effect of Rubber Content. Applied Sciences. 2020; 10(18):6583. https://doi.org/10.3390/app10186583
Chicago/Turabian StyleLiu, Xin, Chaoyang Tian, and Hengxing Lan. 2020. "Laboratory Investigation of the Mechanical Properties of a Rubber–Calcareous Sand Mixture: The Effect of Rubber Content" Applied Sciences 10, no. 18: 6583. https://doi.org/10.3390/app10186583
APA StyleLiu, X., Tian, C., & Lan, H. (2020). Laboratory Investigation of the Mechanical Properties of a Rubber–Calcareous Sand Mixture: The Effect of Rubber Content. Applied Sciences, 10(18), 6583. https://doi.org/10.3390/app10186583