Article

Study on Mechanical Properties and Cracking Mode of Coal Samples under Compression–Shear Coupled Load Considering the Effect of Loading Rate

1
State Key Laboratory for Geomechanics and Deep Underground Engineering, China University of Mining and Technology, Xuzhou 221116, China
2
School of Mechanics and Civil Engineering, China University of Mining and Technology, Xuzhou 221116, China
3
College of Mining Engineering and Geology, Xinjiang Institute of Engineering, Urumqi 830091, China
4
State Key Laboratory of Coal Resources and Safe Mining, China University of Mining and Technology, Xuzhou 221116, China
*
Authors to whom correspondence should be addressed.
Appl. Sci. 2020, 10(20), 7082; https://doi.org/10.3390/app10207082
Submission received: 25 August 2020 / Revised: 6 October 2020 / Accepted: 8 October 2020 / Published: 12 October 2020
(This article belongs to the Special Issue Advances in Geotechnical Engineering)

Abstract

:
Under coupled compression–shear loading, the failure and instability behavior of inclined pillars is different from that of horizontal pillars. To enhance the reliability and accuracy of pillar strength design, the influence of different inclination angles and loading rates on mechanical property and the failure behavior of inclined pillar should be studied. In this paper, the combined compression and shear test (C-CAST) system was developed, and mechanical properties and macro failure behavior of coal samples under different inclination angles and loading rates were studied, and acoustic emission (AE) technology was used to determine the internal cracking mode of the sample. The results show that with the increase of inclination angle, the peak shear stress of coal sample increases gradually, while the peak axial stress and elastic modulus slightly increase first and then decrease, and reach the maximum value at an inclination angle of 5°. Within the inclination angle range of 0°–15°, with the increase of loading rate, the peak axial stress and elastic modulus of coal samples first increase and then decrease, while the loading rate corresponding to peak axial stress and elastic modulus decreases. Within the inclination angle range of 20°–25°, the peak axial stress and elastic modulus of the sample gradually decrease with the increase of loading rate. The failure mode of coal samples changes from tension-splitting failure (0°–5°), tension–shear composite failure (10°) to single shear failure (15°–25°). Meanwhile, the loading rate has little effect on the failure mode of coal samples, but has a significant effect on the failure degree. When the loading rate is 1.0 and 10 mm/min and the inclination angle ranges from 0°–5°, the proportion of tensile crack is significantly greater than that of the shear crack, and tensile failure is the main failure mode; when the inclination angle ranges from 10°–25°, the proportion of shear crack is more than 50% and increases gradually with the increase of inclination angle, and shear failure is the main failure mode. This law is consistent with the macroscopic failure mode of the sample.

1. Introduction

During the mining process, the stability of coal pillars is the premise of safe and efficient mining. Empirical formula [1,2,3] and numerical simulations [4,5,6] are widely used to study the strength and stability of pillars. However, pure compression load is assumed to be applied to coal pillars in these studies. In engineering, coal pillars often have certain inclination angles and are subjected to combined compression and shear loading. The shear stress component is conducive to the initiation and expansion of pillar cracks, which is one of the important reasons for shear instability of inclined pillars. In laboratory tests, uniaxial compression [7,8,9,10,11,12], biaxial compression [13,14], triaxial compression [15,16,17,18,19], Brazilian splitting [20,21] and shear tests [22,23,24] are widely employed to study the deformation and failure behavior of rock samples under different loading conditions. However, these studies have certain limitations, namely the actual situation of the coupled compression–shear loading on inclined pillars cannot be effectively simulated. Besides, as an important factor affecting the structural stability of inclined pillars, mining strength has a certain mapping relationship with the loading rate in the laboratory loading process of coal samples [25]. Therefore, it is important to study the effect of loading rate on the mechanical property and failure behavior of coal samples under the coupled compression–shear loading to reveal the instability mechanism of the inclined pillar under the mining.
Studies have shown that the strain rate has an important impact on the mechanical properties of coal rock [26]. Based on the triaxial compression test (under the fixed confining pressure of 50 MPa), Hou et al. [27] conducted a study on the mechanical and failure behavior of shale under different strain rates (5 × 10⁻⁶ s−1–1 × 10⁻³ s−1). The results showed that with the increase of strain rate, the peak strength of the sample increases gradually; when the strain rate is less than 1 × 10⁻⁵ s−1, the single shear failure mode is presented on the failure surface, and when the strain rate is greater than 1 × 10⁻⁵ s−1, the surface cracks are crisscross and interlinked and distributed in a complex form. Lajtai et al. [28] concluded that the influence of strain rate on the strength of ductile salt rock is more significant than that of brittle limestone. Wasantha et al. [29] and Alam et al. [30] studied the strain rate sensitivity of sandstone with different sizes under the uniaxial compression, and proposed an empirical equation correlating the dynamic increment factor with the applied strain rate. Okubo et al. [31] conducted uniaxial compression tests on type I and type II rock, and concluded that the peak strength of type II rock increases with the increase of strain rate. Li et al. [32] and Li et al. [33] carried out the uniaxial compression tests of coal samples under different loading rates. However, different results were obtained. Li et al. [32] reported that the uniaxial compressive strength first increases and then decreases with the increase of loading rate, while Li et al. [33] claimed that the uniaxial compressive strength tends to increase gradually. However, in the above research, the influence of coupled compression–shear loading mode on the mechanical response of coal samples are ignored.
Besides, research on the dynamic impact failure behavior of rock or non-rock materials under the coupled compression–shear loading has been widely studied. Baker and Yew [34] studied the pure shear failure behavior of rock under the dynamic loading by using an improved torsional split Hopkinson bar (TSHB) experimental system; Huang and Feng [35] introduced the modified TSHB test system into the field of rock mechanics to study the dynamic friction and shear effects of closed cracks. Xu and Dai [36] used an improved split Hopkinson pressure bar (SHPB) system to study the dynamic behavior and failure mechanism of brittle rock under the coupled compression–shear loading. Some scholars made inclined cuboid samples by using synthetic materials [37,38] for dynamic compression and shear tests, and have achieved rich results. However, the mechanical state of coal samples cannot be effectively reflected in the dynamic impact test, because long-term strength is required for the long service life of coal pillars.
To more effectively reveal the failure and instability mechanism of inclined pillars under mining, the combined compression and shear test (C-CAST) system was independently developed in this paper, and the evolution law of static mechanical properties and failure behavior of coal samples with loading rate under the coupled compression–shear loading was carried out. Firstly, the structural characteristics of combined compression and shear test (C-CAST) system are described in detail. Secondly, the traditional uniaxial and inclined uniaxial compression tests of coal samples under different loading rates were carried out by the C-CAST system, and the effects of different loading rates and inclination angles on the mechanical properties and macro failure modes of coal samples were studied. Finally, based on the acoustic emission waveform characteristics, the evolution law of crack mode under different loading rates and inclination angles was analyzed. This paper provides an important reference for the prediction of pillar instability and pillar design in coal mines.

2. Materials and Methods
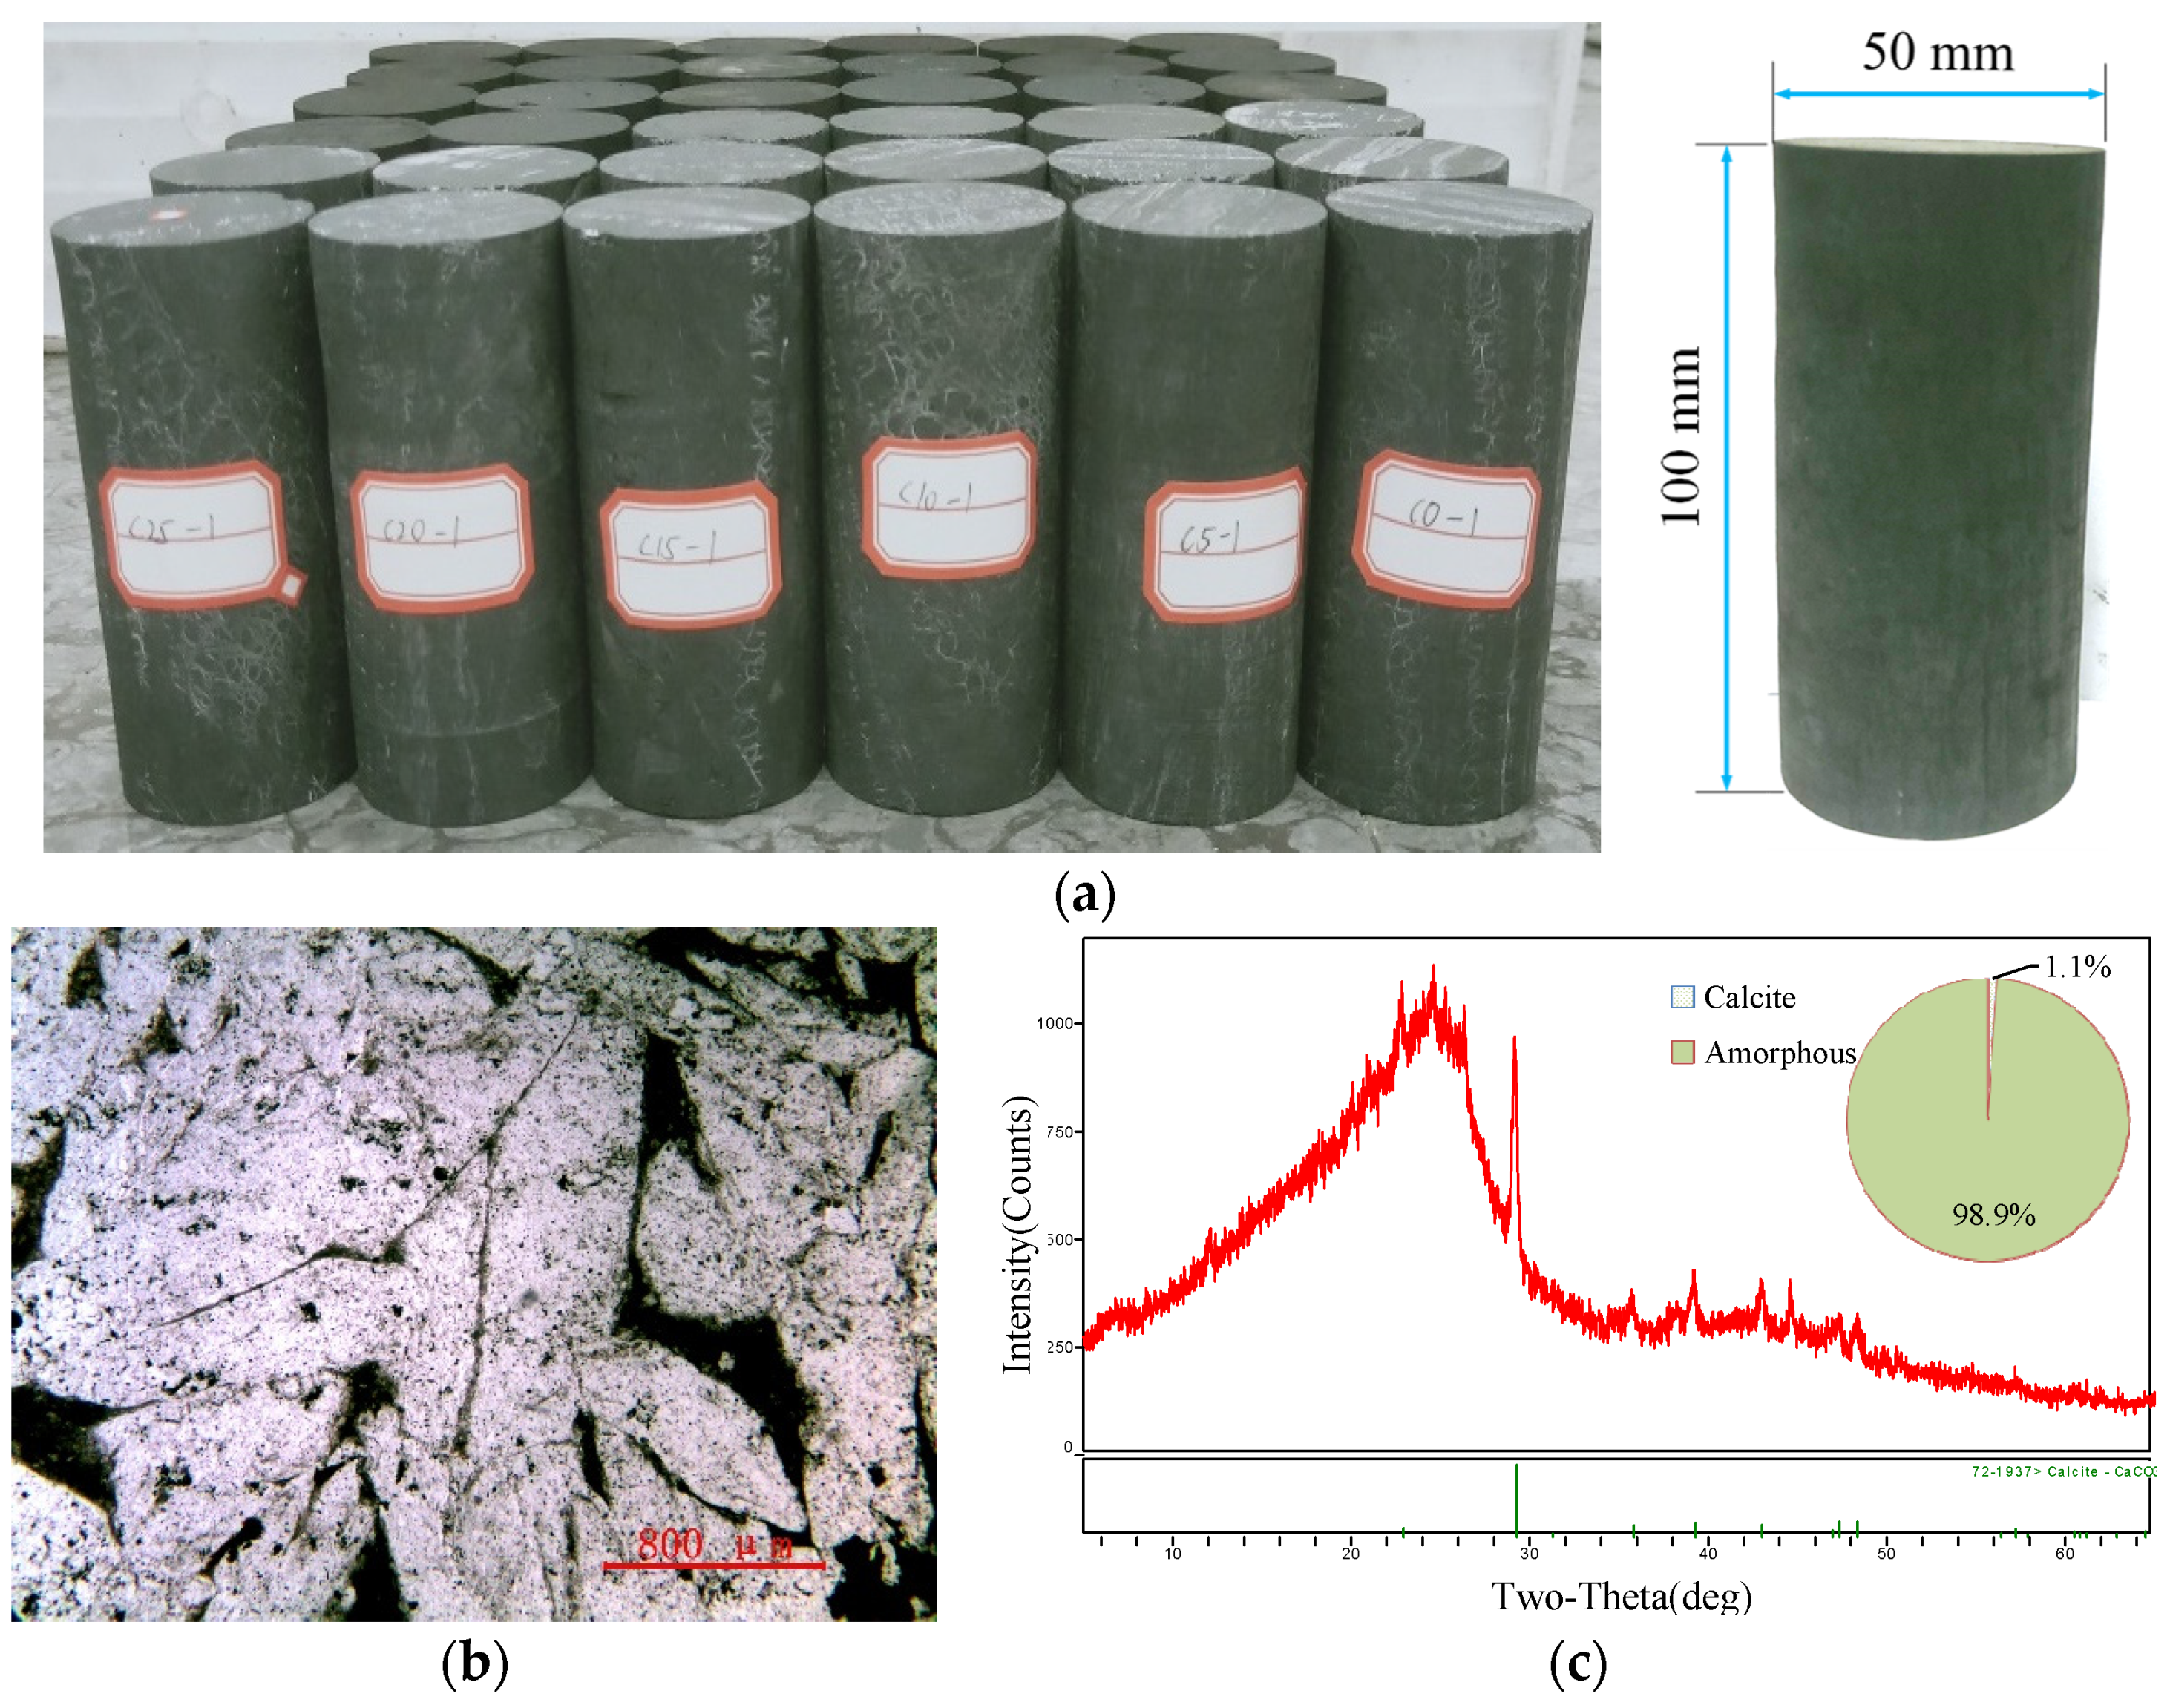
2.1. Materials

The coal samples were taken from the coal pillar side of working face in an underground coal mine. One side of coal pillar was goaf and the other side was the intake roadway of the working face 1201. The coal rank of the test coal sample belongs to anthracite. The results of the in situ stress test showed that the angle between the maximum principal stress direction and the vertical direction of the coal pillar was about 16°. These samples were drilled by the coring method in the underground; fresh-keeping film and sealing bag were used to prevent water evaporation in coal samples. According to the criterion of International Society for Rock Mechanics (ISRM) [39], the coal body was first processed into a standard cylinder with a diameter of 50 mm and a height of 100 mm by electric cutting machine. Then the two end faces of the cylinder were ground with a grinding machine, and the surface was polished with sandpaper to ensure that there was no obvious damage and crack on the end surface and surface of coal samples. Figure 1 shows a part of the processed samples and mineralogical features. After the preparation of the samples, the mass, diameter, height and wave velocity of the samples were measured, and 240 coal samples with similar wave velocity were selected for subsequent experiments. Microscopic image (Figure 1b) shows that the coal sample has some cracks and holes. According to the X-ray Diffraction (XRD) pattern analysis result (Figure 1c), calcite and amorphous were the mineral composition of coal samples, accounting for 1.1% and 98.9%.

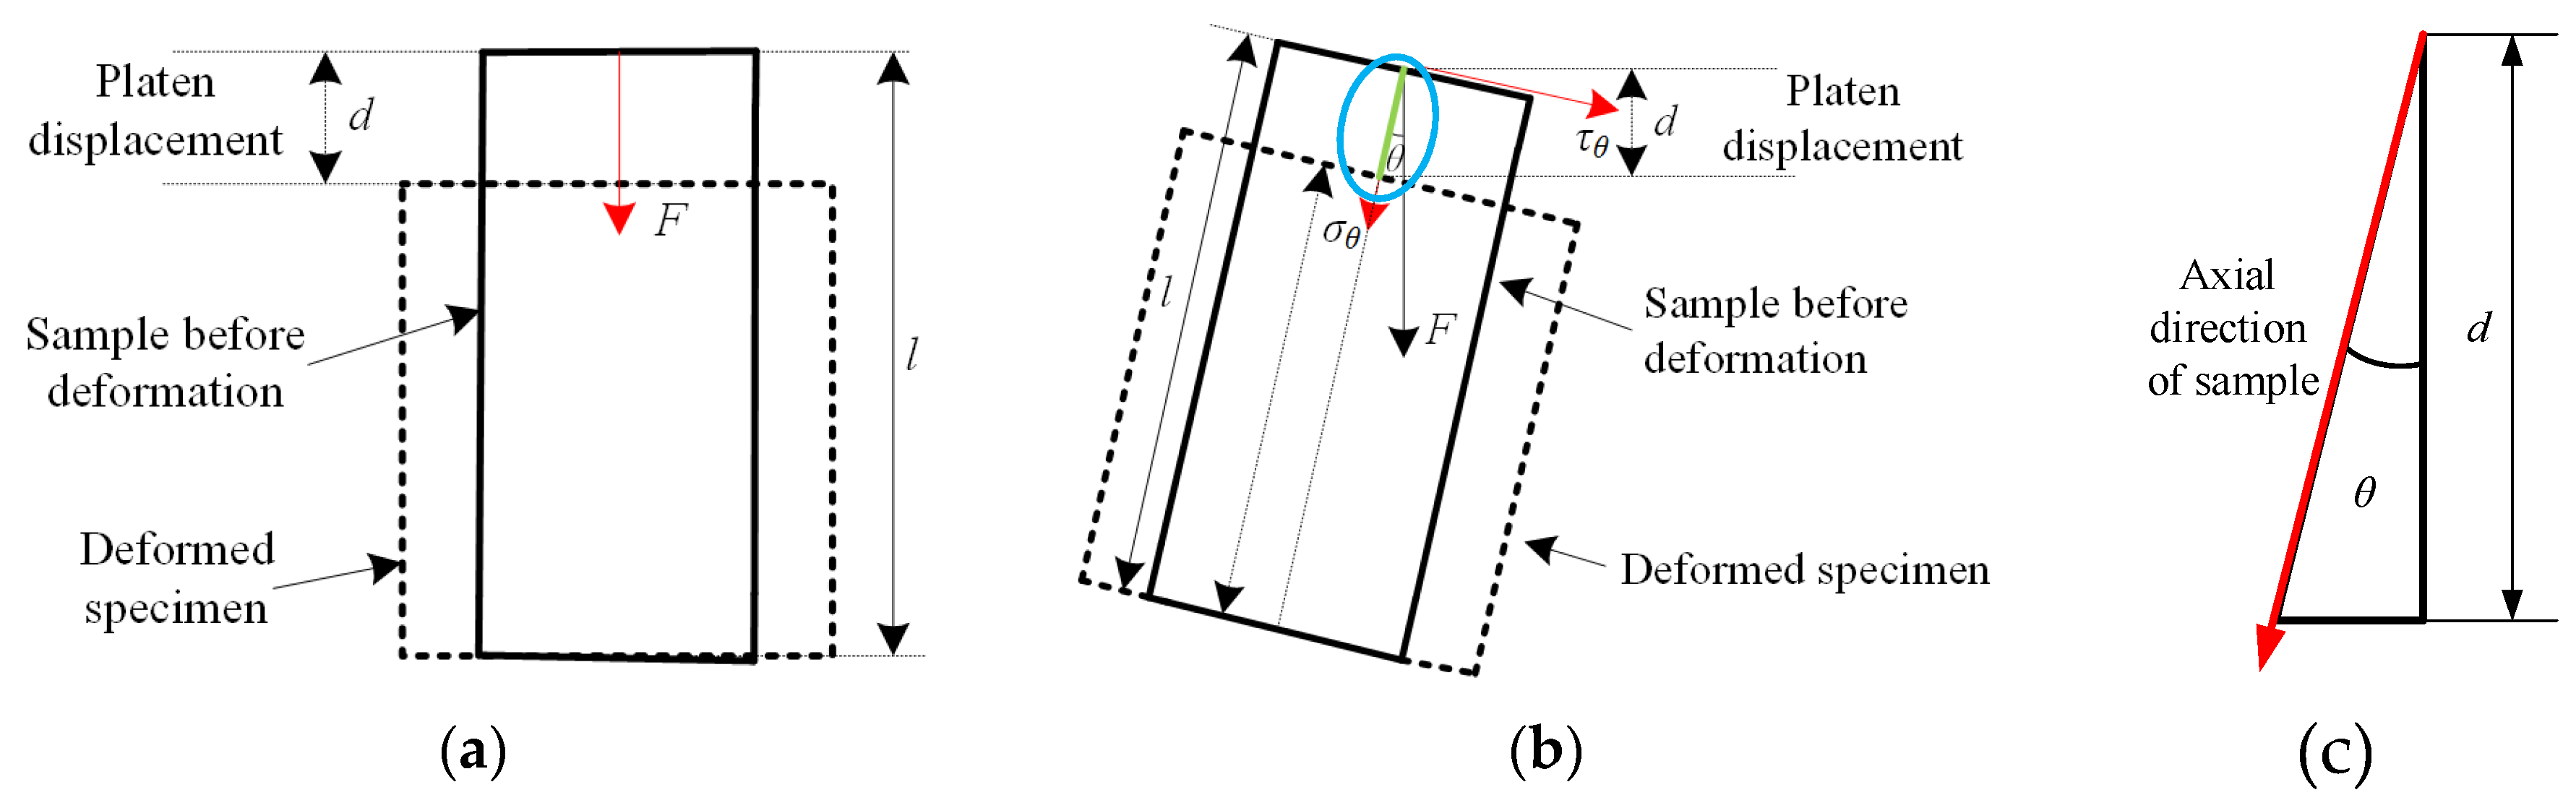
2.2. Experimental Equipment and Strength Calculation Method

The equipment used in this experiment mainly includes C64.106/1000 kN electro-hydraulic servo universal testing machine (Figure 2) and C-CAST experimental system (Figure 3). Figure 3a,b show the physical diagram and 3D structure diagram of C-CAST system, respectively. The C-CAST system is mainly composed of the top adapter, the bottom adapter, the limiting groove and the connecting components. The top and bottom adapters have the same structure and are symmetrically arranged in the experiment, consisting of the base and the locating dial [40,41]. The experimental system can realize the inclined loading of coal and rock samples, with an inclination range of 0°–30° and an interval of 5°.
The installation process of the experimental system can be divided into four steps. Firstly, the upper and lower locating dials are rotated to the specified angle according to the experimental requirements, and fixed on the corresponding adapter by bolts; secondly, the prefabricated standard coal samples are placed in the circular groove (the design depth is 10 mm) of the locating dial, and then the supporting accessories are installed into the limiting groove to prevent the slippage extrusion failure; thirdly, the top adapter installed with the sample is fixed on the loading end of the electro-hydraulic servo universal testing machine through a rigid fixed ring, so as to realize the servo control during the loading process of the sample; lastly, through the fine-tuning testing machine, the sample is slowly inserted into the circular slot of the locating dial of the bottom adapter. After the above installation, experiments can be carried out according to the loading scheme. The specific structural assembly of C-CAST system is shown in Figure 3.
Figure 4 shows the deformation and stress condition of coal samples under traditional uniaxial compression and inclined uniaxial compression, respectively. As shown in Figure 4, when the load applied by the testing machine to the end of coal samples is perpendicular to the axial direction of the sample, the axial stress and axial strain can be expressed as follows:
σ = F/A,
ε = d/l,
where σ and ε are the axial stress and axial strain of coal samples, respectively; F is the vertical pressure applied by the testing machine to the end face of the sample; A is the cross-sectional area of the coal sample; d is the total vertical displacement of the testing machine after coal samples are loaded and damaged, namely the vertical compression displacement of the sample under the traditional uniaxial compression; and l is the initial height of the sample.
When the vertical load applied by the testing machine to the end face of coal samples is distributed at an angle with the axial direction of coal samples, additional shear stress will be generated at the end face of coal samples. The vertical load applied by the testing machine on the end face of coal samples is decomposed into the compressive stress along the axial direction of coal samples and the shear stress parallel to the end face of coal samples. Subsequently, under the inclined uniaxial compression, the axial stress component, axial strain, shear stress component and shear displacement of the sample can be expressed as [40,41]
σθ = Fcosθ/A,
εθ = d/(lcosθ),
τθ = Fsinθ/A,
sθ = dtanθ/cosθ,
where θ is the inclination angle of coal samples; σθ and τθ are the axial stress component and shear stress component of coal samples under inclined uniaxial compression; εθ is the axial strain of coal samples under inclined uniaxial compression; and sθ is the shear displacement of coal samples under the inclined uniaxial compression.
Equations (3)–(6) are simplified calculation forms of stress component of coal samples under inclined uniaxial compression to reveal the stress state of coal samples. This is of great significance to analyze the influence of shear stress component on the mechanical property and failure behavior of coal samples.

2.3. Experimental Scheme

In this experiment, the C-CAST experimental system was used to study the mechanical property and failure behavior of coal samples under different loading rates and inclination angles. However, C-CAST system also has a limitation. When the inclination angle of the sample is greater than 30°, it is difficult to exclude the large experimental error caused by the slip and dislocation of the adapter in the horizontal direction under the C-CAST system. Therefore, 6 groups of inclination angles were set in this experiment, namely 0°, 5°, 10°, 15°, 20° and 25°; 8 groups of loading rates were set, namely 0.05, 0.50, 1.00, 2.00, 3.50, 5.00, 7.50 and 10.00 mm/min. Each group of experiments was repeated 5 times; the maximum and minimum values were removed, respectively, and the middle three groups of experimental results were taken as the research data.
The specific experimental steps are as follows:
Firstly, according to the installation steps of C-CAST system, the installation of test sample and equipment under specific inclination angle is completed. The top adapter of C-CAST system installed with sample is fixed on the loading end of electro-hydraulic servo universal testing machine through a rigidly fixed ring, and the top adapter of the system is located in the middle of the loading end.
Secondly, petroleum jelly is applied on the end face of the sample to reduce the friction between the end of the sample in the circular groove and the surface of the circular groove in the scale disk to avoid the stress concentration. The universal testing machine is fine-tuned, the exposed end of the sample is slowly inserted into the circular groove of the lower scale disk of the C-CAST system, then the support block is installed and the test sample is fixed.
Thirdly, the acoustic emission probe is pasted on the coal sample surface, and the installation position is arranged symmetrically and 30 mm away from the end face of the sample. There are four acoustic emission probes in total, and then the lead breaking experiment is carried out to ensure the sound coupling between the acoustic emission probe and the sample, as shown in Figure 3. The prestress of the testing machine is set to be 0.1 kN, that is, when the loading load of the sample reaches 0.1 kN, the experimental data will be recorded.
Fourthly, the program-controlled system of the universal testing machine is used, and the initial loading rate is set at 3 mm/min. when the prestress reaches 0.1 kN, the loading process is terminated automatically. At this time, it is necessary to check whether the sample is completely fixed in the C-CAST system. If the sample is not fixed, the location of the bottom adapter is adjusted, then the experimental program and the preloading is started again. If the sample is well fixed, the next step is performed
Lastly, after debugging all the equipment, the loading rate of the testing machine is set to the specified value according to the experimental scheme. At the same time, the testing machine and the acoustic emission acquisition system are started to ensure the synchronization of the collected data. When the sample is damaged, the above experimental system is terminated, and then the data are saved.
Slowly raise the testing machine, remove the sample, repeat steps 1–5., and carry out the next set of experiments.

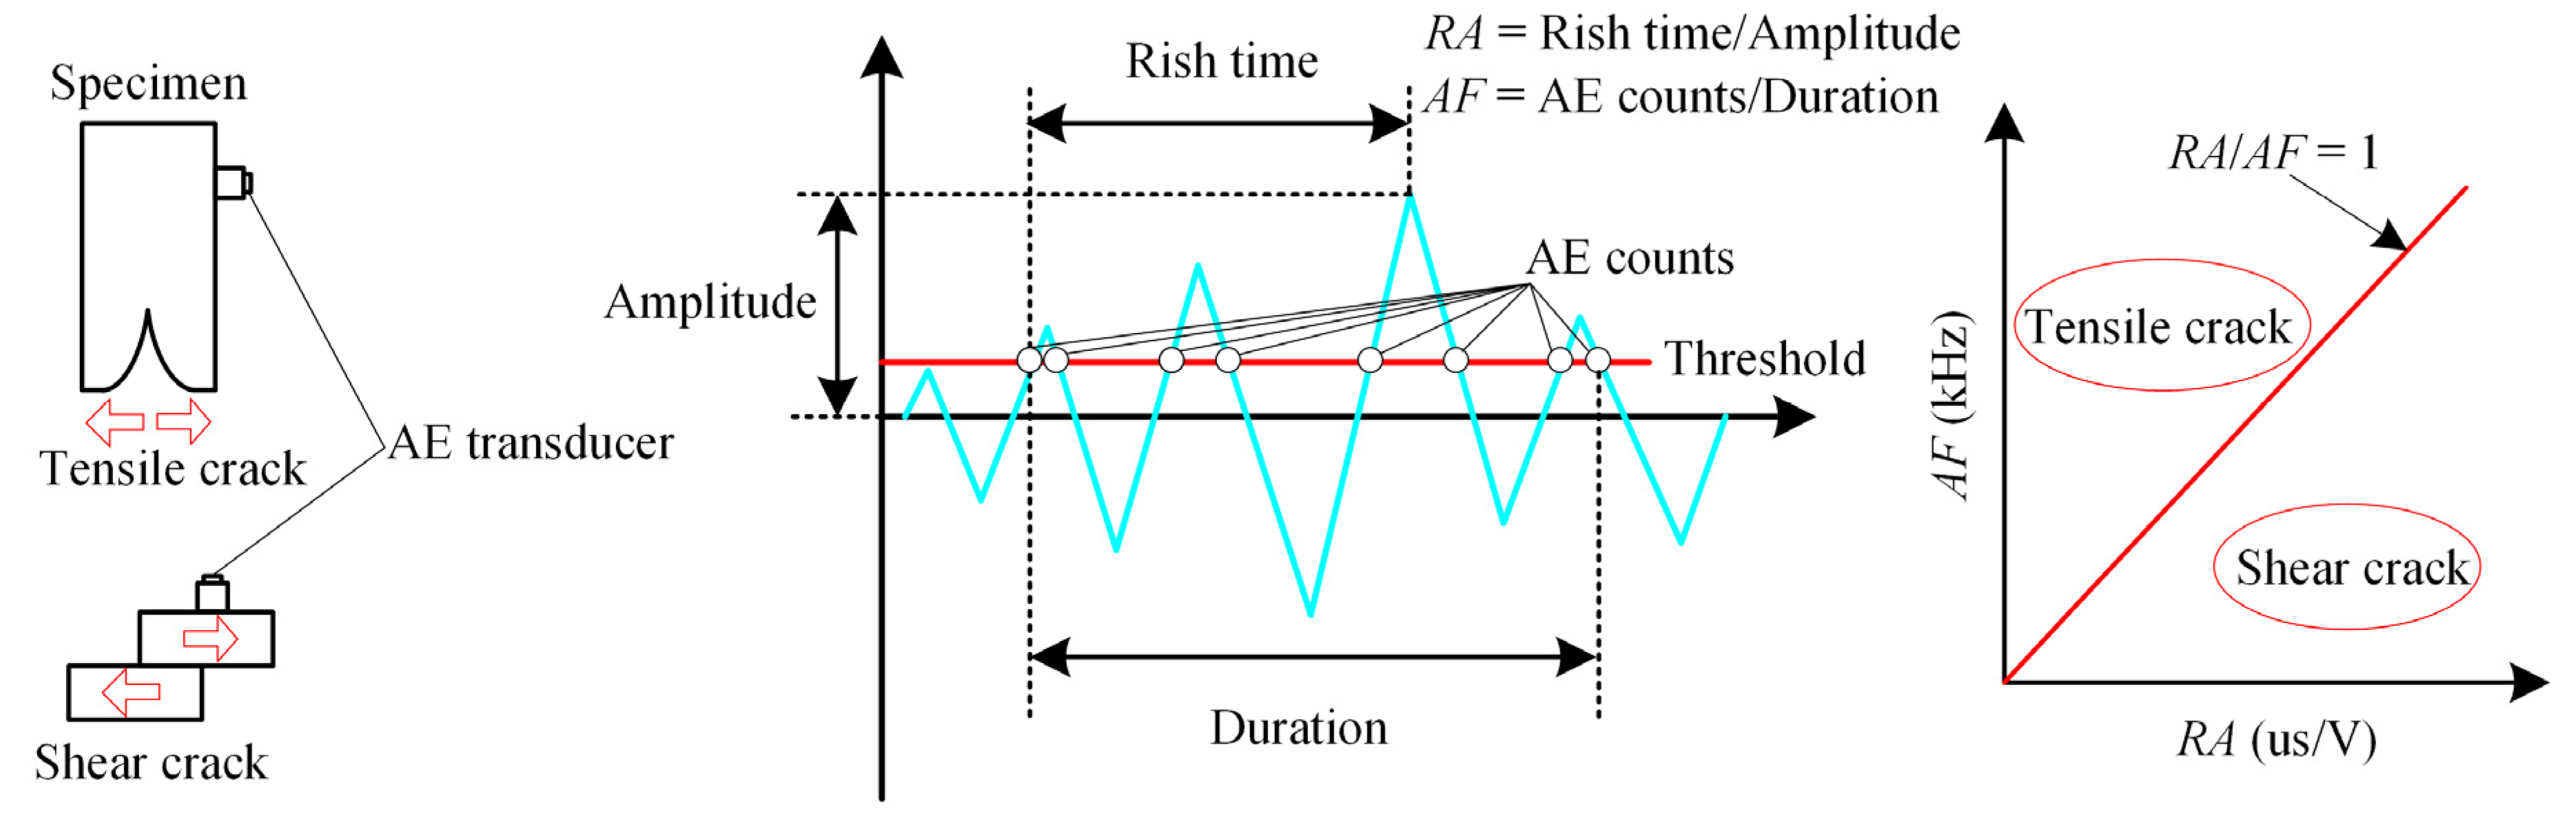
2.4. Acoustic Emission Characterization of Cracking Mode

In essence, the failure process of coal samples under load is a gradual initiation and coalescence of tension and shear cracks. In this process, the distribution of cracks is highly associated with the failure behavior of coal samples and is significantly affected by external loads. Therefore, the research on the cracking mode of coal samples under different loading rates and inclination angles is carried out to reveal the instability mechanism of inclined pillar under mining from the microscopic point of view. Acoustic emission waveform analysis method has been proved to be an important technical means to study material crack mode, and widely used in civil engineering [42,43], mining engineering [44,45] and material science [46].
In this experiment, four RS-54A acoustic emission (AE) sensors were symmetrically arranged. The sampling frequency was set at 3 MHz, the preamplifier was 40 dB, and the threshold value was 0.1 V. To ensure the acquisition accuracy, the peak definition time (PDT), impact definition time (HDT) and impact locking time (HLT) were set as 50, 100 and 500 μs, respectively.
The cracking mode of coal samples during loading can be characterized by the ratio of average frequency (AF) and rising angle (RA) of acoustic emission event characteristic parameters. Figure 5 shows the schematic diagram of the typical AE waveform and characteristic parameters. The characteristic parameters of single event acoustic emission waveform mainly include minimum amplitude and maximum amplitude (B), duration from minimum amplitude to maximum amplitude (RT), total duration of acoustic emission (DT) and cumulative ringing count (CR). The RA can be determined by RT and B, while the AF can be determined by CR and DT. The specific expression is shown in Equations (7) and (8) [44,45]. In this paper, the ratio of RA to AF is used to judge the crack mode. When RA/AF is less than 1, tensile crack is the visible crack type; when RA/AF is greater than 1, shear crack is the visible crack type. This method has been used by many scholars and its accuracy has been widely verified [47].
RA = RT/B,
AF = CR/DT,

3. Experimental Results Analysis

3.1. Effect of Loading Rate and Inclination Angle on the Axial Stress–Strain Curve

As shown in Figure 6a–f, the relationship curve between axial stress component and axial strain of coal samples under different loading rates and inclination angles is obtained by the method described in Section 2.2. To clearly describe the characteristics of the axial stress component and axial strain curve, Figure 6g shows the typical axial stress and strain curve of the sample in this experiment. According to the characteristics of curves, they can be divided into two types. When the inclination angle of samples within is 0°–10°, the curve can be divided into four stages under any loading rate: the initial compression stage, near-linear elastic stage, nonlinear crack growth stage and post-peak instantaneous drop stage; brittle failure characteristics are observed, and this curve belongs to the type I curve. When the inclination angle is within 15°–25°, the curve can be divided into four stages: initial compression stage, near-linear elastic stage, nonlinear crack growth stage and post-peak softening and attenuation stage; plastic deformation are observed, and this curve belongs to the type II curve. Overall, the pre-peak sections of type I and II curves are similar, but the post-peak sections are different. For the characteristic curve of type I, when the peak strength of the sample is reached, the post-peak curve shows the characteristics of rapid drop and large modulus reduction. This indicates that the internal microcracks of the sample have penetrated and extended to the surface of the sample, and a macroscopic crack has been formed, leading to the complete failure of the sample. For a characteristic type II curve, obvious strain softening appears at the post-peak stage, showing plastic deformation characteristics. Due to the influence of inclination effect, the friction effect around the crack in coal increases, leading to the inhibition of the sliding of macro failure surface and the low residual strength. At this point, the sample still has a certain bearing capacity after being damaged. Thus, the mechanical property and deformation behavior of coal samples under the coupled compression–shear loading is highly correlated with the inclination angle [40,41]. Figure 6 shows the typical axial stress–strain curve of coal samples in this experiment.
As shown in Figure 6, the loading rate and inclination angle not only have a great impact on the post-peak of axial stress–strain curve of coal samples, but also have a significant impact on its mechanical properties such as peak compressive strength and elastic modulus. This is probably caused by the shear stress component under the coupled compression–shear loading, which will be studied in detail below.

3.2. Effect of Loading Rate and Inclination Angle on Shear Stress Componen–Shear Displacement Curve

According to the method described in Section 2.2, the relationship between the shear stress component and shear displacement of coal samples under different loading rates and inclination angles are obtained, as shown in Figure 7. When the inclination angle is 0°, the vertical load applied by the testing machine is parallel to the axial direction of coal samples, and the shear stress component of coal samples is 0. According to the analysis in Figure 7, it is obtained that with the increase of inclination angle, the shear displacement corresponding to the peak shear stress component of the sample increases gradually, indicating that inclination angle has a significant influence on the shear performance. Meanwhile, at the same loading rate, with the increase of the inclination angle, the peak shear stress also increases gradually, indicating that the shear stress component of the sample is closely related to its inclination angle. At the same time, in general, the shear stress component–shear displacement curve of coal samples has four stages at any loading rate, namely the initial compression stage, the near-linear elastic stage, the nonlinear crack growth stage and the post-peak drop stage. The characteristics of this curve are consistent with the axial stress–strain relation curve. Moreover, at any loading rate, with the increase of inclination angle, the compaction stage increases, indicating that the shear stress component is not conducive to the closure of the original crack in coal samples. Lastly, at any inclination angle, with the increase of the loading rate, the peak shear stress and curve characteristics are changed, indicating that the loading rate has a significant impact on the shear properties of coal samples.

3.3. Effect of Loading Rate and Inclination Angle on Peak Shear Stress

Figure 8 shows the variation of shear stress components with loading rate and inclination angle. Table 1 shows the corresponding shear stress component data. As shown in Figure 8a, with the increase of the inclination angle at the constant loading rate, the peak shear stress component nonlinearly increases. For example, at the loading rate of 0.05 mm/min, when the inclination angle increases from 5°–15°, the peak shear stress increases by 1.11 MPa or 138.75%; when the inclination angle increases from 15°–25°, the peak shear stress increases by 0.62 MPa or 32.46%. At the loading rate of 10 mm/min, when the inclination angle increases from 5°–15°, the peak shear stress increases by 0.38 MPa or 54.29%; when the inclination angle increases from 15°–25°, the peak shear stress increases by 0.34 MPa or 31.48%. In general, the peak shear stress increases greatly in the low range of inclination angle, but decreases in the high range of inclination angle. This is related to the weakening effect of shear stress components on the strength of coal samples, which will be detailed in Section 3.4.
As shown in Figure 8b, when the inclination angle is 20° and 25°, the peak shear stress component shows a nonlinear decreasing trend, but the slope of the relationship curve of the peak shear stress component and the loading rate decreases gradually. At the inclination angle of 25°, when the loading rate increases from 0.05 to 1 mm/min, the peak shear stress decreases by 0.35 MPa or 13.83%; when the loading rate increases from 3.5 to 5 mm/min, the peak shear stress decreases only by 0.11 MPa or 5.82%. When the inclination angles are 5°, 10° and 15°, respectively, the peak shear stress increases first and then decreases with the increase of loading rate; the larger the inclination angle, the lower the loading rate required for the sample to reach the peak shear stress. This is related to the weakening effect of shear stress component on the loading rate effect of samples, which will be detailed in Section 3.4.

3.4. Effect of Loading Rate and Inclination Angles on Peak Axial Stress

Figure 9 shows the peak axial stress values of coal samples under different loading rates and inclination angles. For simplicity, only the data corresponding to the maximum of the variation coefficient under each inclination angle are given in the table. As shown in Table 2, the standard deviation and coefficient of variation of the experimental data obtained in this experiment are, respectively, within the range of 0.43–1.00 MPa and 10.12–11.13%, indicating the reliability of the experimental data [48]. Figure 9 shows the curve of average peak axial stress of coal sample changing with loading rate and inclination angle. As shown in Figure 9a, when the loading rate is constant, with the increase of the inclination angle of coal samples, the peak axial stress slowly increases and then gradually decreases, and reaches the maximum at the inclination angle of 5°. For example, when the inclination angle increases from 0°–5° at the loading rate of 3.5 mm/min, the peak axial stress increases from 11.74 to 12.25 MPa with an increase of 4.34%; when the inclination angle increases from 5°–10°, the peak axial stress decreases from 12.25 to 7.92 MPa, with a decrease of 35.35%.
In Figure 9b, when the inclination angle is within 0°–15°, the peak axial stress increases first and then decreases with the increase of loading rate. The larger the inclination angle, the lower the loading rate required for the sample to reach the maximum value. For example, when the inclination angles of coal samples are 0°, 5°, 10° and 15°, the loading rates corresponding to the peak axial stress are 3.5, 3.5, 2.0 and 0.5 mm/min, respectively. When the inclination angle is within the range of 20°–25°, the peak axial stress shows a nonlinear decrease with the increase of the loading rate. According to the variation characteristics of peak axial stress at the inclination angle of 0°–15°, the following explanation is given: in the range of low loading rate, with the gradual increase of loading rate, the internal cracks of coal samples cannot be fully developed, which effectively reduces the weakening effect of failure propagation on coal samples strength. Therefore, the characteristics of the high loading rate and high strength are observed. However, only when the solid structure around the fracture in the coal rock has high bearing capacity, will the coal rock show high strength performance under the high loading rate, and the rock material meets this requirement. For coal samples with the low strength, the increase of loading rate restrains the initiation and propagation of cracks, but it greatly increases the load-bearing capacity of the solid structure around the cracks at the same time. As a result, solid structure around the cracks break prematurely due to the overload. Therefore, within the range of high loading rate, the peak axial stress of the sample decreases gradually.
The difference of peak axial stress changing with the loading rate under different inclination angles is explained as follows: with the increase of inclination angle, the shear stress component also increases gradually, and the shear load is conducive to the initiation and propagation of micro cracks in the sample [40,41,49]. Therefore, the strengthening effect of loading rate on coal strength is weakened, and this effect is more obvious with the increase of inclination angle, until the strengthening effect of loading rate on the strength of the sample disappears completely. Eventually, the peak axial stress versus loading rate curve shows the characteristics of first increase and then decrease at low inclination angle and the continuous nonlinear decrease at a high inclination angle.

3.5. Effect of Loading Rate and Inclination Angle on the Elastic Modulus

Elastic modulus is an important index to characterize the deformation resistance of coal samples. In this paper, 40–60% of the peak stress in the axial stress–strain curve is selected as its experimental value. Table 3 presents the experimental values of elastic modulus of coal samples under different loading rates and inclination angles. Due to the space limitation, only the data corresponding to the maximum value of variation coefficient under each inclination angle are given. As shown in Table 3, the standard deviation and variation coefficient of the elastic modulus experimental data obtained in this experiment are, respectively, within the range of 13.81–46.91 MPa and 4.37–6.42%, indicating the reliability of the experimental data. According to Table 3, the change curve of elastic modulus with loading rate and inclination angle is drawn, as shown in Figure 10. In Figure 10a, when the loading rate is constant, with the increase of the inclination angle, the elastic modulus of the sample increases slowly and then decreases gradually, and reaches the maximum value at the inclination angle of 5°. This finding is consistent with that described in Section 3.4. For example, at the loading rate of 5 mm/min, when the inclination angle increases from 0° to 5°, the elastic modulus increases by 0.128 GPa or 16.48%; when the inclination angle increases from 5° to 10°, the elastic modulus decreases by 0.352 GPa or 38.76%. Therefore, the deformation resistance of the sample at the inclination angle of 5° is slightly higher than that at the vertical compression, which is also related to the bonding and friction effects between particles within the material [50].
In Figure 10b, when the inclination angle is in the range of 0° to 15°, with the increase of the loading rate, the elastic modulus of coal samples increases first and then decreases, and the larger the inclination angle, the lower the loading rate required for the sample to reach the maximum value. For example, when inclination angles are 0°, 5°, 10° and 15°, the loading rates corresponding to the maximum elastic modulus are 3.5, 3.5, 2.0 and 0.5 mm/min, respectively. When the inclination angle is in the range of 20° to 25°, the elastic modulus decreases nonlinearly with the increase of loading rate. Based on the above analysis, the variation of elastic modulus with loading rate and inclination angle is consistent with the peak axial stress. Due to the heterogeneity of coal samples, a certain deviation is generated in a small number of experimental results. However, it does not affect the conclusion.

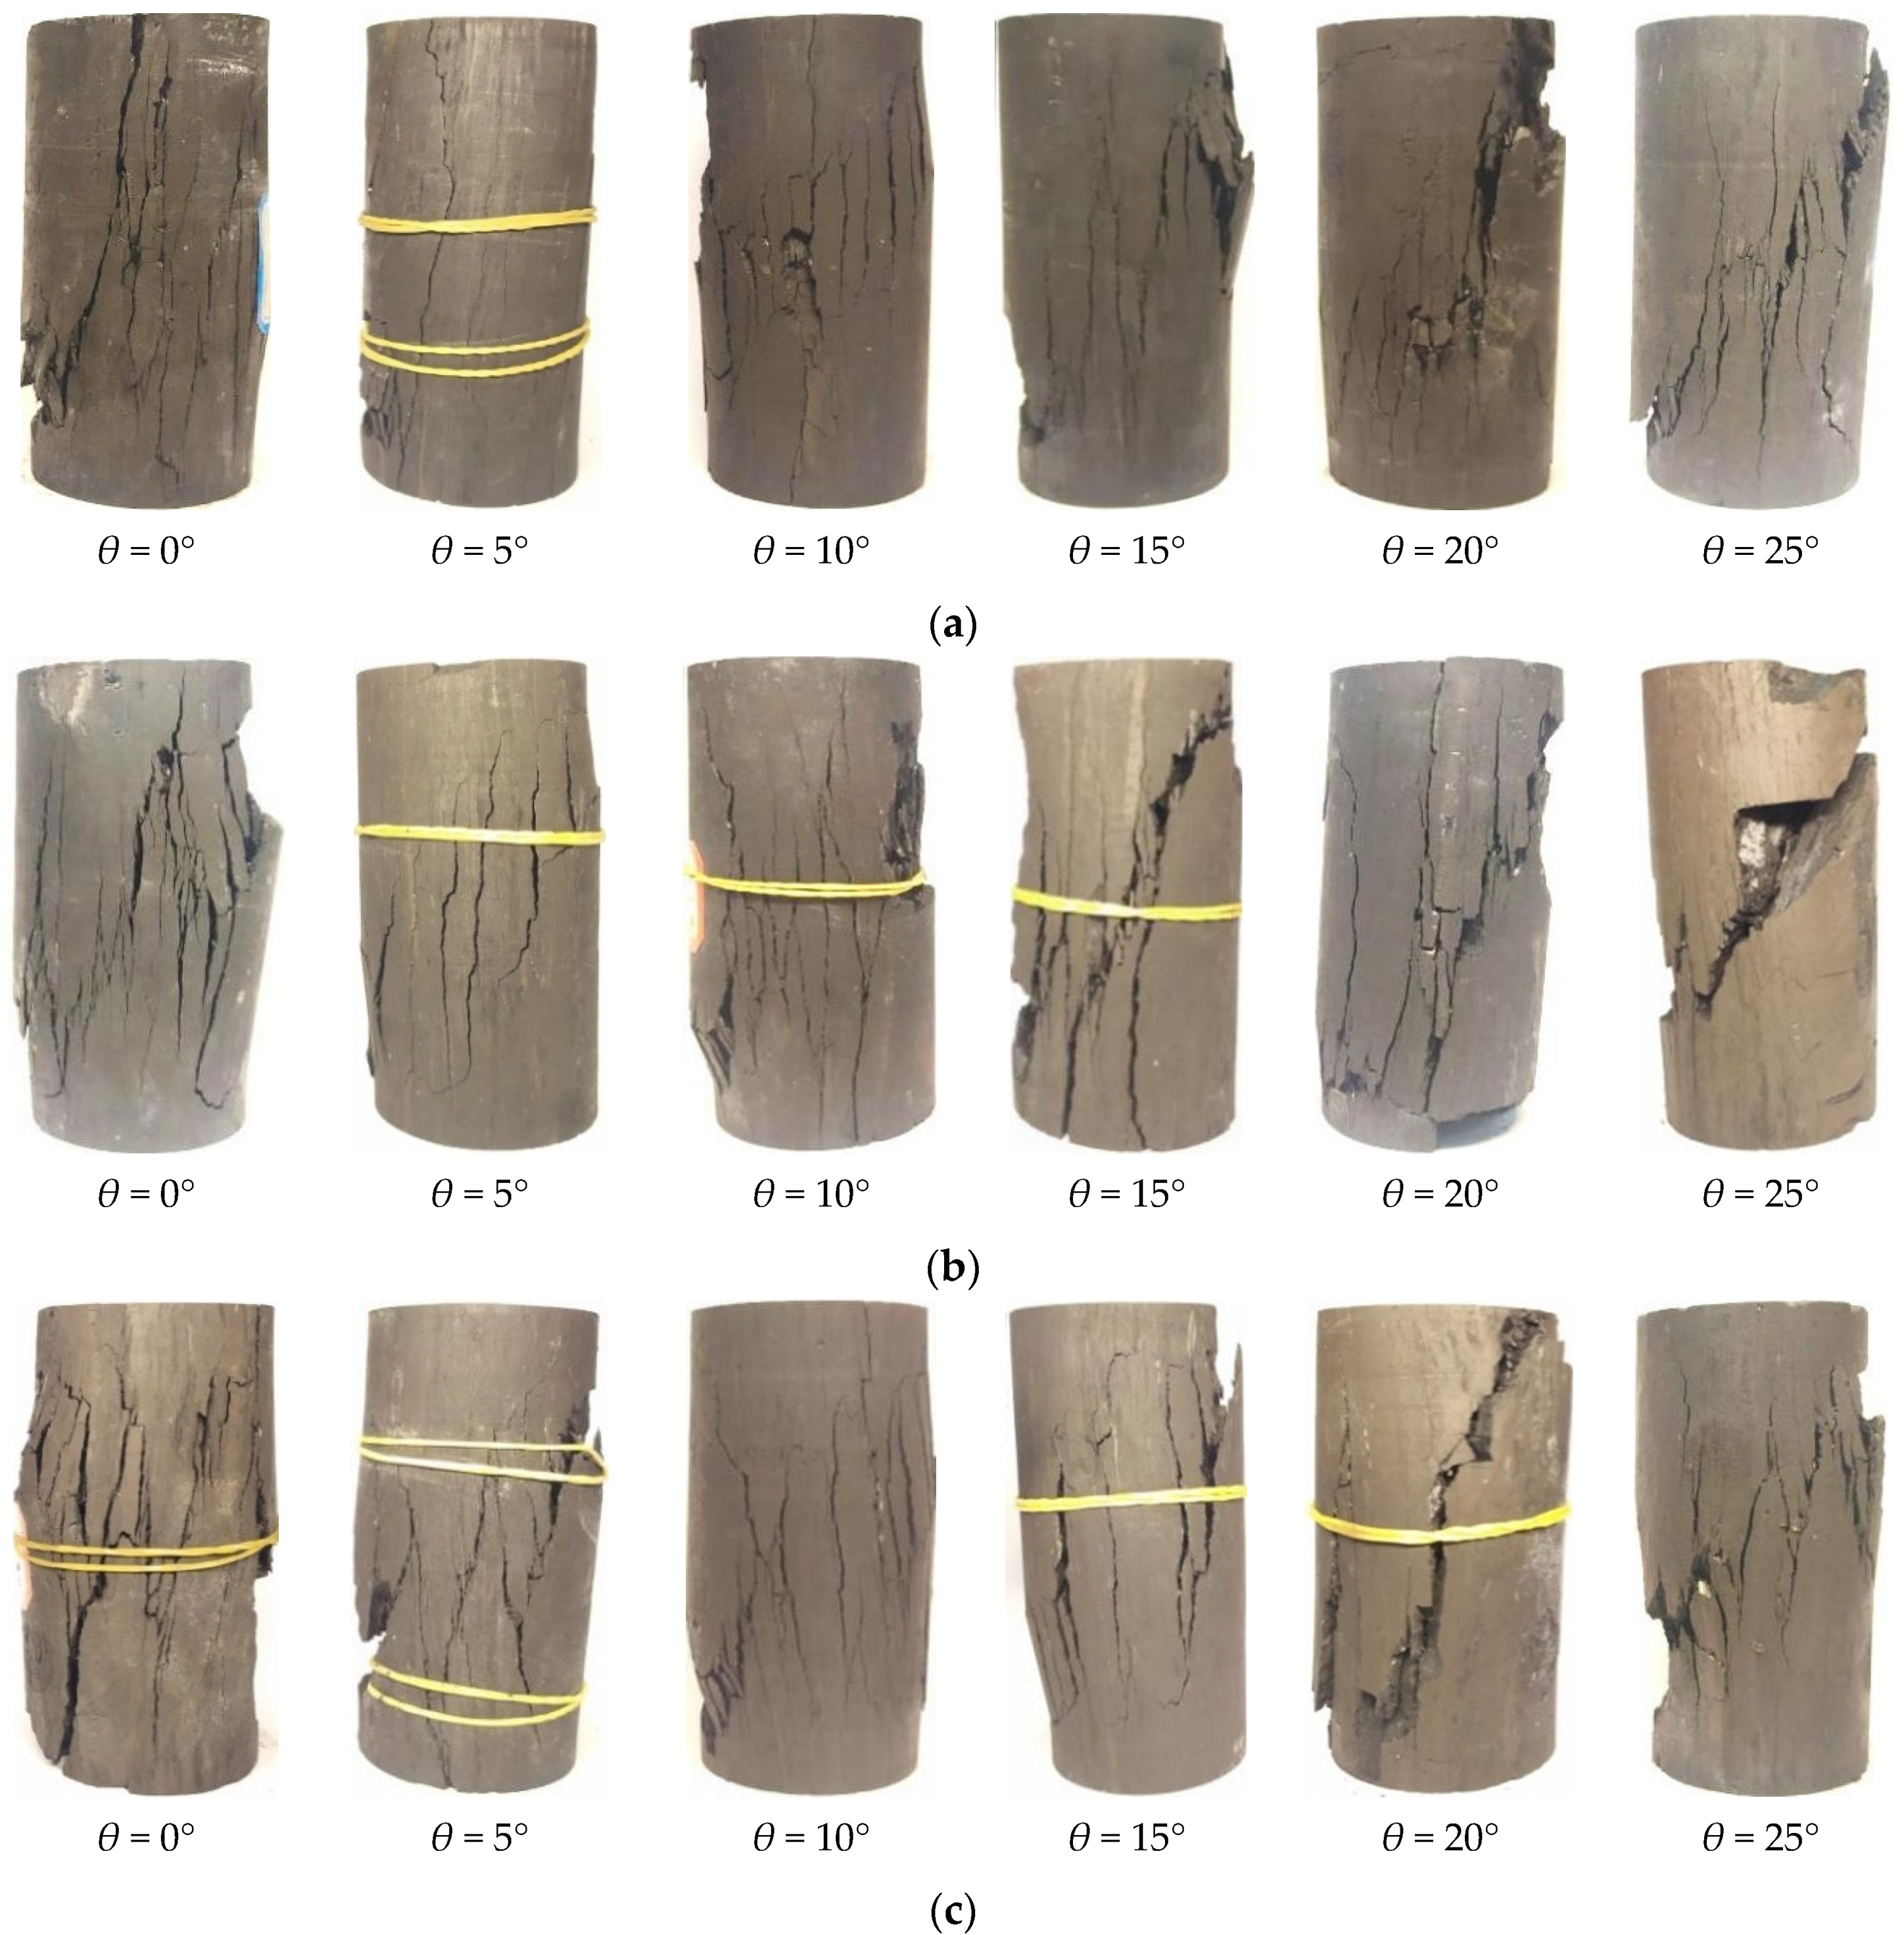
3.6. Effect of Loading Rate and Inclination Angle on Macroscopic Failure Characteristics of Coal Samples

The instability failure of coal samples is the final result of crack propagation and penetration in the loading process. Its failure characteristics are not only related to its material properties, but also closely related to its loading mode [51]. Therefore, the macroscopic failure characteristics of coal samples can effectively reflect the influence of external load on its failure behavior to a certain extent. Figure 11 shows the typical macroscopic failure characteristics of coal samples under different loading rates and inclination angles. From Figure 11, firstly, at any loading rate, the change rule of macro failure mode with inclination angle is consistent, that is, with the increase of inclination angle, the failure mode of coal samples is gradually transformed from tensile splitting failure to shear failure. In general, within the inclination angle of 0°–5°, a large number of tensile splitting cracks parallel to the axial direction of the sample are developed on the surface of each sample and a small number of shear cracks are locally generated. It shows that the tensile splitting failure is the main failure mode of the samples under the low inclination angle of 0°–5° and the failure mode is independent of the loading rate of the sample. Within the inclination angle of 5°–10°, splitting cracks parallel to the axial direction of the samples are developed on surfaces of the most coal sample, accompanied by a large number of shear cracks. Thus, coal samples in this state present the composite failure mode of tension and shear. Within the high inclination angle of 15° to 25°, macro failure surfaces with a certain angle with the axial direction of the samples are generated for most of coal samples, indicating the shear failure of the samples. The above analysis shows that the inclination angle has a significant effect on the failure mode of coal samples [49]. With the increase of the inclination angle of the sample, the failure mode is transformed from tension splitting failure (0°–5°), tension–shear composite failure (10°) to single shear failure (15°–25°). This is mainly because the larger shear stress component accelerates the shear crack under the high inclination angle, contributing to the shear failure [40].
Secondly, with the increase of loading rate, the fragmentation degree of coal samples increases gradually, but the macro failure law of samples is slightly different under different inclination angles. When the inclination angle of the sample is small (0°–5°) and the loading rate is low (0.05–0.50 mm/min), the failure mode of coal sample is axial splitting, and the sample is intact without debris after failure. At the medium loading rate (1.00–5.00 mm/min), the failure mode of coal samples is unchanged, which is still manifested as an axial splitting failure. However, the integrity of the sample is damaged, and fragments and debris peeled from the sample. At the high loading rate (7.50–10.00 mm/min), the failure mode is mainly the conical failure. The sample has poor integrity and more fragments, showing bursting characteristics. When the inclination angle is 10°, axial splitting is the main failure mode at the low loading rate. At medium and high loading rate levels, the failure mode of coal samples is transformed from axial splitting to shear-slip failure, which has a high tendency of shear instability. When the inclination angle is in the range of 15°–25°, the main failure mode of coal samples is shear failure at any loading rate. With the increase of loading rate, the number of debris further increases after failure of the sample, and the failure degree of the sample increases gradually.
The above analysis shows that the loading rate and inclination angle have an important impact on the failure mode and failure degree of coal samples. As shown in Table 4, axial splitting is the main failure mode of coal samples under low inclination angle and low loading rate. After failure, the sample has high integrity. Shear failure is the main failure mode of samples under high inclination angle and high loading rate, and the sample is seriously fractured after failure. This finding is consistent with the law that inclined pillar is more prone to shear instability failure under high-strength mining.

4. Evolution Law of Crack Cracking Mode under the Coupled Compression–Shear Loading

Influence of Inclination Angle on the Evolution of Tension and Shear Cracks in Coal Samples

Based on the method mentioned in Section 2.4, the AFRA relationship curves of coal samples under different inclination angles are drawn, respectively. To simplify the analysis process, the loading rates of 1 and 10 mm/min are used to study the influence of inclination angle on the cracking mode of coal samples.
Figure 12 shows the variation of AFRA curve with an inclination angle at 1 mm/min. When the loading rate is 1 mm/min, the cracks are mainly distributed near the RA and AF axes under the inclination angles of 0° and 5° and the number of cracks near the AF axis is significantly greater than that near the RA axis. Table 5 shows the ratio of the number of tensile and shear cracks to the total number of cracks under different inclination angles. Figure 13 shows the change curve of the ratio of tensile and shear cracks with the inclination angle. According to Table 5 and Figure 13, the proportion of tensile cracks at the inclination angle of 0° and 5° is 57.96% and 55.78%, respectively. It shows that, under this condition, sample failure is mainly caused by tensile failure. Within the inclination angle of 10° to 25°, the crack distribution gradually shifts from AF axis to RA axis with the increase of the inclination angle. It shows that the shear failure trend of the sample increases with the inclination angle. For example, when the inclination angle changes from 10°–25°, the ratio of tensile cracks is less than 50%, which decreases from 42.48% to 22.65%, and decreases by 46.68%. However, the proportion of shear cracks is greater than 50%, which increases from 57.52% to 77.35% and increases by 19.83%. It shows that coal samples are mainly shear failure under this inclination angle. This law is consistent with the macroscopic failure mode of coal samples.
Figure 14 shows the variation of AFRA curve with the inclination angle at 10 mm/min. The total number of cracks at the loading rate of 10 mm/min is significantly reduced compared with that at the 1 mm/min. At the angle of 0°–10°, the cracks are concentrated near the AF axis, and the number of cracks near the AF axis is significantly greater than that near the RA axis. Table 6 shows the ratio of the number of tensile and shear cracks to the total number of cracks under different inclination angles. Figure 15 shows the change curve of the ratio of tensile and shear cracks with the inclination angle. When the inclination angle is 0°, 5° and 10°, the proportion of tensile cracks is 69.56%, 67.46% and 62.75%, respectively. It indicates that the sample failure is mainly caused by tensile failure within this inclination angle range. Within the inclination angle of 15°–25°, with the increase of the inclination angle, the crack distribution gradually shifts from the AF axis to the RA axis. It indicates that the shear failure of coal samples is strengthened. For example, when the inclination angle increases from 15° to 25°, the proportion of tensile cracks is less than 50%, decreasing from 48.35% to 39.81%; while the proportion of shear cracks is greater than 50%, increasing from 51.65% to 60.19%. It indicates that coal samples failure is mainly caused by shear failure within this range. This law is consistent with the macroscopic failure mode of coal samples.
In summary, when the loading rate is 10 mm/min, the number of tensile and shear cracks in coal samples decreases significantly. However, the proportion of tensile and shear cracks at 10 mm/min is close to that at 1 mm/min. Within the inclination angle of 0°–10°, the proportion of tensile crack is more than 50% and higher than that of shear crack; the tensile splitting failure is the main failure mode of coal samples. Within the inclination angles of 15°–25°, the proportion of shear cracks is more than 50% and higher than that of tensile cracks, and shear failure is the main failure mode. Therefore, shear stress components are conducive to the initiation and propagation of shear cracks and accelerate the instability failure of coal samples. It should be noted that there are different cracking modes under low loading rate and high loading rate at the inclination angle of 10°. It indicates that the cracking mode under this condition is more complex and is greatly affected by external load conditions. During the loading process, tensile crack or shear crack may lead to the failure of the sample, which mainly depends on the degree of the sample heterogeneity. It is also possible that the high loading rate is beneficial to the propagation of tensile cracks and the initiation of shear cracks, which leads to the shear failure of coal samples at the loading rate of 1 mm/min and tensile failure of 10 mm/min. This law is consistent with the macroscopic failure mode of coal samples, indicating the accuracy of the experimental results.

5. Discussion

The initiation and propagation of microcracks in coal rock are the main reasons for the final failure. Besides, the increase of shear stress component accelerates the initiation and propagation of microcracks, reduce their peak strength, and promote the deformation and failure of samples [51]. From the experimental results, when the inclination angle changes from 0° to 5°, the peak strength of the sample increases slightly. This is mainly because the strength performance of coal and rock is closely related to the external loading conditions and properties of the material itself. When the specimen is loaded at a low inclination angle, the bonding and friction effects between the particles inside the material are slightly improved compared with that under the vertical loading [52]. However, the shear stress component of the sample at the inclination angle of 5° is small, ranging from 0.7–1.05 MPa. Although it promotes the initiation and propagation of microcracks in the specimen, its effect cannot overcome the bonding and friction effects between solid coal and rock particles around the cracks. As a result, the peak axial stress increases slightly. With the increase of the inclination angle of the specimen, the shear stress component increases gradually. At this time, the promoting effect of shear stress on the crack fracture is greater than the bonding and friction between the particles inside the specimen, leading to the deformation and failure under the low vertical load. Chen [41] and He [49,53] carried out similar tests based on granite and basalt samples by this experimental system, and reported that the strength and elastic modulus of rock gradually decreases with the increase of the inclination angle. This conclusion is slightly different from the results obtained in this study. The main reason is as follows: the peak strength of granite and basalt is greater than 100 MPa (hard rock), while the strength of coal is less than 20 MPa (soft rock) under the conventional uniaxial compression. For hard rock, when the inclination angle is increased to 5°, the generated shear stress component is 9.1–9.5 MPa [41]. As a result, the effect of shear stress on crack propagation is greater than the bond and friction between particles in the sample, and the peak strength of the sample decreases with the increase of inclination angle.
Many studies have shown that the compressive strength and elastic modulus of rock are not inherent properties of rock, but depend on the external environment and loading modes [54,55]. Bieniawski [51] pointed out that the failure direction of rock sample is parallel to the direction of maximum principal stress. When the axial direction of the specimen is parallel to the loading direction of the testing machine, the split failure in the axial direction is the main failure mode of the specimen. When the axial direction of the specimen has a certain angle with the loading direction of the testing machine, the shear failure of the specimen is the main failure mode. The larger the inclination angle, the more significant the trend of shear failure. This conclusion is consistent with that in the study conducted by Chen [41] and He [49,53]. The failure process of coal and rock under load is essentially a process in which the tensile and shear cracks cross each other and extend to the surface of the sample. In this process, the distribution of cracks is highly correlated with the fracture behavior of coal and rock. The results of acoustic emission show that the increase of loading rate reduces the number of tension and shear cracks, but the proportion of tensile and shear cracks is basically unchanged. It indicates that the loading rate slightly affects the failure mode of samples. However, with the increase of the inclination angle, the tensile failure develops to the shear failure, which is basically consistent with the macroscopic fracture mode of the specimen.

6. Conclusions

In this paper, the self-developed C-CAST system is introduced, and the stress–strain curve characteristics, mechanical properties and macro failure mode of coal samples under different loading rates and inclination angles are studied. Based on acoustic emission technology, the distribution of tension and shear cracks in coal samples after loading is determined. The main conclusions are summarized as follows:
  • The combined compression and shear loading experimental system is developed, the specific assembly steps and use methods of the system are described, and the strength calculation principle of coal samples under the coupled compression–shear loading is introduced. Compared with the traditional uniaxial compression experimental system, the system can realize uniaxial loading of coal samples under the inclined condition. As a result, the sample is in the coupled compression–shear loading mechanical state, and the mechanical status of inclined pillars affected by coupled compression–shear loading can be effectively reflected.
  • With the increase of inclination angle, the peak shear stress of coal samples increases gradually, while the peak axial stress and elastic modulus slightly increase and then decrease, and reach the maximum value at the inclination angle of 5°. Within the inclination angle range of 0° to 15°, with the increase of loading rate, the peak shear stress, peak axial stress and elastic modulus of coal sample first increase and then decrease; the loading rate corresponding to the maximum point decreases with the increase of inclination angle. Within the range of 20° to 25°, the peak axial stress and elastic modulus gradually decrease with the increase of the loading rate. It indicates that the shear stress component can weaken the strengthening effect of the loading rate on the strength of coal samples.
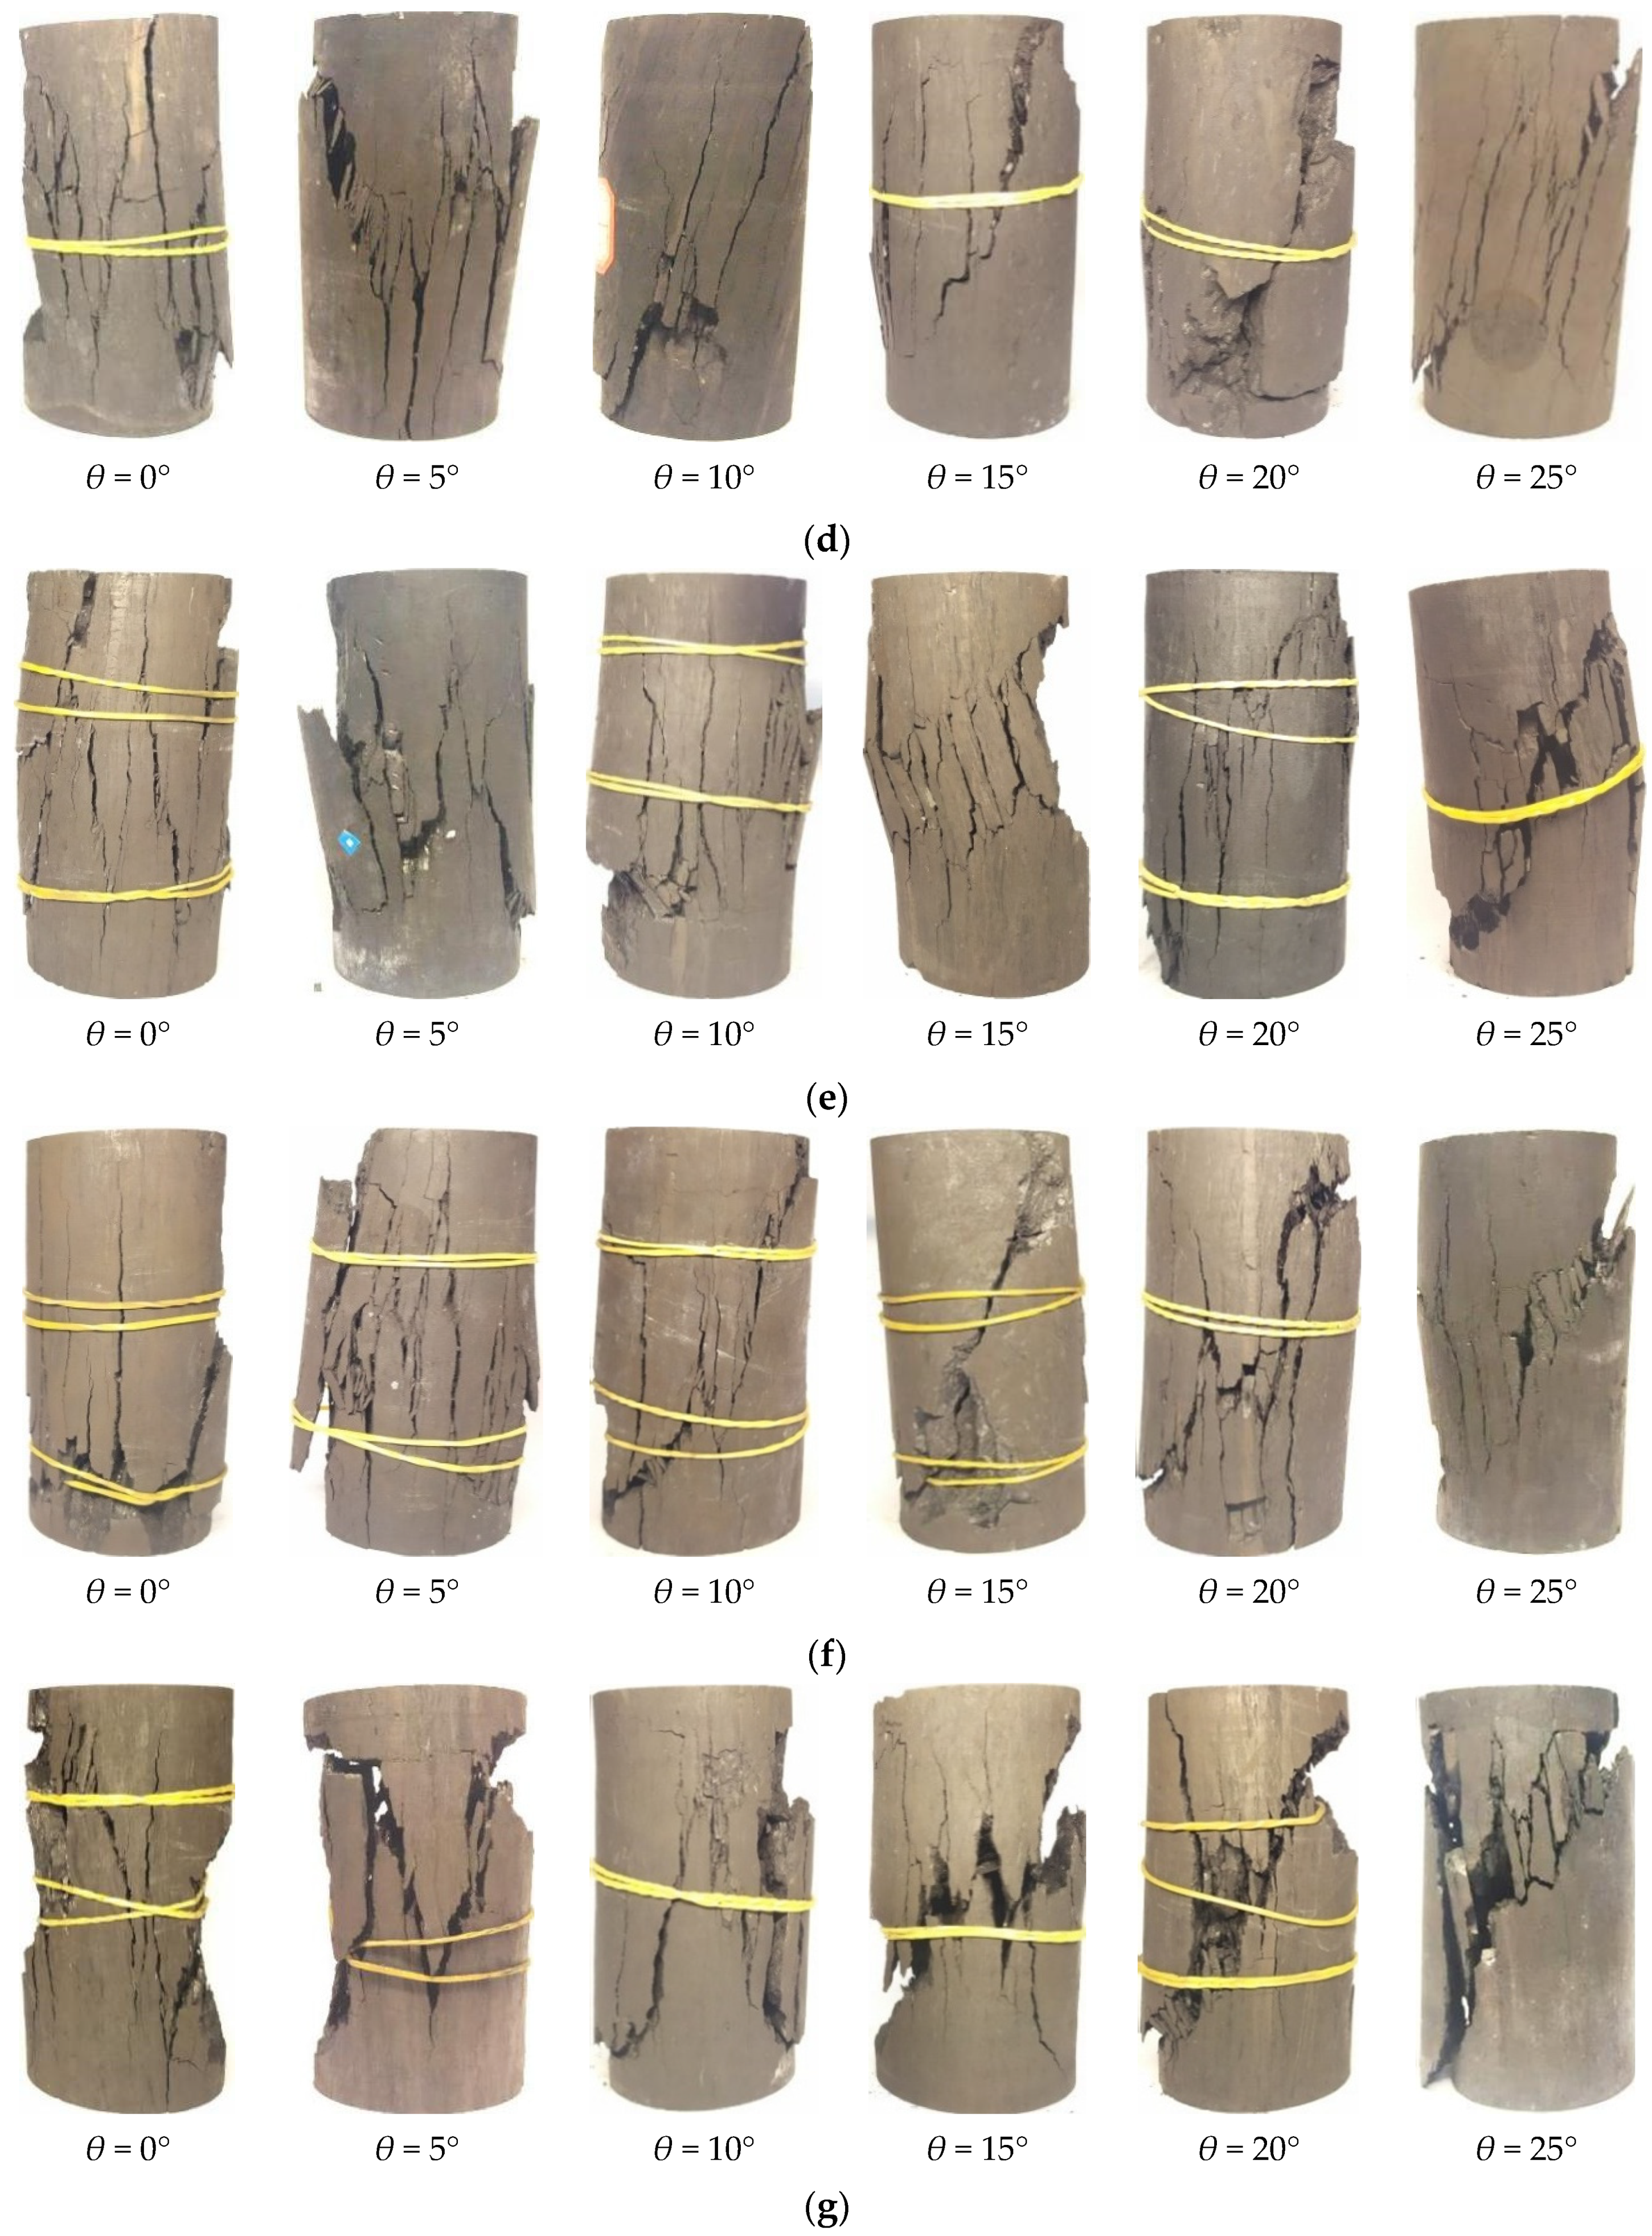
  • The influence of inclination angle and loading rate on the failure characteristics of coal samples is significant. With the increase of the inclination angle, the failure mode is transformed from tensile splitting failure (0°–5°), tension–shear composite failure (10°) to single shear failure mode (15°–25°); the loading rate has little effect on the failure mode, but has a significant effect on the failure degree.
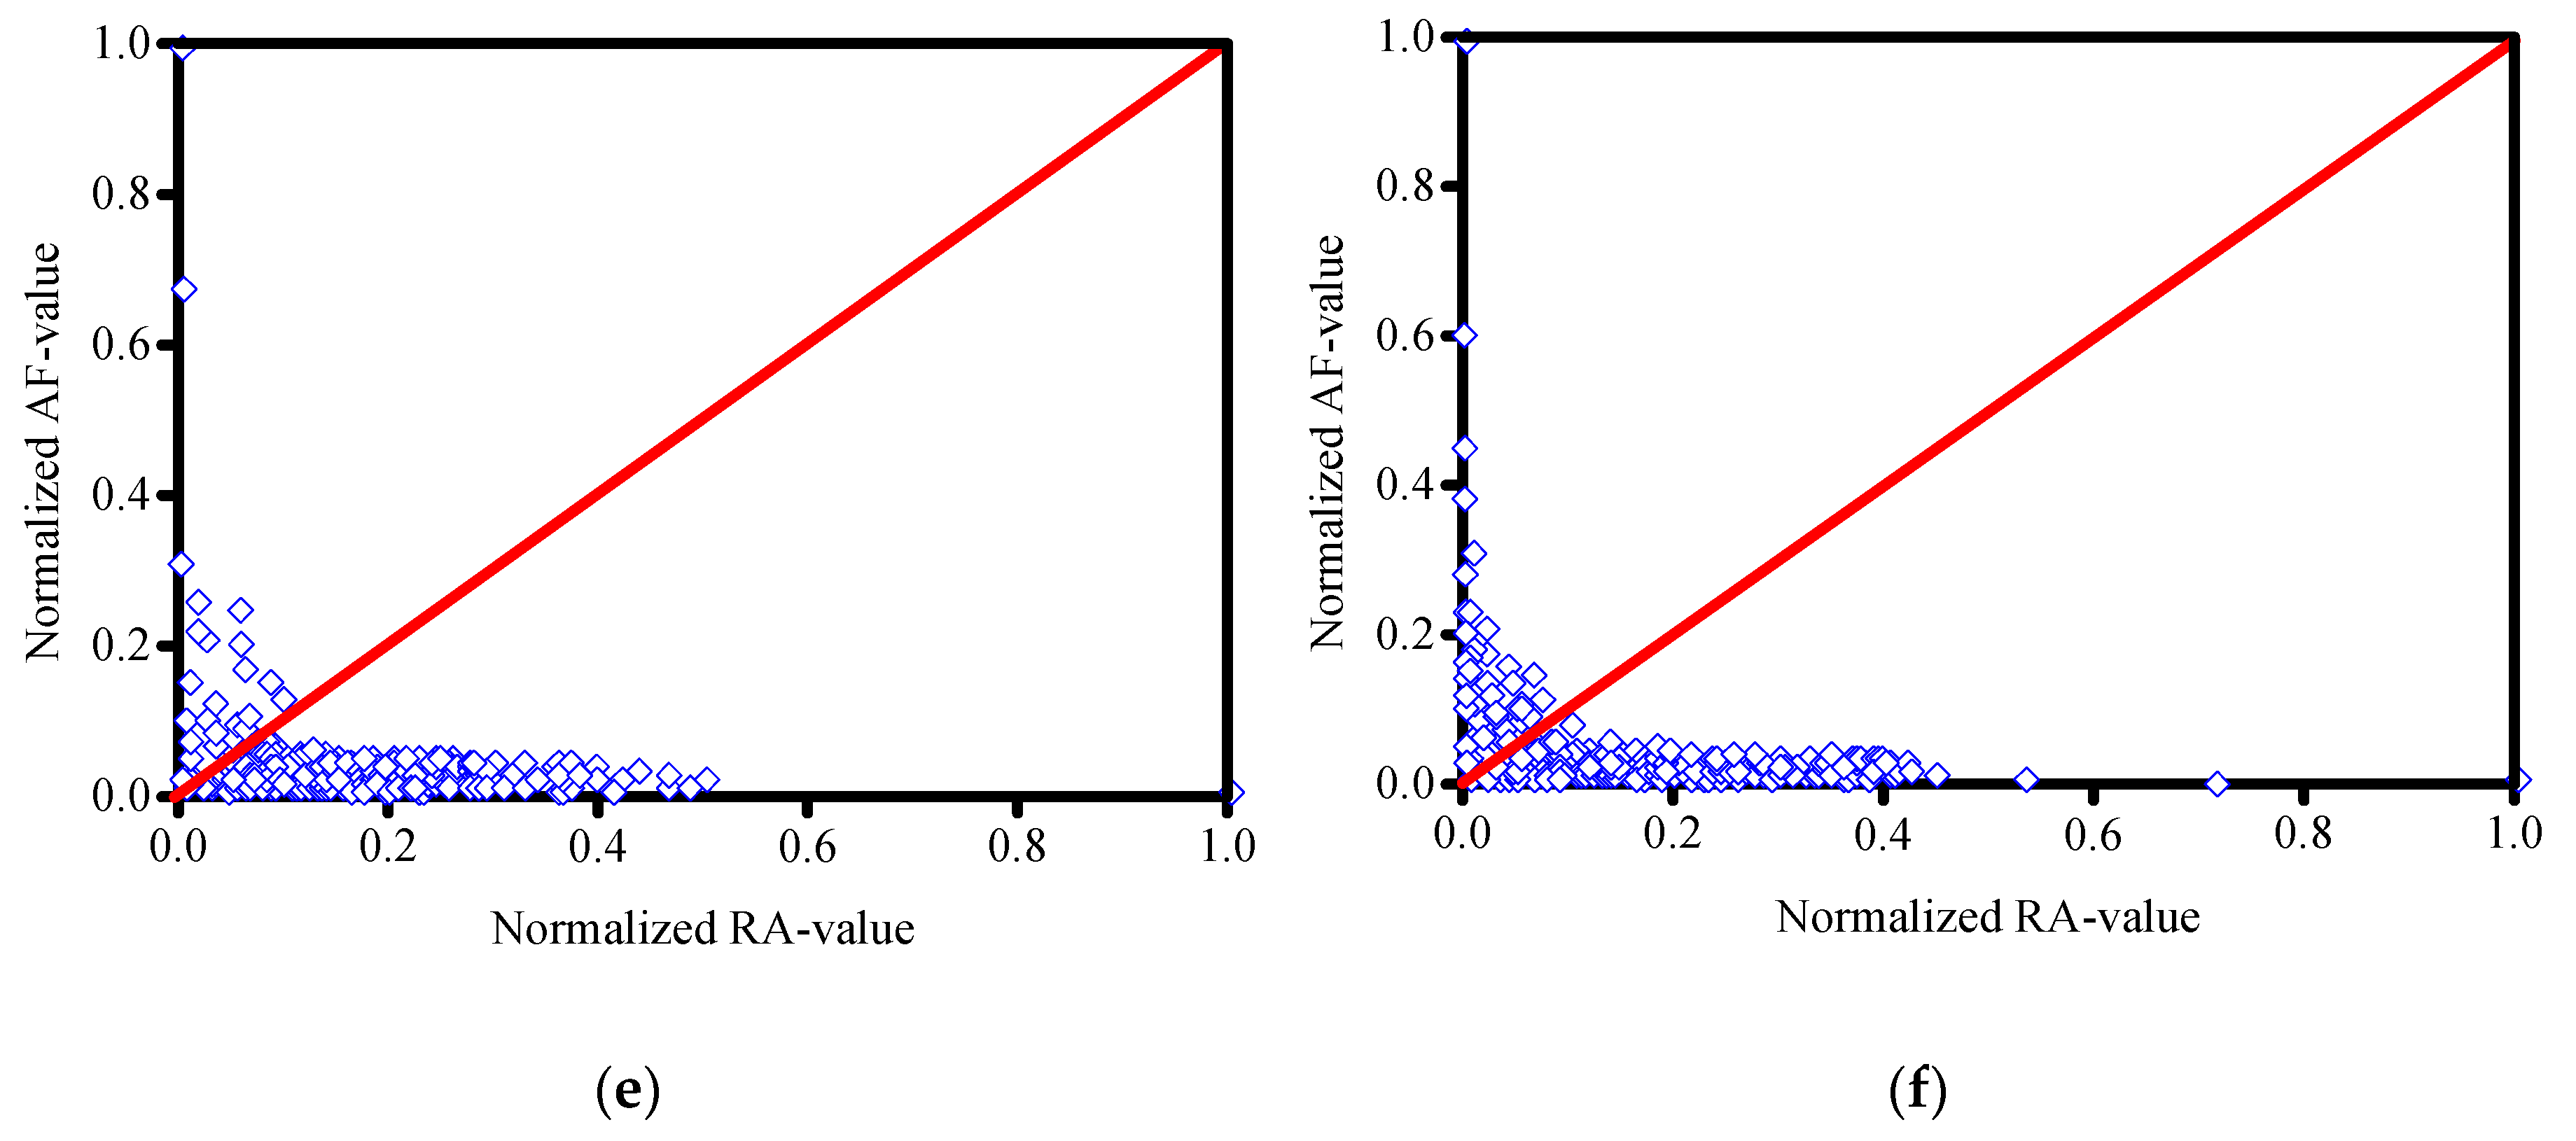
  • When the loading rate is 1.0 and 10 mm/min, within the inclination angle of 0°–5°, the proportion of tensile cracks after coal samples failure is significantly greater than that of shear cracks; the tensile failure is the main failure mode of the samples. Within the 10°–25°, the proportion of shear cracks increases gradually with the increase of inclination angle, and both of them are more than 50%. The shear failure is the main failure mode. This law is consistent with the macro failure mode of the samples.

Author Contributions

Conceptualization, Y.C. and P.W.; methodology, H.C. and H.P.; data curation, L.C.; writing—original draft preparation, P.W. and K.Z.; writing—review and editing, Y.C. All authors have read and agreed to the published version of the manuscript.

Funding

This work was financially supported by National Natural Science Foundation of China (Grant Nos. 51974295, U1803118, 51974296).

Conflicts of Interest

The authors declare no conflict of interest.

References

  1. Lunder, P.J.; Pakalnis, R.C. Determination of the strength of hard-rock mine pillars. CIM Bull. 1997, 90, 51–55. [Google Scholar]
  2. Hedley, D.G.F.; Grant, F. Stope-and-pillar design for the elliot lake uranium mines. CIM Bull. 1972, 65, 37–44. [Google Scholar]
  3. Salamon, A.H.; Munro, M.D.G. A study of the strength of coal pillars. J. S. Afr. Inst. Min. Metall. 1967, 68, 55–67. [Google Scholar]
  4. Zhang, Y.; Ren, F.; Zhao, X. Characterization of joint set effect on rock pillars using synthetic rock mass numerical method. Int. J. Geomech. 2017, 17, 06016026. [Google Scholar] [CrossRef]
  5. Mortazavi, A.; Hassani, F.P.; Shabani, M. A numerical investigation of rock pillar failure mechanism in underground openings. Comput. Geotech. 2009, 36, 691–697. [Google Scholar] [CrossRef]
  6. Zhang, L.Y.; Deng, K.Z.; Zhu, C.G.; Xing, Z.Q. Analysis of stability of coal pillars with multi-coal seam strip mining. Trans. Nonferrous Metal. Soc. 2011, 21, s549–s555. [Google Scholar] [CrossRef]
  7. Liu, H.L.; Zhu, W.C.; Yu, Y.J.; Xu, T.; Liu, X.G. Effect of water imbibition on uniaxial compression strength of sandstone. Int. J. Rock Mech. Min. 2020, 127, 104200. [Google Scholar] [CrossRef]
  8. Wasantha, P.P.L.; Ranjith, G.P.; Viete, R.D.; Luo, L. Influence of the geometry of partially-spanning joints on the uniaxial compressive strength of rock. Int. J. Rock Mech. Min. 2012, 50, 140–146. [Google Scholar] [CrossRef]
  9. Yang, S.Q.; Dai, Y.H.; Han, L.J.; Jin, Z.Q. Experimental study on mechanical behavior of brittle marble samples containing different flaws under uniaxial compression. Eng. Fract. Mech. 2009, 76, 1833–1845. [Google Scholar] [CrossRef]
  10. Pan, W.D.; Wang, X.; Liu, Q.M.; Yuan, Y.K.; Zuo, B.D. Non-parallel double-crack propagation in rock-like materials under uniaxial compression. Int. J. Coal Sci. Technol. 2019, 6, 372–387. [Google Scholar] [CrossRef] [Green Version]
  11. Tsoutrelis, C.E.; Exadaktylos, G.E. Effect of rock discontinuities on certain rock strength and fracture energy parameters under uniaxial compression. Geotech. Geol. Eng. 1993, 11, 81–105. [Google Scholar] [CrossRef]
  12. Qian, R.P.; Feng, G.R.; Guo, J.; Wang, P.F.; Jiang, H.N. Effects of water-soaking height on the deformation and failure of coal in uniaxial compression. Appl. Sci. 2019, 9, 4370. [Google Scholar] [CrossRef] [Green Version]
  13. Wang, M.; Wan, W.; Zhao, Y.L. Experimental study on crack propagation and the coalescence of rock-like materials with two preexisting fissures under biaxial compression. Bull. Eng. Geol. Environ. 2020, 79, 3121–3144. [Google Scholar] [CrossRef]
  14. Wu, C.Z.; Chen, Q.S.; Basack, S.; Xu, R.Q.; Shi, Z.M. Biaxial creep test study on the influence of structural anisotropy on rheological behavior of hard rock. J. Mater. Civil Eng. 2016, 28, 04016104. [Google Scholar] [CrossRef] [Green Version]
  15. Amann, F.; Kaiser, P.; Button, E.A. Experimental study of brittle behavior of clay shale in rapid triaxial compression. Rock Mech. Rock Eng. 2012, 45, 21–33. [Google Scholar] [CrossRef] [Green Version]
  16. Geng, Z.; Chen, M.; Jin, Y.; Yang, S.; Yi, Z.C.; Fang, X.; Du, X.Y. Experimental study of brittleness anisotropy of shale in triaxial compression. J. Nat. Gas Sci. Eng. 2016, 36, 510–518. [Google Scholar] [CrossRef]
  17. Liu, E.L.; He, S.M. Effects of cyclic dynamic loading on the mechanical properties of intact rock samples under confining pressure conditions. Eng. Geol. 2012, 125, 81–91. [Google Scholar] [CrossRef]
  18. Li, Y.C.; Wu, C.Z.; Jang, B.A. Effect of bedding plane on the permeability evolution of typical sedimentary rocks under triaxial compression. Rock Mech. Rock Eng. 2020, 1–9. [Google Scholar] [CrossRef]
  19. Yin, Q.; Liu, R.C.; Jing, H.W.; Su, H.J.; Yu, L.Y.; He, L.X. Experimental study of nonlinear flow behaviors through fractured rock samples after high-temperature exposure. Rock Mech. Rock Eng. 2019, 52, 2963–2983. [Google Scholar] [CrossRef]
  20. Li, G.; Moelle, K.; Lewis, J.A. Fatigue crack growth in brittle sandstones. Int. J. Rock Mech. Min. Sci. Geomech. Abstr. 1992, 29, 469–477. [Google Scholar] [CrossRef]
  21. Erarslan, N.; Alehossein, H.; Williams, D.J. Tensile fracture strength of brisbane tuff by static and cyclic loading tests. Rock Mech. Rock Eng. 2014, 47, 1135–1151. [Google Scholar] [CrossRef]
  22. Wu, Q.; Jiang, Y.F.; Tang, H.M.; Luo, H.M.; Wang, X.H.; Kang, J.T.; Zhang, S.; Yi, X.; Fan, L.L. Experimental and numerical studies on the evolution of shear behaviour and damage of natural discontinuities at the interface between different rock types. Rock Mech. Rock Eng. 2020, 53, 3721–3744. [Google Scholar] [CrossRef]
  23. Yin, Q.; Ma, G.W.; Jing, H.W.; Wang, H.D.; Su, H.J.; Wang, Y.C.; Liu, R.C. Hydraulic properties of 3D rough-walled fractures during shearing: An experimental study. J. Hydrol. 2017, 555, 169–184. [Google Scholar] [CrossRef]
  24. Li, Y. Test granular materials failure using bi-directional simple shear apparatus: A review. Appl. Sci. 2018, 8, 1140. [Google Scholar] [CrossRef] [Green Version]
  25. Li, H.T.; Song, L.; Zhou, H.W.; Jiang, Y.D.; Wang, H.W. Evaluation method and application of coal burst performance under the effect of loading rate. J. China Coal Soc. 2015, 40, 21–29. [Google Scholar]
  26. Zhang, Z.X.; Kou, S.Q.; Yu, J.; Yu, Y.; Jiang, L.G.; Lindqvist, P.A. Effects of loading rate on rock fracture. Int. J. Rock Mech. Min. 1999, 36, 597–611. [Google Scholar] [CrossRef]
  27. Hou, Z.K.; Gutierrez, M.; Ma, S.Q.; Almrabat, A.; Yang, C.H. Mechanical behavior of shale at different strain rates. Rock Mech. Rock Eng. 2019, 52, 3531–3544. [Google Scholar] [CrossRef]
  28. Lajtai, E.Z.; Duncan, E.J.S.; Carter, B.J. The effect of strain rate on rock strength. Rock Mech. Rock Eng. 1991, 24, 99–109. [Google Scholar] [CrossRef]
  29. Wasantha, P.L.P.; Ranjith, P.G.; Zhao, J.; Shao, S.S.; Permata, G. Strain rate effect on the mechanical behaviour of sandstones with different grain sizes. Rock Mech. Rock Eng. 2015, 48, 1883–1895. [Google Scholar] [CrossRef]
  30. Alam, M.S.; Chakraborty, T.; Matsagar, V.; Rao, K.S.; Sharma, P.; Singh, M. Characterization of kota sandstone under different strain rates in uniaxial loading. Geotech. Geol. Eng. 2015, 33, 143–152. [Google Scholar] [CrossRef]
  31. Okubo, S.; Nishimatsu, Y.; He, C. Loading rate dependence of class ii rock behaviour in uniaxial and triaxial compression tests—An application of a proposed new control method. Int. J. Rock Mech. Min. Sci. Geomech. Abstr. 1990, 27, 559–562. [Google Scholar] [CrossRef]
  32. Li, H.T.; Zhou, H.W.; Jiang, Y.D.; Wang, H.W. An evaluation method for the bursting characteristics of coal under the effect of loading rate. Rock Mech. Rock Eng. 2016, 49, 3281–3291. [Google Scholar]
  33. Li, H.M.; Li, H.G.; Gao, B.B.; Jiang, D.J.; Feng, J.F. Study of acoustic emission and mechanical characteristics of coal samples under different loading rates. Shock Vib. 2015, 2015, 1–11. [Google Scholar] [CrossRef]
  34. Baker, W.E.; Yew, C.H. Strain-rate effects in the propagation of torsional plastic waves. J. Appl. Mech. 1966, 33, 917. [Google Scholar] [CrossRef]
  35. Huang, H.; Feng, R. A study of the dynamic tribological response of closed fracture surface pairs by kolsky-bar compression-shear experiment. Int. J. Solids Struct. 2004, 41, 2821–2835. [Google Scholar] [CrossRef]
  36. Xu, Y.; Dai, F. Dynamic response and failure mechanism of brittle rocks under combined compression-shear loading experiments. Rock Mech. Rock Eng. 2017, 51, 747–764. [Google Scholar] [CrossRef]
  37. Nie, X.; Chen, W. Dynamic failure of a borosilicate glass under compression/shear loading. In Proceedings of the Ceramic Engineering and Science Proceedings, 31st International Conference on Advanced Ceramics and Composites, Daytona Beach, FL, USA, 21–26 January 2007; pp. 103–111. [Google Scholar]
  38. Xin, S.; Liu, W.N.; Chen, W.N.; Templeton, D. Modeling and characterization of dynamic failure of borosilicate glass under compression/shear loading. Int. J. Impact Eng. 2009, 36, 226–234. [Google Scholar]
  39. Brown, E.T. The ISRM Suggested Methods for Rock Characterization, Testing and Monitoring: 2007–2014; Ulusay, R., Ed.; Springer International Publishing: Cham, Switzerland, 2015; p. 293. [Google Scholar]
  40. Chen, L.; Wu, P.; Chen, Y.L.; Zhang, W. Experimental study on physical-mechanical properties and fracture behaviors of saturated yellow sandstone considering coupling effect of freeze-thaw and specimen inclination. Sustainability 2020, 12, 1029. [Google Scholar] [CrossRef] [Green Version]
  41. Chen, L.; Mao, X.B.; Wu, P. Temperature and inclination angle on mechanical properties and fracture behavior of granite at low strain rate. Sustainability 2020, 12, 1255. [Google Scholar] [CrossRef] [Green Version]
  42. Ohtsu, M.; Tomoda, Y.; Suzuki, T. Damage evaluation and corrosion detection in concrete by acoustic emission. In Fracture Mechanics of Concrete and Concrete Structure-Design; Carpinteri, A., Gambarova, P.G., Ferro, G., Plizzari, G., Eds.; Taylor and Francis Group: London, UK, 2007. [Google Scholar]
  43. Aggelis, D.G.; Sapouridis, S.D.V. Characterization of the Damage Process in Fibre Reinforced Concrete Using Acoustic Emission Parameters. In Proceedings of the Structural Faults and Repair, Edinburgh, UK, 15–17 June 2010; pp. 15–17. [Google Scholar]
  44. Kim, J.S.; Lee, K.S.; Cho, W.J.; Choi, H.J.; Cho, G.C. A comparative evaluation of stress-strain and acoustic emission methods for quantitative damage assessments of brittle rock. Rock Mech. Rock Eng. 2015, 48, 495–508. [Google Scholar] [CrossRef]
  45. Zhao, X.G.; Cai, M.; Wang, J.; Li, P.F.; Ma, L.K. Objective determination of crack initiation stress of brittle rocks under compression using ae measurement. Rock Mech. Rock Eng. 2015, 48, 2473–2484. [Google Scholar] [CrossRef]
  46. Wang, X.; Wen, Z.J.; Jiang, Y.J.; Huang, H. Experimental study on mechanical and acoustic emission characteristics of rock-like material under non-uniformly distributed loads. Rock Mech. Rock Eng. 2017, 51, 729–745. [Google Scholar] [CrossRef]
  47. Shahidan, S.; Pulin, R.; Bunnori, N.M.; Holford, K.M. Damage classification in reinforced concrete beam by acoustic emission signal analysis. Constr. Build. Mater. 2013, 45, 78–86. [Google Scholar] [CrossRef] [Green Version]
  48. Kahraman, S. Evaluation of simple methods for assessing the uniaxial compressive strength of rock. Int. J. Rock Mech. Min. 2001, 38, 981–994. [Google Scholar] [CrossRef]
  49. He, Q.Y.; Li, Y.C.; She, S. Mechanical properties of basalt specimens under combined compression and shear loading at low strain rates. Rock Mech. Rock Eng. 2019, 52, 4101–4112. [Google Scholar] [CrossRef]
  50. Walsh, J.B. The effect of cracks on the uniaxial elastic compression of rocks. J. Geophys. Res. 2012, 70, 399–411. [Google Scholar] [CrossRef]
  51. Bieniawski, Z.T. Mechanism of brittle fracture of rock: Part I—Theory of the fracture process. Int. J. Rock Mech. Min. Sci. Geomech. Abstr. 1967, 4, 395. [Google Scholar] [CrossRef]
  52. Benz, T.; Schwab, R. A quantitative comparison of six rock failure criteria. Int. J. Rock Mech. Min. 2008, 45, 1176–1186. [Google Scholar] [CrossRef]
  53. He, Q.Y.; Li, Y.C.; Xu, J.H.; Zhang, C.G. Prediction of mechanical properties of igneous rocks under combined compression and shear loading through statistical analysis. Rock Mech. Rock Eng. 2020, 53, 841–859. [Google Scholar] [CrossRef]
  54. Khanlari, G.; Sahamieh, R.Z.; Abdilor, Y. The effect of freeze—Thaw cycles on physical and mechanical properties of upper red formation sandstones, central part of iran. Arab. J. Geosci. 2015, 8, 5991–6001. [Google Scholar] [CrossRef]
  55. Han, T.; Shi, J.; Cao, X. Fracturing and damage to sandstone under coupling effects of chemical corrosion and freeze—Thaw cycles. Rock Mech. Rock Eng. 2016, 49, 1–11. [Google Scholar] [CrossRef]
Figure 1. Processed coal samples and mineralogical features: (a) Processed coal samples; (b) Microscopic image; (c) X-ray Diffraction patterns.
Applsci 10 07082 g001
Figure 2. C64.106/1000 kN electrohydraulic servo universal experimental system: (a) Loading system; (b) Control system.
Applsci 10 07082 g002
Figure 3. Structure chart of the combined compression and shear test (C-CAST) system: (a) The physical diagram of C-CAST system; (b) The 3D structure diagram of C-CAST system.
Applsci 10 07082 g003
Figure 4. Stress and deformation characteristics of samples before and after the test: (a) Traditional uniaxial compression strength (UCS) test; (b) Inclined UCS test; (c) Local enlarged view in (b).
Applsci 10 07082 g004
Figure 5. Schematic diagram of crack mode and acoustic emission (AE) characteristic parameters.
Applsci 10 07082 g005
Figure 6. Axial stress–strain curves of coal samples under different loading rates and inclination angles: (a) θ = 0°; (b) θ = 5°; (c) θ = 10°; (d) θ = 15°; (e) θ = 20°; (f) θ = 25°; (g) typical axial stress–strain curves of coal samples.
Applsci 10 07082 g006
Figure 7. Shear stress component–shear displacement curve under different loading rates and inclination angles: (a) 0.05 mm/min; (b) 0.5 mm/min; (c) 1.0 mm/min; (d) 2.0 mm/min; (e) 3.5 mm/min; (f) 5.0 mm/min; (g) 7.5 mm/min; (h) 10.0 mm/min.
Applsci 10 07082 g007aApplsci 10 07082 g007b
Figure 8. Variation law of peak shear stress with loading rate and inclination angle: (a) Relationship between peak shear stress and inclination angle; (b) relationship between peak shear stress and loading rate.
Applsci 10 07082 g008
Figure 9. Variation law of peak axial stress of coal sample with loading rate and inclination angle: (a) Relationship between peak axial stress and inclination angle; (b) relationship between peak axial stress and loading rate.
Applsci 10 07082 g009
Figure 10. Elastic modulus varies with the loading rate and inclination angle: (a) Relationship between elastic modulus and inclination angle; (b) relationship between elastic modulus and loading rate.
Applsci 10 07082 g010
Figure 11. Typical failure coal samples: (a) υ = 0.05 mm/min; (b) υ = 0.5 mm/min; (c) υ = 1.0 mm/min; (d) υ = 2.0 mm/min; (e) υ = 3.5 mm/min; (f) υ = 5.0 mm/min; (g) υ = 7.5 mm/min; (h) υ = 10.0 mm/min.
Applsci 10 07082 g011aApplsci 10 07082 g011bApplsci 10 07082 g011c
Figure 12. The average frequency (AF) and rising angle (RA) curves under different inclination angles at a loading rate of 1 mm/min: (a) 0°; (b) 5°; (c) 10°; (d) 15°; (e) 20°; (f) 25°.
Applsci 10 07082 g012aApplsci 10 07082 g012b
Figure 13. The proportion of tensile and shear cracks under different inclination angles at a loading rate of 1 mm/min.
Applsci 10 07082 g013
Figure 14. AFRA relation curve at different inclination angles at a loading rate of 10 mm/min: (a) 0°; (b) 5°; (c) 10°; (d) 15°; (e) 20°; (f) 25°.
Applsci 10 07082 g014
Figure 15. The proportion of tensile and shear cracks under different inclination angles at loading rate of 10 mm/min.
Applsci 10 07082 g015
Table 1. Peak shear stress values of coal samples under different loading rates and inclination angles (MPa).
Inclination Angles θ (°)Loading Rate (mm/min)
0.050.5123.557.510
50.800.840.870.931.050.870.800.69
101.371.481.571.661.381.271.090.97
151.841.951.811.721.461.361.171.04
202.091.991.901.791.621.461.261.14
252.292.121.981.861.711.611.491.29
Table 2. Peak axial stress varies with the loading rate and inclination angle.
Inclination Angle (°)Loading Rate (mm/min)Peak Axial Stress (MPa)Absolute Error (MPa)Relative Error (%)Average Peak Axial Stress (MPa)Standard Deviation (MPa)Relative Standard Deviation (%)
00.0510.161.1012.159.061.0011.07
8.190.869.51
8.820.242.64
50.0510.601.1111.679.490.9910.38
8.710.788.19
9.160.333.48
1010.006.880.6310.046.250.6310.12
6.260.010.16
5.610.6410.19
152.007.230.6810.356.550.7311.13
5.780.7711.78
6.640.091.42
200.505.060.6611.475.720.6110.67
6.270.559.62
5.820.111.85
253.503.410.4812.463.890.4310.98
4.210.328.28
4.050.164.18
Table 3. Elastic modulus under various loading rates and inclination angles.
Inclination Angle (°)Loading Rate (mm/min)Elasticity Modulus (MPa)Absolute Error (MPa)Relative Error (%)Average Elasticity Modulus (MPa)Standard Deviation (MPa)Relative Standard Deviation (%)
03.51067.8749.004.811018.8746.914.60
974.3744.504.37
1014.384.500.44
57.5746.5643.045.45789.5937.364.73
813.7324.143.06
808.4918.902.39
100.05558.2130.265.73527.9533.886.42
491.3536.606.93
534.296.341.20
1510.0330.6714.964.74315.7013.814.37
303.4612.253.88
312.992.720.86
203.5348.7223.456.30372.1620.735.57
388.0615.904.27
379.717.552.03
250.05362.8123.626.11386.4321.115.46
403.4517.014.40
393.046.611.71
Table 4. Failure characteristics of coal samples under various loading rates and inclination angles.
Loading Rate (mm/min)Inclination (°)Failure ModeFailure Mechanism
0.05–0.500–5The sample is relatively complete, and one or more longitudinal cracks can be seen on the surface.Tensile failure (dominant)
10Splitting cracks approximately parallel to the axial direction of the samples are generated on the surface of most coal samples, accompanied by a large number of shear cracks.Tension–shear composite failure
15–25The macroscopic failure surfaces with a certain angle to the axial direction of the sample are developed on the surface, and the failure degree of the sample is relatively smallShear failure (dominant)
1.0–5.00–5Axial splitting failure, but the integrity of coal samples was destroyed, and some pieces and debris were stripped aroundTensile failure (dominant)
10Splitting cracks and shear cracks are widely developed on the surface of coal sampleTension–shear composite failure
15–25The macroscopic failure surfaces with a certain angle to the axial direction of the sample are developed on the surface, and the failure degree of the sample is further increasedShear failure (dominant)
7.5–10.00–5Conical failure (dominant). The sample has poor integrity, with more fragments, showing bursting characteristics.Tensile failure (dominant)
10Splitting cracks approximately parallel to the axial direction of the samples are generated on the surface of most coal samples, accompanied by a large number of shear cracks. Axial splitting is transformed into shear slipping failureTension–shear composite failure
15–25The macroscopic failure surfaces with a certain angle to the axial direction of the sample are developed on the surface, and the integrity of the sample is destroyedShear failure (dominant)
Table 5. Proportion of tensile and shear cracks under different inclination angles at a loading rate of 1 mm/min.
Inclination Angle (°)Tensile Crack/Total Crack (%)Shear Crack/Total Crack (%)
057.9642.04
555.7844.22
1042.4857.52
1536.8763.13
2026.0373.97
2522.6577.35
Table 6. Proportion of tensile and shear cracks under different inclination angles at loading rate of 10 mm/min.
Inclination Angle (°)Tensile Crack/Total Crack (%)Shear Crack/Total Crack (%)
069.5630.44
567.4632.54
1062.7537.25
1548.3551.65
2045.0554.95
2539.8160.19

