Review

Development of Everting Tubular Net Structures Using Simulation for Growing Structures

1
Fraunhofer Institute for Machine Tools and Forming Technology IWU, 01187 Dresden, Germany
2
Professorship for Adaptronics and Lightweight Design, Chemnitz University of Technology, 09126 Chemnitz, Germany
*
Author to whom correspondence should be addressed.
Appl. Sci. 2020, 10(18), 6466; https://doi.org/10.3390/app10186466
Submission received: 27 August 2020 / Revised: 10 September 2020 / Accepted: 11 September 2020 / Published: 17 September 2020
(This article belongs to the Special Issue Modeling, Design, and Optimization of Flexible Mechanical Systems)

Abstract

:
Many living beings show the ability and necessity to develop invertible, tubular structures to enable additional functions temporarily. The biological archetypes always demonstrate a high change of volume of the structure between an inactive and active state. This makes the principle interesting for many technical applications, where a certain geometry or an additional volume has to be generated situationally for a task and can only be accepted temporarily, for example, in minimally invasive robotics. A possibility was sought to transfer the archetype into the technical context and to evaluate geometric-constructive dependencies based on an inversion of the structure. The result is a practicable design for repeatedly invertible net structures, which can be used for products with temporary additional functions and volumes.

Graphical Abstract

1. Introduction

Depending on the situation, numerous technical structures need a certain geometry or additional volume to fulfill a specific task. Changes in system volume or stiffness are mostly accepted only for a previously specified duration. Exemplarily, medical applications in minimally invasive surgery benefit from endoscopes that are designed with necessary high volume-change rate between active and inactive state, when not in use. Flexible tubular structures that evert from inside to outside, and thus simultaneously elongate at the top, fulfill the demands in volume change rate. Several examples for the everting of tubular body parts exist in nature: caterpillars of myrmecophilous Lycaenidae hold tentacle organs, pulling out if needed to expel nutritious secretions, which decrease ant aggressiveness [1]. Nemerteans can evert their proboscis when catching and eating their prey [2]. Apple snails (Pomacea) possess both gills and lungs; while submerging under water they are additionally enabled to respire beneath due to the so-called siphon—a tube pushed by muscular activity from the mantle and connecting the pulmonary sac with air above the water surface [3].
A variety of studies deals with continuously growing telescope-like structures. Such applications temporarily provide an increase in volume to perform mechanical work and thus manipulate their environment. Further systems act locally in an entire structure. Their continuous movement can, for instance, cause a change in shape or movement direction of assembly. The intrinsic density of functionality facilitates very small system dimensions at low cost. For example, tubular working principles are known which are based on small prebent tubes made out of shape memory alloys (SMA) [4]. They incrementally adapt their shape in a limited space to the surrounding structure. Several patents were granted for tubular structures like endoscopes and insertion auxiliary devices that are covered by supportive encasements [5,6,7]. A flexible hose was used in [8] as a pneumatic artificial muscle (PAM) to generate a continuous growth of the structure by unfolding. The system is driven by air pressure to perform simple positioning tasks. The pressure supply provides an easy way to control the system, but additional components are necessary. The transferable loads are limited due to the thin foil-like skin. With the application of thicker foils, it is possible to increase stiffness, but this results on the other hand in a more difficult everting behavior. Another possibility to realize an everting process is to use net-like structures, which have been utilized for decades to protect contoured shafts while transport [9]. Several plane structural designs and in part tubular net shapes were studied in [10], everting of structures was not investigated. The deformation behavior via 3D buckling was investigated using nonperiodic nets. Additionally, further investigations used homogenization strategies to describe the effective material behavior of such anisotropic structures [11,12].
Early studies like [13,14] show the ability and necessity to develop extremely flexible structures in nature. They inspired authors to transfer the mechanisms into technical applications [15]. All of the aforementioned naturally or artificially driven basic mechanisms are characterized by a high amount of bearable deformation as well as the thin membrane structure principle to reduce bending loadings. With help from additive manufacturing, it is now possible to realize such compliant structures with free design flexibility.
The first part of the paper deals with a preliminary study that ensures the printability of net structures, especially according to the highly loaded zones of crossing points while undergoing huge stresses in an everting process. Therefore, the additive manufacturing material was characterized and the Young’s modulus was determined as input for calculation and structural design. The second part addresses improvement of the geometry by simulation as well as the production procedure in additive manufacturing. The result is a feasible design and production strategy, which can be used within new industrially applicable procedures.

2. Materials and Methods

We started with the analysis of the additive manufacturing parameters depending on the material, sample geometry and the alignment on the building platform. The aim was to determine the smallest possible bar diameter at which a qualitative result was reproducible. The samples were additively manufactured, visually characterized and preferred parameters were evaluated in terms of printing orientation, tilting angle and support structure. Based on these findings, tensile bars were designed, manufactured additively and tested to determine Young’s modulus for further simulation. The samples were also used to identify the deviation between the design specification and the manufactured geometry (diameter) by quantitative and qualitative microscopy. Subsequently, a parameterized net structure was set up for the simulated investigation of the everting behavior as a function of the number of crossing points (nodes), net angles and bar lengths to evaluate suitable geometric parameters for a net structure that exhibits such low load phenomena that reversible everting could take place without structural damage. According to the determined preferred parameters, the net structure was finely modeled in CAD, tessellated and additively manufactured (in stereolithography (SLA) process). The structure was visually characterized (print quality and diameter check), subjected to a manual function test (multiple everting) and then visually characterized again (damages, e.g., fractures). Based on the defect pattern, the overall structure (net) was reworked by homogenizing the transition areas between the bars (nodes) and a connected fine simulation. Finally, the additive manufacturing and renewed visual characterization as well as the functional test of the improved net structure were carried out.

2.1. Computer-Aided Design and Additive Manufacuring

For all calculations we used the CAD software Catia (version number: V5 2016) and for the manufacturing the Formlabs 2 (SLA method) and the slicing software PreForm (version number: 3.5.1). Additive manufacturing material, layer height in the printing process and postcured parameters were kept constant during all tests. The varying parameters are described in detail in the following sections.
To determine suitable additive manufacturing and geometry parameters for a reproducible result with high quality, a simple sample geometry of rods with a constant diameter was used first. Five different bar diameters were placed on the same base plate. The length of the bars was kept constant at 20 mm. The bars were designed with diameters of 1, 1.25, 1.5, 1.75 and 2 mm (Figure 1).
In an additive manufacturing process, six samples were produced in a software-supported manner. The orthogonal orientation of the sample on the building platform and the tilting angle was varied. Alignment and tilting angle were generated by the algorithm of Formlabs’ PreForm software (example B2, tilting angle: 44°) and then manually optimized in favor of a smaller number of support structures (example B1 and B3, tilting angle 17°). B4, B5 and B6 were manually arranged without tilting angle and support structures. Samples B1, B3, B4 and B6 were arranged along the x-axis, with the direction of the wiper movement. Samples B2 and B5 were placed along the y-axis, perpendicular to the direction of wiper movement. B4 and B6 were arranged 180° to each other around the z-axis (Figure 2).
Flexible Resin V2 (FLFL GR02) was used as printing material. To obtain a homogeneous surface and high form fidelity, the finest possible layer height of 0.05 mm per layer was chosen. To obtain the maximum tensile strength, the postcure process was performed based on manufacturer requirements with 15 min dwell time in the cleaning bath (99% isopropanol solution), subsequent fine cleaning with a fine brush, and UV and temperature treatment at a wavelength of 405 nm and 60 °C for 60 min in Formlabs’ FormCure. The samples were then visually characterized and parameters for geometry and alignment on the printer were evaluated.
For characterization and based on these findings, as well as in accordance with DIN EN 10002-1 for metallic materials, round tensile bars were additively manufactured without support structures (Figure 3). The alignment was done in orthogonal orientation along the x-axis without a tilting angle. The tensile bars were then postcured accordingly.
The preferred geometric variant of the tubular net structure determined by the simulation was parametrically designed in CAD, tessellated (format: binary; deviation: 0.01 mm; angular tolerance: 6°), additively manufactured without support structures or tilting angle, and postcured. Finally, the transition areas between the constituent bars in the node were homogenized by rounding (see Figure 4).

2.2. Characterization

For dimensional checks of printing quality and size accuracy, the diameter of the tension bars and the net bars were visually measured on a stereo-zoom microscope SMZ1500 (manufacturer Nikon). The tension bars were measured at four points along the tapered section to determine the variance within one bar (Figure 5). Furthermore, using these four values a statistically verified factor of the size accuracy regarding to the target diameter was identified.
To determine the Young’s modulus required for the simulation of the net geometry, the round tension bars were subjected to a quasi-static tensile test with a velocity of 0.1 mm/s (which leads to a strain rate of 0.0067 s−1) until fracture by using a testing machine, AllroundLine Z020 by Zwick Roell with a 100 N load cell. Because of the characteristics of the measured curve progressions, which show an approximately linear shape with minimal deviation, the calculation of the modulus was done using a regression line from the origin to 100% deformation, three tests were executed using the same setup and evaluation method, producing the value for the Young’s modulus for simulations as an average value. The loading of the complex branched tubular structure causes complex three-dimensional stress states with tension and pressure portions. In a first approach, only the tensile properties were investigated within the simple tension test. With the isotropic Young’s modulus determined with tension/pressure symmetry, the first numerical models were built for direct comparison with each other.
The additive manufactured nets were also characterized by quantitative microscopy that was carried out both before and after the functional tests (manual everting). In order to be able to identify possible deviations depending on the position during printing, three to six measuring points were evaluated at three heights (see Figure 6: bottom (blue), middle (orange), top (green)), evenly distributed over the circumference. All four bars meeting at a node were measured and an average value was calculated from the values.
The nets were functionally tested by realizing the initial everting process followed by repeated folds through manually everting. Subsequently, a visual check was done again to detect cracks and damages caused by the functional tests.

2.3. Numerical Simulation Environment

Two different simulation model types were built. In a preliminary study of net parameters, the whole tubular structure was modeled with a parametric Ansys APDL script. The geometry was then transferred with the same script into LS-Dyna keywords using beam elements (type 1, Hughes-Liu with cross section integration). The explicit solver with single precision was used in LS-Dyna R11.0.0 winx64 (SMP type) to perform the computations on an eight-core desktop PC. The second model type was used to investigate local loading peaks in a detailed model of a unit cell of the structure on the one hand, and to improve geometry with the results on the other hand. Both unit cell geometry variations were built via LS-Prepost 4.7 and output into LS-Dyna keywords using tetrahedral solid elements (element form 4, S/R quadratic tetrahedron element with five integration points). The implicit solver (double precision SMP type) was then used within LS-Dyna R11.0.0 to compute the problem. The implicit solver type used was nonlinear with Broyden-Fletcher-Goldfarb-Shanno (BFGS) updates and optional arc length method. This is the default solver for this kind of problems.

3. Results

3.1. 3D Printing Orientation

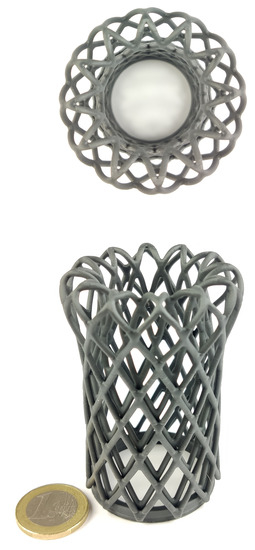
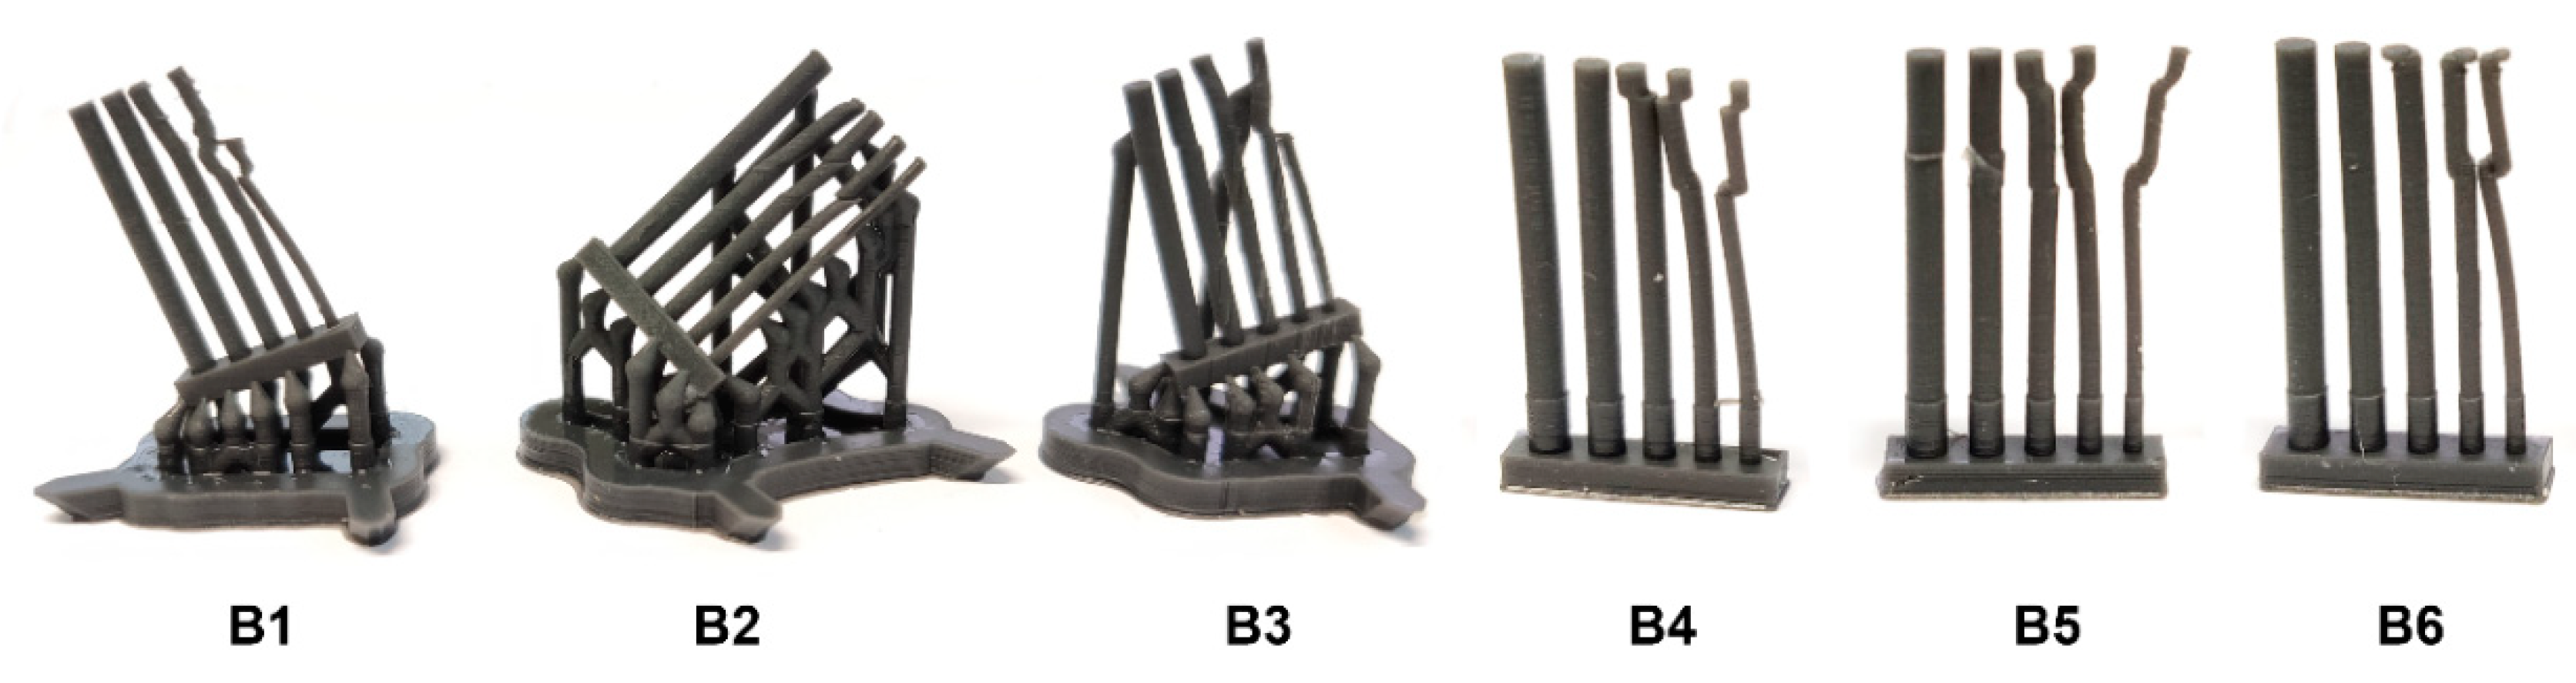
The variation in the number of support structures showed that they have a great influence on the shape accuracy, which was expected–the higher the number, the better the shape accuracy (see B1 to B3 in Figure 7). Thus, all test prints without support structures show forming inaccuracies with a bar diameter <2 mm (see B1, B4 to B6 in Figure 7). In order to develop a printing regime for structures that are as filigree as possible with as few supporting structures as possible, the printing orientation was also varied. It was found that nonangled specimens (without support structures) are more accurate in shape than angled ones at very small diameters (see B1 in comparison to B4, B5 and B6: the 1 mm bar (smallest) is incompletely printed at B1). However, the orientation (rotation in z-axis) of the specimens on the building platform has no influence on the shape accuracy (see B4 and B6 in Figure 7).
As a result, for the selected material (Flexible Resin V2), the 3D printing unit (Formlabs V2) and the printing parameters used (0.05 mm layer height, no support structure), with a free length of the individual bar of 20 mm, a bar diameter of 1.75 mm (corresponds to the target diameter created in CAD) should not be undercut in order to achieve a high probability of forming accuracy (B2 and B3 have subtle forming inaccuracies). Of all the samples, the target diameter of 2 mm created in CAD showed the smallest form deviations and was therefore selected for all further tests and simulations. There was a difference between the nominal diameter created in CAD and the actual diameter obtained after 3D printing (pl. see Section 3.4).
The following diameter specifications in the simulation therefore refer to the real diameter of 1.7 mm.

3.2. Material Characterization and Young’s Modulus

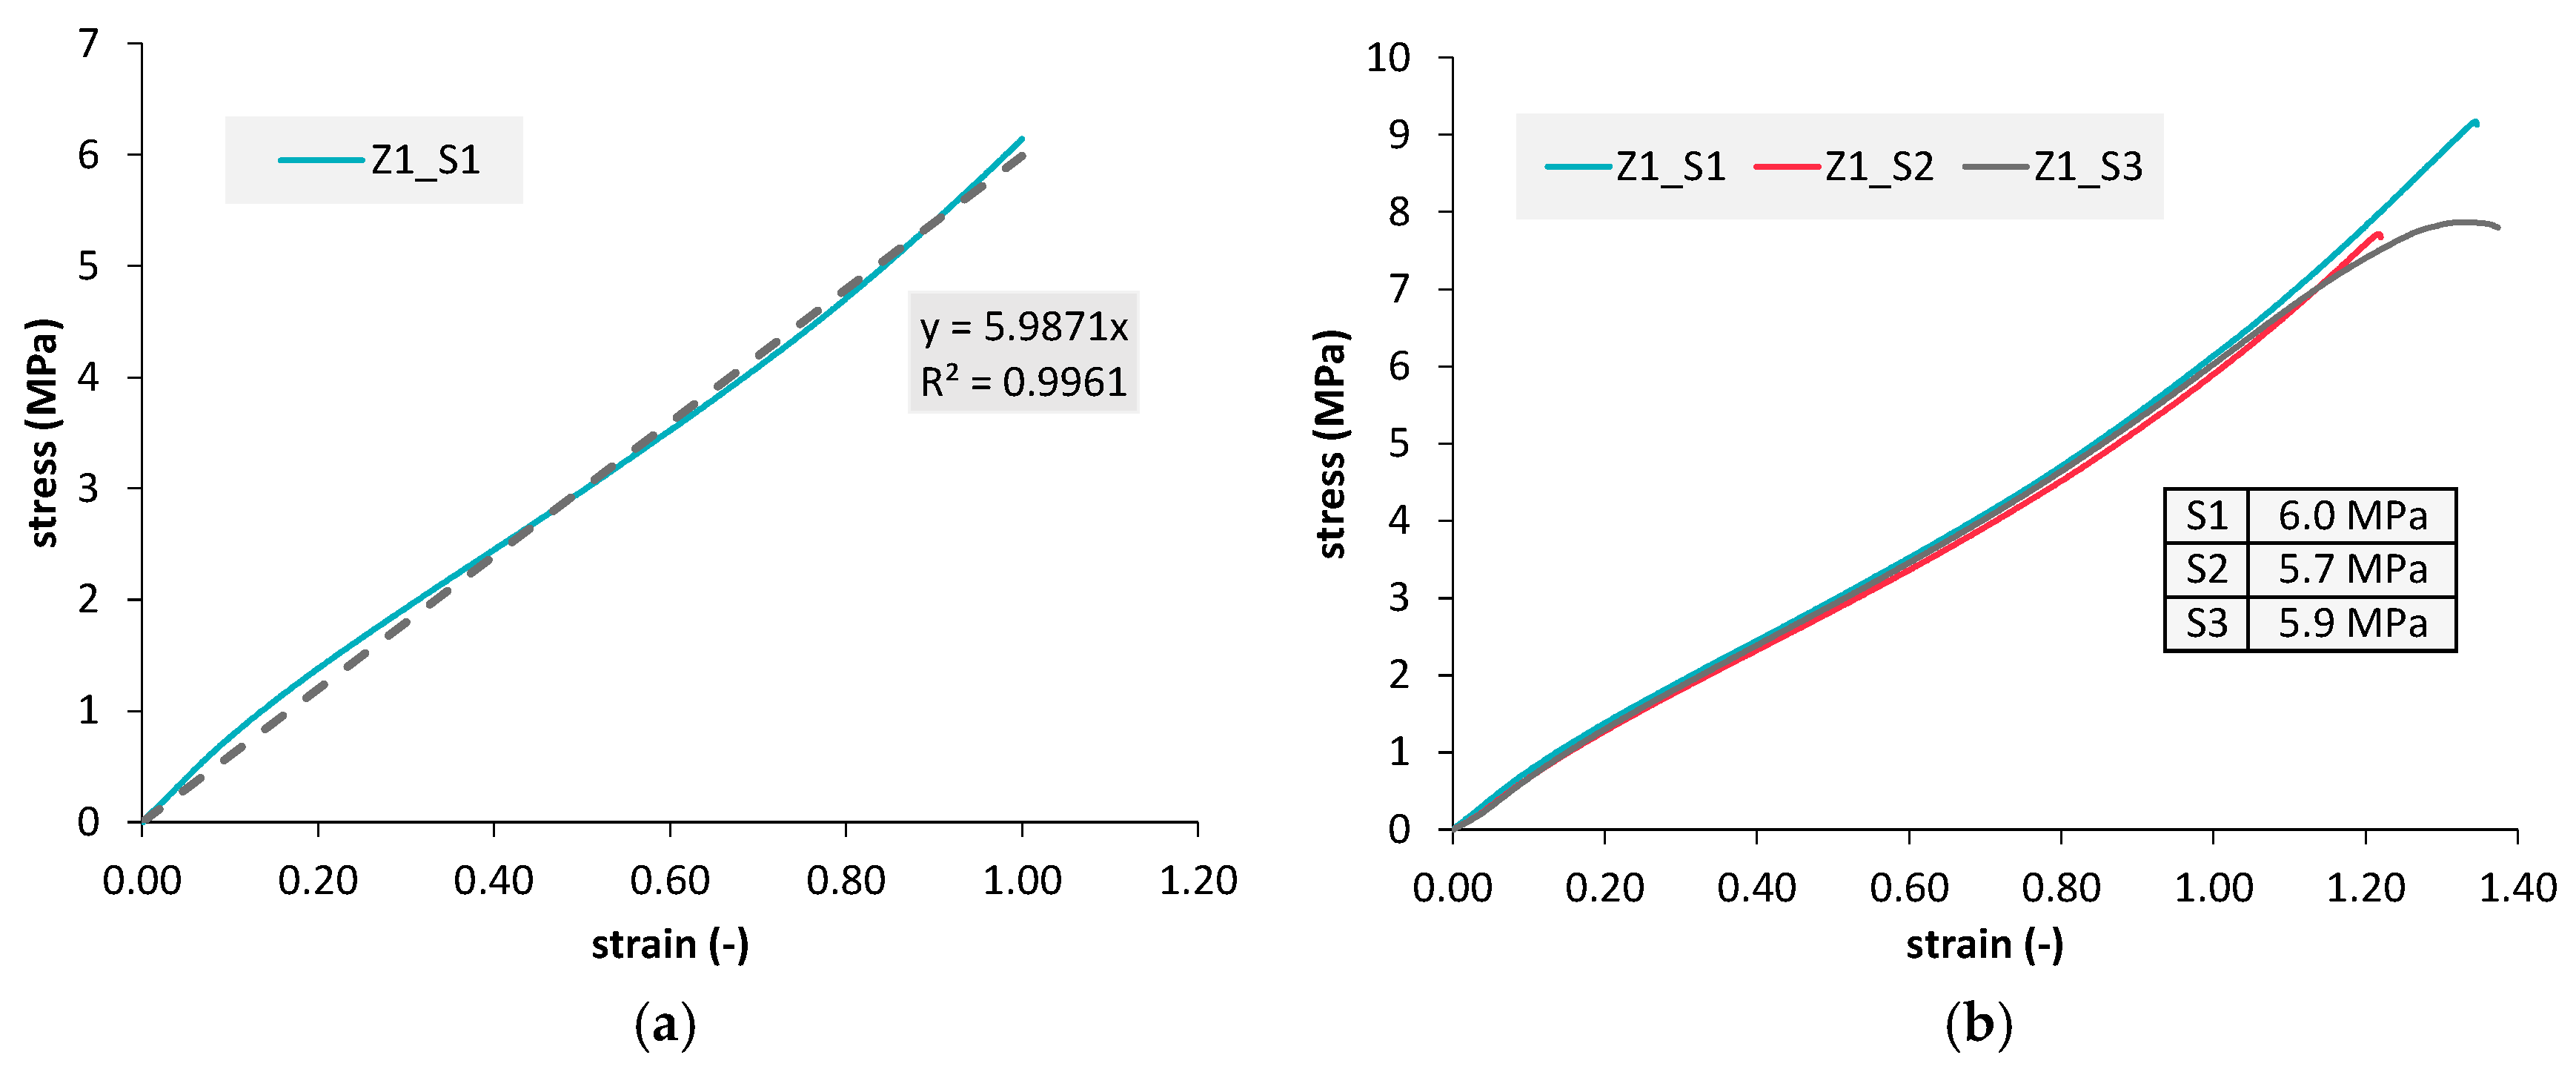
Using the findings of the minimal printable diameter, round tension bars were defined, additively manufactured and mechanically tested. All three measured samples show a similar curve progression as shown in Figure 8. Since the curves, in this case, show an almost linear-elastic shape and all three curves are almost identical, it is therefore warranted to determine the mechanical parameters (Young’s modulus) required for the simulation by means of a quasi-static tension test. Figure 8b shows an exemplary regression line for one sample. All regression lines were created in the uniform range up to the engineering strain of ε = 100%. The values of Youngs’ modulus thus determined are given in the table in Figure 8b and show similar values. This allows the calculation of the Young’s modulus required for simulation as an average of the values obtained. As a result of those parameter combinations (material and printing parameter), the modulus of 5.9 MPa (5.9 N/mm2) was determined, which was rounded to 6 MPa (6 N/mm2) and then used in later simulations. A potential unloading behavior may occur that is different from the loading stage. In the following numerical investigation, only the loading of the structure is analyzed. A more complex material characterization will be part of further studies.

3.3. Preliminary Study of Net Parameters

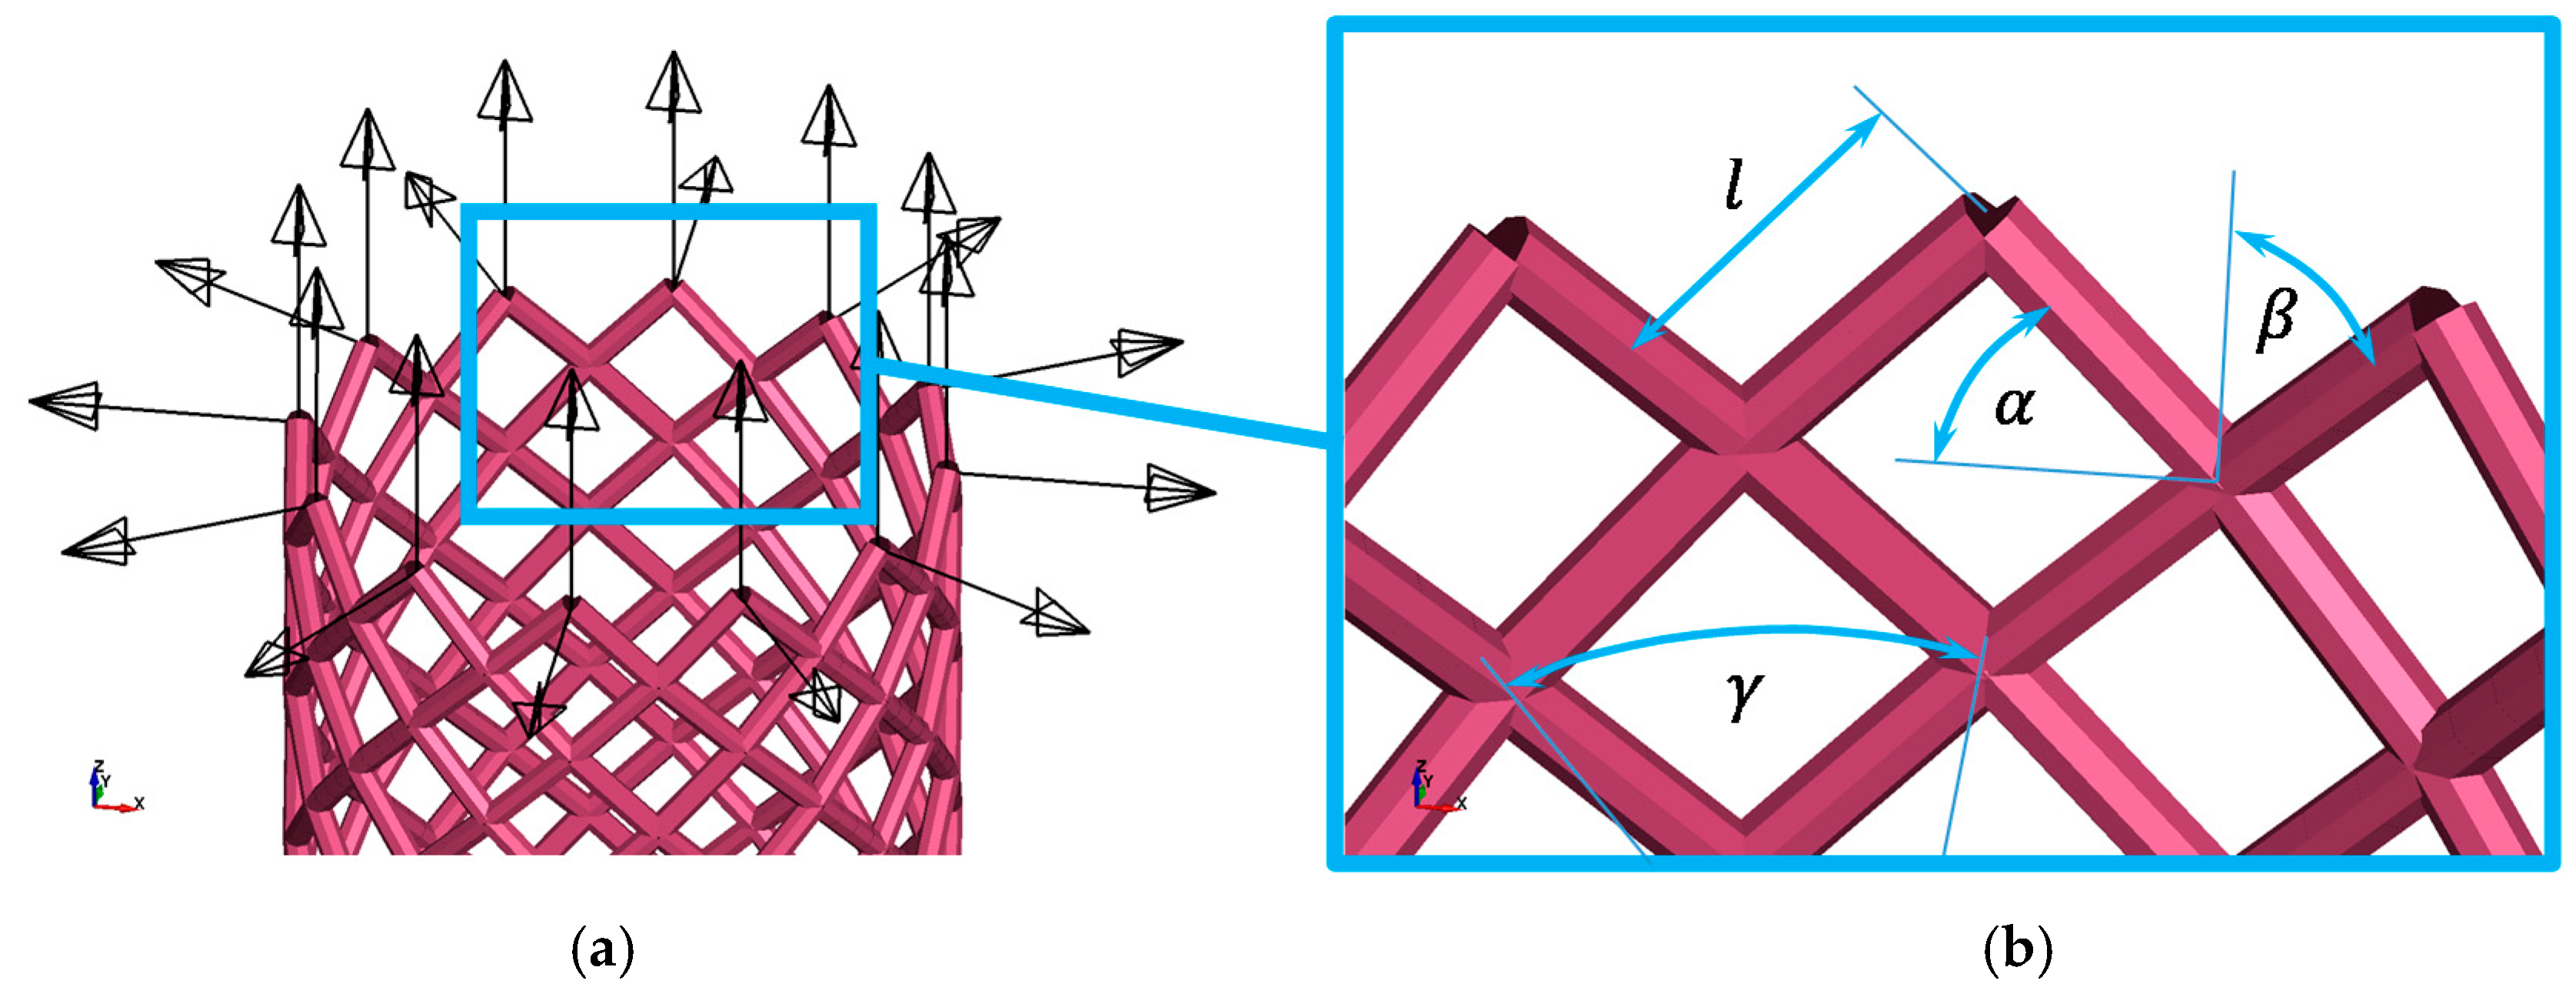
In the first design step, the parameters of the net structure were investigated concerning the prospects for everting behavior and possible occurrence of critical loadings. The parameters are strongly linked to each other, due to the discrete nature of the net and amount of crossing points. With a given number of circumferential crossing points, the length of bars scales the angles between them and vice versa. At a given bar length, an increase of circumferential crossing points leads to changed angles between bars. On the other hand, with a given cylinder height, the number of crossing points in the cylinder axis direction changes bar lengths and angles. Hence, some parameters were fixed and the alteration of the main variable defines the remaining dependent parameters.
The number of circumferential crossing points was set to n = 12 , which results in a section angle γ = 2 π n (Figure 9). The number of crossing points k in the cylinder axis direction was chosen to give a cylinder height of a near 145   mm , which reaches the maximum printable height. The cylinder radius was set to r = 20   mm . The angle α between the bar and horizontal axis was chosen as the main variable. The angle β = 90 ° α between the bar and vertical axis and the bar length itself l = ( π r n ) cos α results from the main variable and fixed parameters. The geometric model was built via Ansys APDL script, so that the crossing points were defined and connected with straight beam elements to structure the tubular geometry. With the script, the model was then transferred into LS-Dyna keywords. At the same time, load coordinate systems were defined to overcome the strict Cartesian restriction in LS-Dyna, which allows no general load definition in a cylindrical coordinate system.
Three variations 30°, 45° and 60° of the main variable α were modeled in LS-Dyna with beam elements (default type 1, Hughes-Liu with cross-section integration). Each bar consists of four beam elements (diameter of 1.7 mm) to account for the bending compliance of bars. The lower tube end nodes were fixed in all degrees of freedom, which models a clamping of the lower end. For the upper end nodes, a prescribed nodal translational in radial tube direction was applied for each node in the beginning of the simulation, using the already defined local Cartesian coordinate systems (Figure 9a). Additionally, a translational motion in the negative z-direction (toward the lower end nodes) completes the initial everting stage and allows for a further continuous everting progress. The beams use a purely linear–elastic material model (*MAT_002) with Young’s modulus of E = 6   MPa (6 N/mm2) (according to evaluation of tensile test above), density of ρ = 2000 × 10 12 t mm 3 and a Poisson’s ratio of ν = 0.49 according to hyperelastic characteristics of material. A self-contact of the tube was defined using a single beam element set within the contact-card *CONTACT_AUTOMATIC_GENERAL. Otherwise, excessive self-penetration would occur. The total simulation time was set to 2 s to ensure a nearly quasi-static loading condition. This leads to a negative axial motion with a velocity of the upper-end tube nodes of − 400   mm s in the z-direction.
The explicit solver with single-precision was used in LS-Dyna R11.0.0 winx64 (SMP type) to perform the computations on an eight-core desktop PC. 
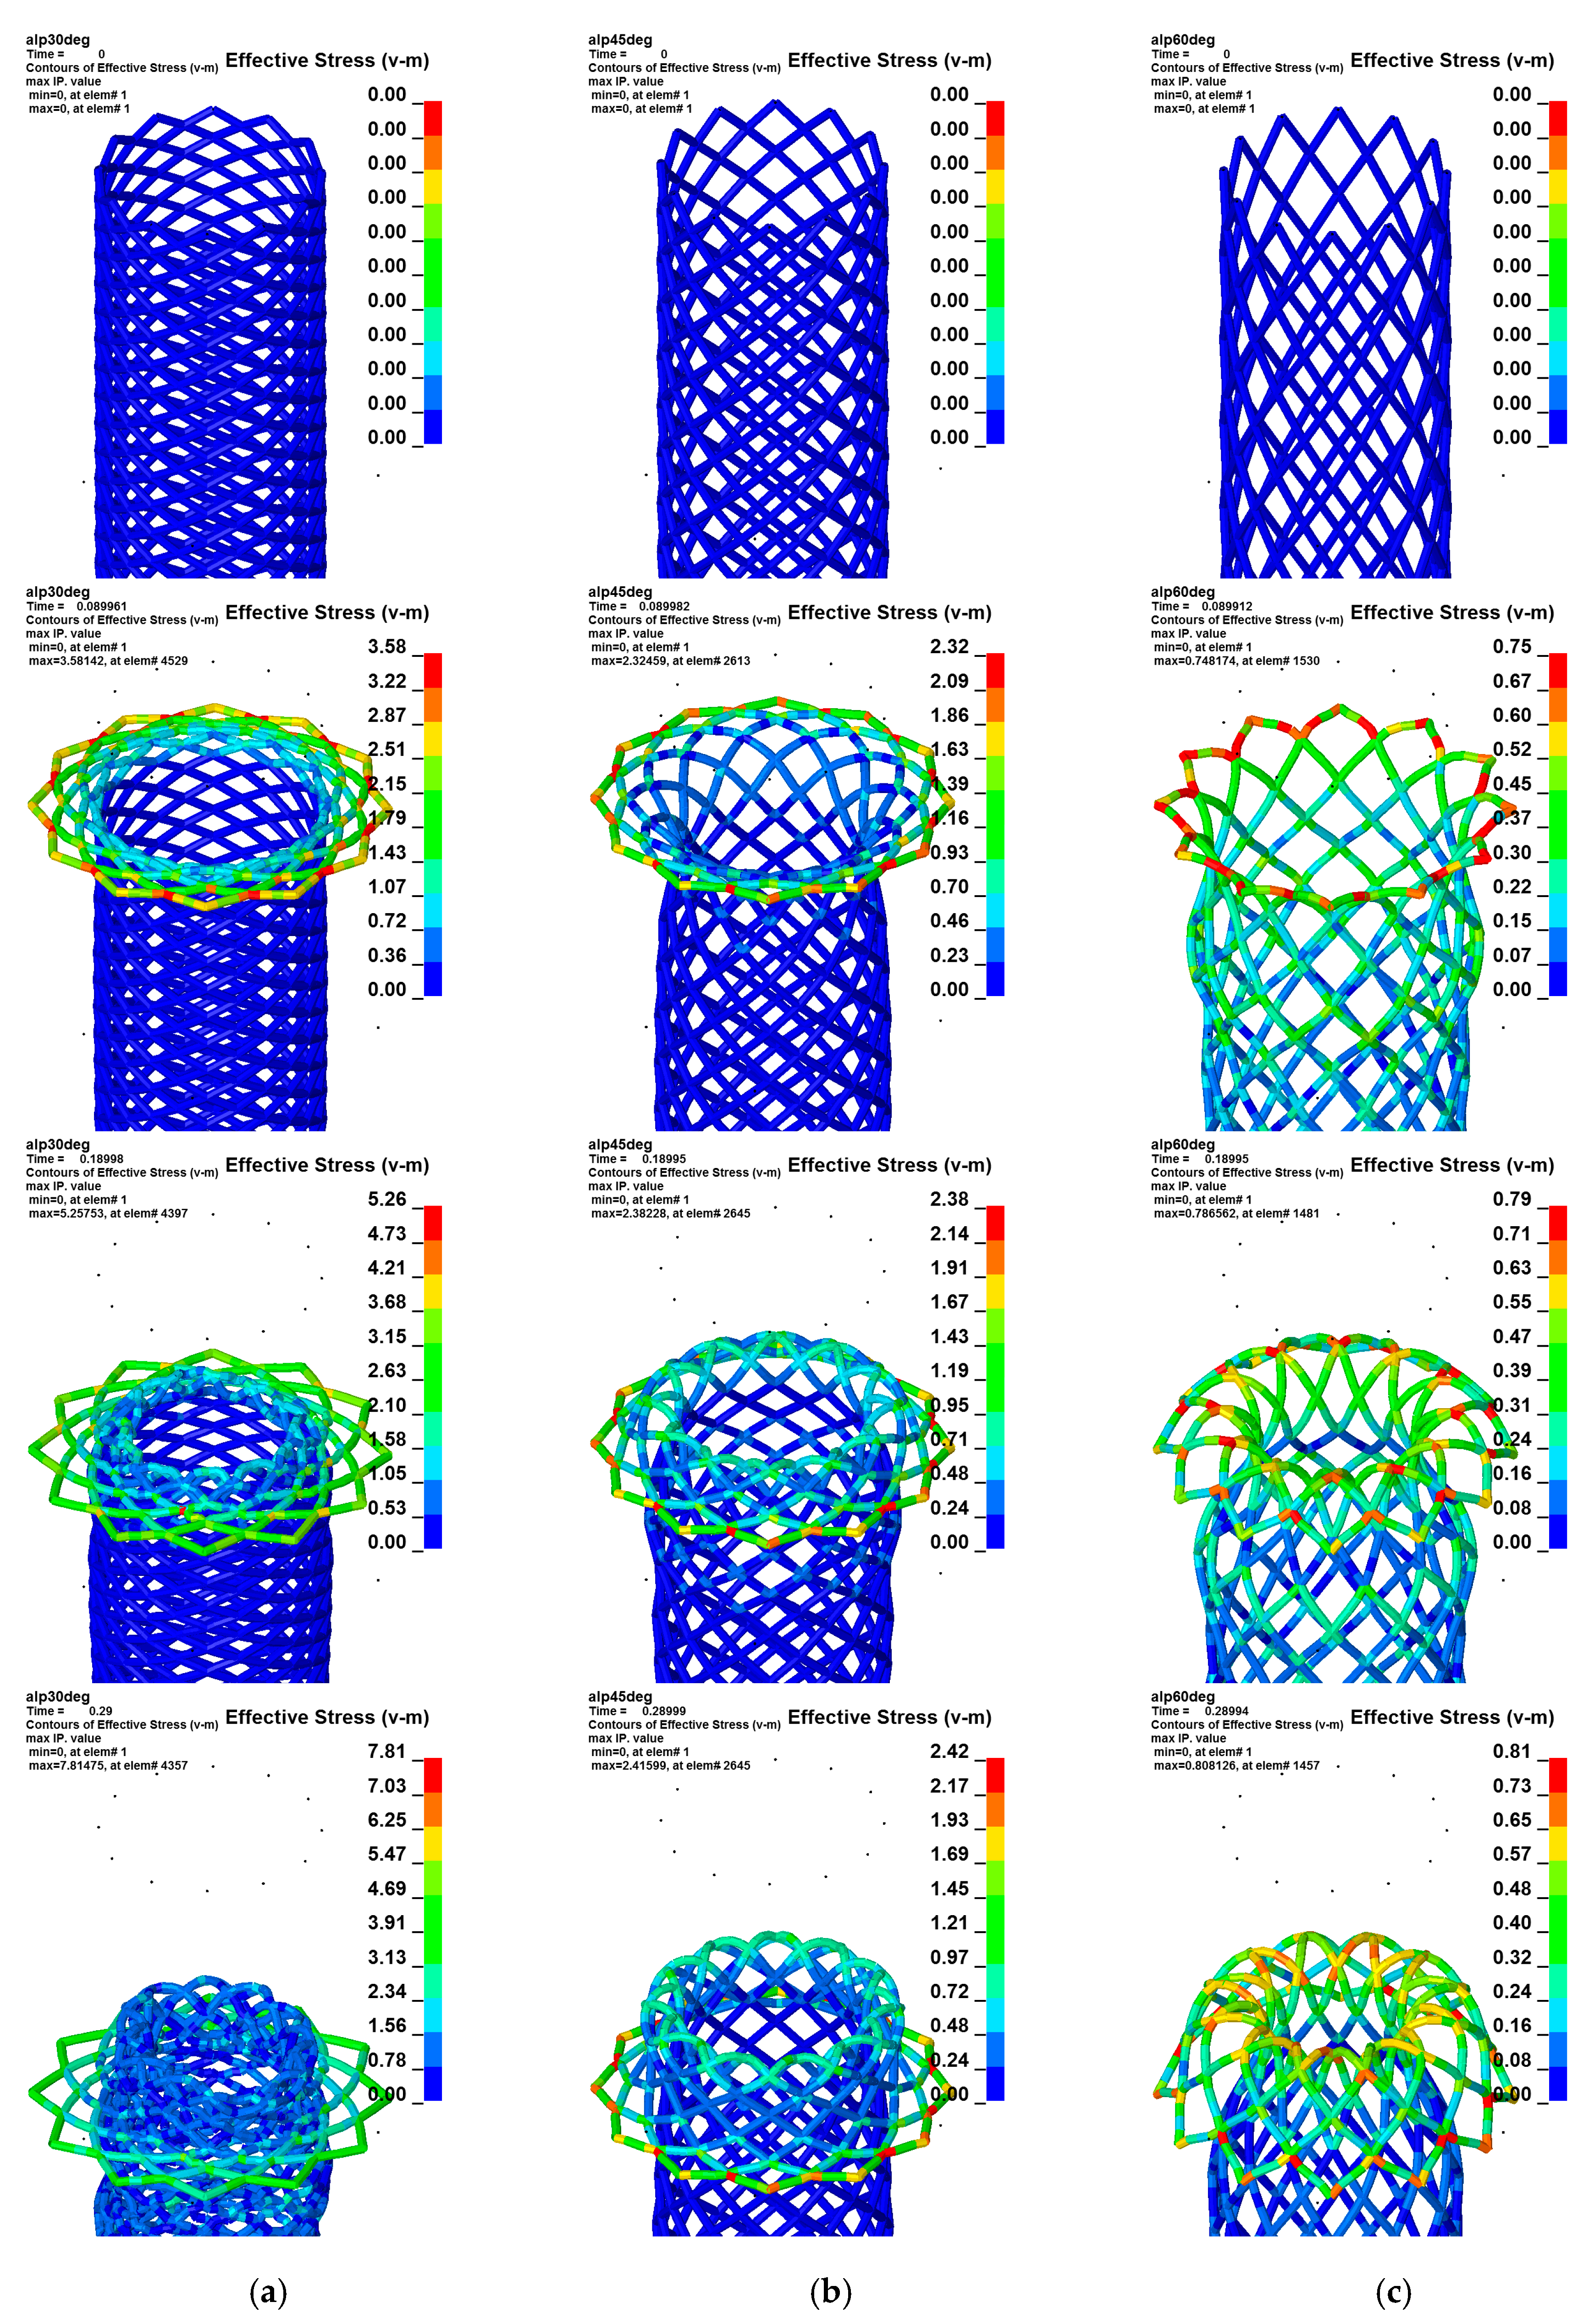
Figure 10 shows the results of the three geometry variation simulations (main variable α = { 30 ° , 45 ° , 60 ° } ) as a comparison of equivalent von Mises stress distribution of the three models along everting simulation time. Each column (Figure 10a–c) represents a single model with results of four simulation times. The times were recorded at equal simulation points and hence loading stages (rows in Figure 10).
The model with the main angle of α = 30 ° (Figure 10a) shows a very unstable evert behavior due to the highest structural stiffness against everting. In the initial everting stage, the structure below the everting zone is equally deformed (angles α and β ) until a critical structural stiffness is reached; the whole tube shows an unstable deformation behavior in simulation after evert-buckling in the initial stage. Furthermore, in the initial everting stage, high equivalent von Mises stresses of about 4 MPa (4 N/mm2) occur in the simulation. Figure 10b shows the same everting process with an angle of α = 45 ° between the bar and horizontal axis. The initial stage is characterized by more stable everting behavior. Nevertheless, the deformed bar structure below the evert zone possesses a high stiffness. The elastic energy is mainly stored in the uneverted free zone below. The initial everting takes place after the structural stiffness of the tube below the everting zone is higher than the stiffness in the deformed everting zone. The observed average von Mises equivalent stress amounts to 2.5 MPa (2.5 N/mm2). Further continuous everting takes place under stable conditions. Minor buckling on the free tubular surface below the evert-buckling zone was recorded. The third model with an angle of α = 60 ° shows very easy initial evert-buckling due to reduced structural stiffness against the nodal motion. Higher global instabilities can be seen, but in the initial phase, the everting behavior is the best of the three models. In the later continuous everting stage, some buckling in the region of still uneverted structures occurs. However, a stable continuous everting is possible. The average von Mises stress amounts to 0.8 MPa (0.8 N/mm2).
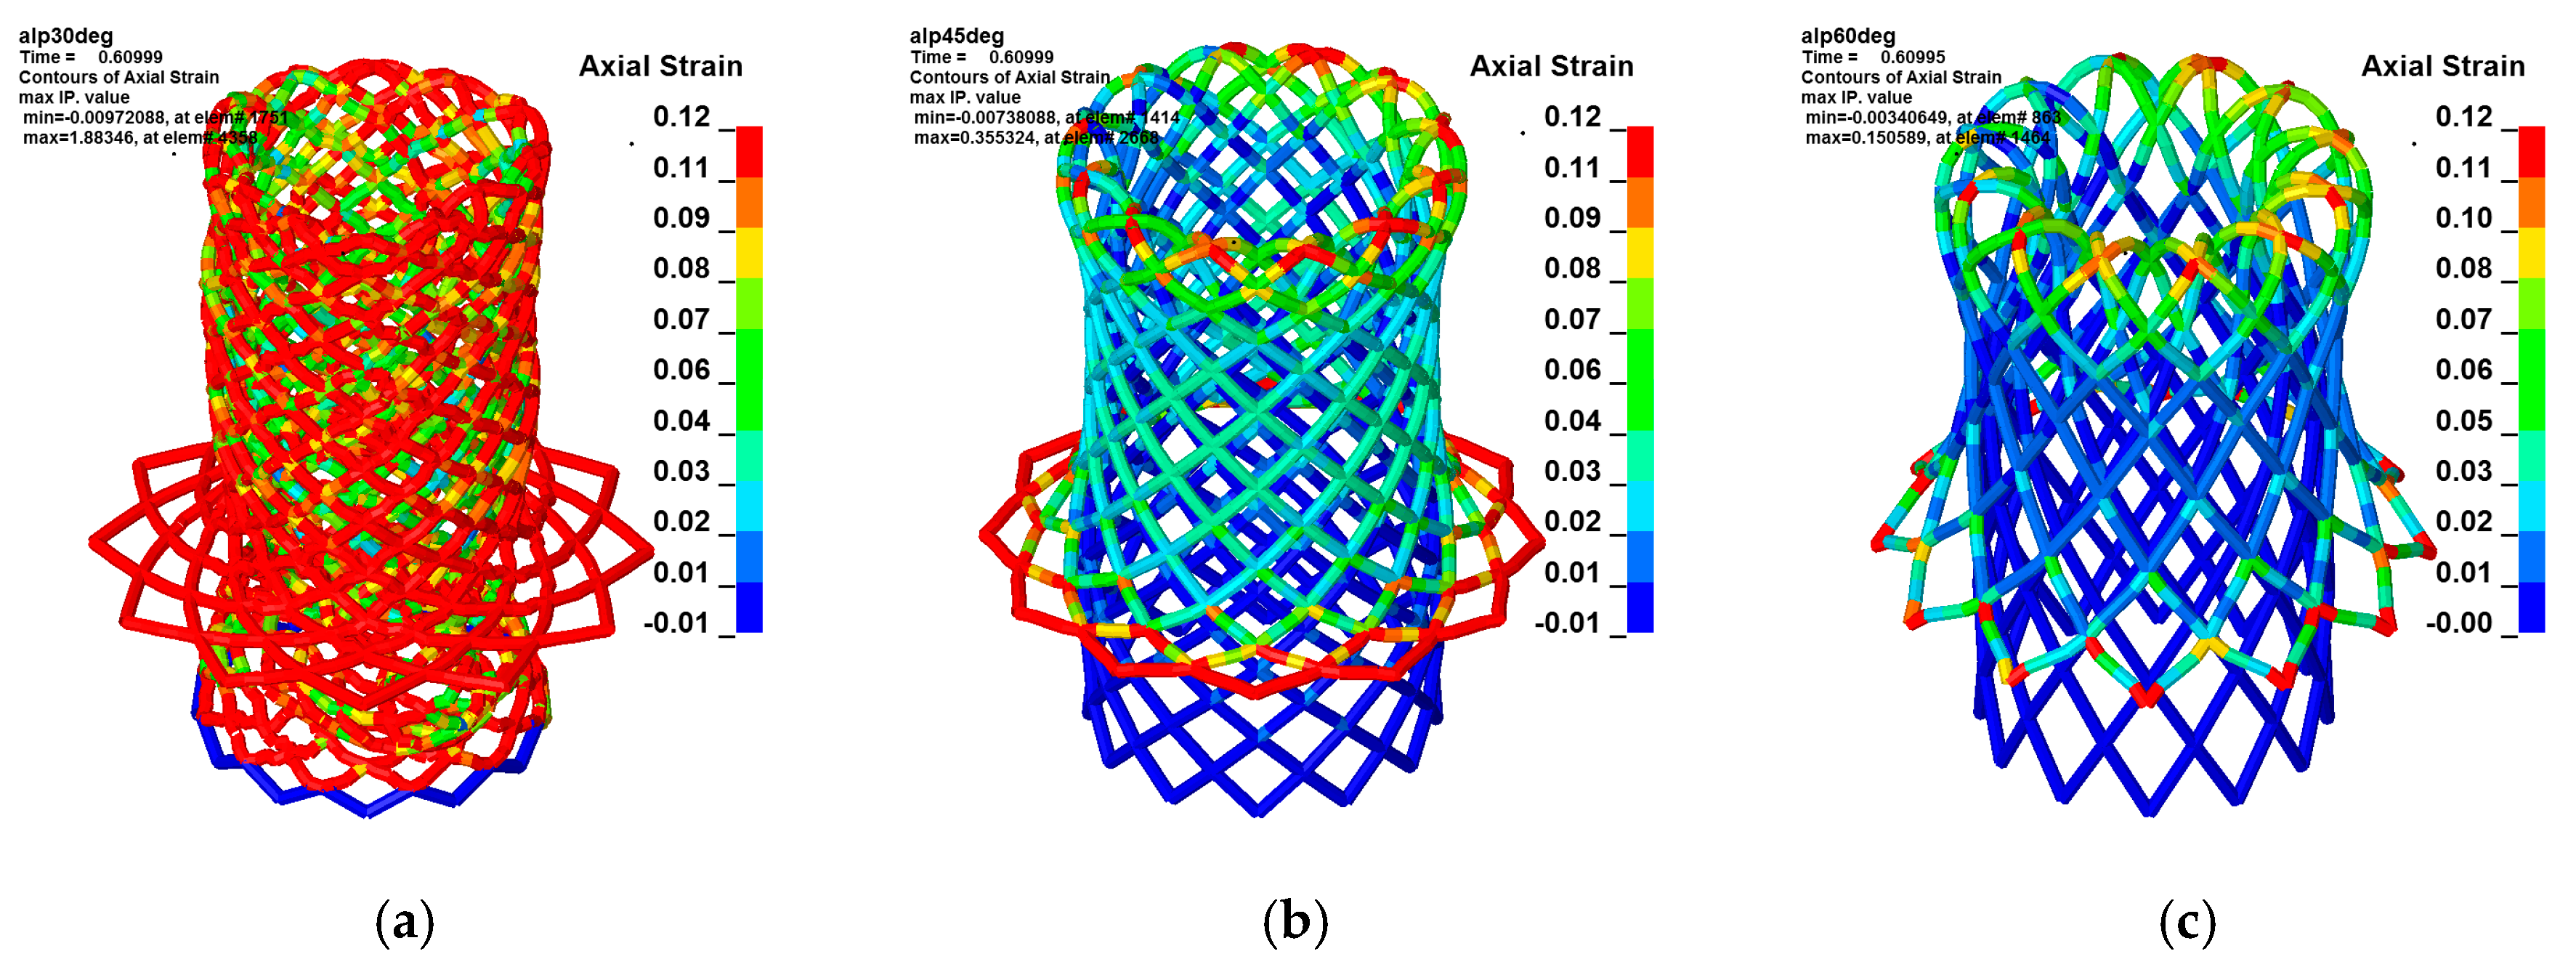
The strain in the everting zone follows directly from the stresses, due to assumed linear–elastic material behavior. Strain peaks of 0.12 for a net angle of 60° up to 0.16 for an angle of 30° arise in the everting zone (Figure 11). The model with a net angle 30° shows a very unstable everting process (pl. see Figure 11a).

3.4. Dimensional Stability and Net Quality

The visual characterization of all additively manufactured geometries showed that the printed bar diameter is always smaller than the target diameter, with an average of 12%, a minimum of 10% and a maximum of 16% (exemplary to see in Table 1 and Table 2). This deviation has to be considered by defining the construction parameter. The diameter of one single bar exhibits a nearly constant value with a variance of less than 1%. For the simulation, the average value determined was rounded from 1727.58 μm to 1.70 mm.
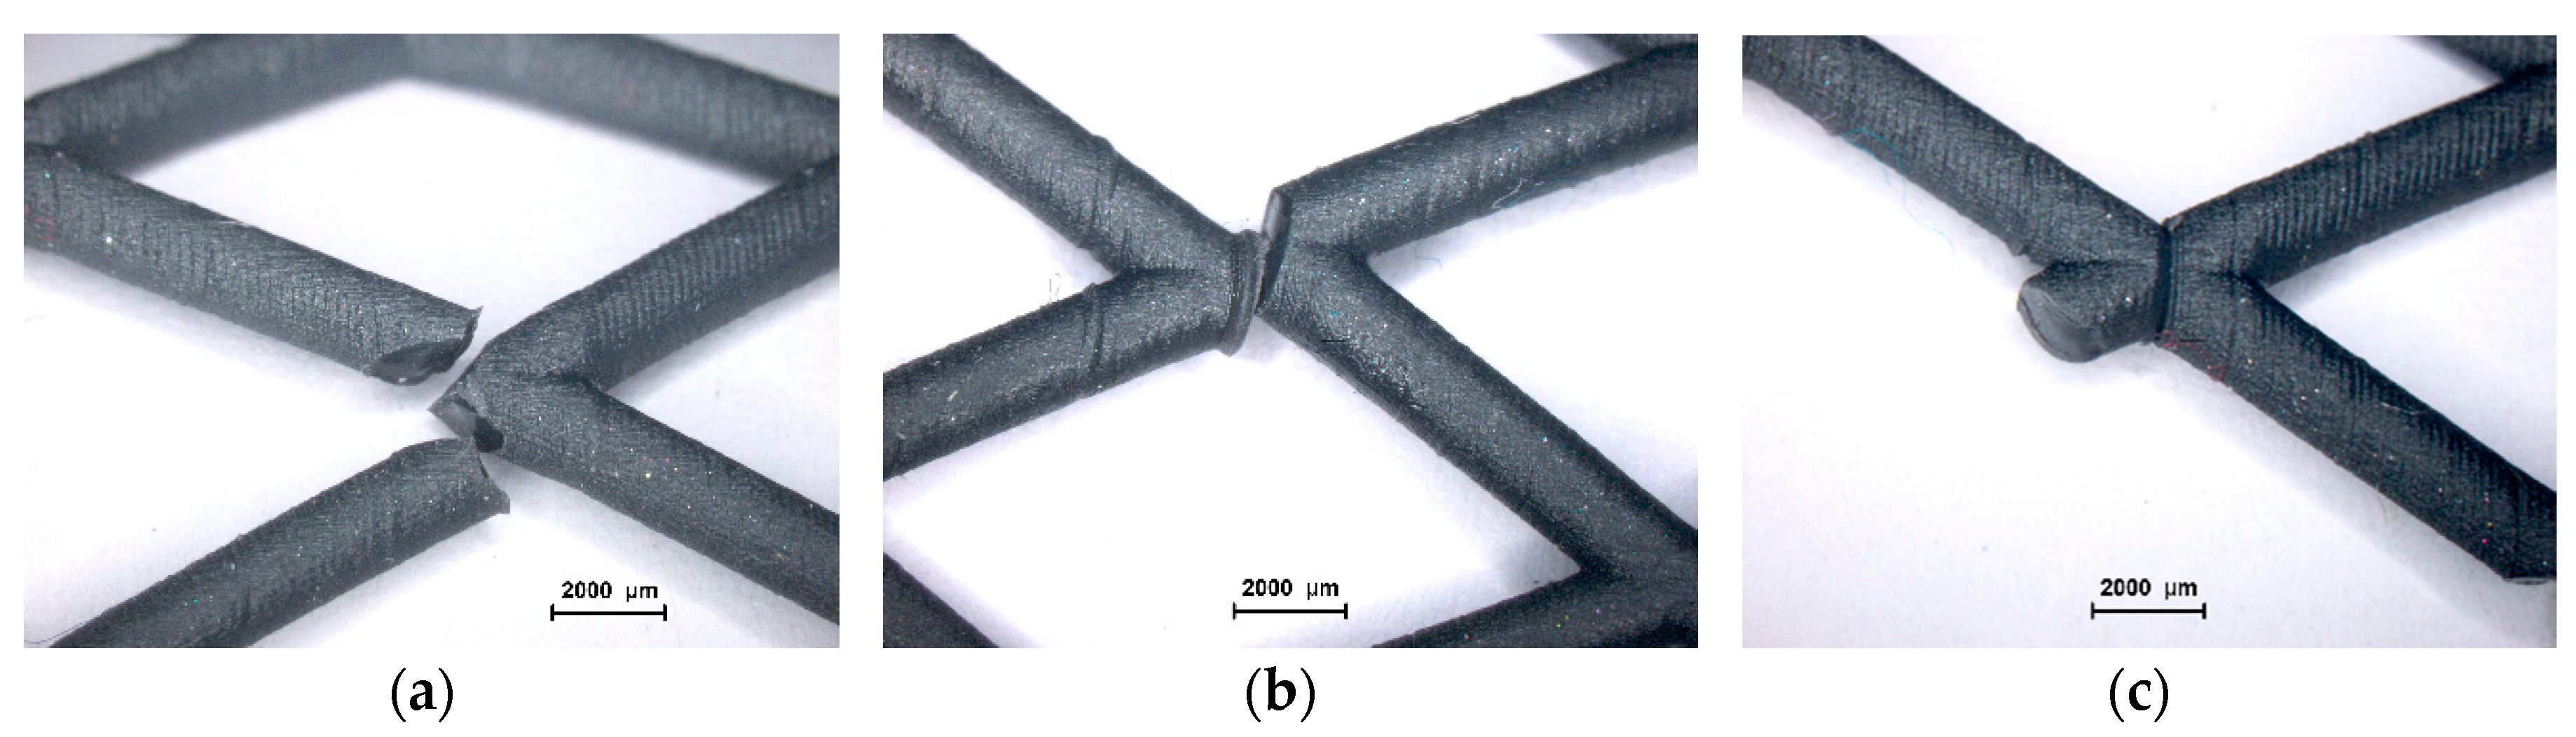
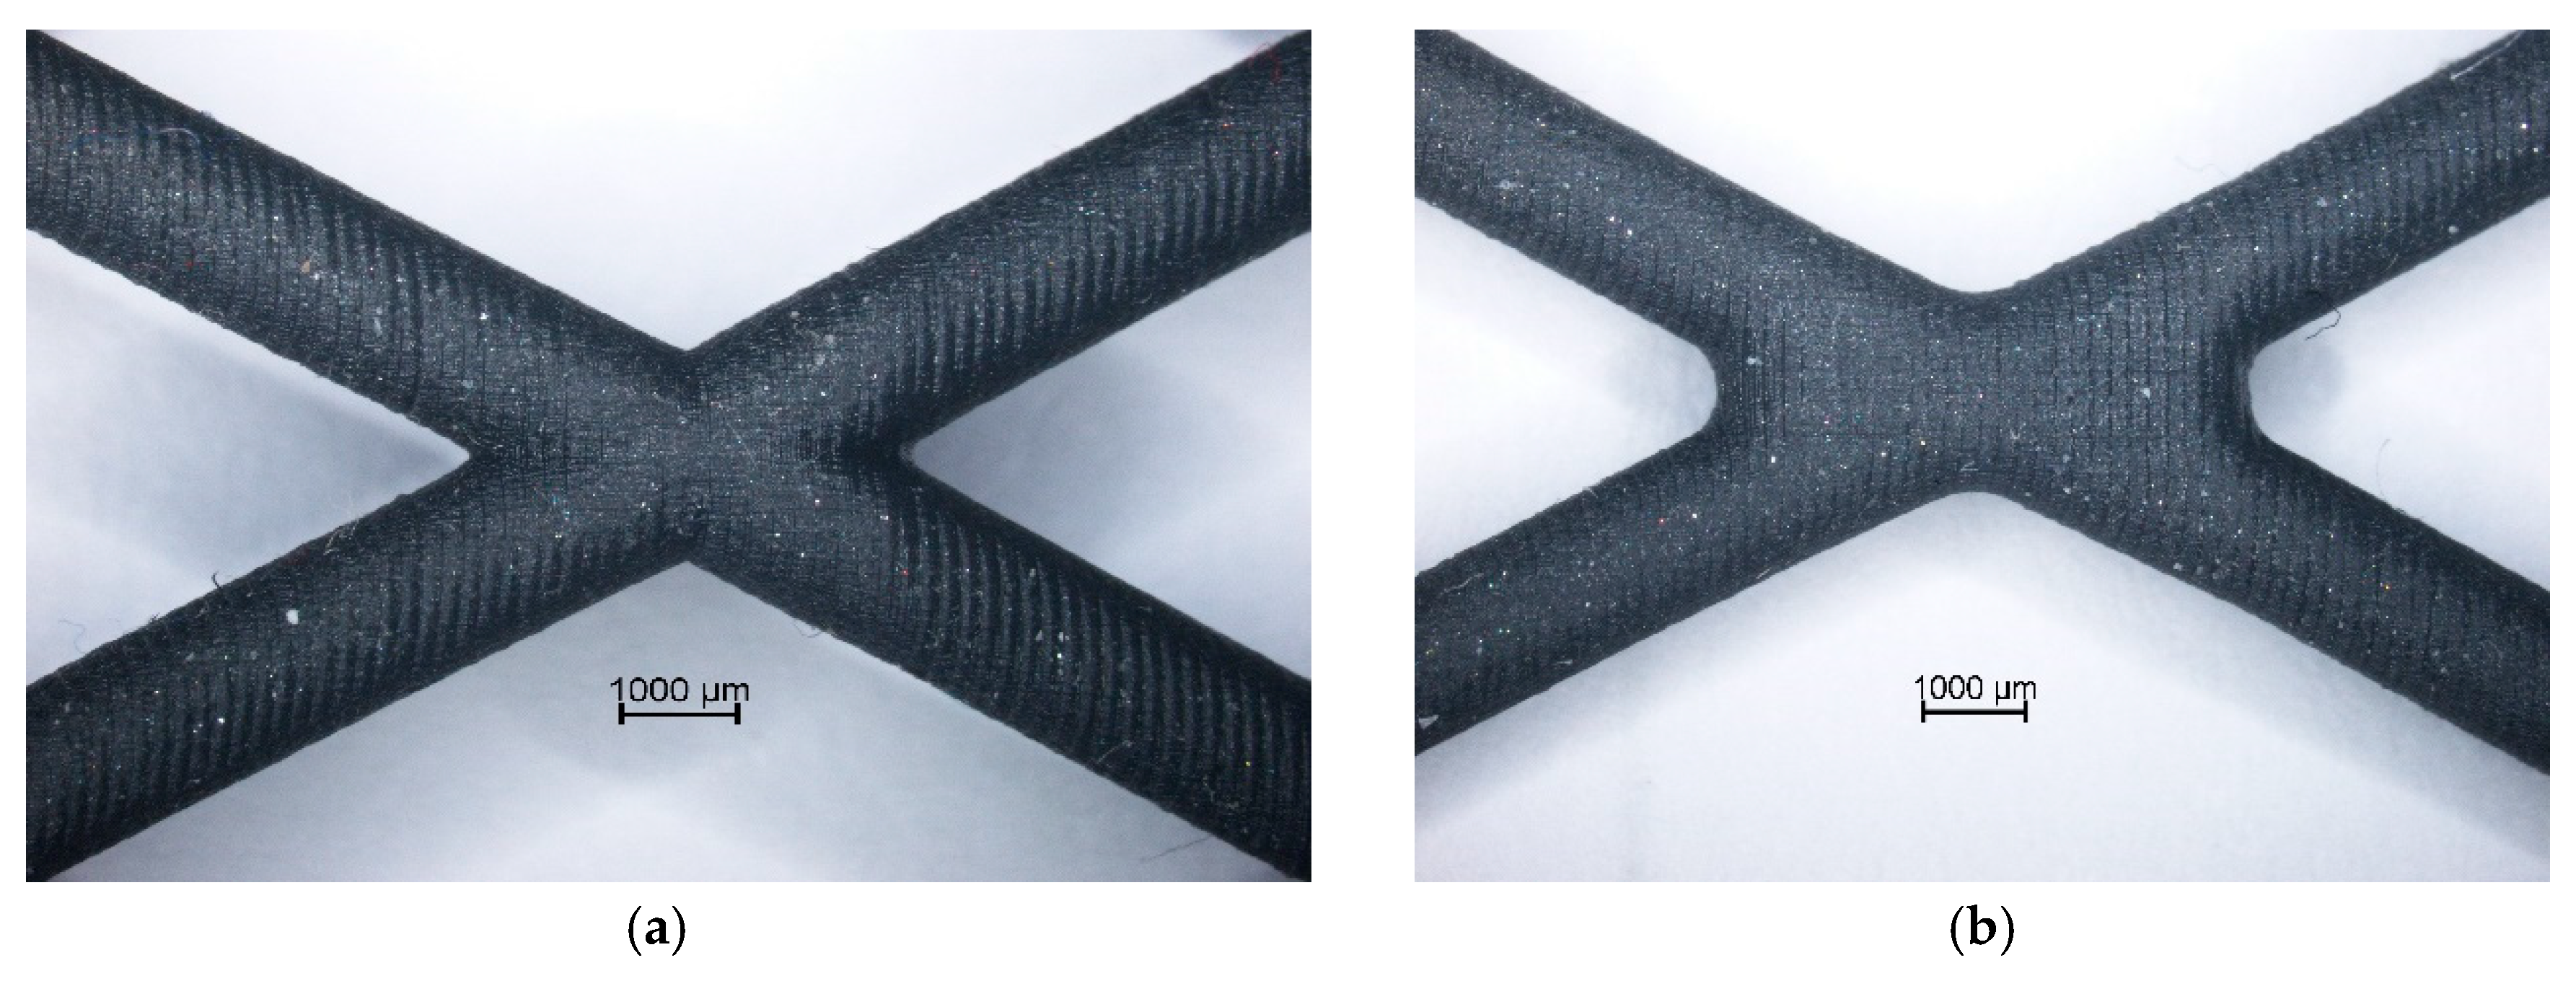
After performing the functional test on the initial net geometry, fractures appeared on the structure. A detailed visual check identified three failure patterns: most frequently failure was found on geometrical notches at the nodes (Figure 12a) and sporadic failures were found on printing misalignments along printing layers (Figure 12b) and on topological notches (Figure 12c).
A detailed examination of all nodes using qualitative microscopy and the statistical analysis of the results showed that 80% of the fractures were caused by geometrical notches, as shown in Figure 12a. In 
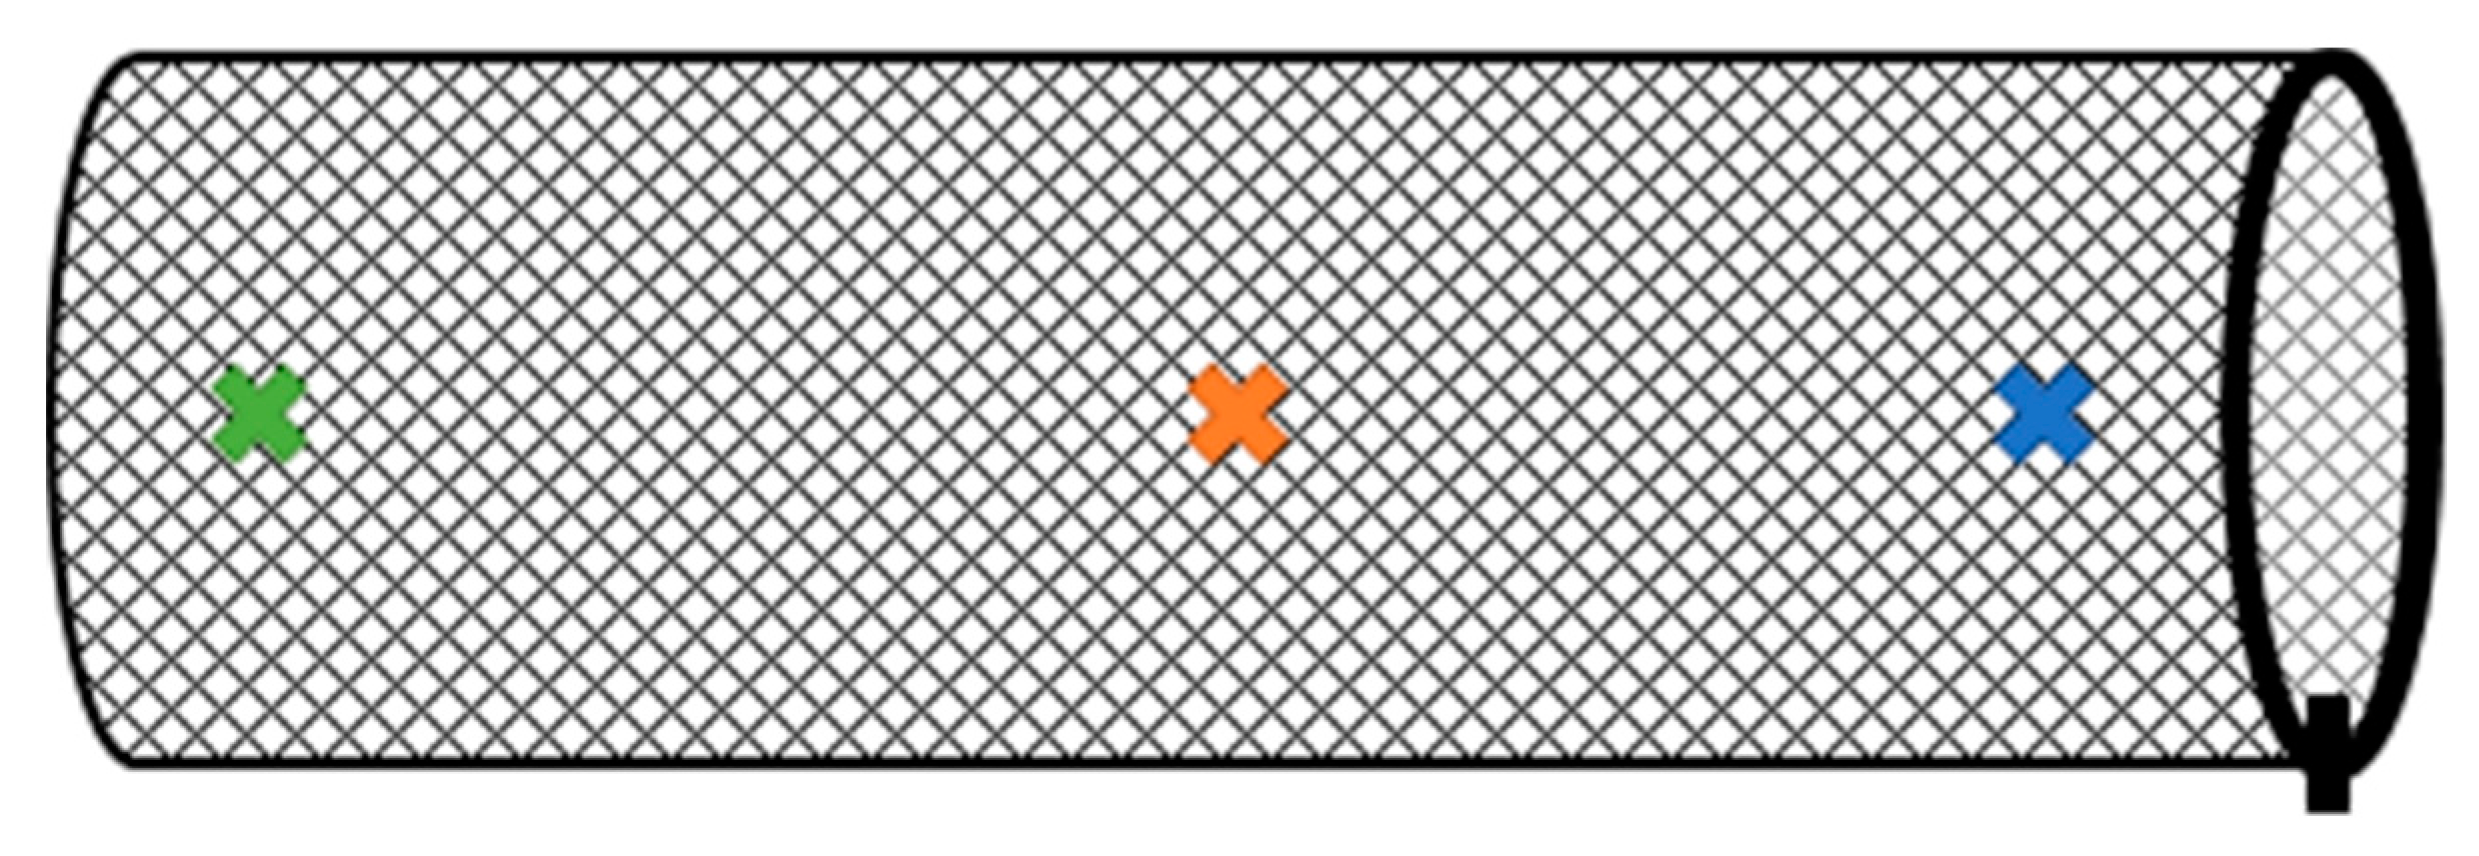
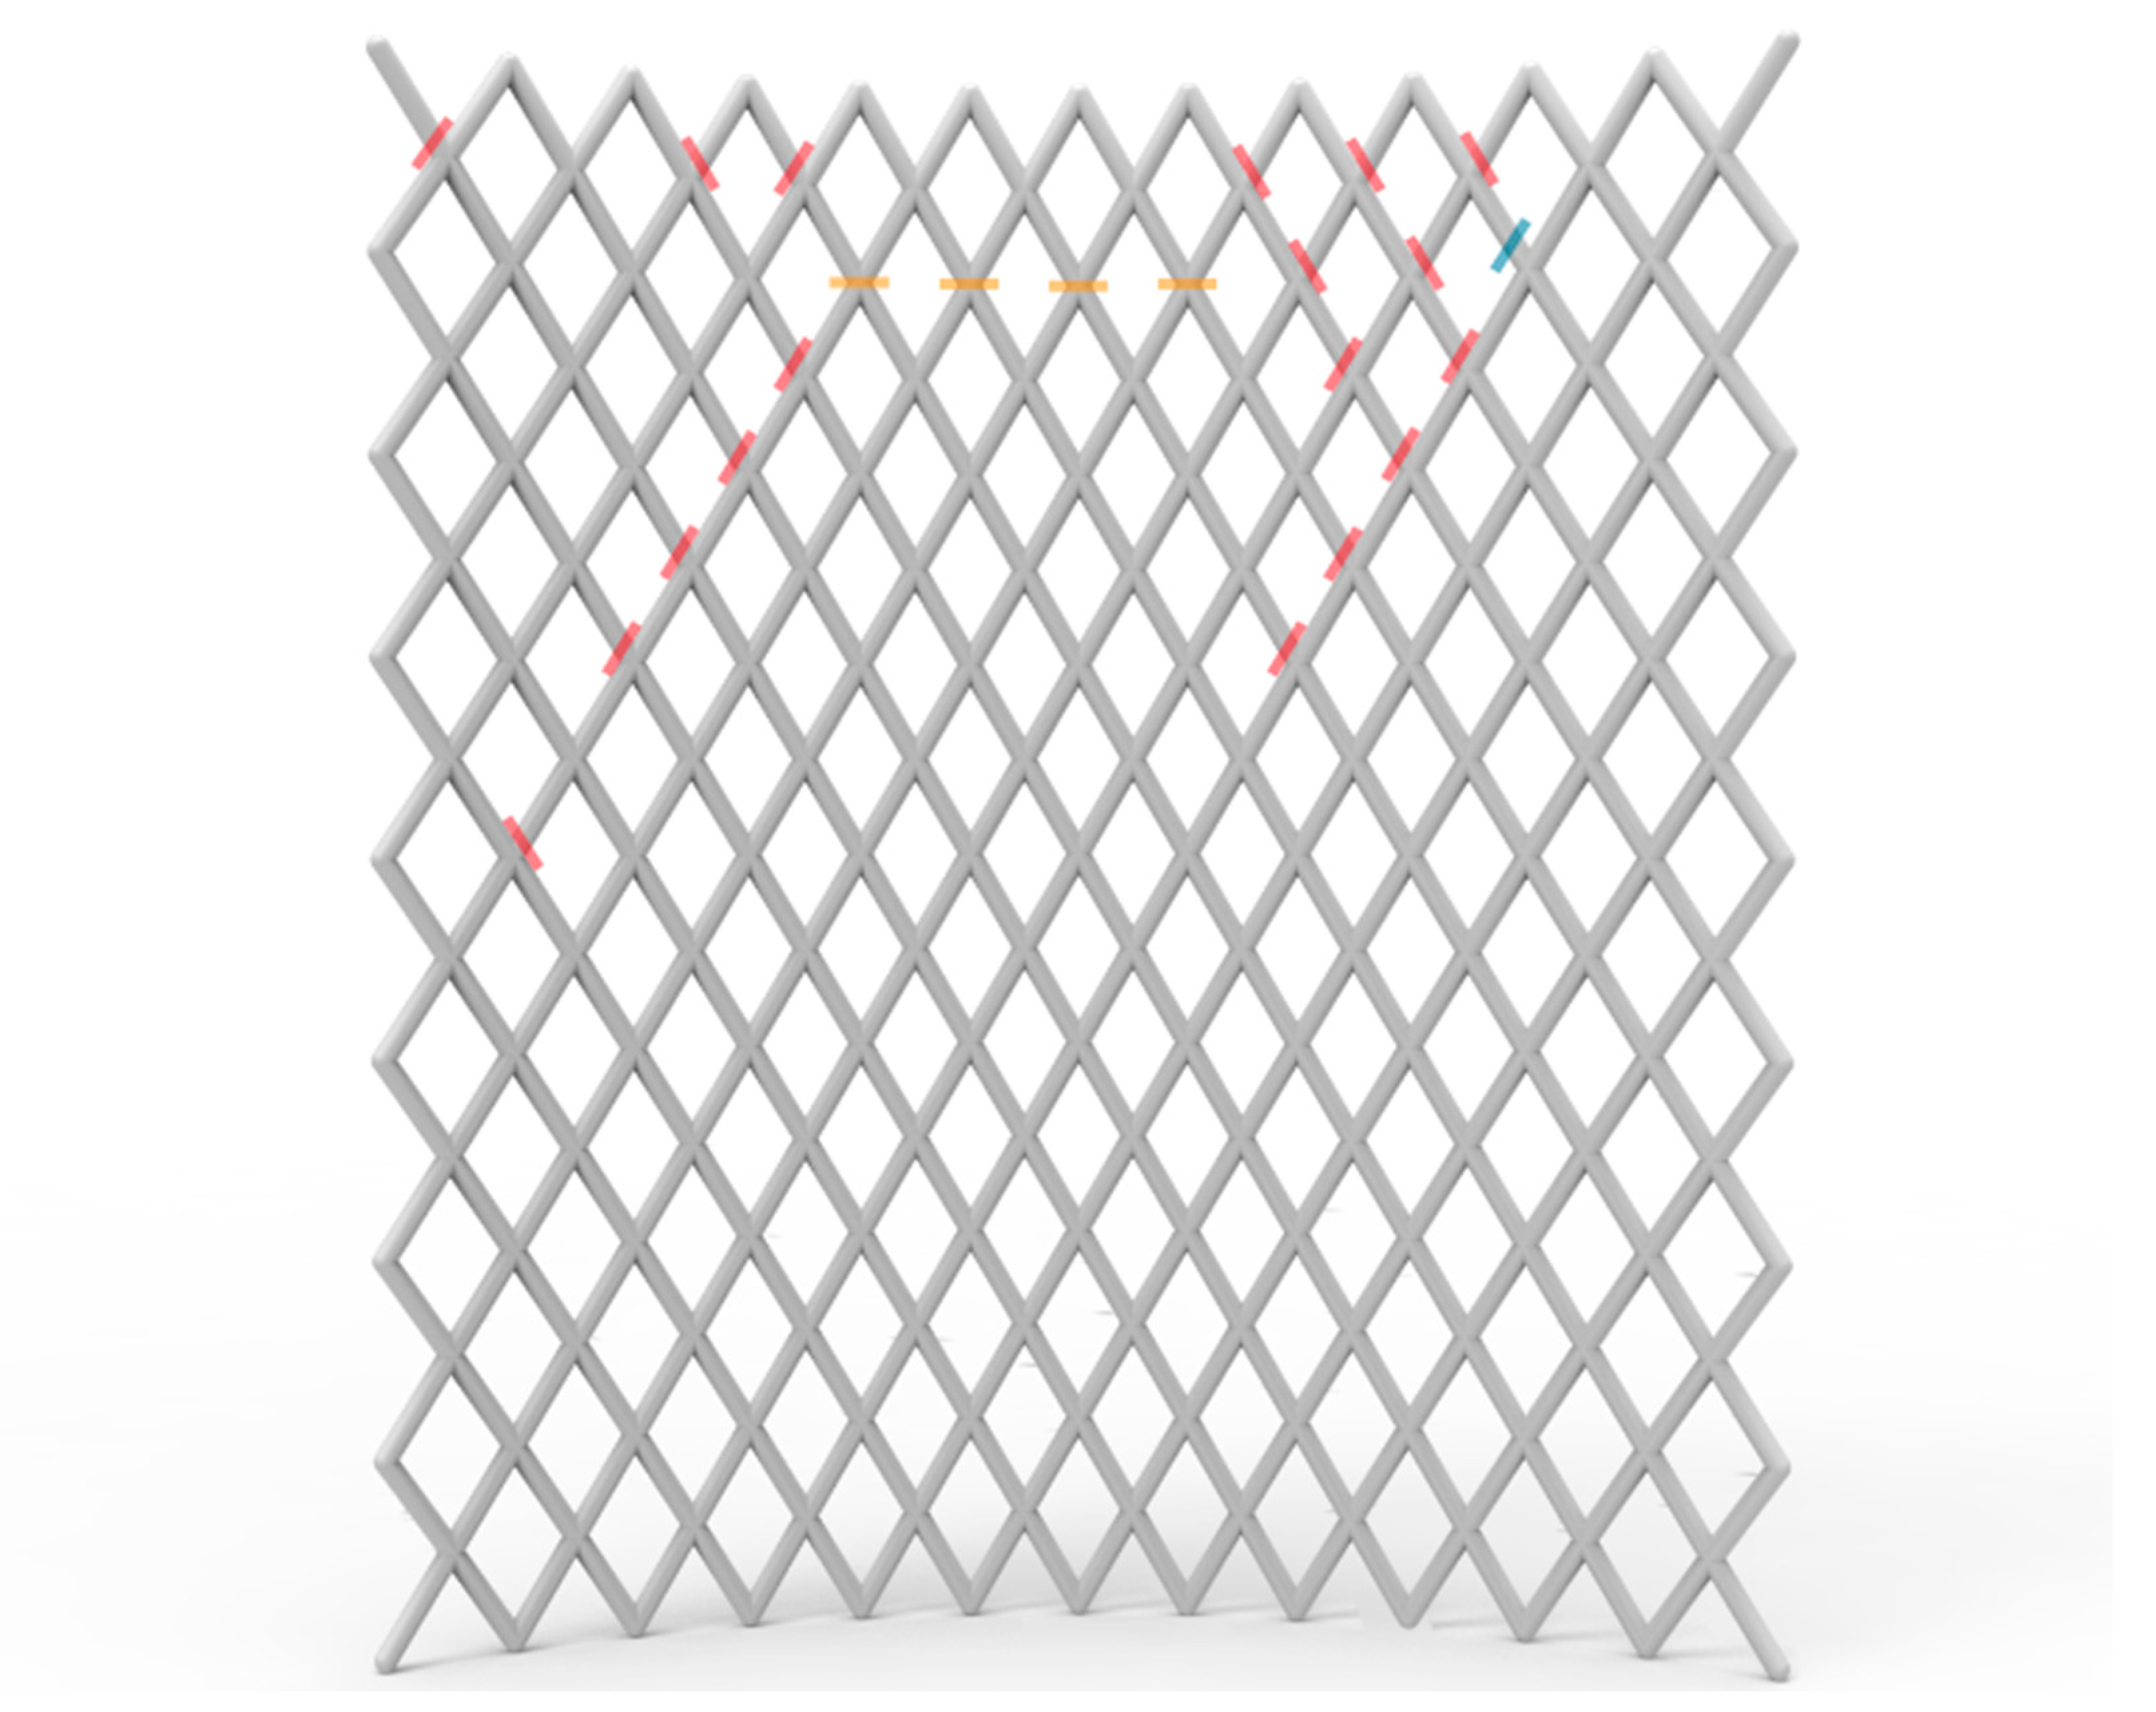
Figure 13, the local distribution of the failure patterns is shown. It can be seen that the errors are mainly located in the upper part of the structure. The reason for this is the process of initialization, which requires an enormous expansion of the net. Likewise, the overturning was only done up to half of the total length of the net tube. However, it can be assumed that the geometric notches in particular will lead to damage along the entire structure if the load continues to be applied. Therefore, an improvement of the net geometry using simulation was implemented to increase the repeatability and endurance strength of the net structure.

3.5. Improvement of Geometry with a Fine Model of a Unit Cell

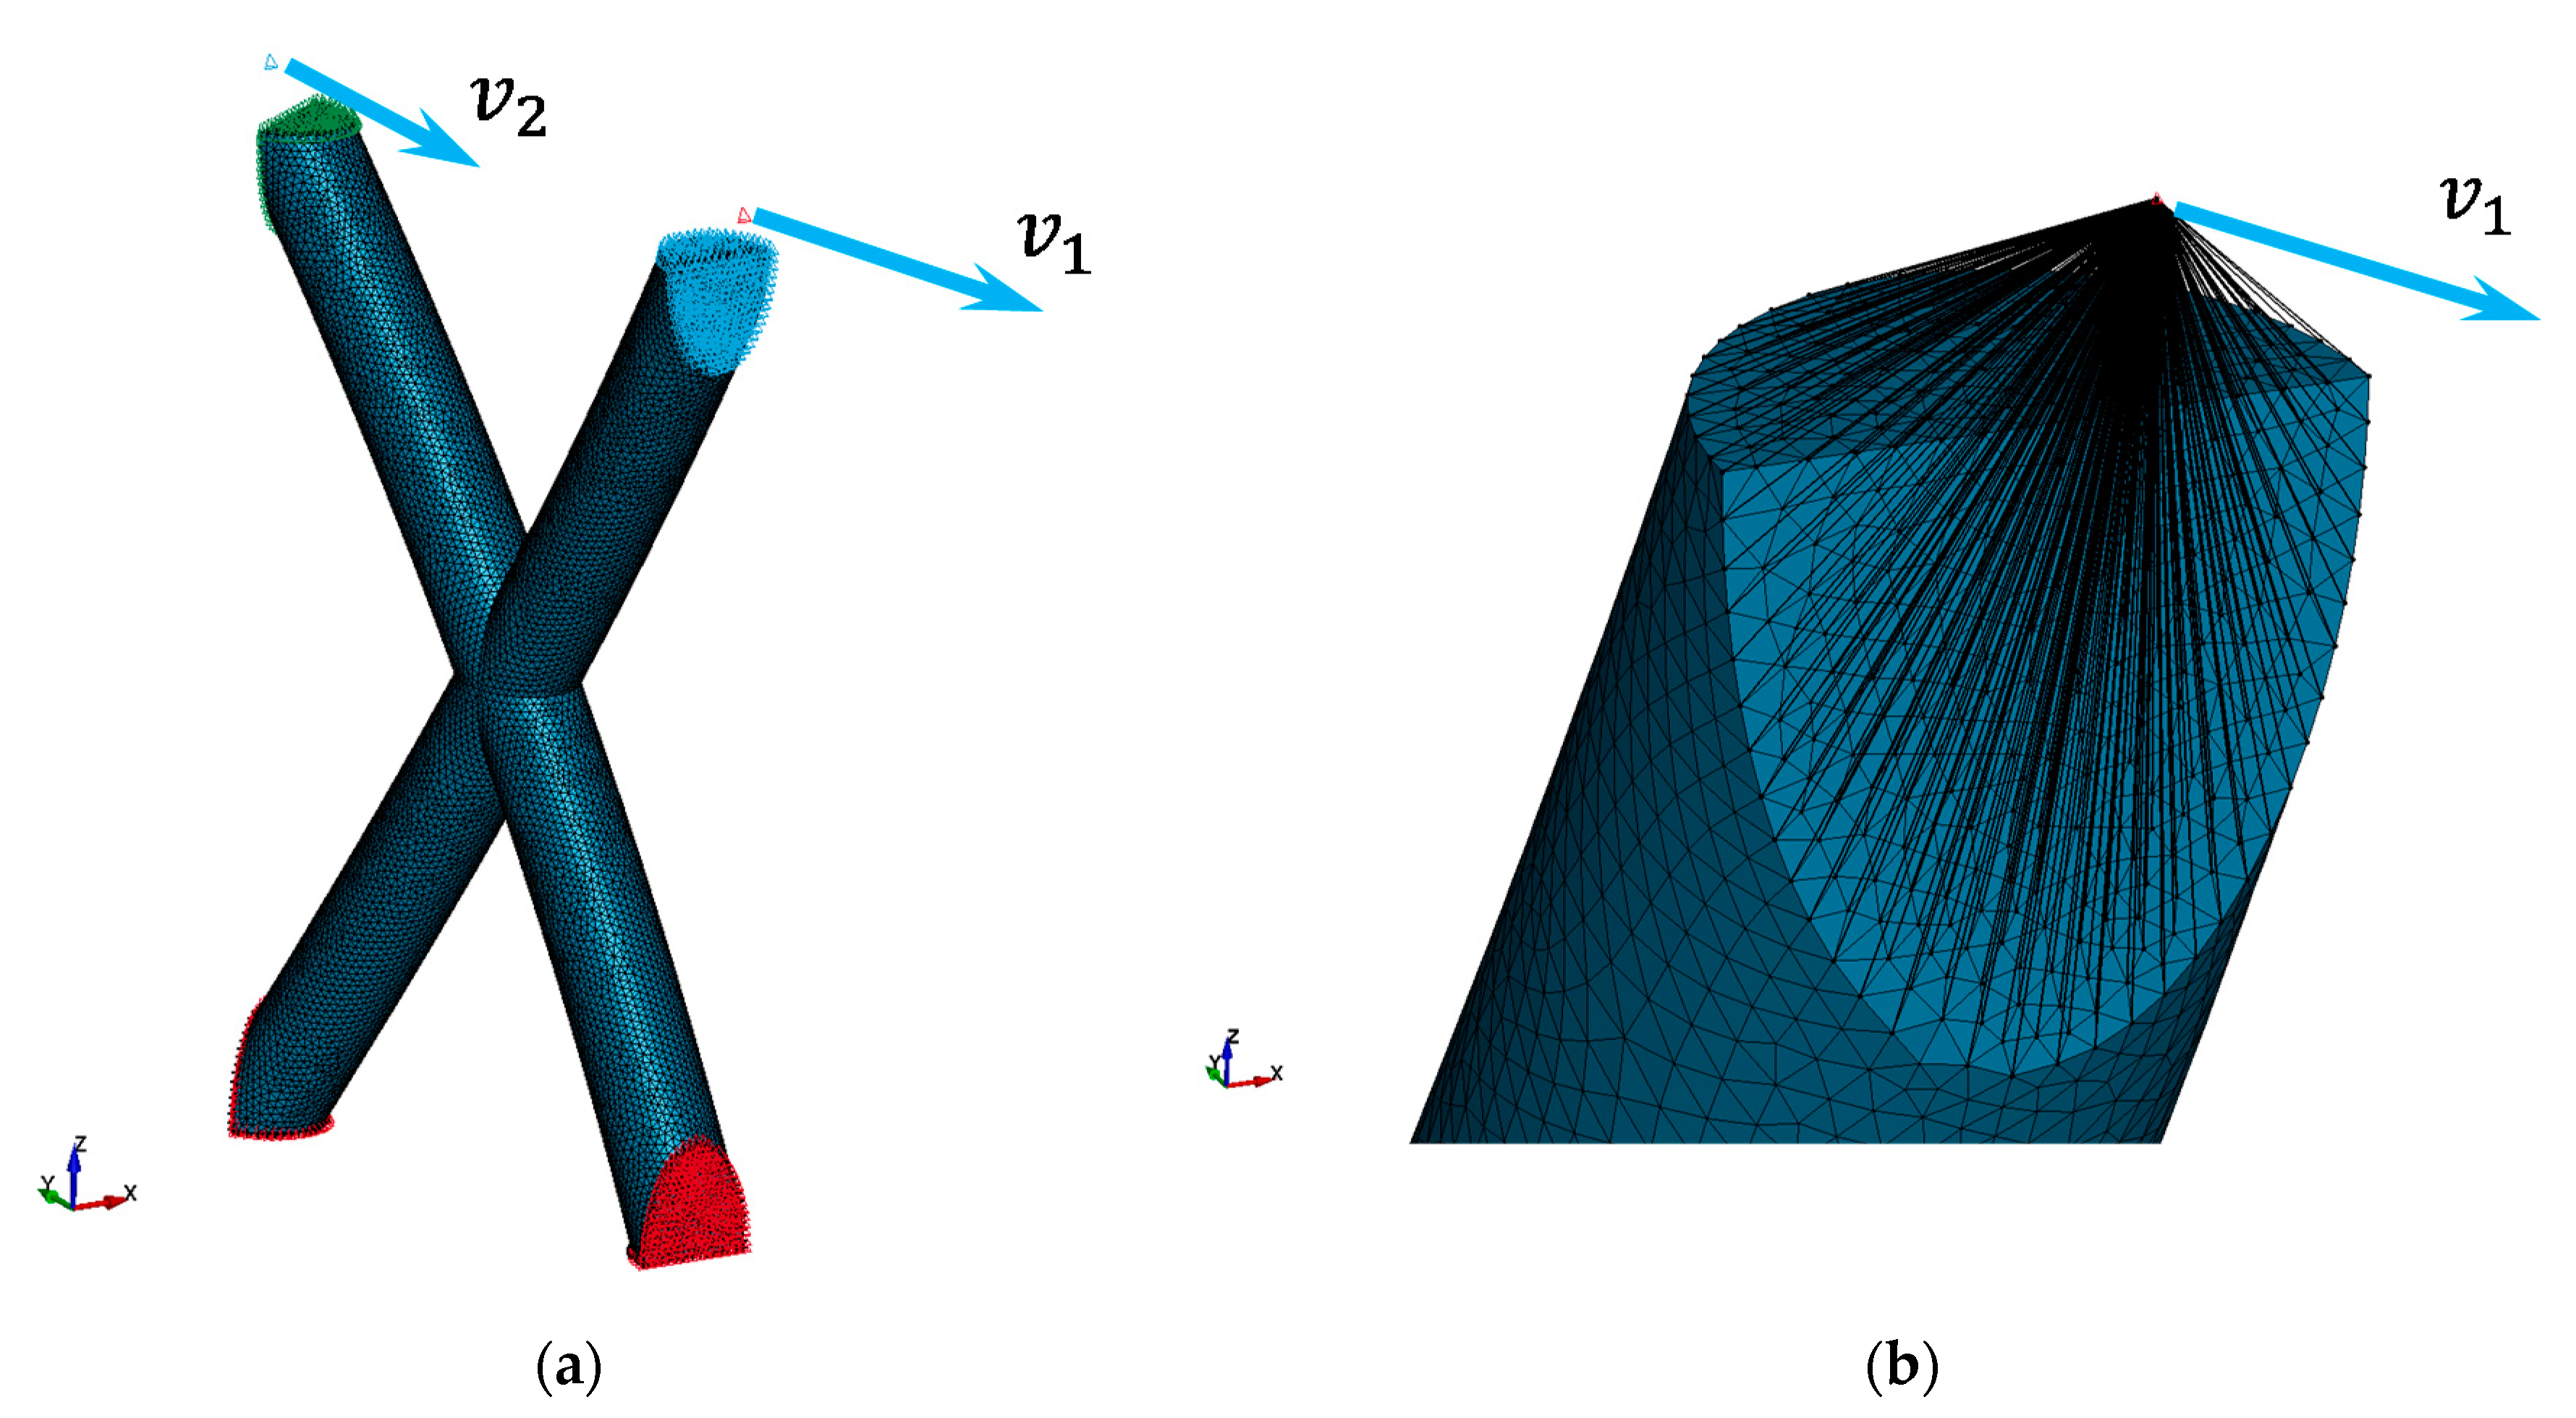
Because of the local failure at the crossing points, a detailed model was used to investigate and ideally to improve the local geometry loading. Hence, based on the initial printing geometry, a detailed model with solid elements was built in LS-Dyna. The smallest periodically recurring structure (unit cell) was retrieved by radial and axial cutting through the center of crossing points. After meshing, the unit cell model consisted of nearly 200,000 tetrahedral solid elements with an average edge length of 0.15 mm. The two lower ends of a unit cell were clamped with boundary conditions on all nodes of the cutting planes. For the upper two ends, two Cartesian coordinate systems were provided in the same manner as above (global beam model) to reach a strictly radial translation of nodes on the cutting planes. Two external massless nodes were positioned above the two node sets of both bar ends and connected to the respective node sets via keyword *CONSTRAINED_INTERPOLATION. A motion vector was then defined for each massless node, which was directed radial outwards and additionally contained a component downwards toward the clamped end of the unit cell (Figure 14). The nature of the load leads to a simulative bending test, which was only used to compare different geometry loadings, such as peak stresses and their locations.
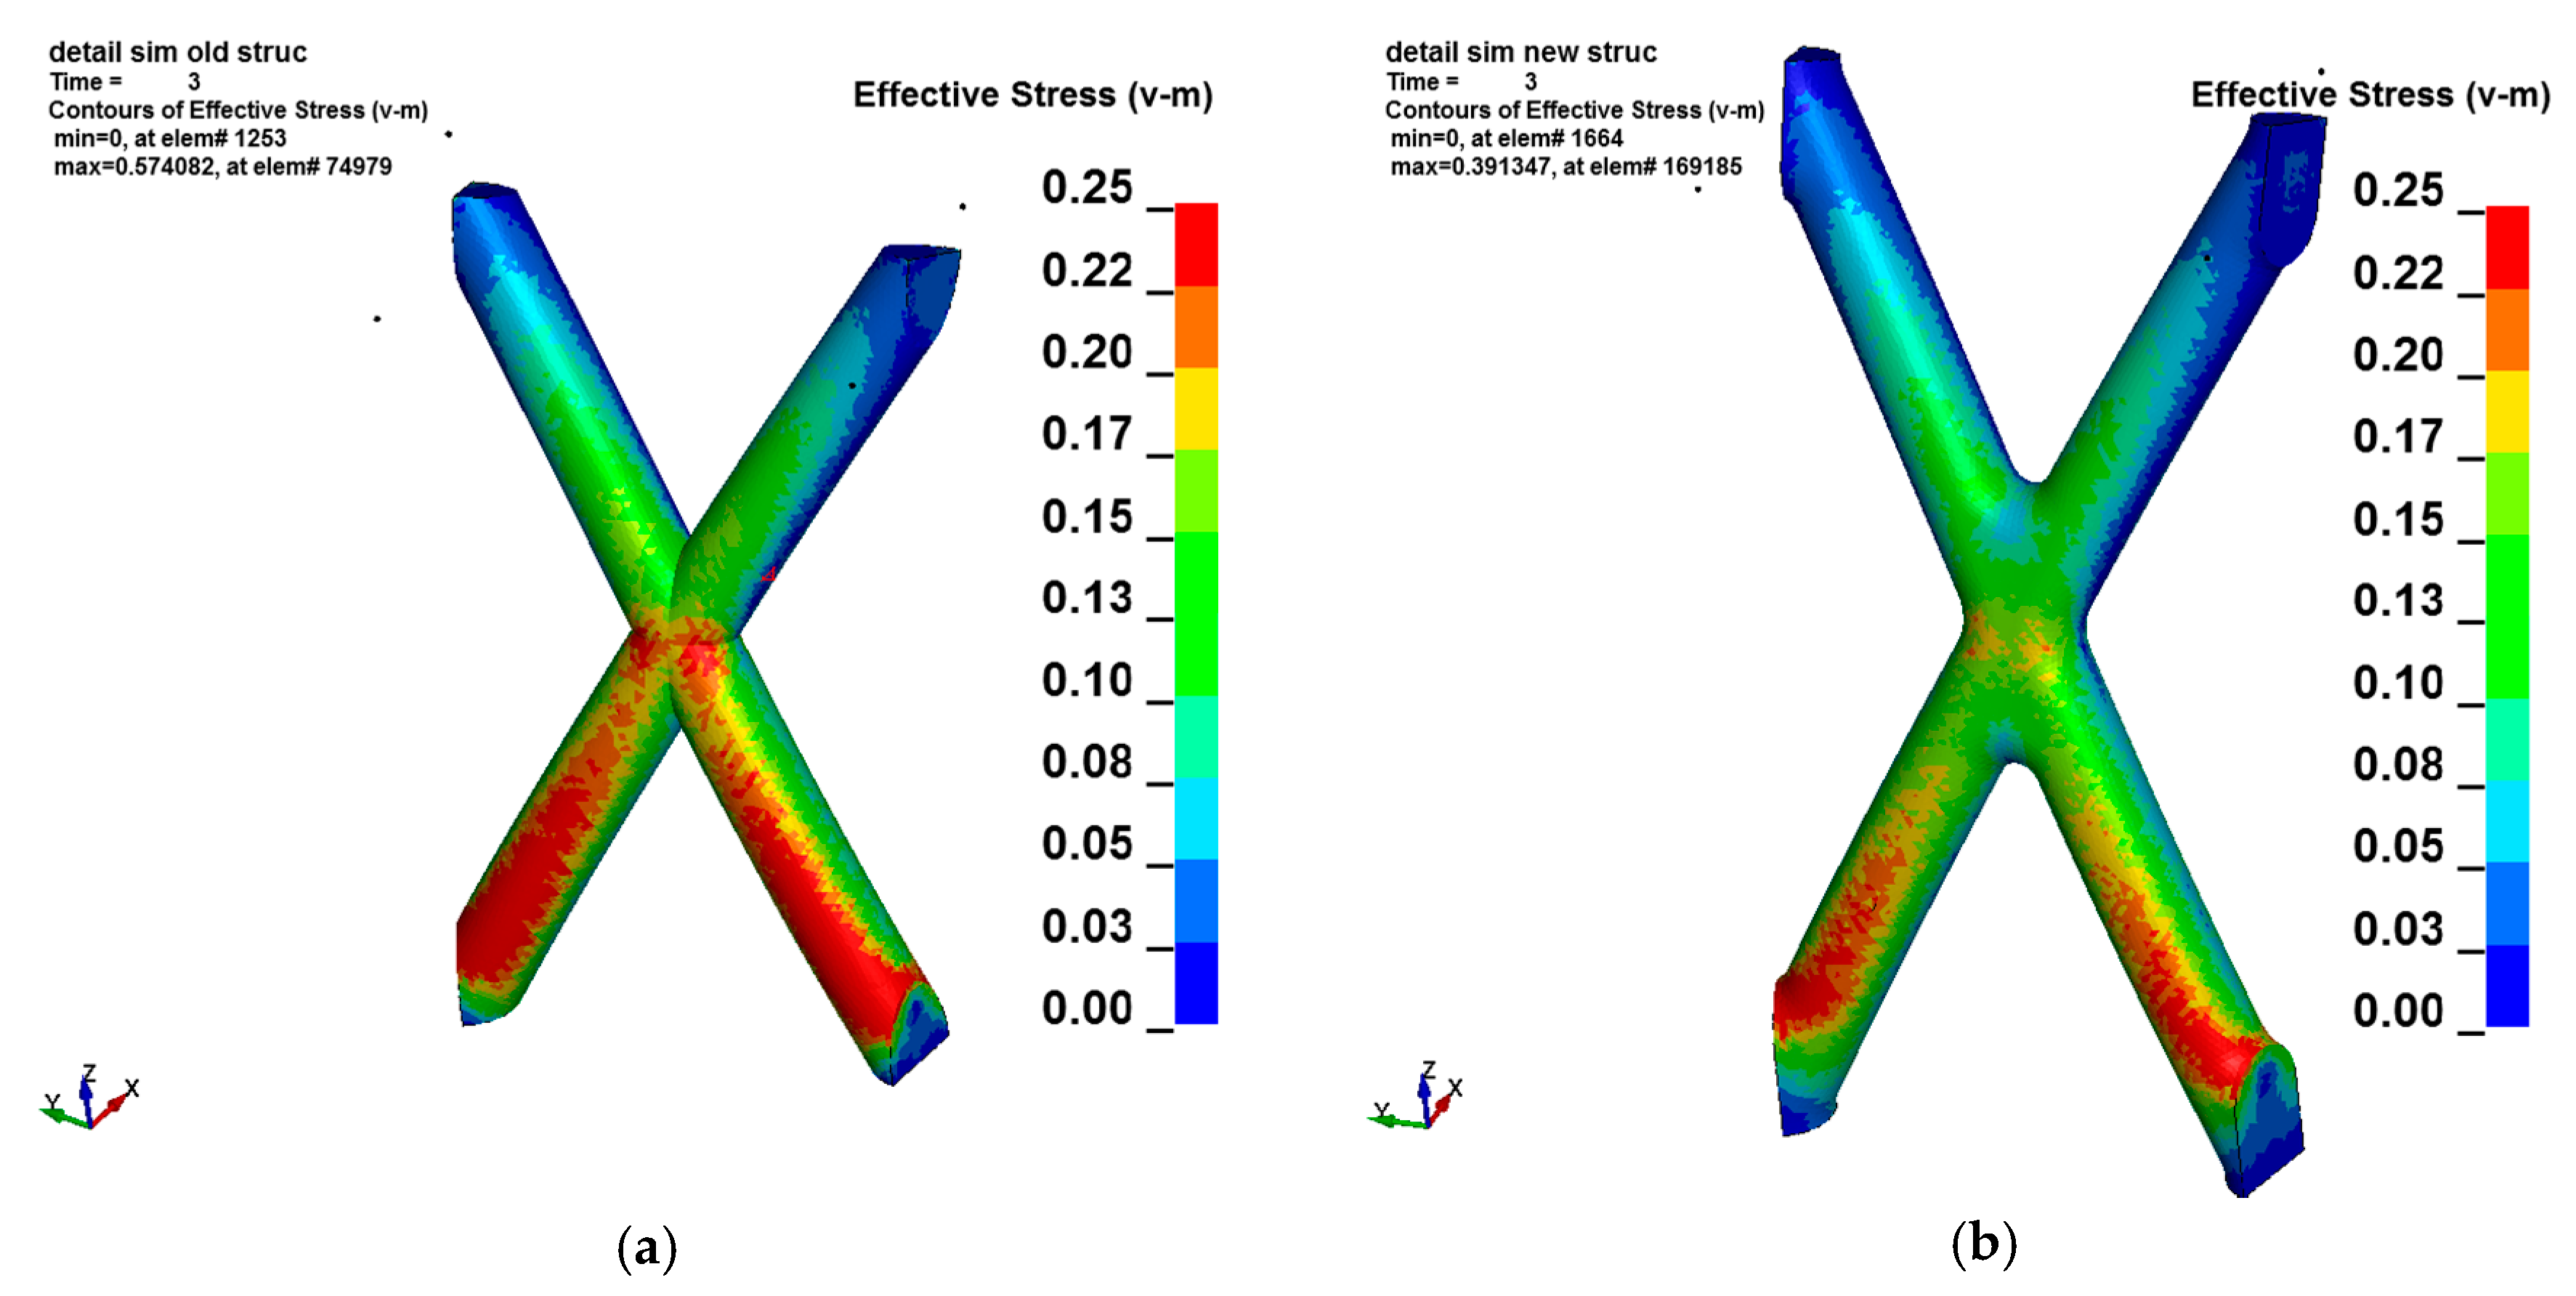
A corresponding model with slightly changed geometry was built. After some iterative changes, the bar length was increased and the waist of the crossing point was broadened. Furthermore, the waist was rounded to avoid joined sharp border edges of the bars and thus stress peaks in those regions. Figure 14 compares the initial geometry with the improved final version with changed waist and bar length. Due to the bending test nature of the load, the regions near the clamping showed the highest stresses. Nevertheless, the sharp border lines in the crossing point in Figure 15a also tended to carry high loadings. With the improved geometry, pictured in Figure 15b, the high stresses in the crossing point especially can be avoided. The structural bending stiffness is reduced due to the increased bar length. Therefore, the main angle α had to be changed from 60° to nearly 65° to maintain the crossing point number.
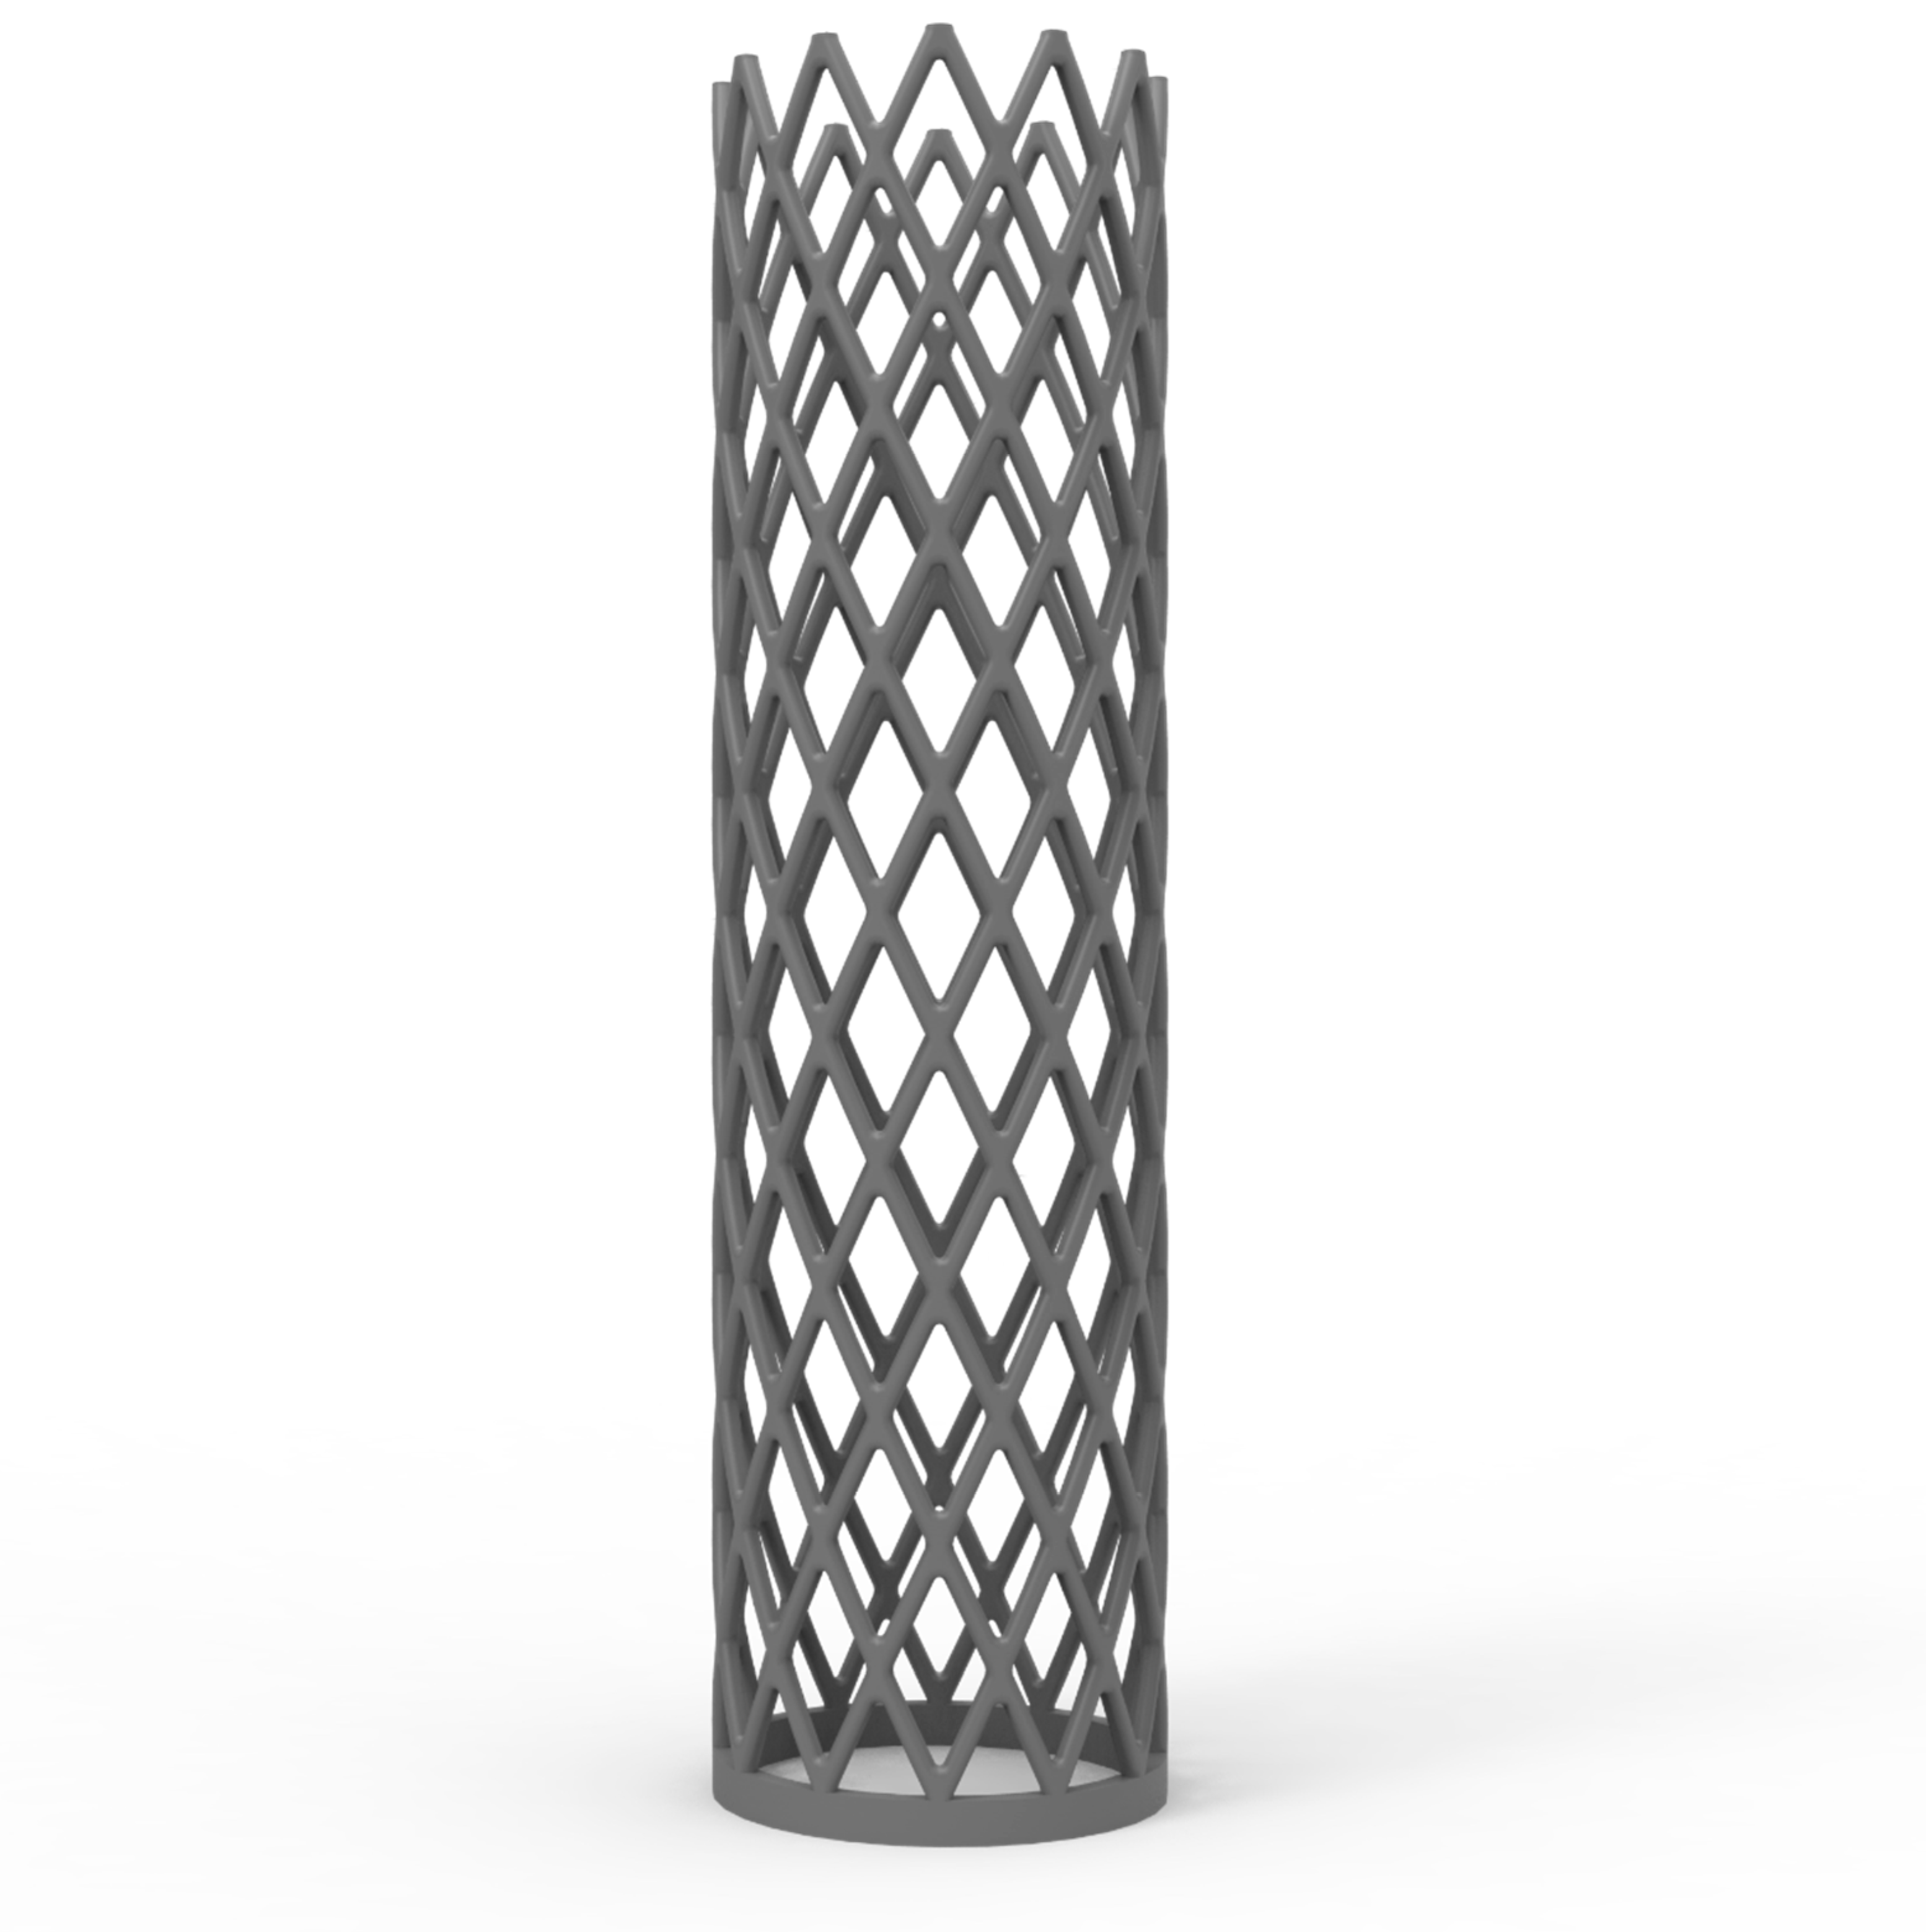
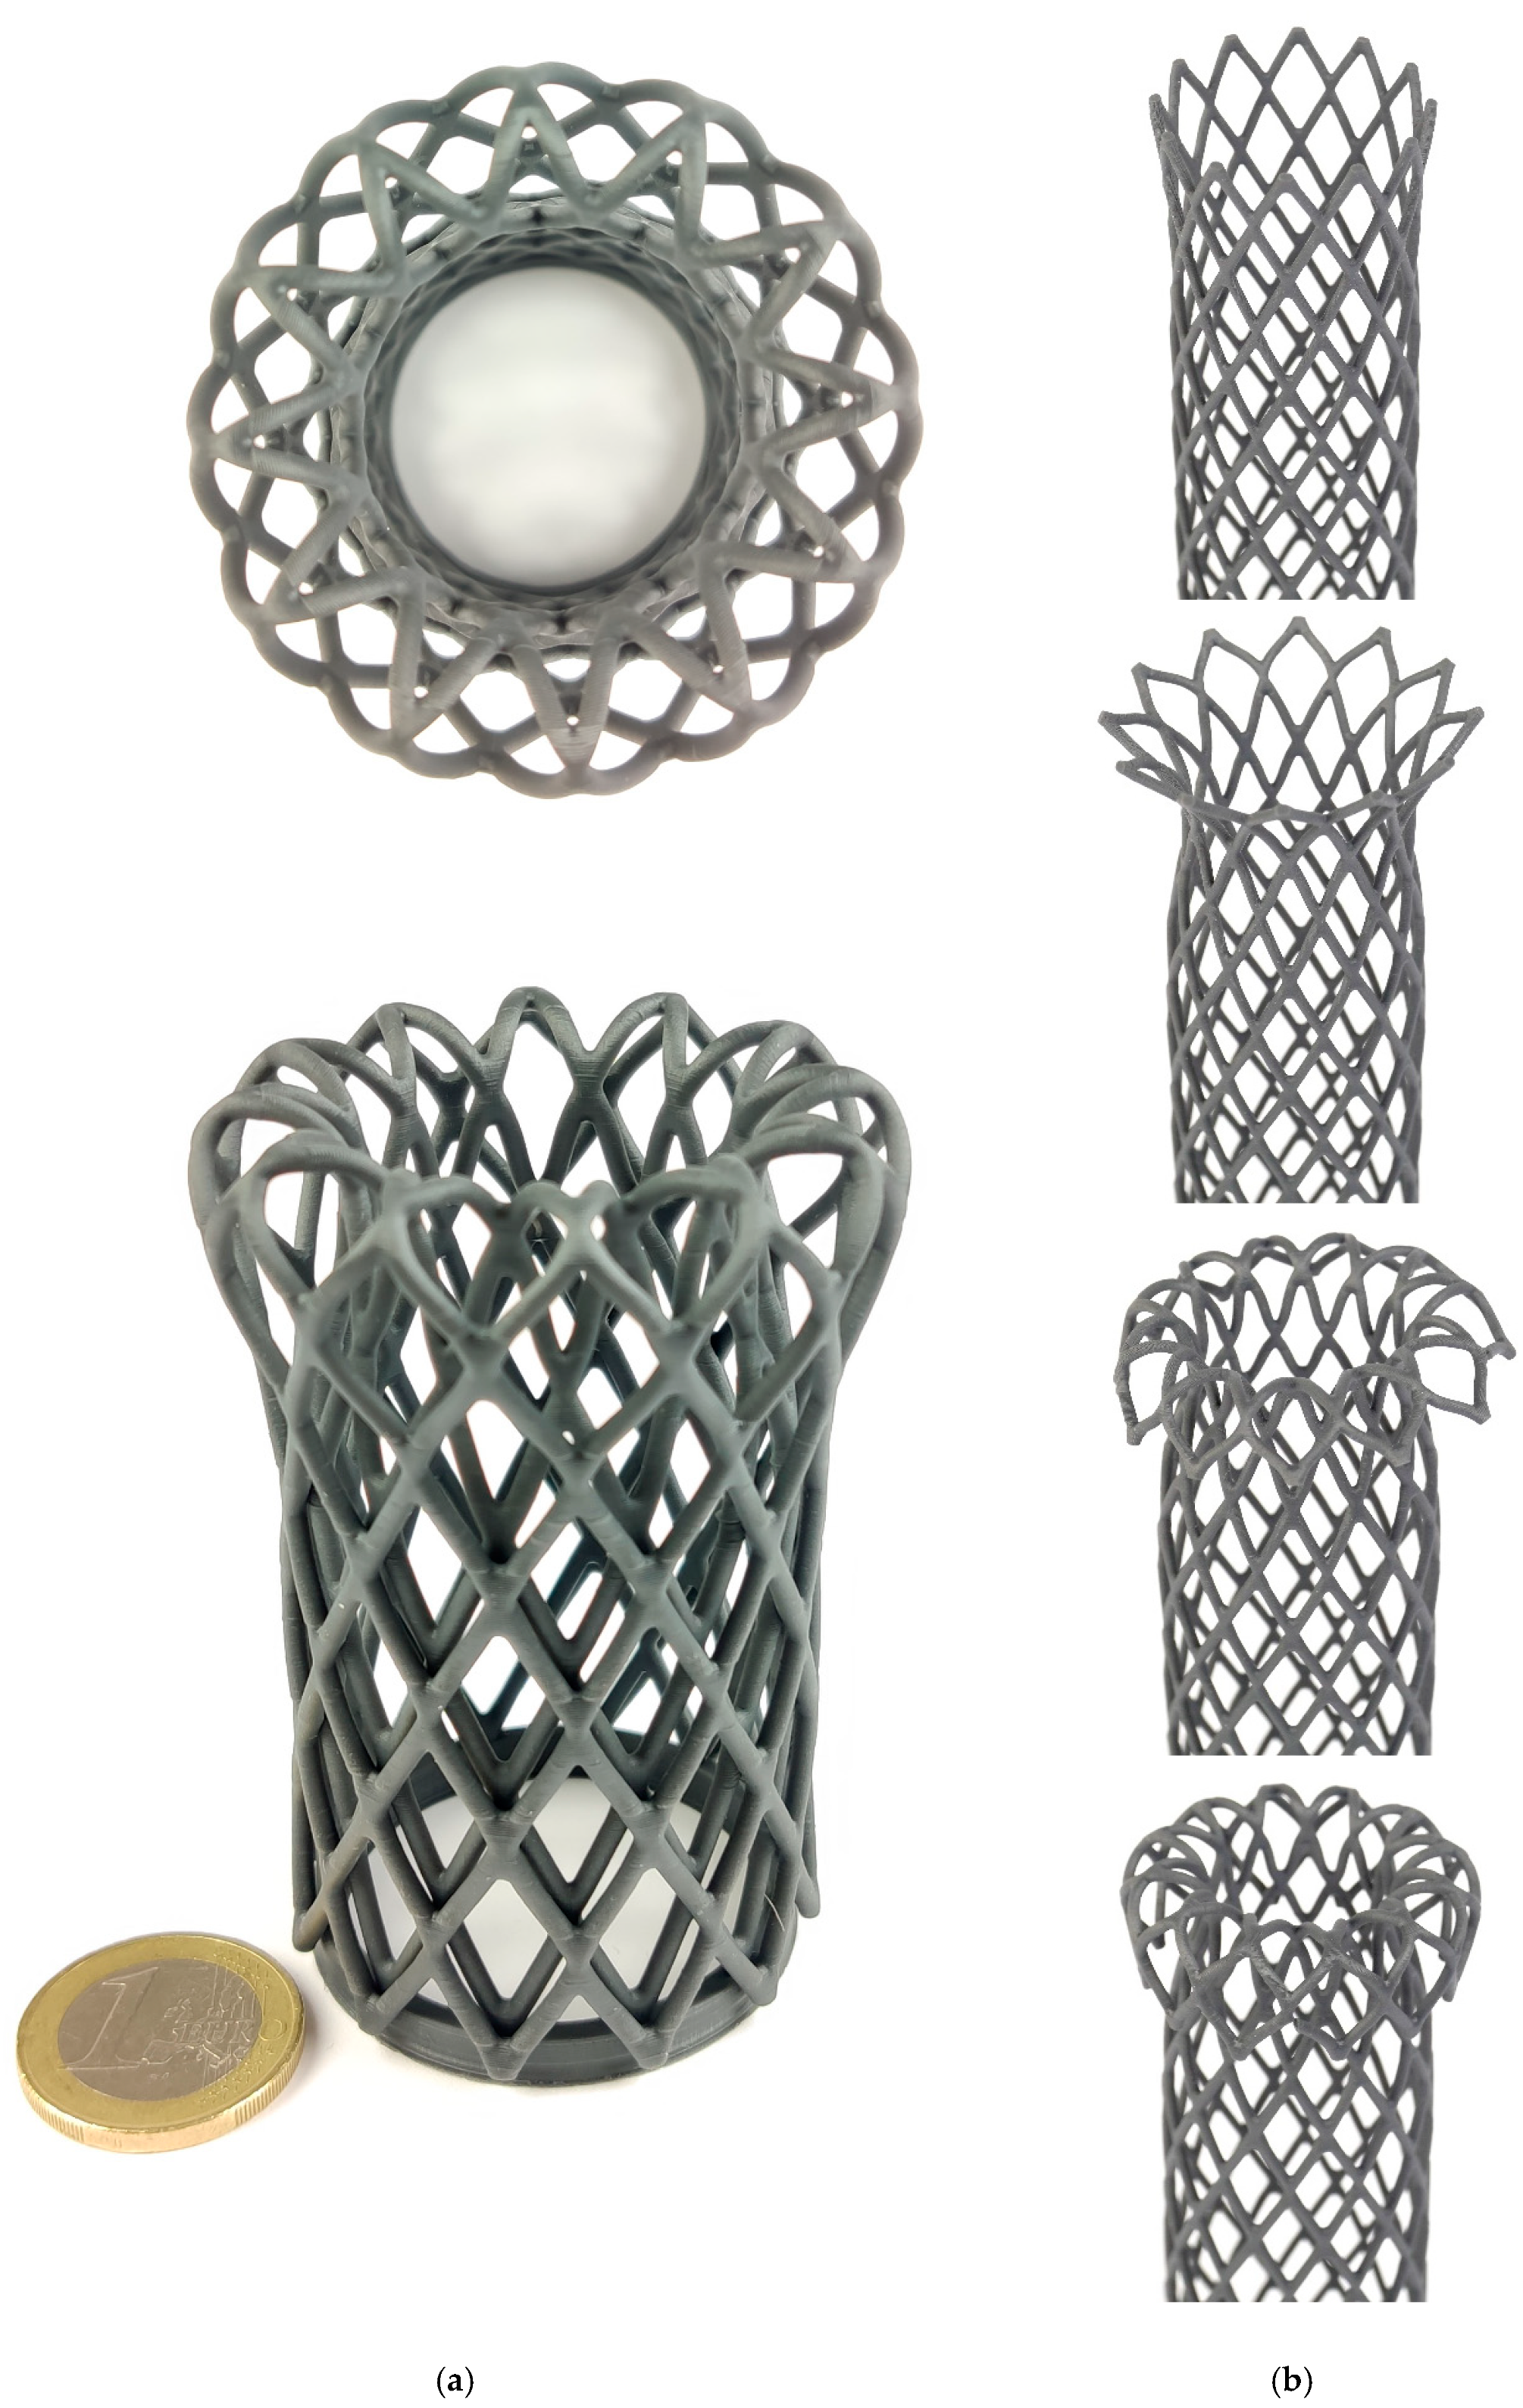
The improved tubular net structure has an inner diameter of 19 mm, a bar diameter of 1.7 mm, a free length of 150 mm and 24 bars which are positioned at an angle of 65° to each other (net angles) (pl. see Figure 4 and Figure 16). The surface shows a typical topology caused by the printing process (see Figure 16).

3.6. Tubular Net Structure: Functionality

Testing the net structure before improvement showed the ability of everting reversibly but with damages, as described in Section 3.4. According to the first test procedure, the improved net was functionally tested by realizing the initial everting process followed by triple repeated folds through manually everting–the net is initially everted on the top and continued to the bottom, up to half of the total length of the net tube. After that, everting direction is reversed to the initial state. After improving the nodes by homogenizing the transition area, the everting was reversibly possible >10 times without damage (Figure 17).

4. Discussion and Conclusions

In this paper, a design, improvement and process strategy are presented that enable the additive manufacturing production of tubular net structures that can be repeatedly everted without damage. A production routine for invertible tubular net structures was found for products with invertible volume, which can be used to enable temporary additional functions. For the 3D printing unit and the material used in the work, the optimal printing alignment and support structure design and a possible bar diameter of 1.7 mm (actual value) were determined, which lead to a reproducible result with good quality. The analysis of the influence of orientation, positioning and support structure showed that 20 mm-long single bars could be printed in an angled and nonangled state. Through visual quantitative characterization, deviations of 12% on average between the additively manufactured diameter and the target diameter were determined and thus design specifications for the printing process were derived. With the help of the mechanical characterization of the additive manufactured tension bars, a Young’s modulus of 6 MPa (6 N/mm2) was determined for the material Flexible V2 from Formlabs. This modulus was used for the simulation-based structural calculation and improvement. The influence of the vertical net angle between two single bars on the structural stiffness (buckling behavior) was described by means of simulations. Thus, a vertical net angle between the individual bars of 65° was identified as a solution for repeatedly everting without failure in the net structure. Using a fine simulation, the nodes were improved using rounding in such a way that the additively produced net structure could be everted reversibly and nondestructively.

Author Contributions

Conceptualization, L.B.; methodology, L.W., S.H. and L.B.; software, S.H. and L.B.; validation, L.W. and L.B.; formal analysis, L.W. and S.H.; investigation, L.B., S.H. and L.W.; writing—original draft preparation, L.B., S.H., L.W., D.M. and J.S.; writing—review and editing, L.B., S.H., L.W., J.S., F.R. and W.-G.D.; visualization L.B., S.H. and L.W.; supervision, W.-G.D. All authors have read and agreed to the published version of the manuscript.

Funding

This research received no external funding.

Conflicts of Interest

The authors declare no conflict of interest.

References

  1. Gnatzy, W.; Jatho, M.; Kleinteich, T.; Gorb, S.N.; Hustert, R. The eversible tentacle organs of Polyommatus caterpillars (Lepidoptera, Lycaenidae): Morphology, fine structure, sensory supply and functional aspects. Arthropod Struct. Dev. 2017, 46, 788–804. [Google Scholar] [CrossRef] [PubMed]
  2. McDermott, J.J.; Roe, P. Food, feeding behavior and feeding ecology of nemerteans. Am. Zool. 1985, 25, 113–125. [Google Scholar] [CrossRef]
  3. Andrews, E.B. The functional anatomy of the mantle cavity, kidney and blood system of some pilid gastropods (Prosobranchia). J. Zool. 1965, 146, 70–94. [Google Scholar] [CrossRef]
  4. Burgner-Kahrs, J.; Nguyen, T.D. Arbeitsmechanismus. DE102014113962B3, 10 December 2015. Available online: https://register.dpma.de/DPMAregister/pat/PatSchrifteneinsicht?docId=DE102014113962B3 (accessed on 6 August 2020).
  5. Matasov, S. Endoskopische Einführhilfsvorrichtung. EP1034010B1, 2 May 2007. Available online: https://depatisnet.dpma.de/DepatisNet/depatisnet?action=bibdat&docid=EP000001034010B1 (accessed on 6 August 2020).
  6. Grodecki, R.; Laborie, R.; Rolland, R.A. Everting tube structure. US000005993427A, 30 November 1999. Available online: https://depatisnet.dpma.de/DepatisNet/depatisnet?action=bibdat&docid=US000005993427A (accessed on 6 August 2020).
  7. Grodecki, R.; Laborie, R. Body cavity probe with everting tube. US000005045070A, 3 September 1991. Available online: https://depatisnet.dpma.de/DepatisNet/depatisnet?action=bibdat&docid=US000005045070A (accessed on 6 August 2020).
  8. Naclerio, N.D.; Hawkes, E.W. Simple, low-hysteresis, foldable, fabric pneumatic artificial muscle. IEEE Robotics Autom. Lett. 2020, 5, 3406–3413. [Google Scholar] [CrossRef]
  9. Hellbauer, H.; Kostner, A.; Lenhart, R. Supporting Envelope of Tubular Netting with a Shirred Stick and Method for its Manufacture. EP00000000B1, 14 April 1982. Available online: https://depatisnet.dpma.de/DepatisNet/depatisnet?action=bibdat&docid=EP000000004638B1 (accessed on 6 August 2020).
  10. Celli, P.; McMahan, C.; Ramirez, B.; Bauhofer, A.; Naify, C.; Hofmann, D.; Audoly, B.; Daraio, C. Shape-morphing architected sheets with non-periodic cut patterns. Soft Matter 2018, 14, 9744–9749. [Google Scholar] [CrossRef] [PubMed] [Green Version]
  11. Gazzo, S.; Cuomo, M.; Boutin, C.; Contrafatto, L. Directional properties of fibre network materials evaluated by means of discrete homogenization. Euro. J. Mech. A/Solids 2020. [Google Scholar] [CrossRef]
  12. Giorgio, I.; dell Isola, F.; Steigmann, D.J. Axisymmetric deformations of a 2nd grade elastic cylinder. Mech. Res. Commun. 2018, 94, 45–48. [Google Scholar] [CrossRef] [Green Version]
  13. Ishihara, K.; Tonegawa, Y.; Suyemitsu, T.; Kubo, H. The blastocoelic fluid of sea urchin embryo induces exogastrulation. J. Exp. Zool. 1982, 220, 227–233. [Google Scholar] [CrossRef]
  14. Allen, R.D. Biophysical aspects of pseudopodium formation and retraction. In The Biology of Amoeba; Jeon, K.W., Ed.; Academic Press: New York, NY, USA, 1973; pp. 201–247. [Google Scholar]
  15. Orekhov, V.; Hong, D.W.; Yim, M. Actuation mechanisms for biologically inspired everting toroidal robots. In Proceedings of the IEEE/RSJ 2010 International Conference on Intelligent Robots and Systems, IROS 2010—Conference Proceedings2010, Taipei, Taiwan, 18–22 October 2010; pp. 2535–2536. [Google Scholar]
Figure 1. Technical drawing of the sample geometry to determine minimum bar thicknesses in relation to orientation and tilting angle.
Applsci 10 06466 g001
Figure 2. Alignment of the samples on the building platform-view from the slicer program.
Applsci 10 06466 g002
Figure 3. Technical drawing of the round tensile bars to determine Young’s modulus.
Applsci 10 06466 g003
Figure 4. Rendering of the net structure with homogenized nodes through rounding from CAD.
Applsci 10 06466 g004
Figure 5. Round tension bars with exemplary markings of measuring points.
Applsci 10 06466 g005
Figure 6. Distribution of the measuring points along the entire structure height.
Applsci 10 06466 g006
Figure 7. Additive manufactured single bars with varying diameter on common base with varying support structure, tilting angle and orientation on the building platform (rotation in z-axis).
Applsci 10 06466 g007
Figure 8. Exemplary evaluation using a regression line (dashed) (a); identified engineering stress–engineering strain curves of the tensile tests on round tensile bars (b) with a table of results for the Young’s modulus.
Applsci 10 06466 g008
Figure 9. Geometry model of everting structure: upper tube end with Cartesian coordinate systems for definition of cylindrical loads (a) and detailed view with dependent geometric variables (b). The angle γ between two horizontally neighboring crossing points describes the section angle with center of angle (not shown) that lies on the inner cylinder axis.
Applsci 10 06466 g009
Figure 10. Equivalent von Mises beam stress distribution in everting simulation: net angle 30° (a), net angle 45° (b) and net angle 60° (c). Different stages of the everting process are shown from top to bottom for each net angle (columns) at equal times (rows).
Applsci 10 06466 g010
Figure 11. Axial strain for net angle of 30° (a), 45° (b) and 60° (c). The positive legend maximum is fixed at a strain of 0.12.
Applsci 10 06466 g011
Figure 12. Failure pattern on geometrical notches (a), on printing misalignments along printing layers (b), and on topological notches (c).
Applsci 10 06466 g012
Figure 13. Net in unrolled representation: Location of failure pattern on geometrical notches (red), on printing misalignments along printing layers (orange) and on topological notches (blue).
Applsci 10 06466 g013
Figure 14. Geometry and boundary conditions of the unit cell model, with load directions v 1 and v 2 at additional massless nodes above upper ends and clamped lower ends of the unit cell (a). Enlarged detail view of one load node with constraints on the upper cutting planes (b).
Applsci 10 06466 g014
Figure 15. Detailed model of unit cell with equivalent von Mises stress distribution: initial geometry (a) and improved geometry (b).
Applsci 10 06466 g015
Figure 16. Node of the initial (a) and the improved geometry (b).
Applsci 10 06466 g016
Figure 17. Additively manufactured everted tubular net structure with homogenized nodes: everted over the entire length in top and side view (a) and in different stages of the everting process from top to bottom (b) (captured in reverse transformation).
Applsci 10 06466 g017
Table 1. Table of measurement results for diameters of the round tension bars, including average and deviation (target diameter: 2 mm).
LeftRightAverageDeviation
Z1_S31733µm1748µm1748µm1717µm1736.50µm12.82µm
Z1_S21733µm1748µm1748µm1733µm1740.50µm7.50µm
Z1_S11717µm1702µm1702µm1702µm1705.75µm6.50µm
Table 2. Table of measurement results for the diameters of the additive manufactured net structure bars (exemplary from version 1), including average and deviation (target diameter: 2 mm).
diameter in µm
radial position
point 1point 2point 3point 4point 5point 6
bottom 11774.991775.971733.381762.51753.331725.39
21774.311765.251727.851764.461750.331736.64
31772.571766.621719.21769.371759.41727.62
41773.491767.741725.841766.041757.151730.63
average 1773.841768.901726.571765.591755.051730.07
deviation 226.16231.11273.43234.41244.95269.93
middle 11765.631765.151747.411767.41761.021741.52
21770.811757.131754.211768.661761.691734.13
31773.891764.541743.291764.841760.931729.44
41776.131762.771742.981764.431759.741730.45
average 1771.621762.401746.971766.331760.851733.89
deviation 228.39237.60253.03233.67239.16266.12
top 11768.851763.721714.21770.461737.821711.99
21765.031763.711713.921771.861748.371715.42
31758.781757.691718.531768.691742.271715.93
41777.331764.421709.551771.851744.81717.77
average 1767.501762.391714.051770.721743.321715.28
deviation 232.50237.62285.95229.29256.69284.72

