Copernicus Sentinel-1 MT-InSAR, GNSS and Seismic Monitoring of Deformation Patterns and Trends at the Methana Volcano, Greece


 ,
,  , , and
Abstract
1. Introduction
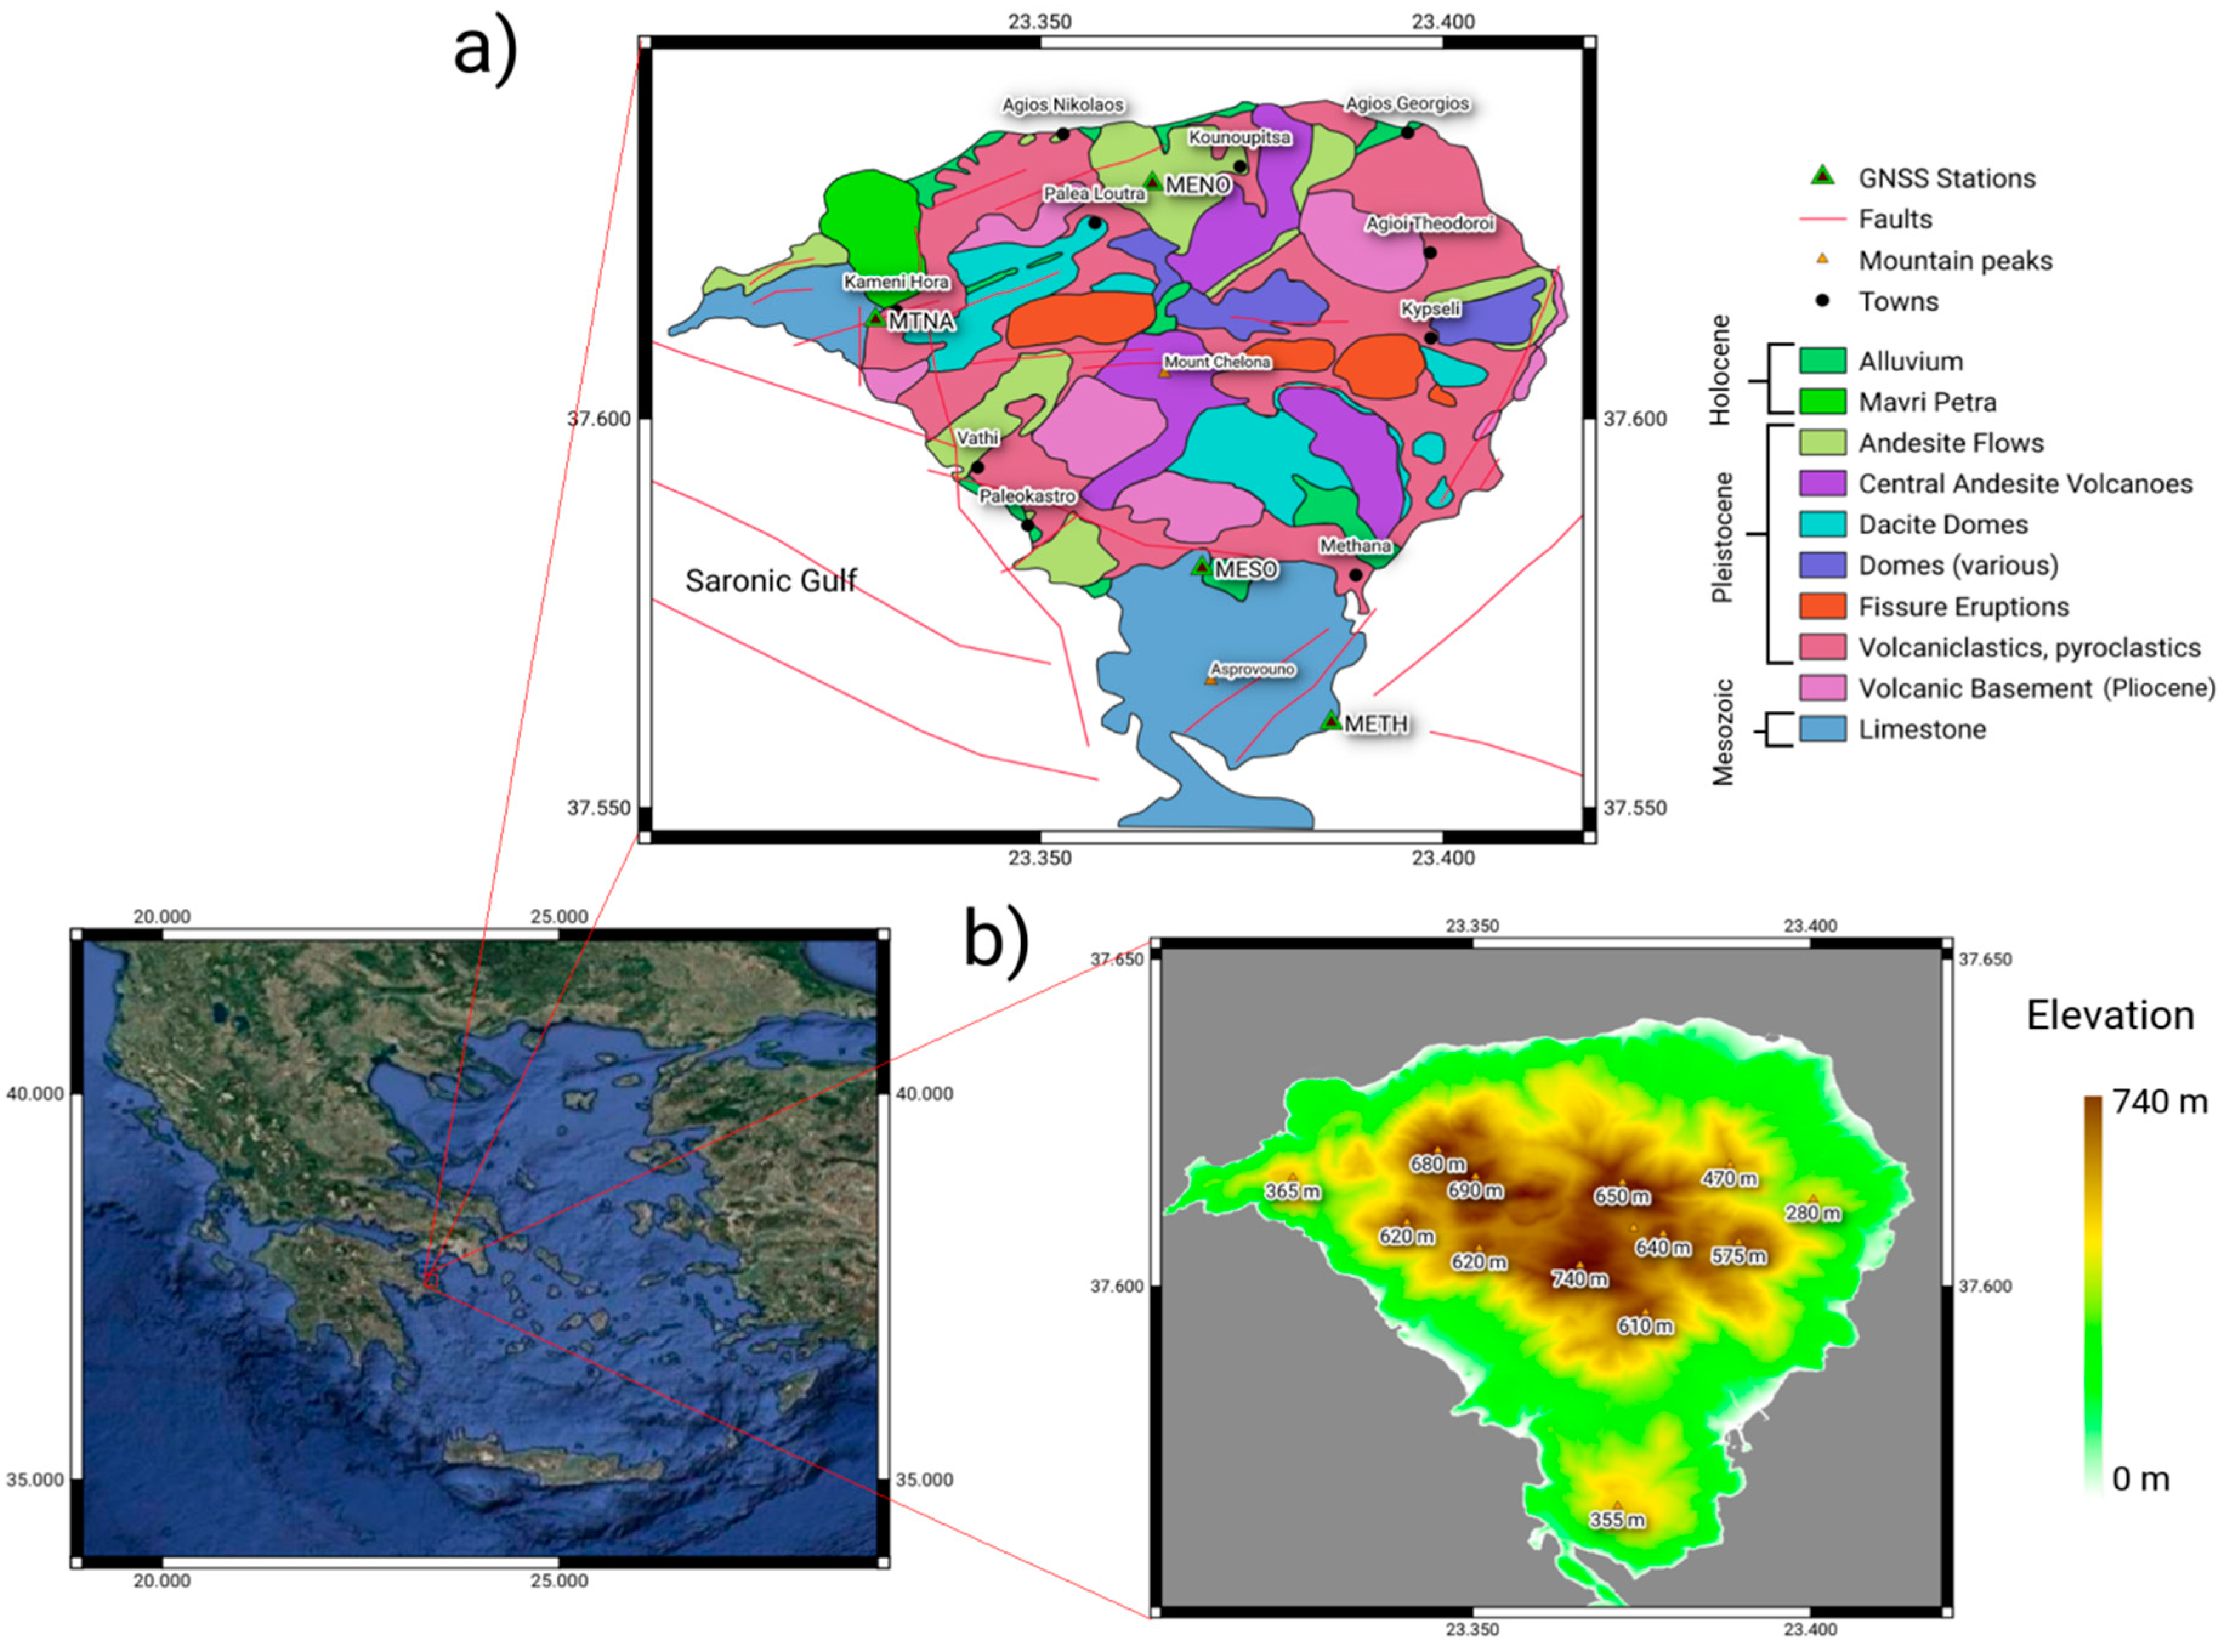
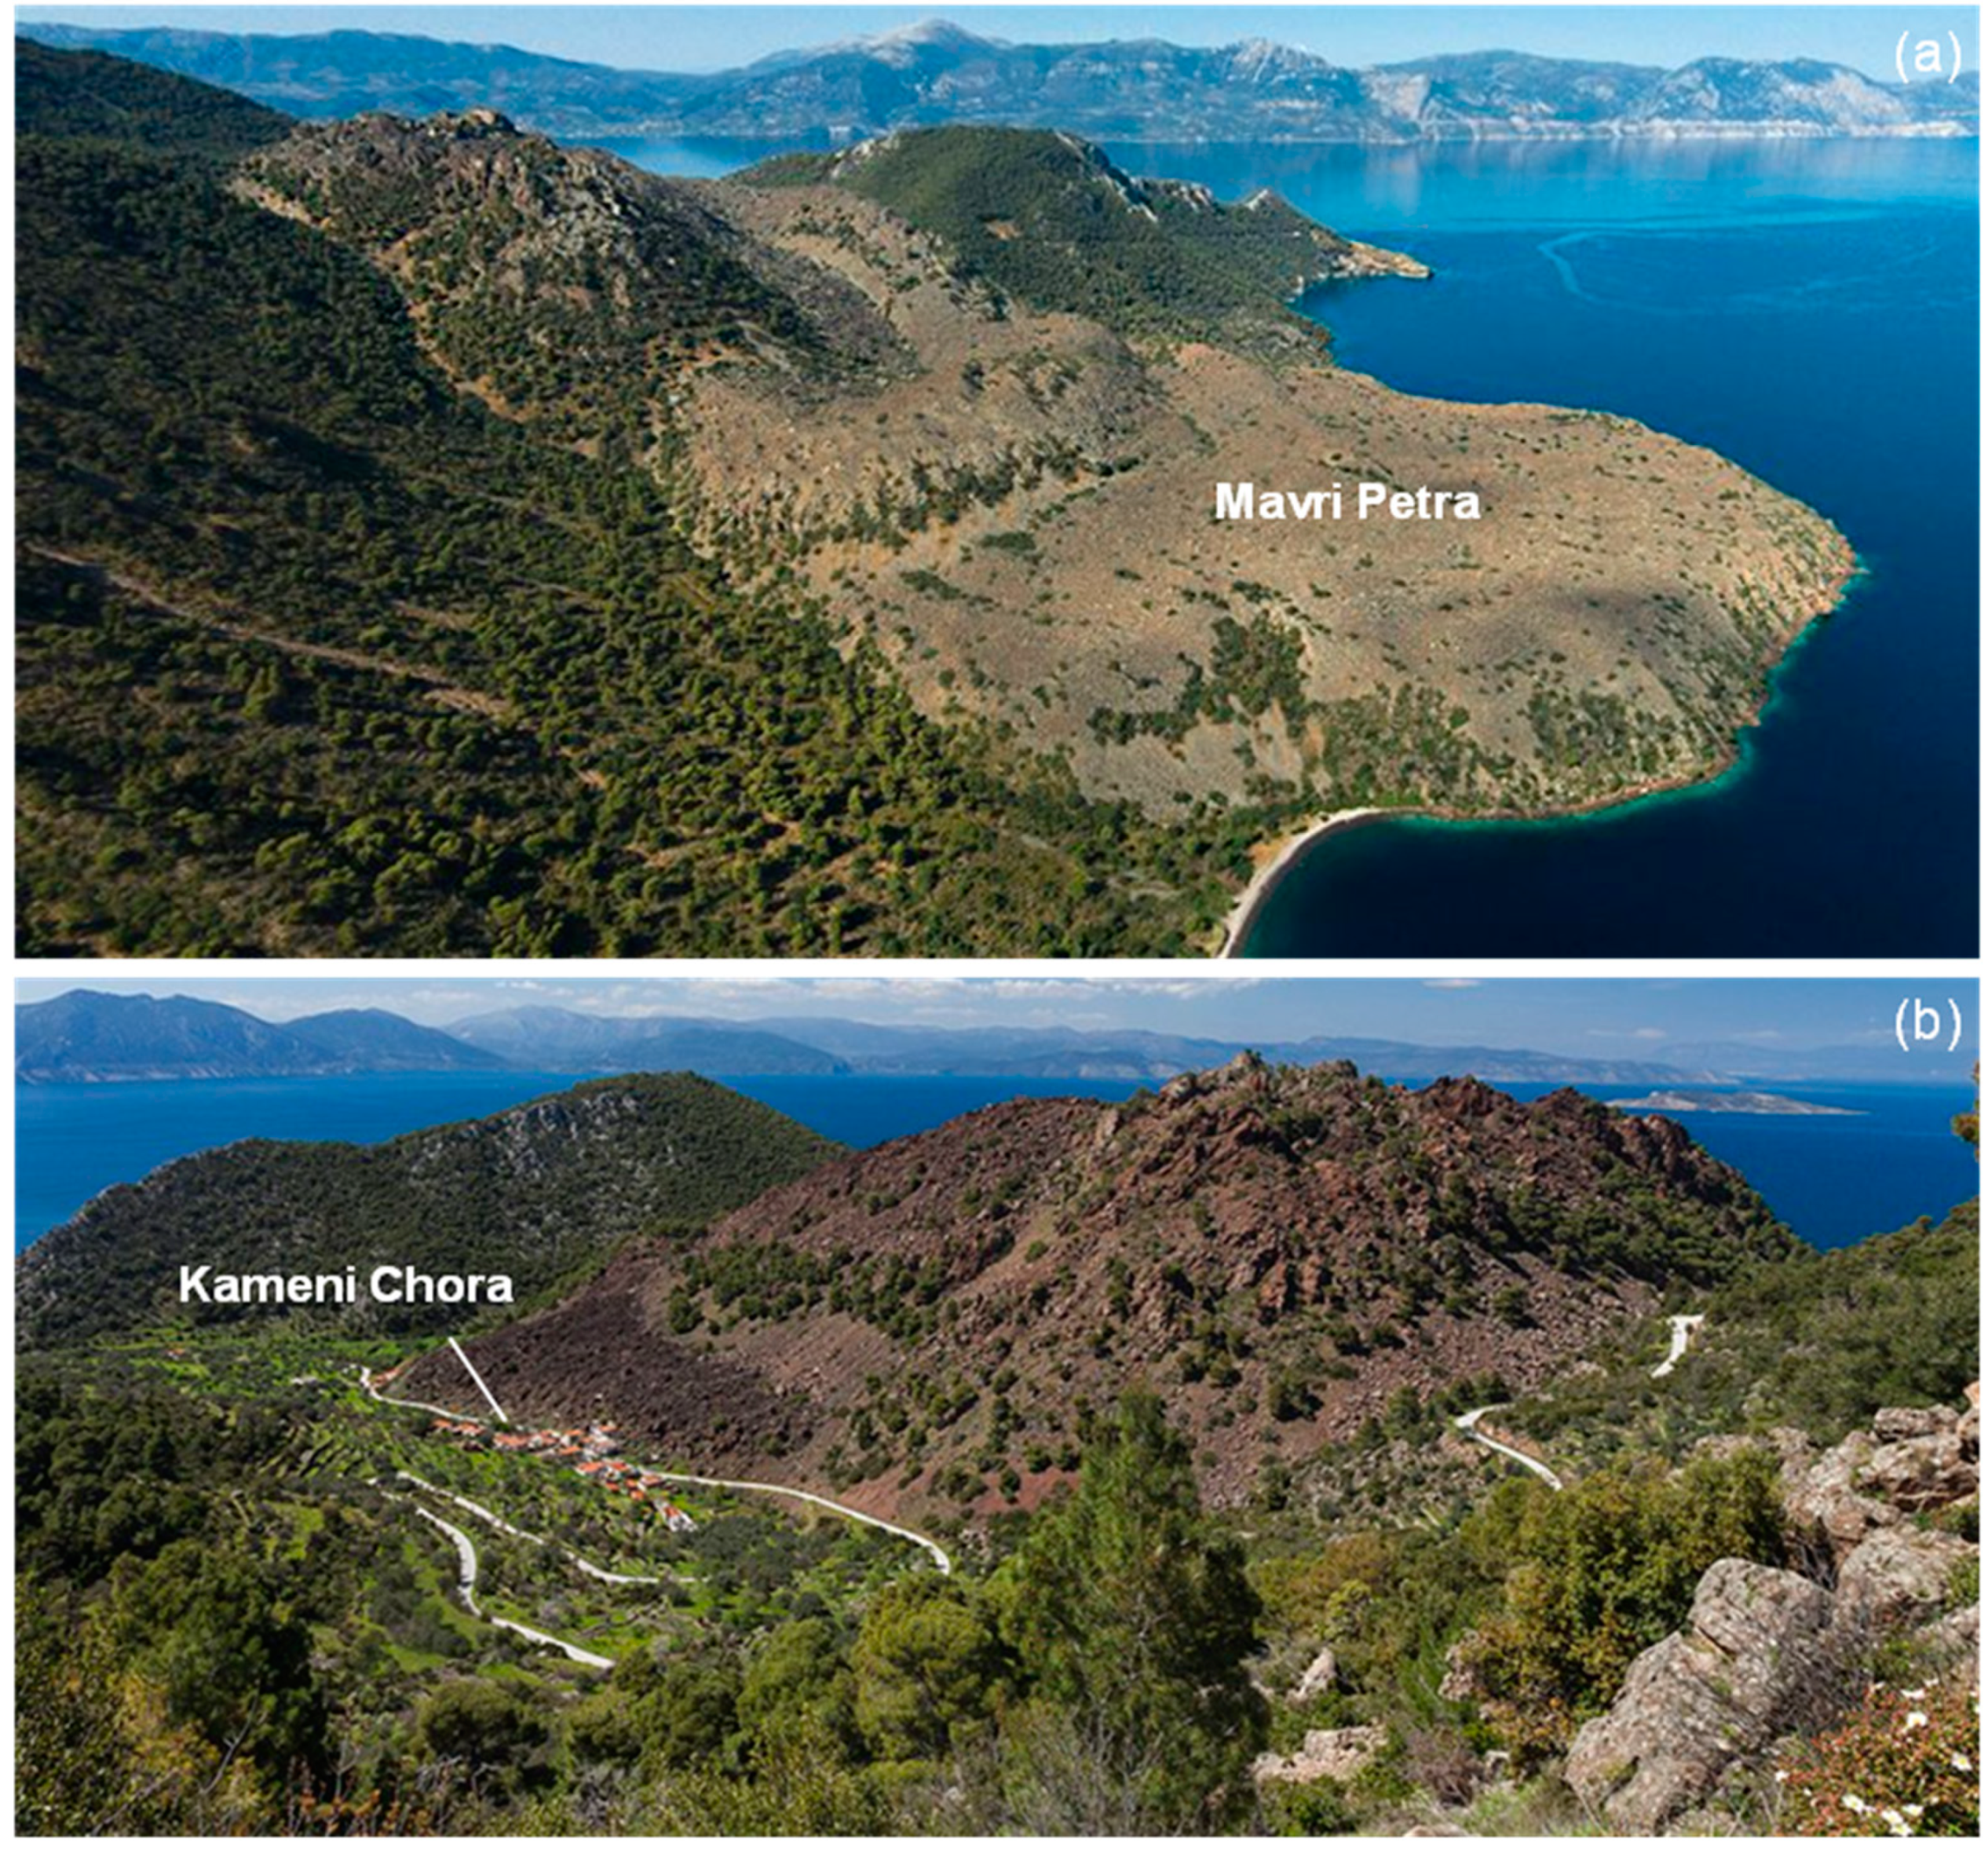
2. The Study Area
3. Materials and Methods
3.1. SAR Data and Multi-Temporal InSAR Processing
3.2. GNSS Continuous Monitoring Data and GPS Benchmark Surveying
3.3. Seismological Data and Processing
4. Results and Discussion
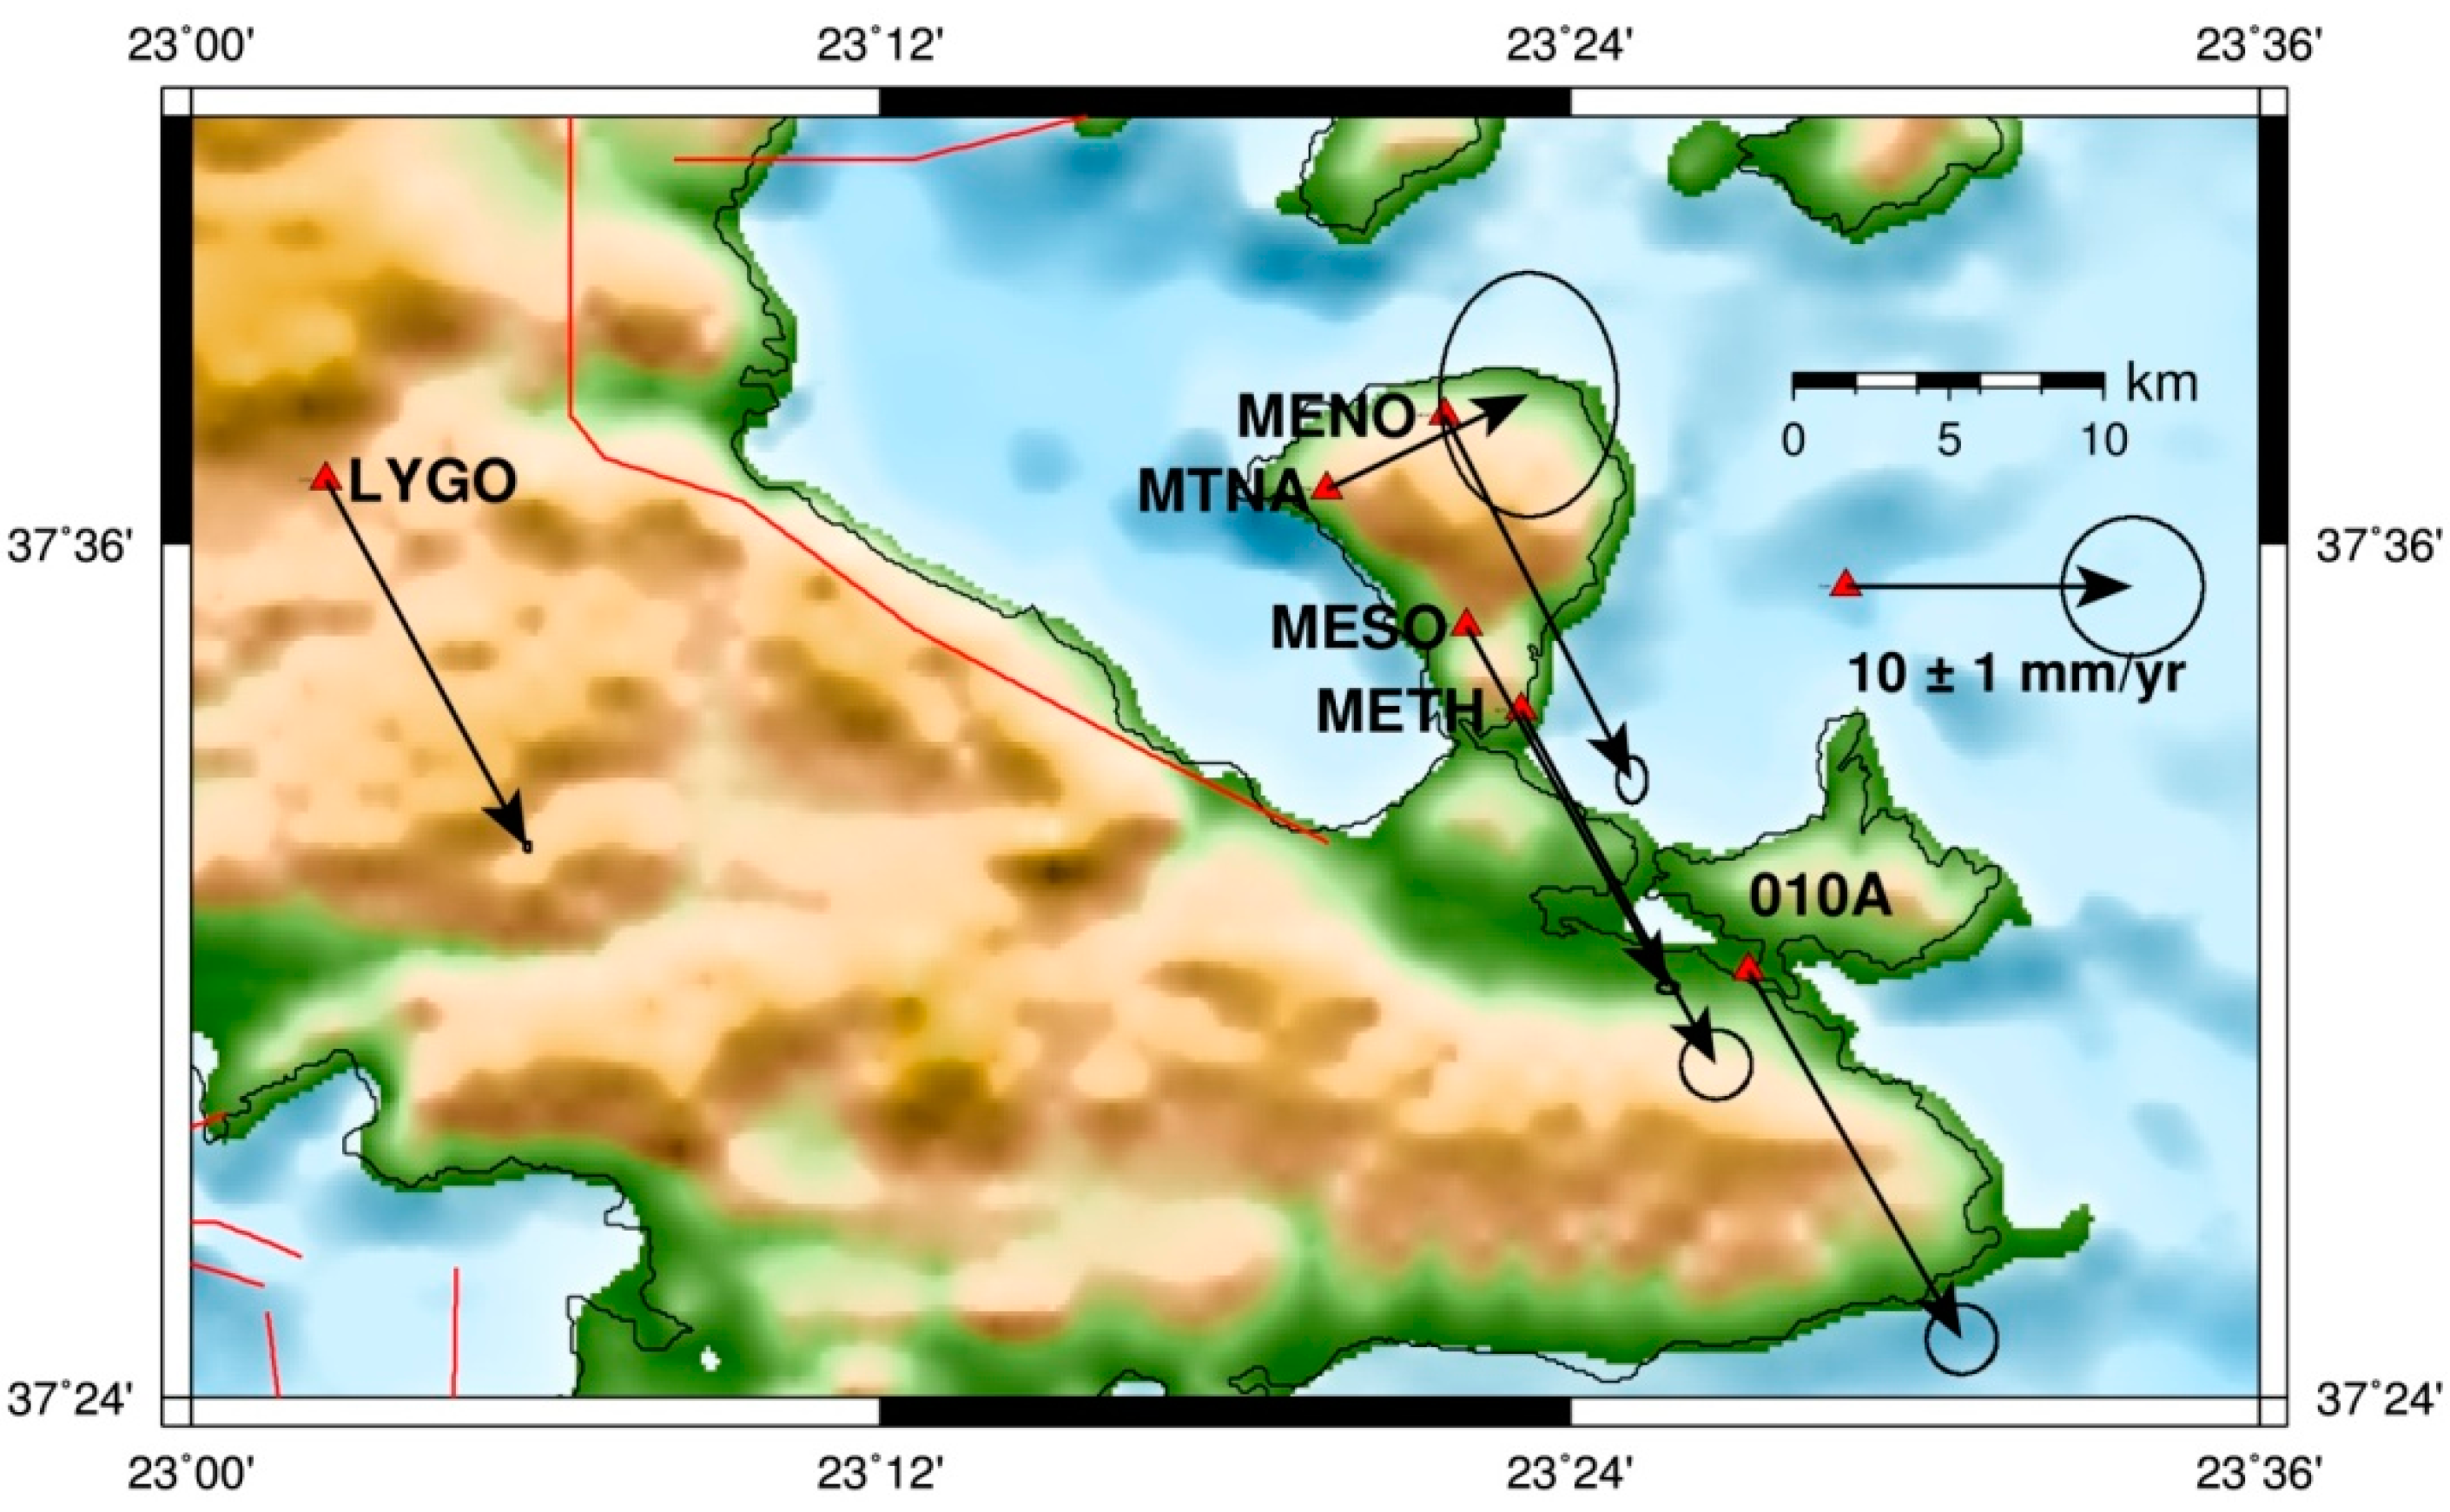
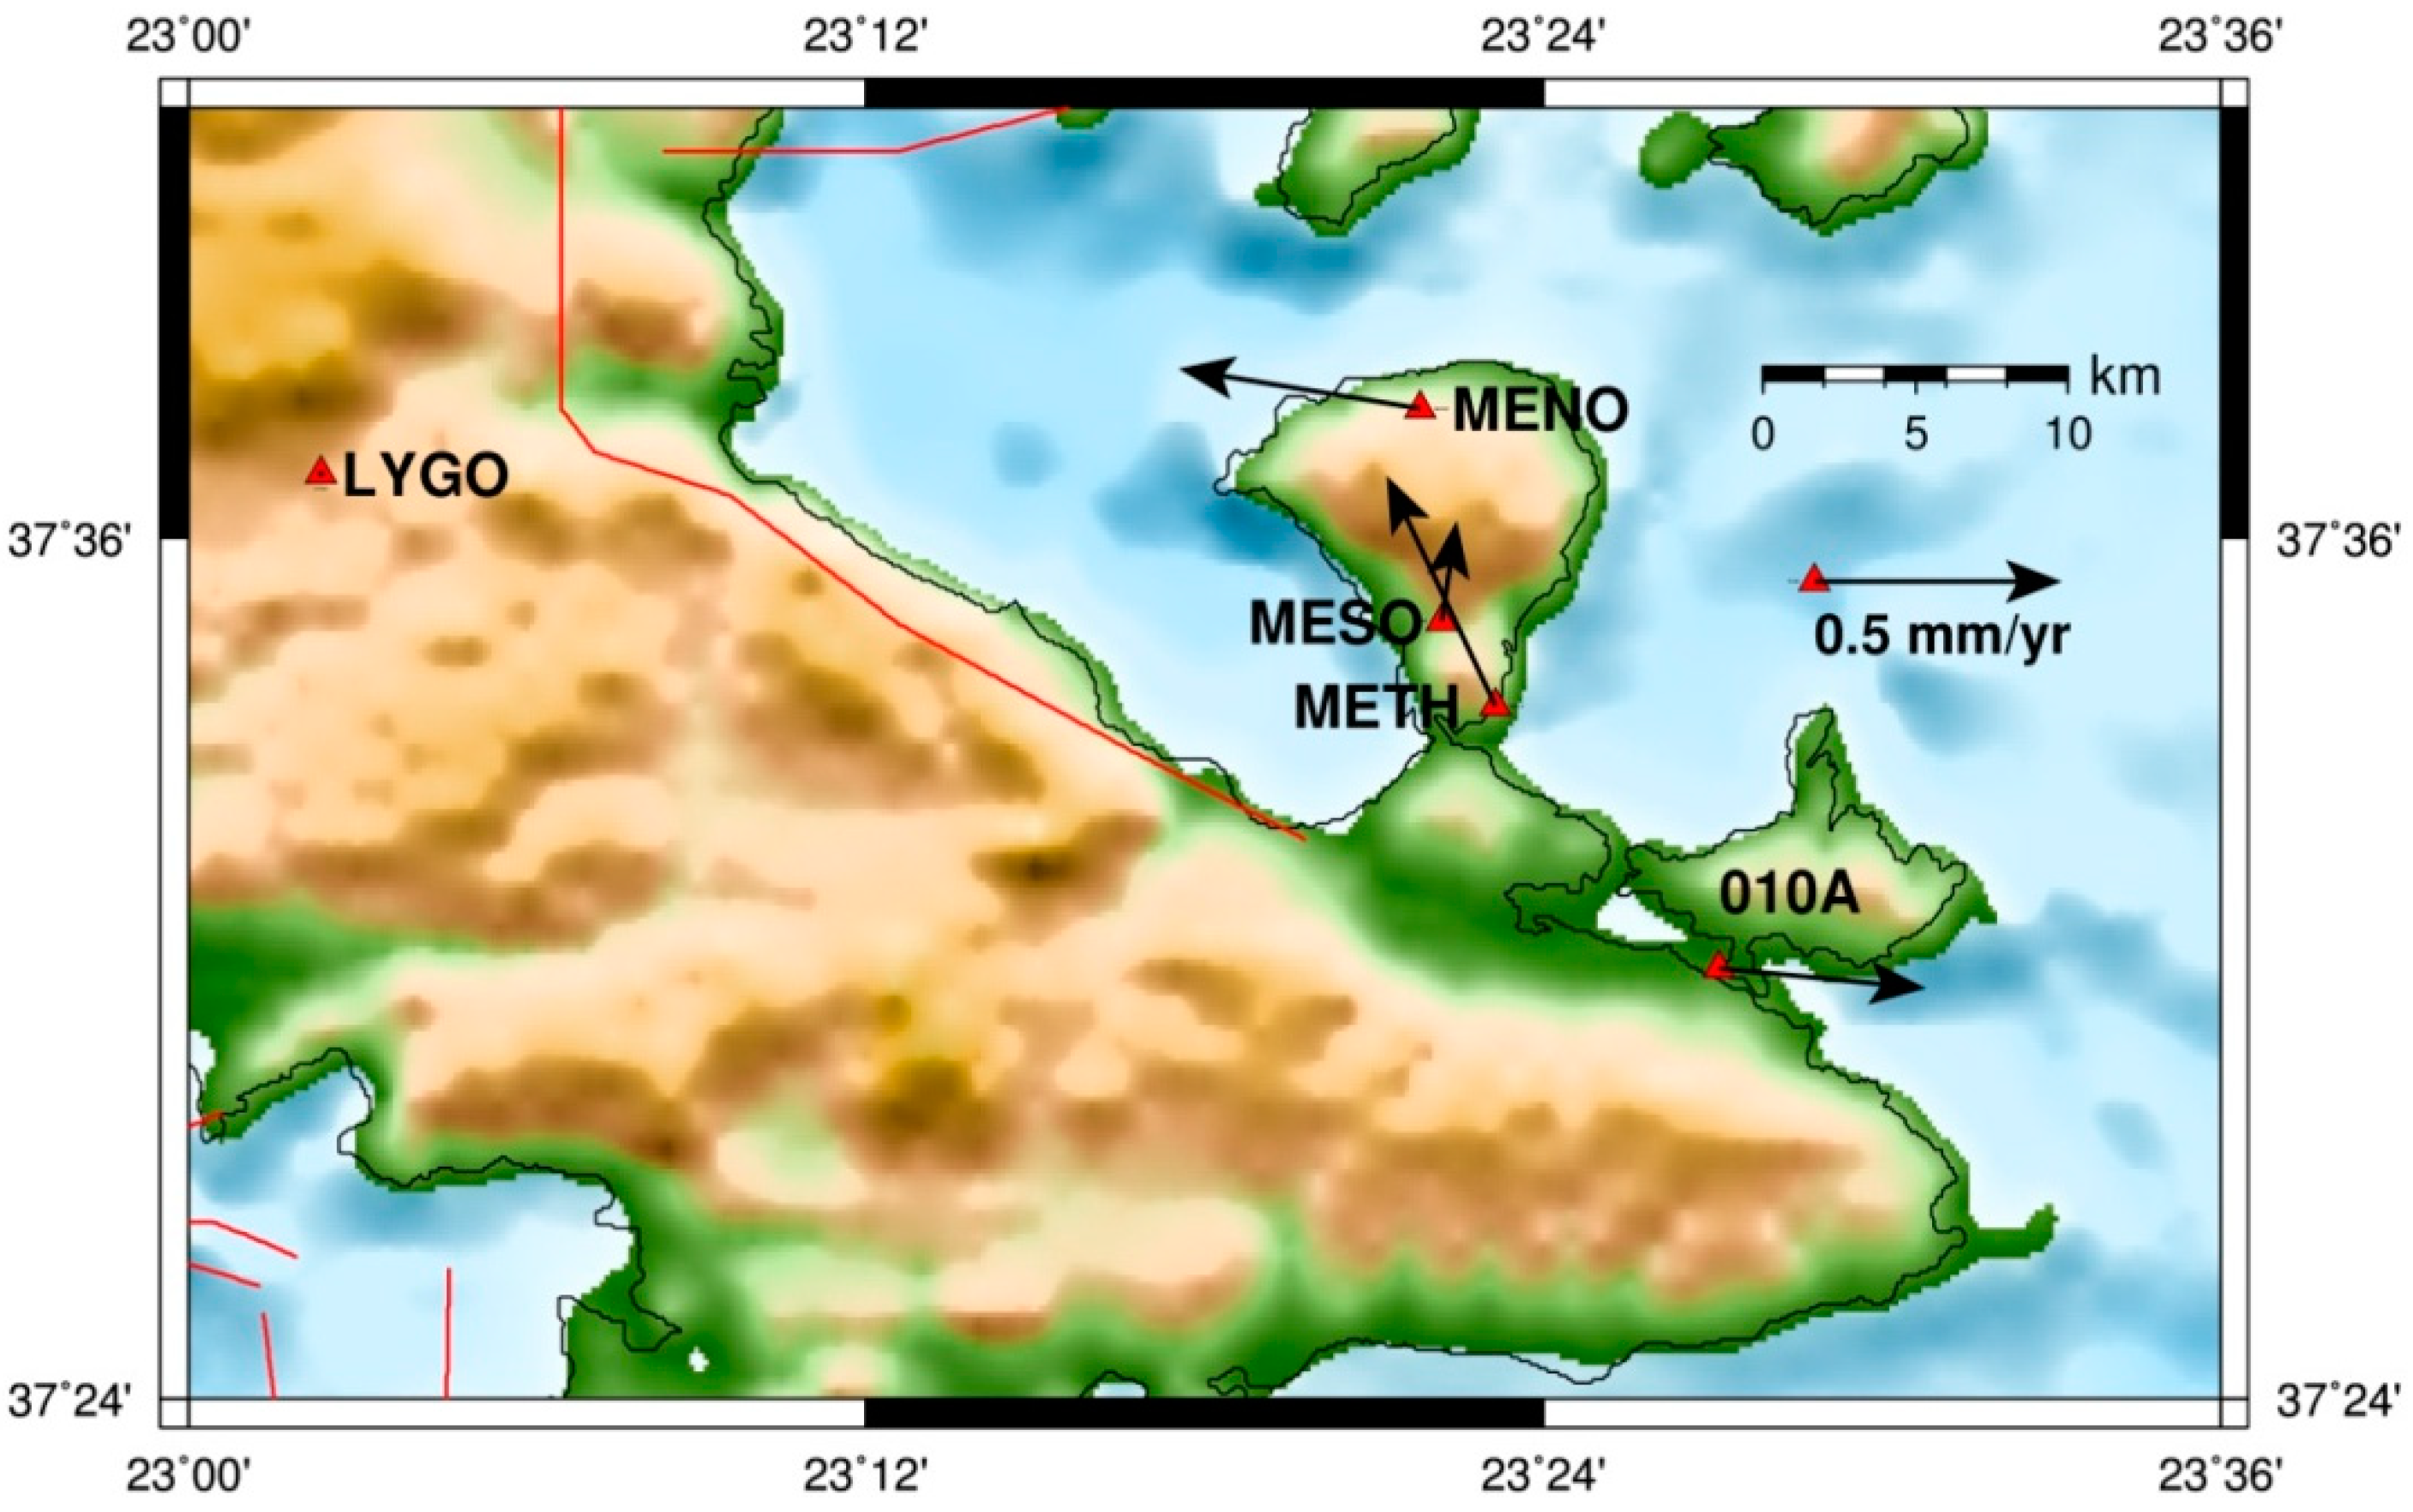
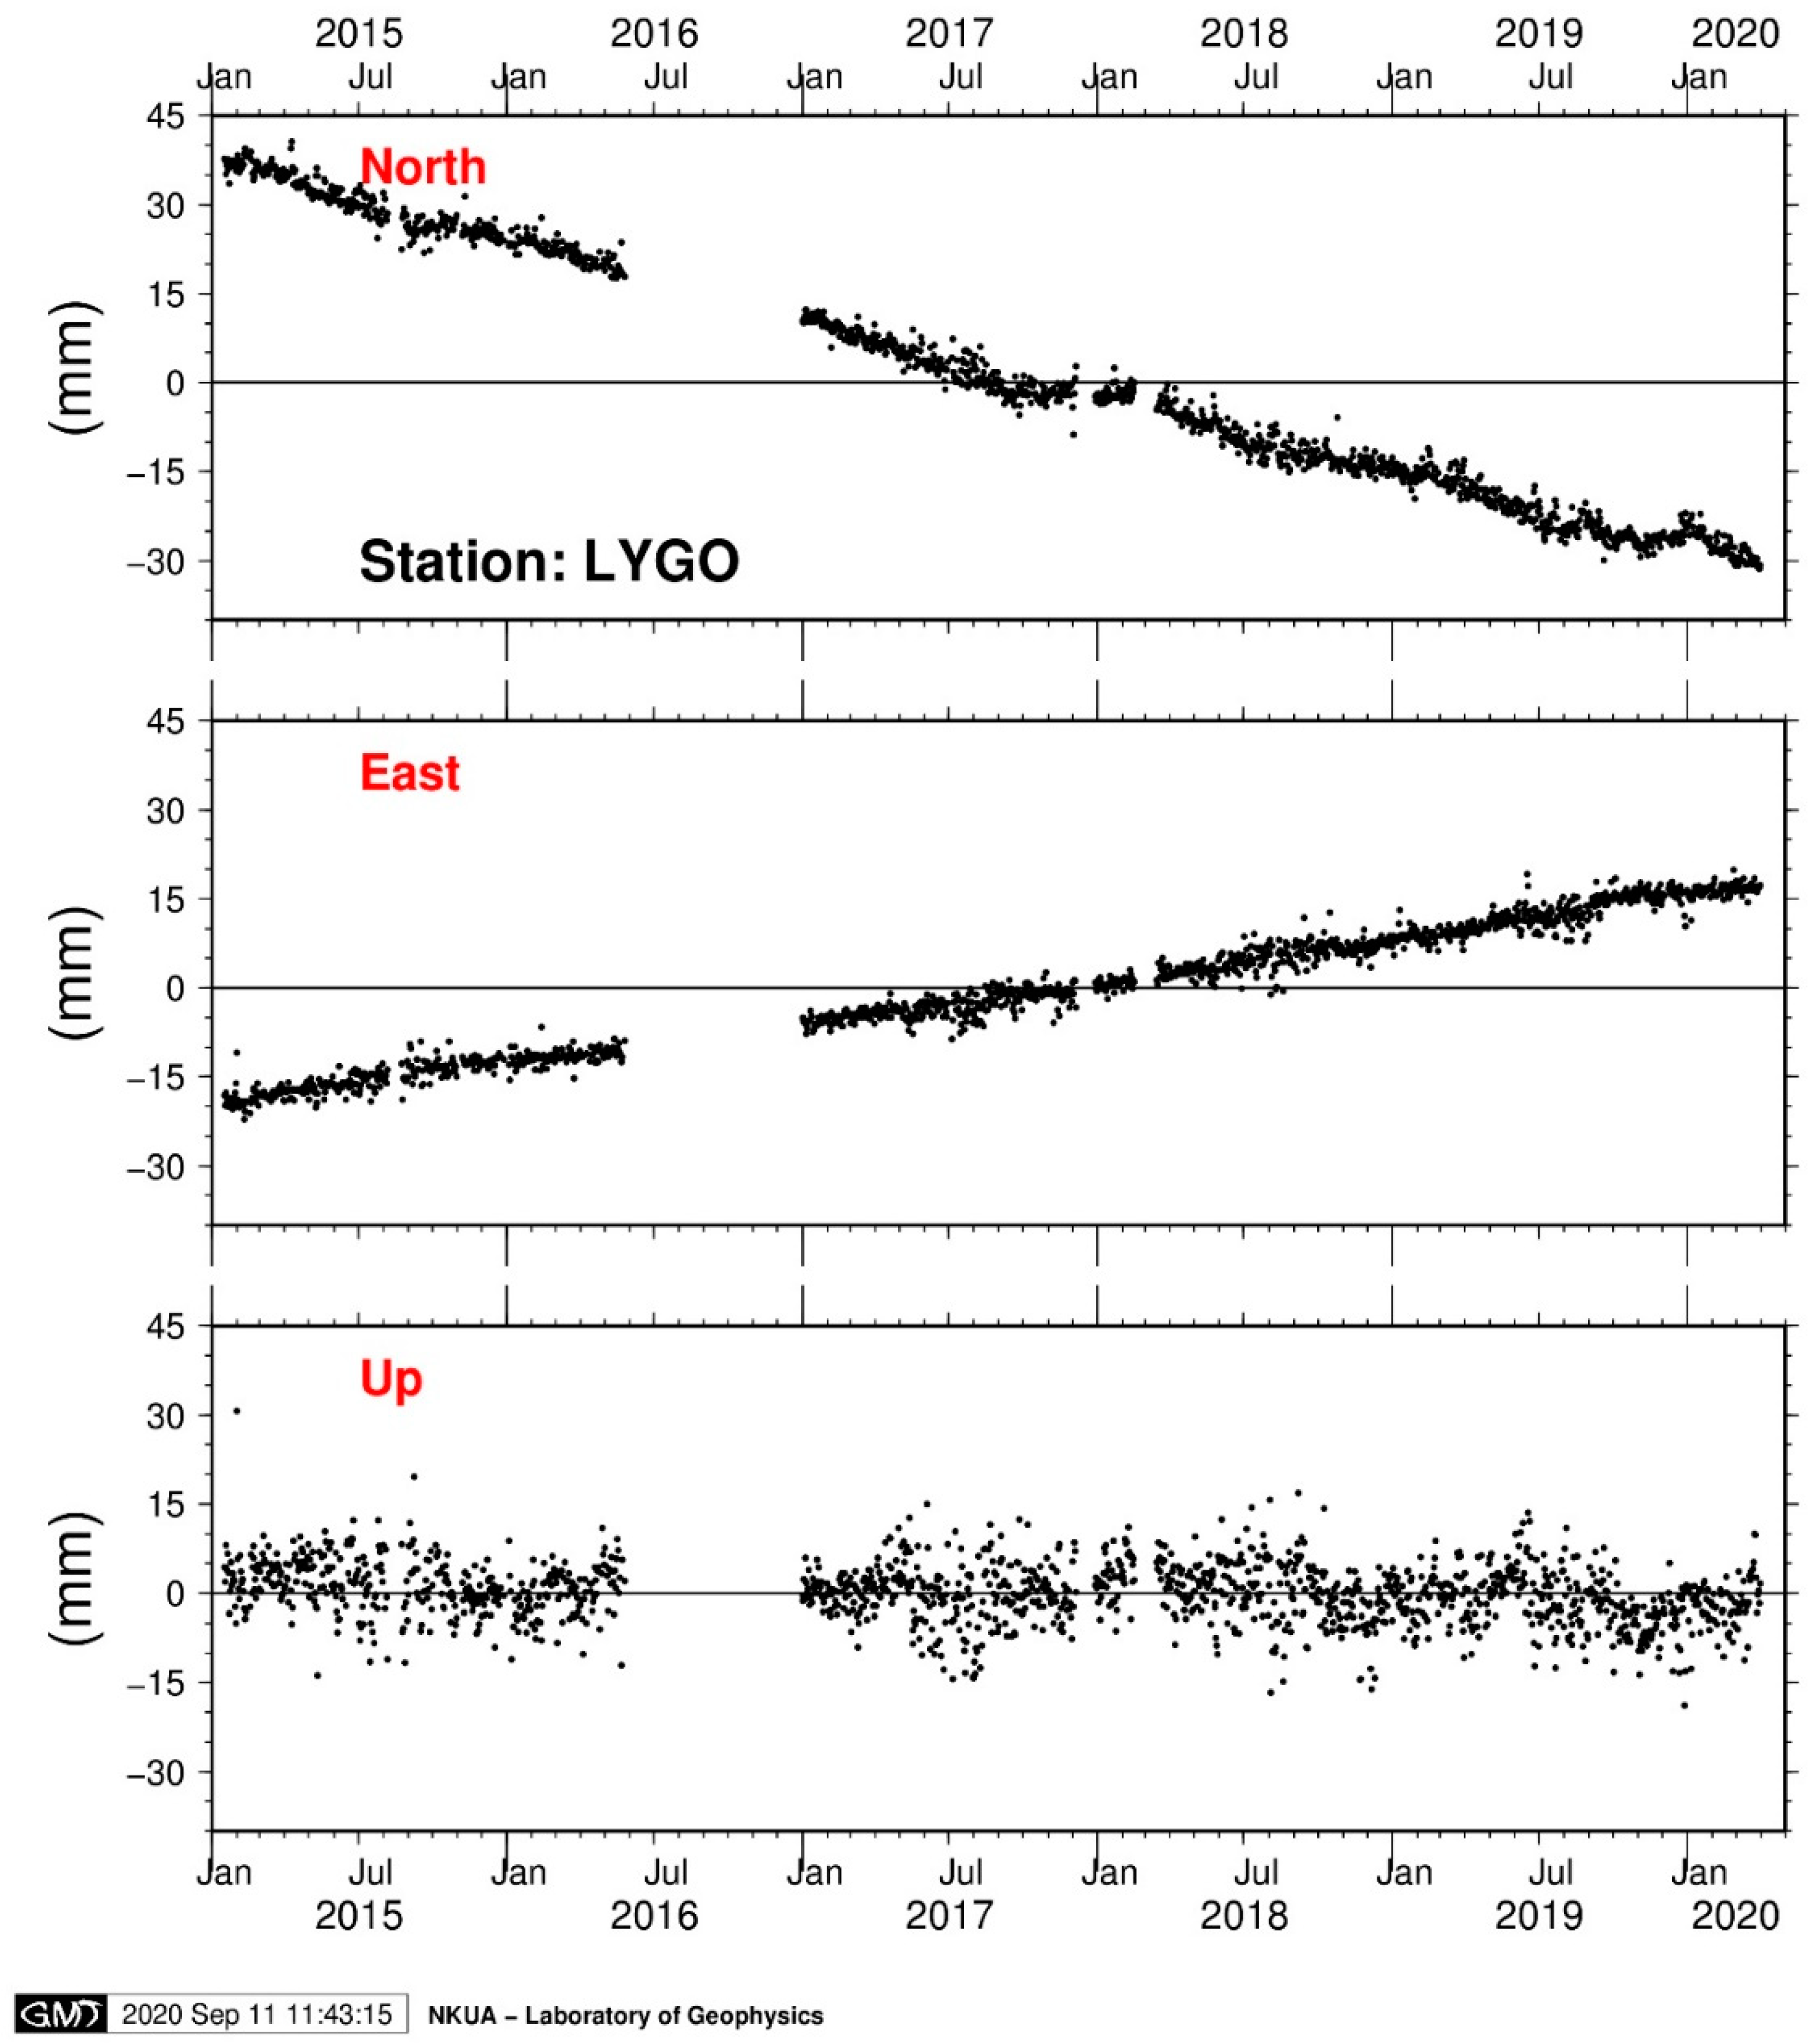
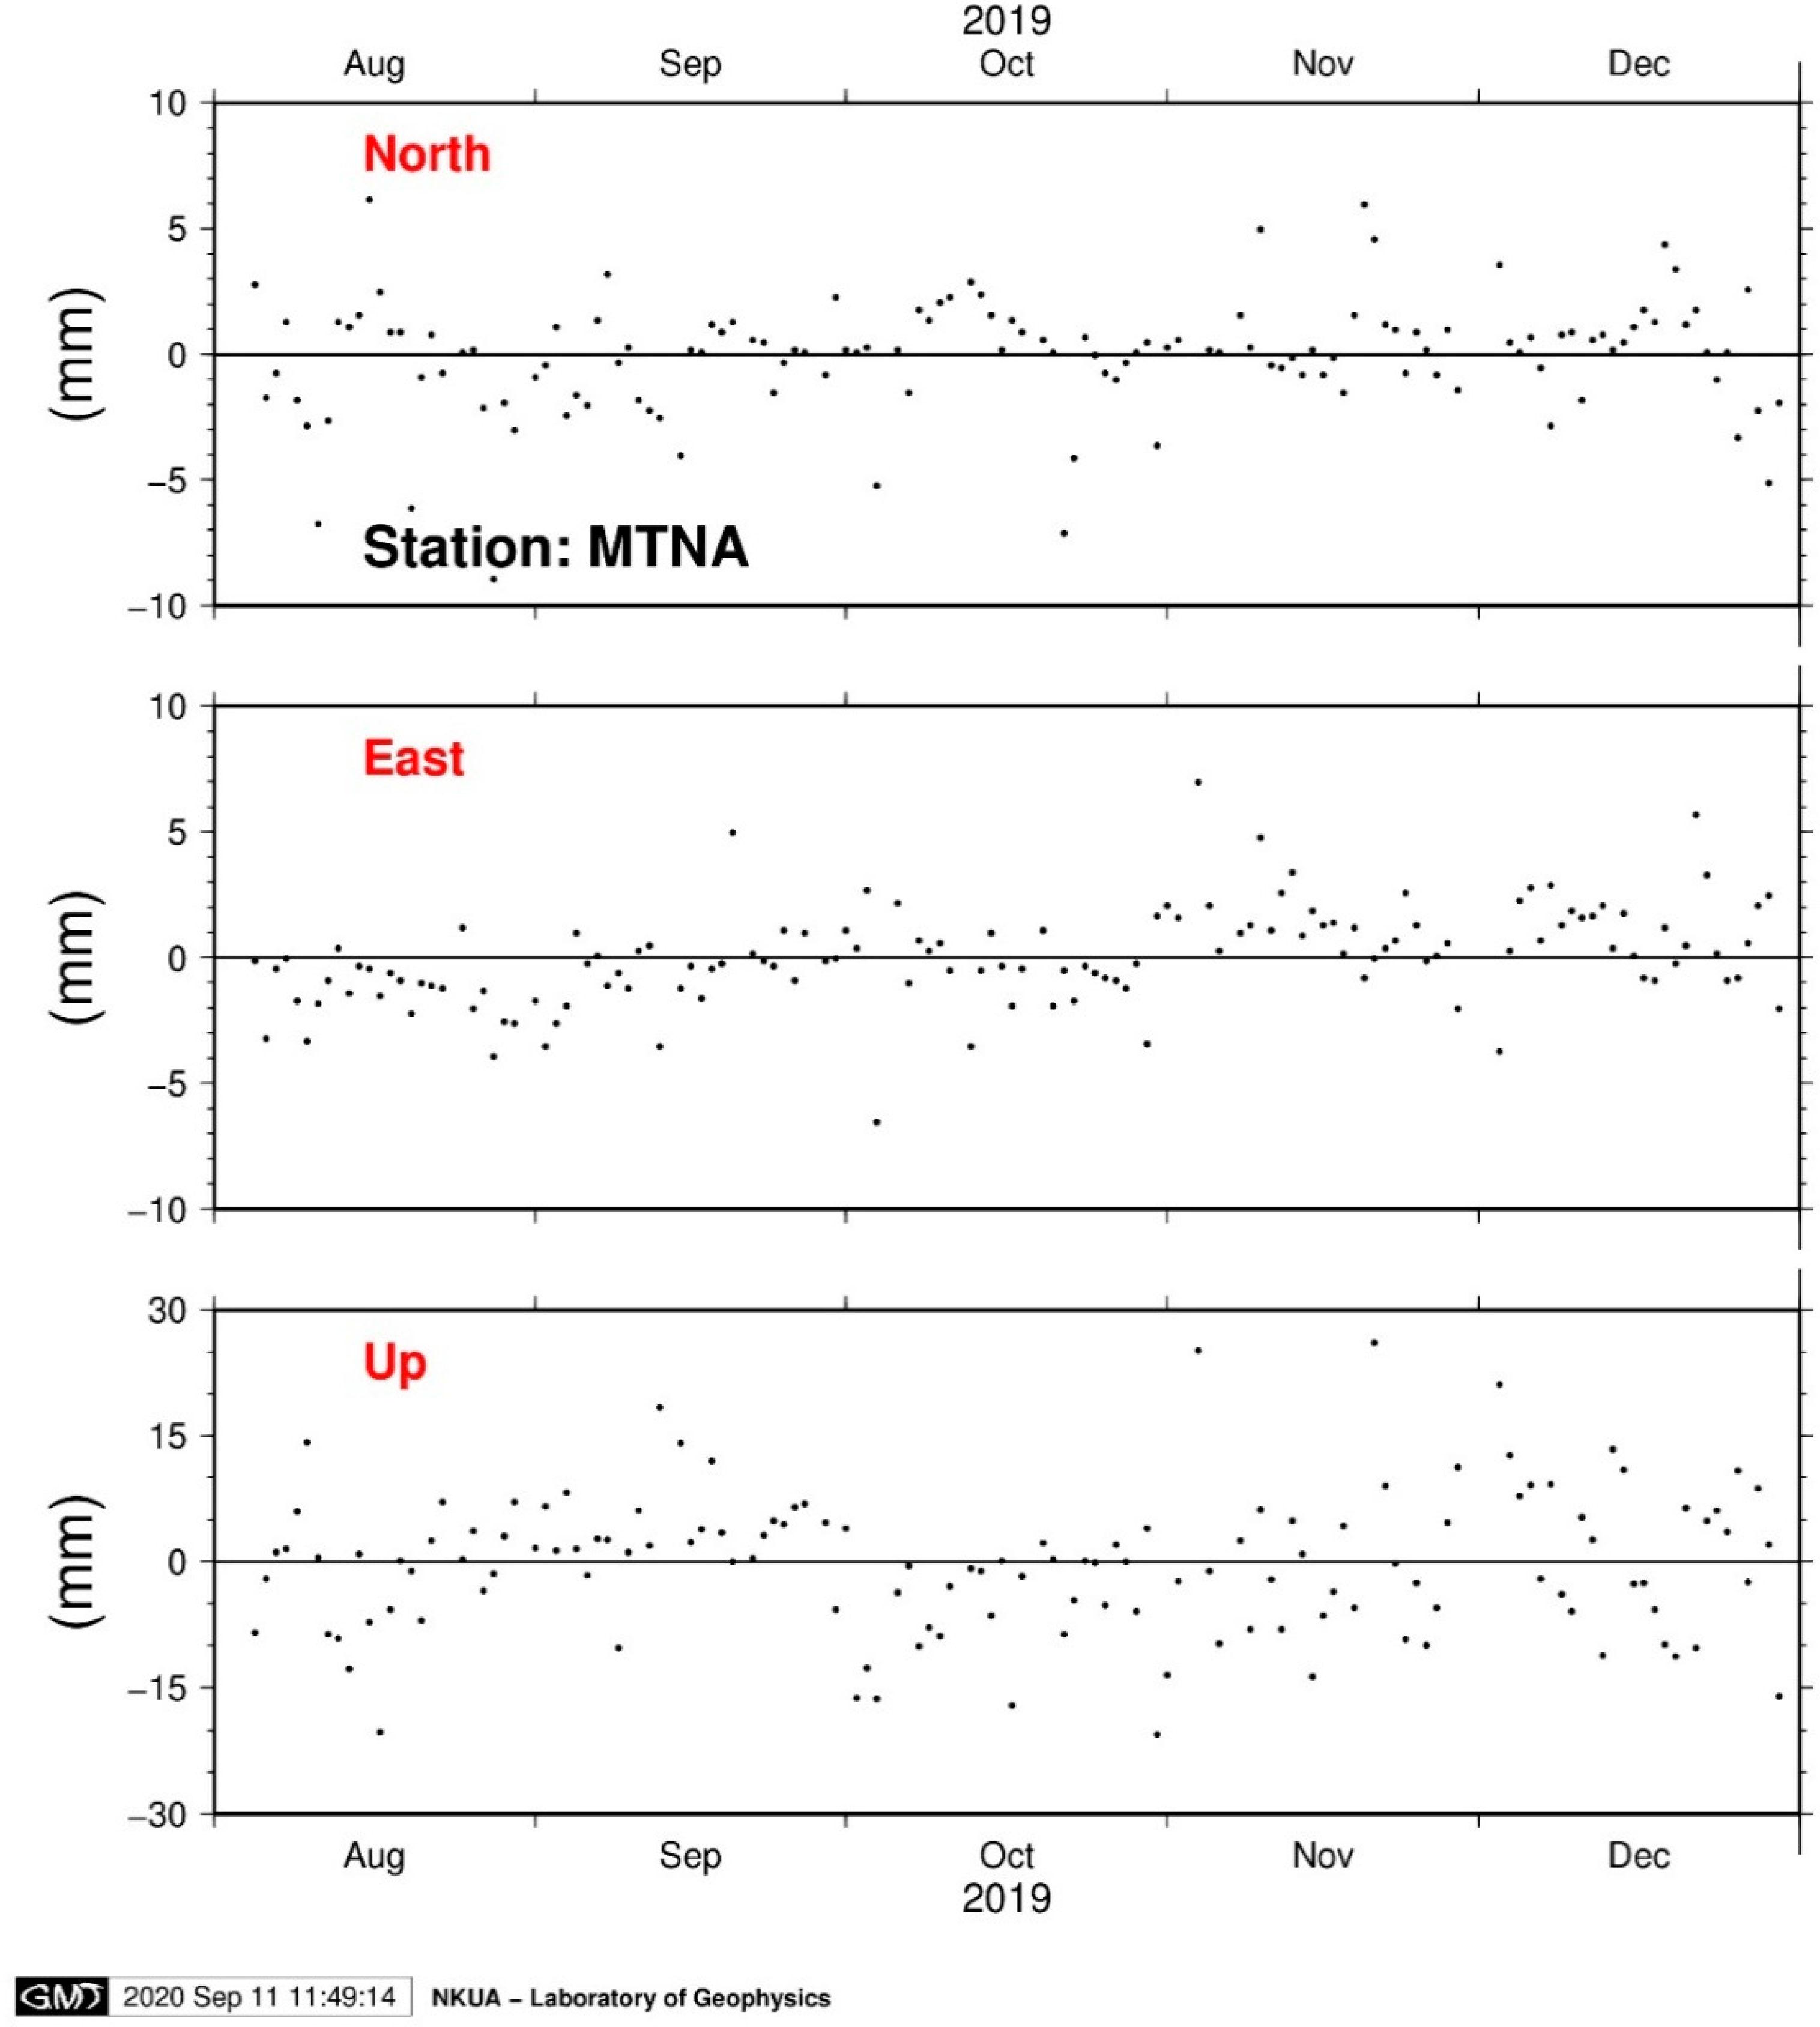
4.1. Evidence from the GNSS Data Analysis
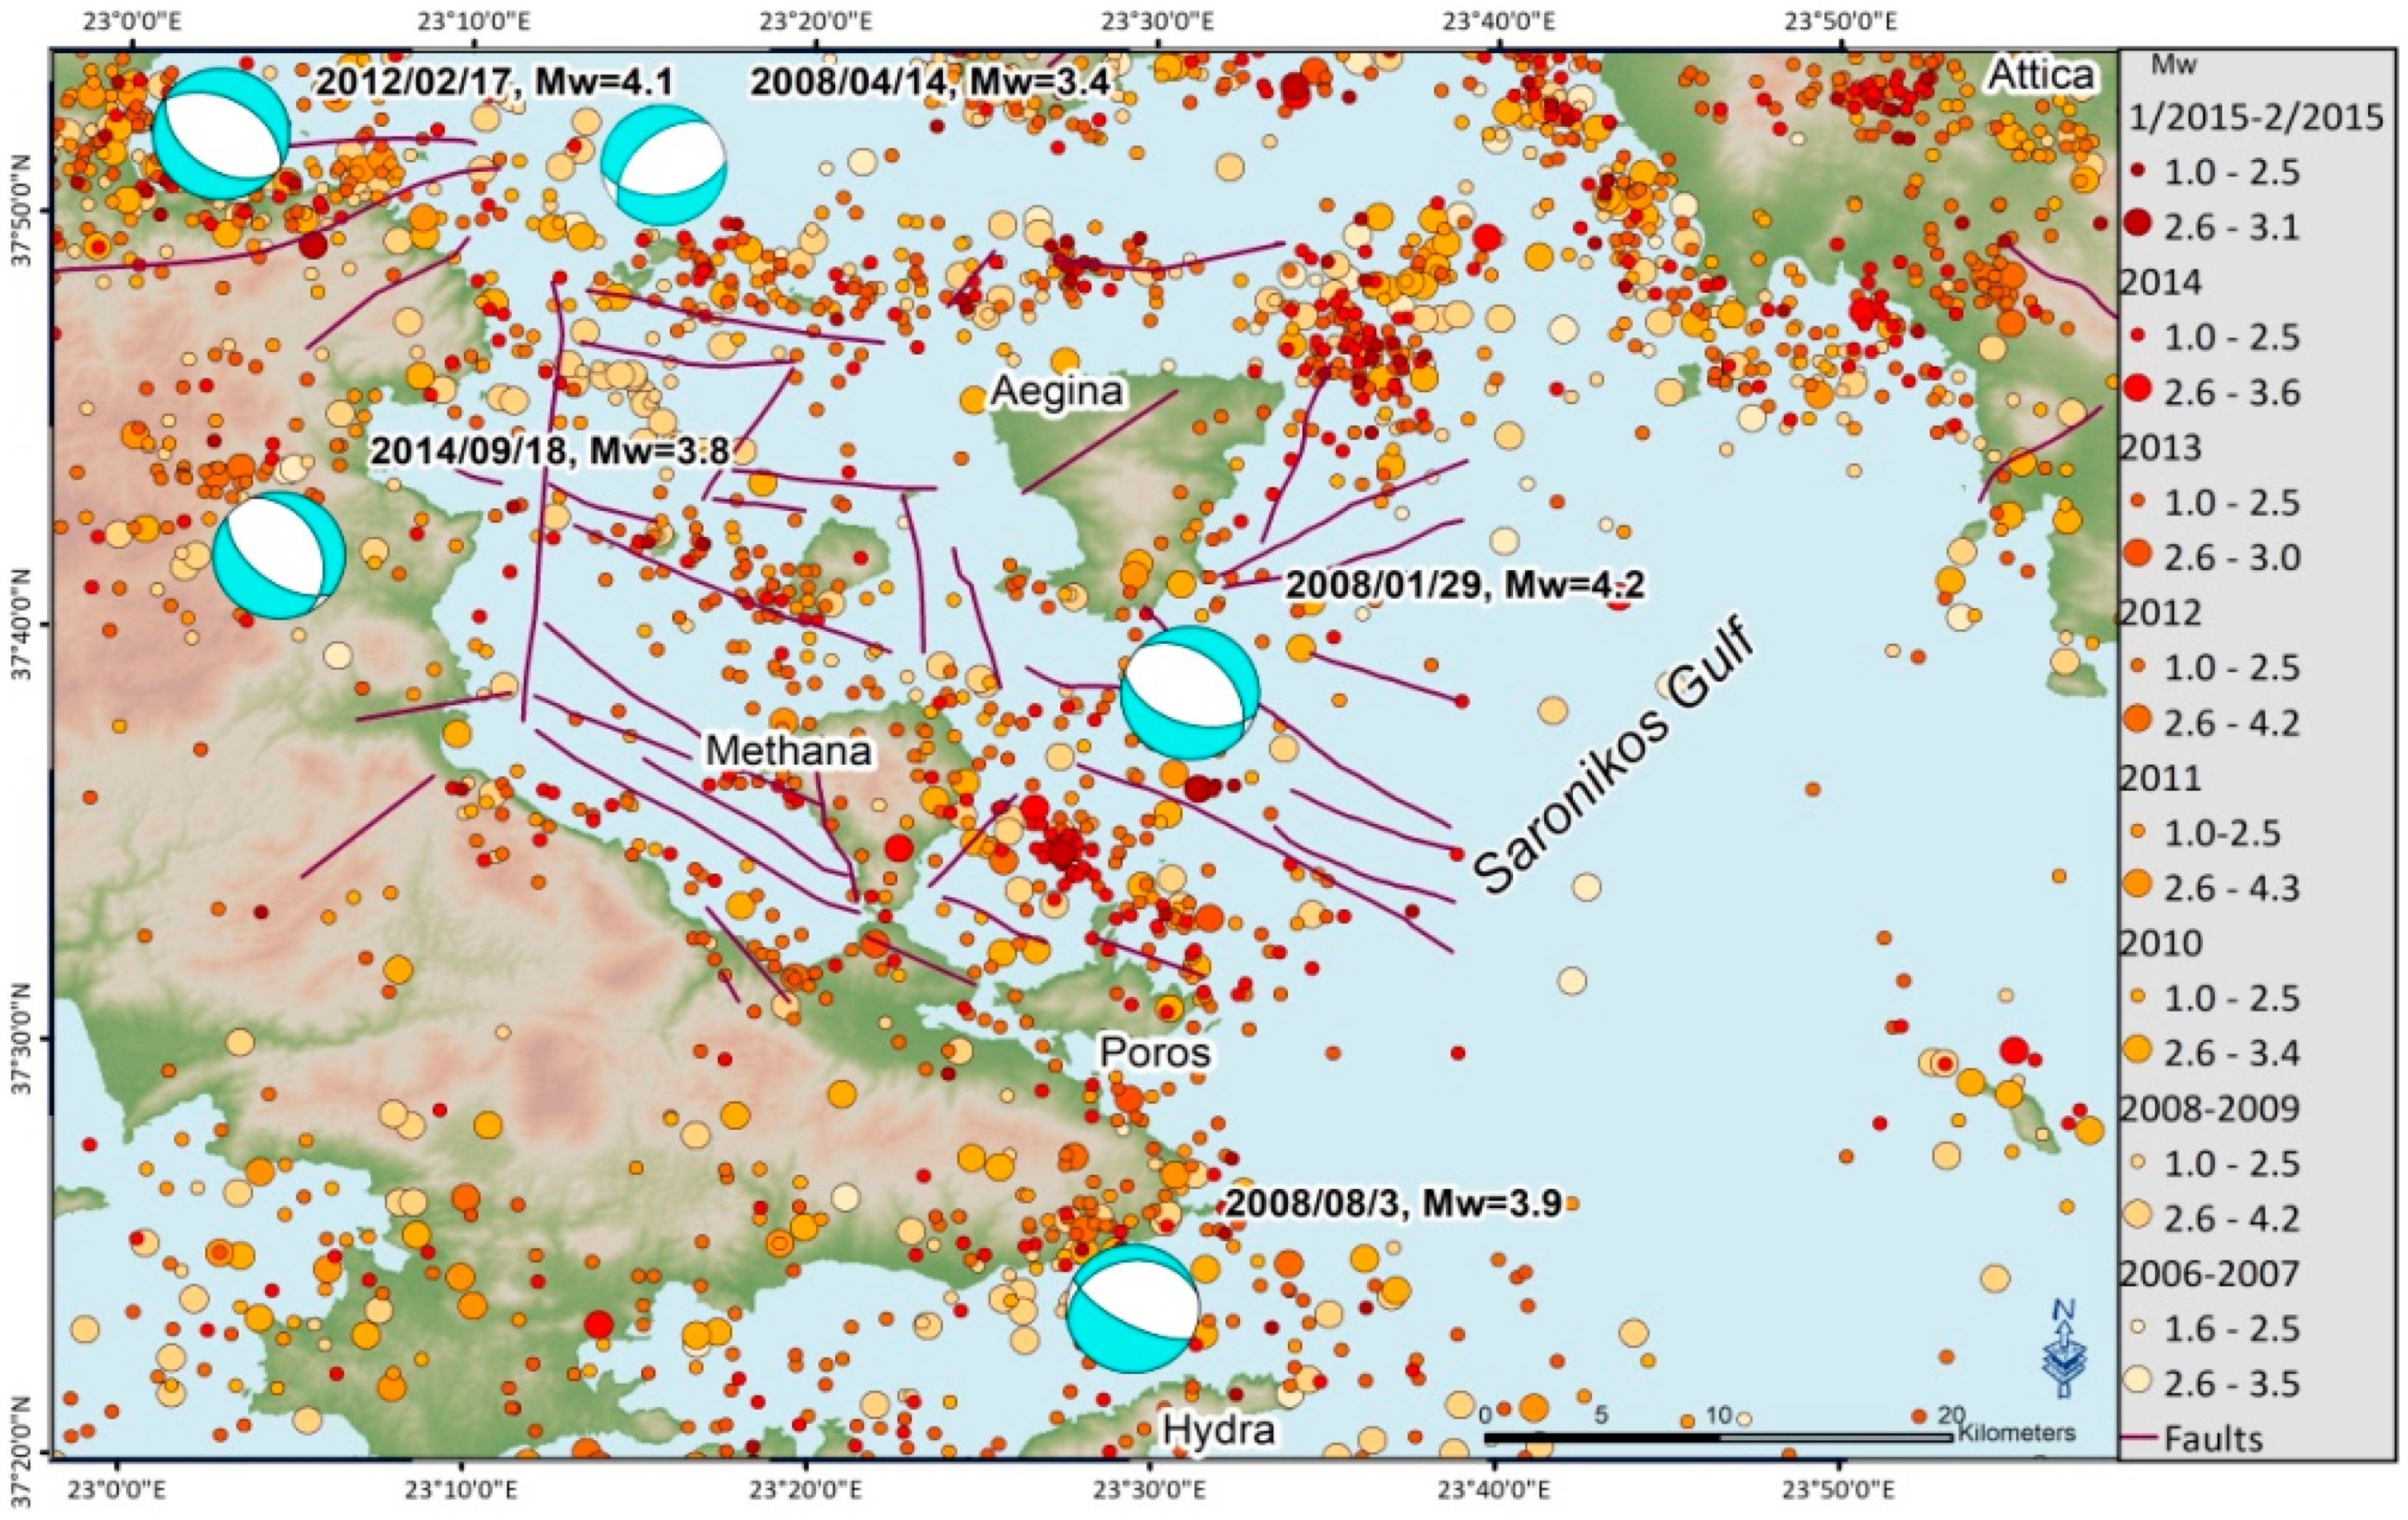
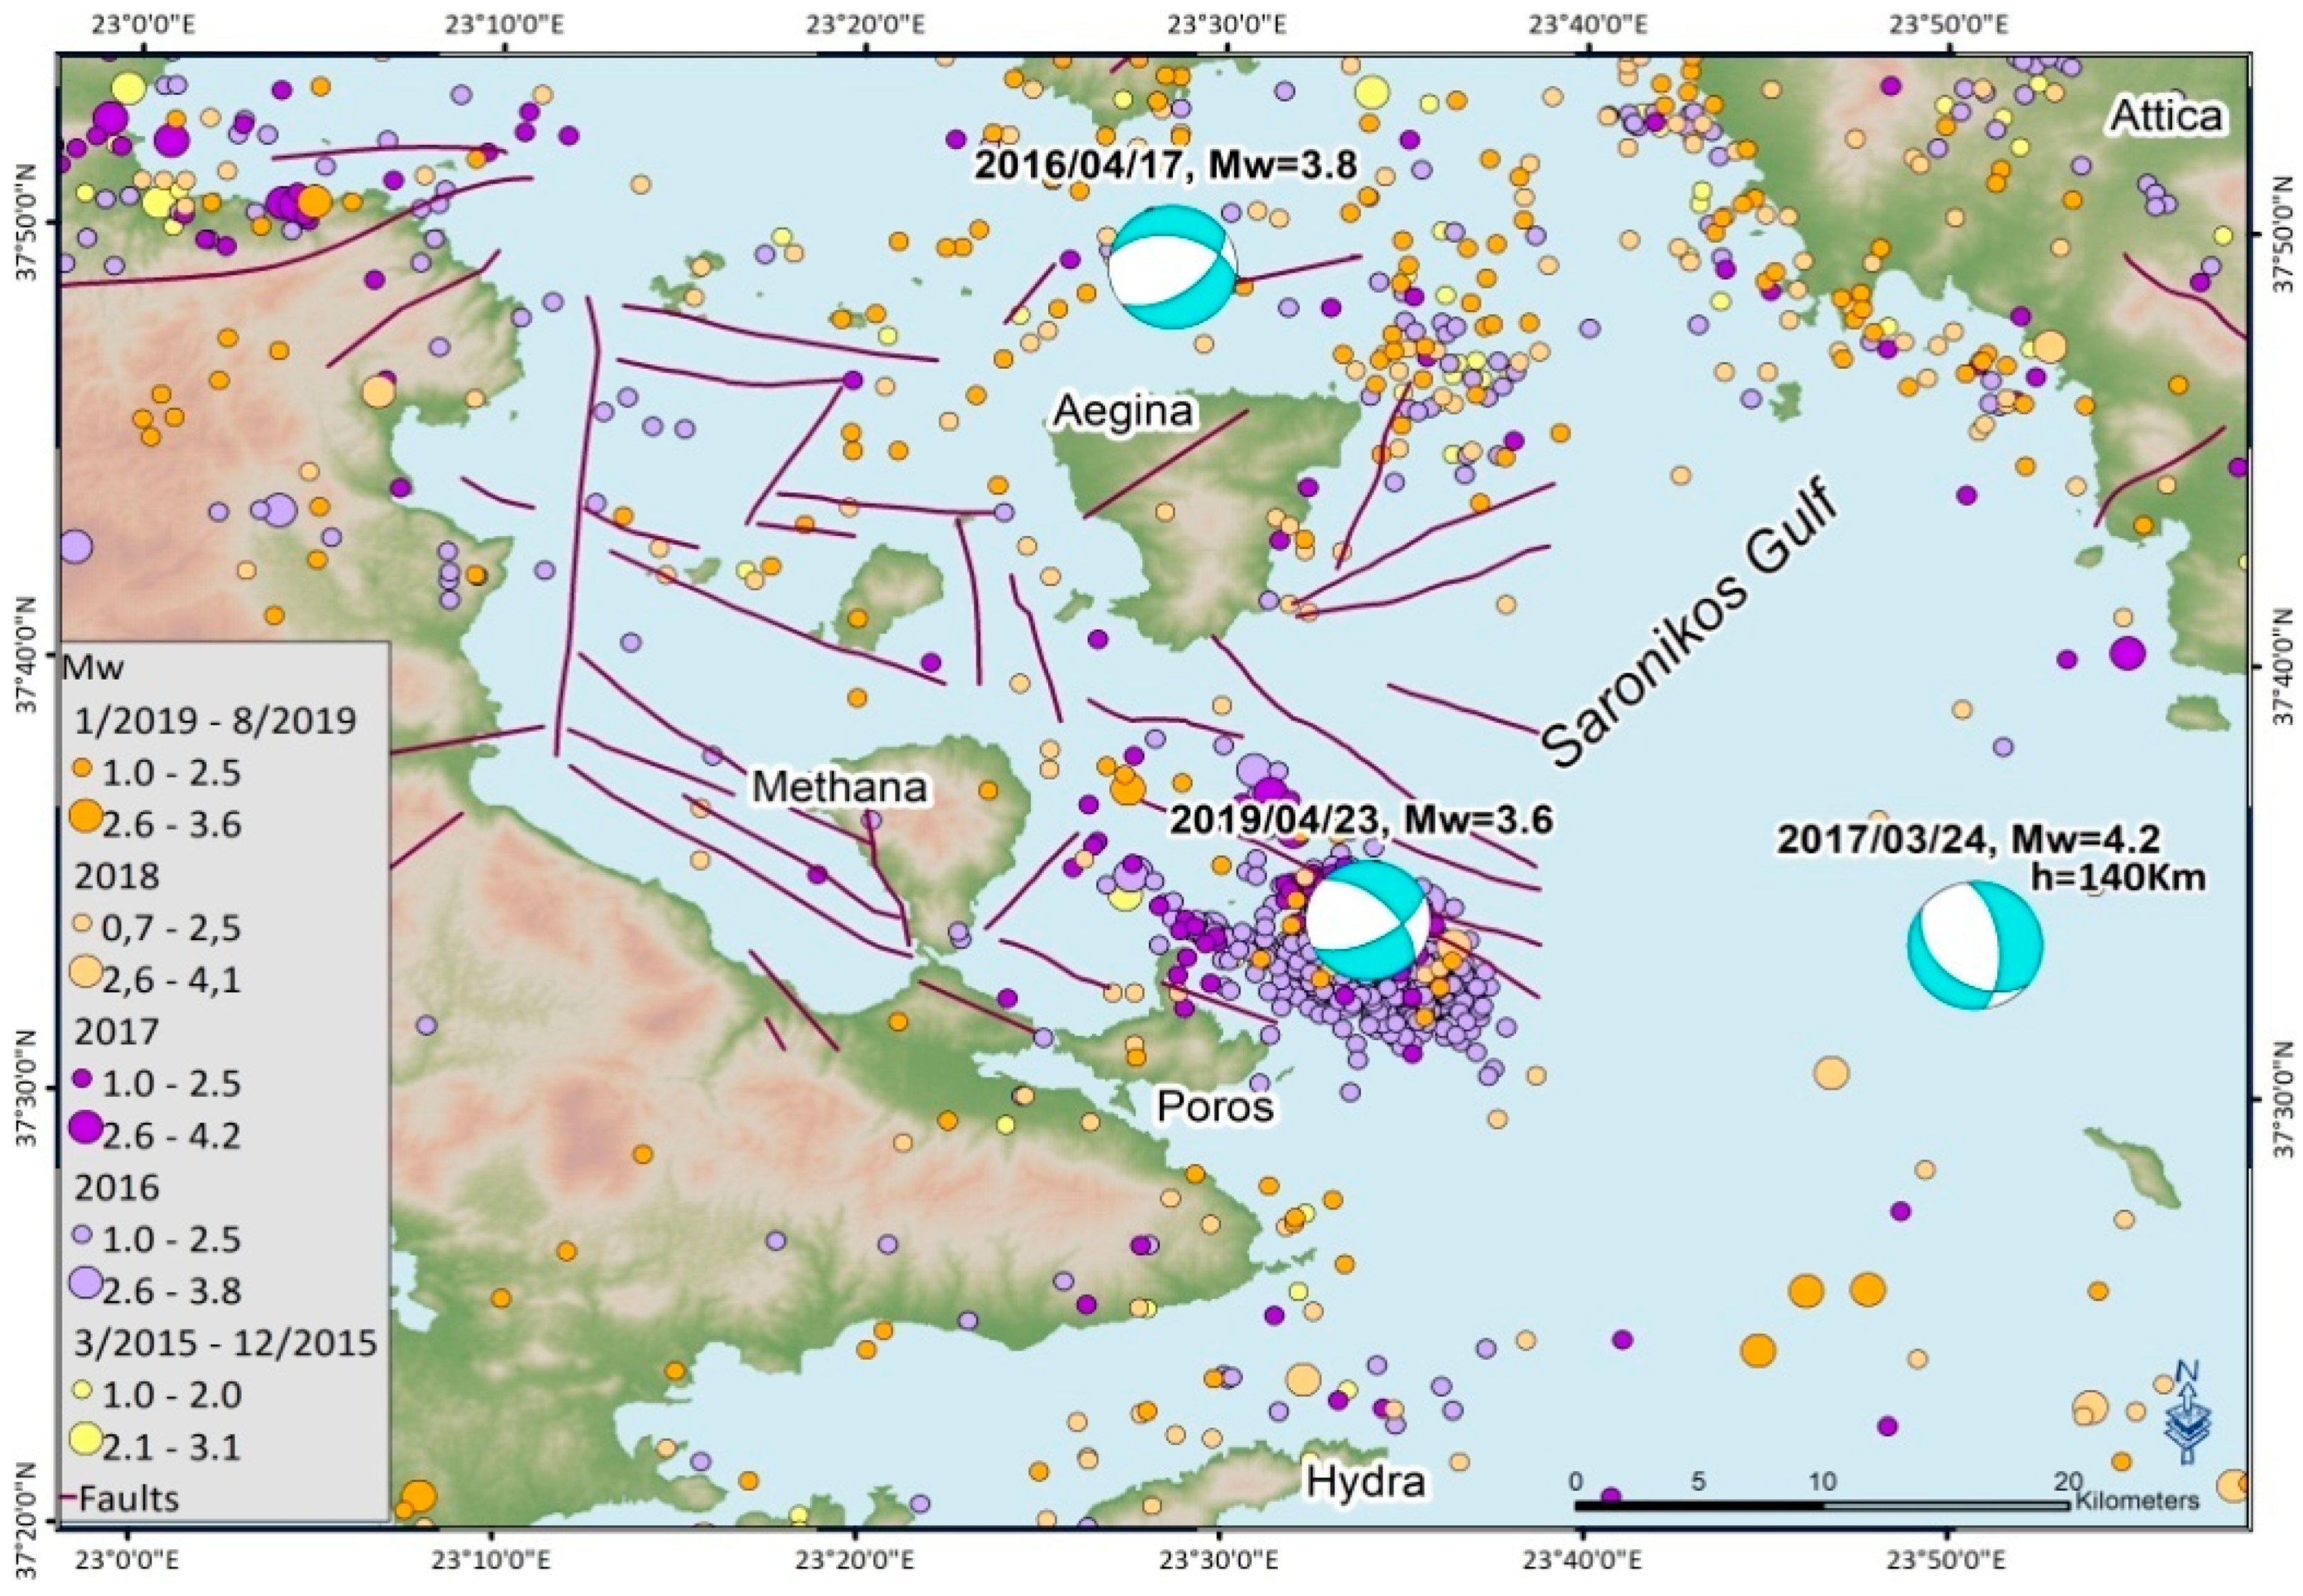
4.2. Observations from the Seismic Data Analysis
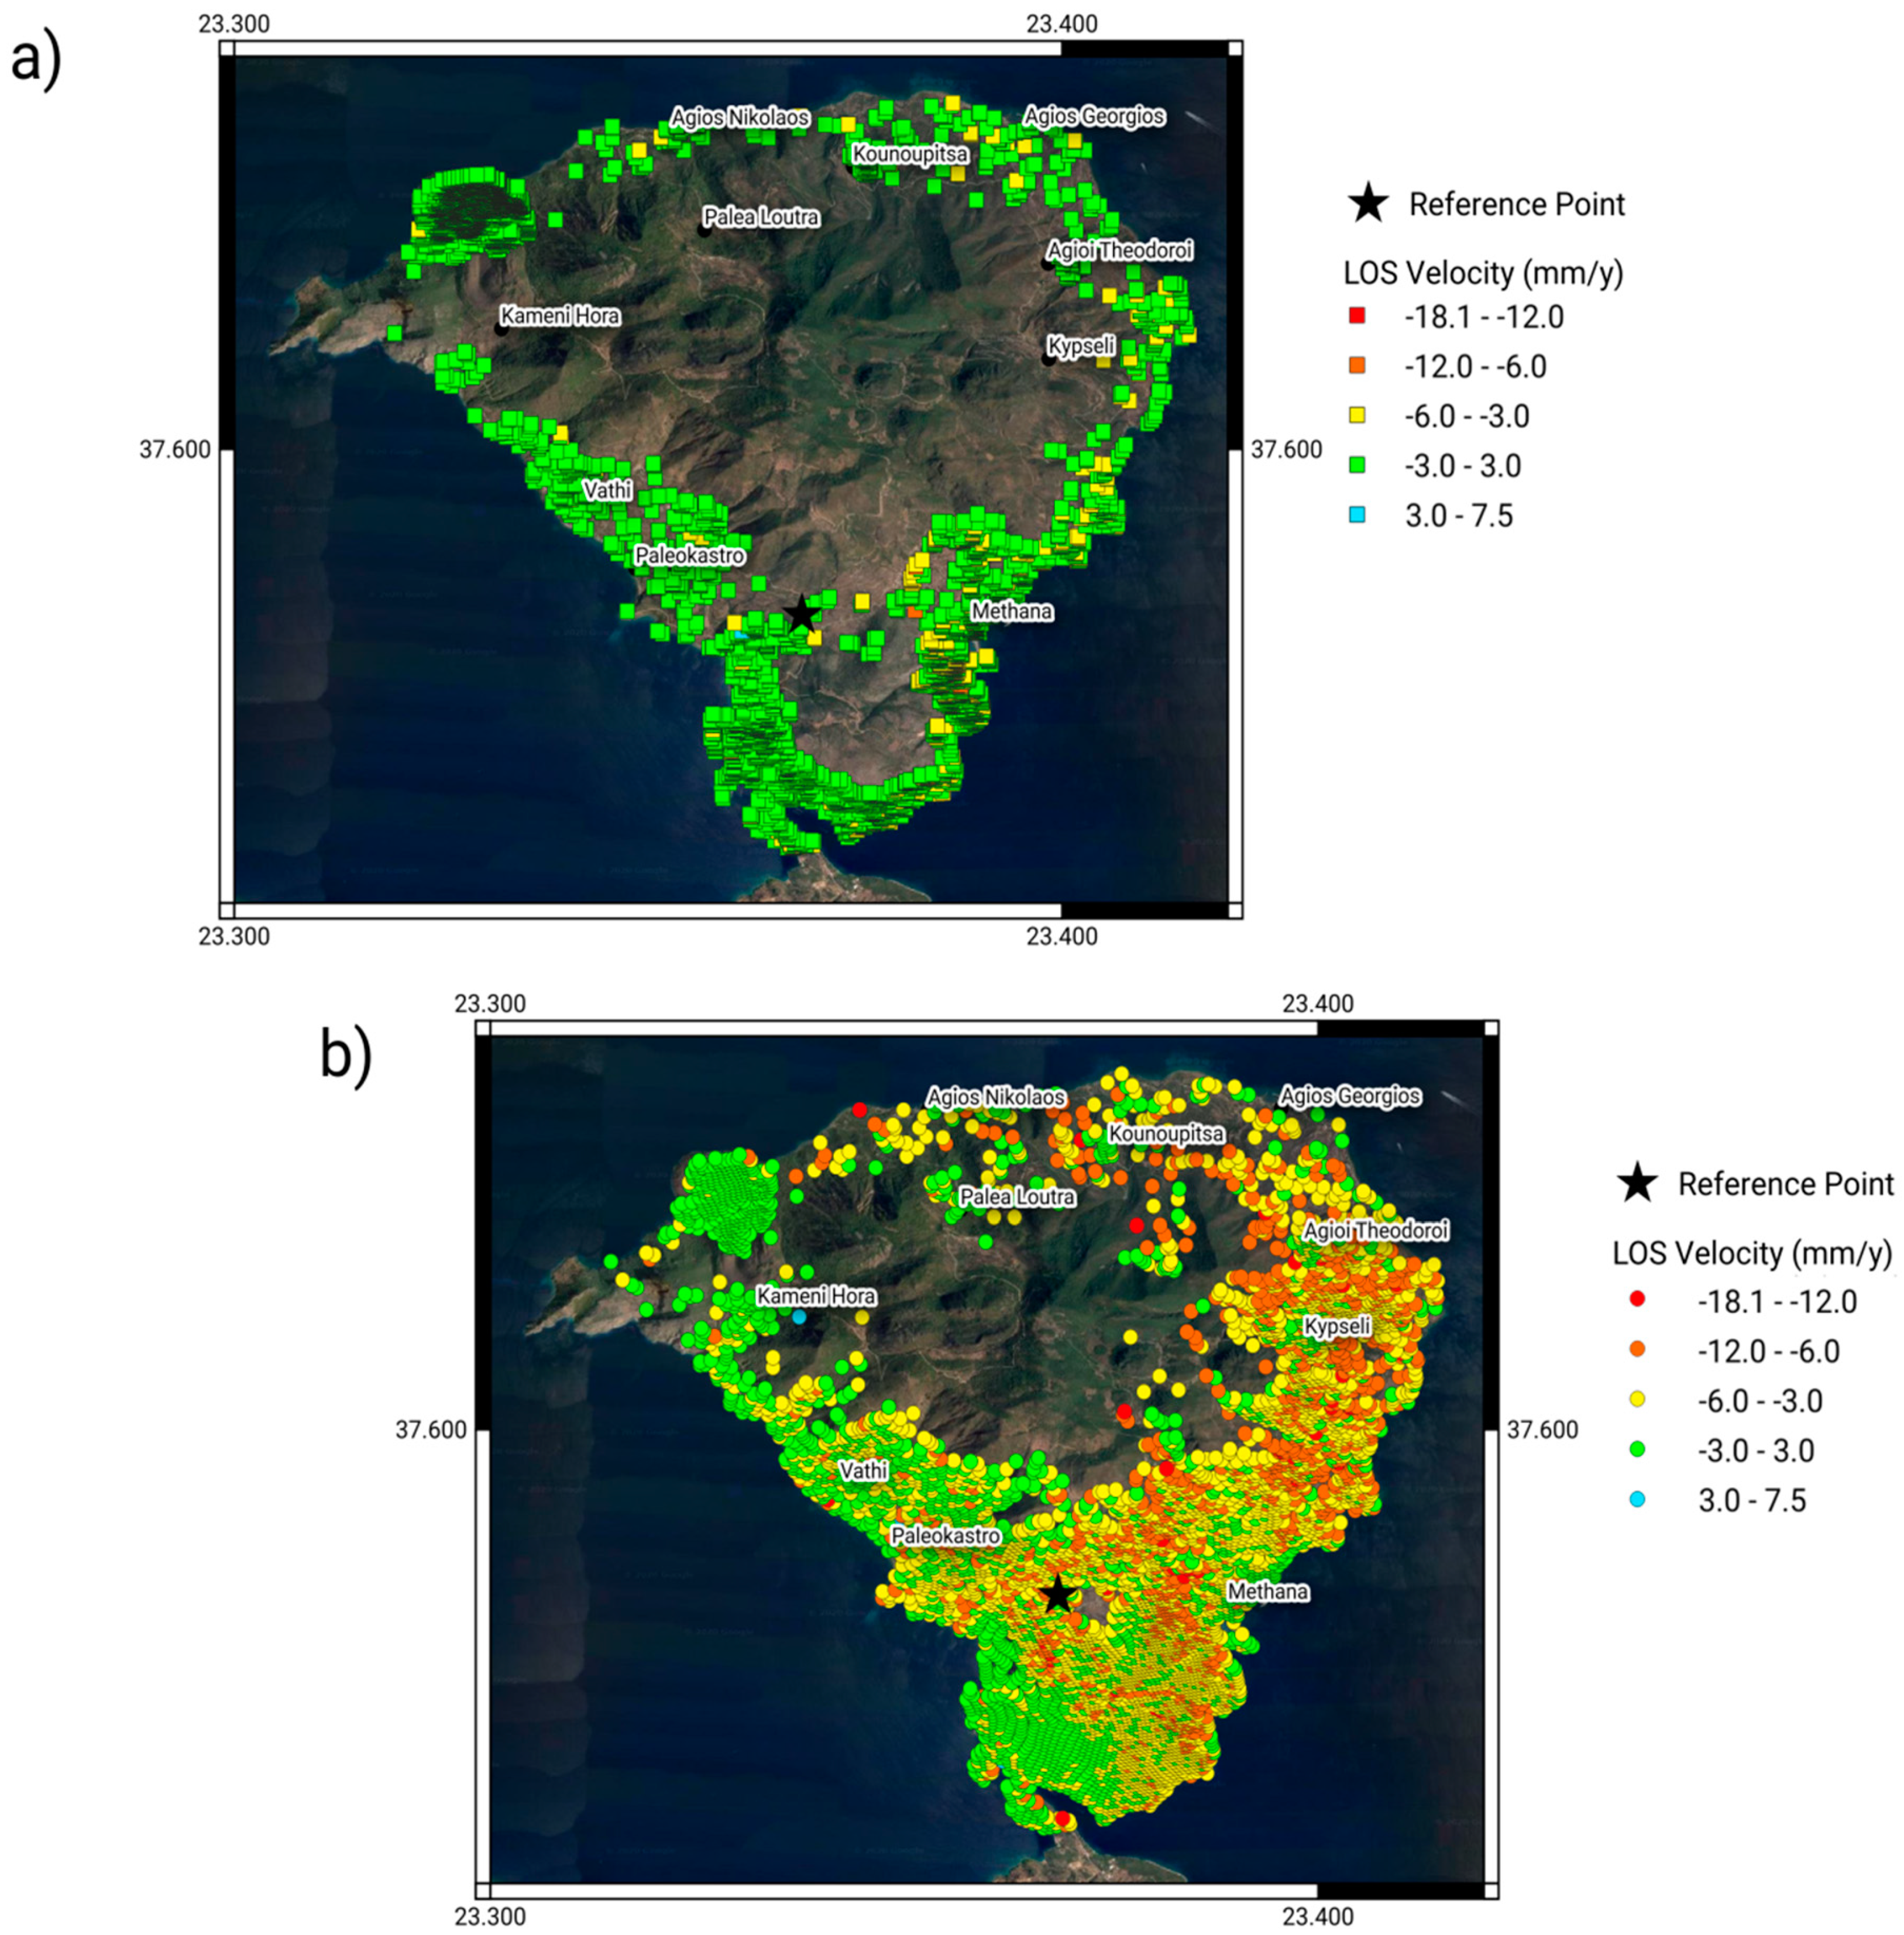
4.3. PS and DS Distribution
4.4. MT-InSAR Data Precision, Calibration and Validation
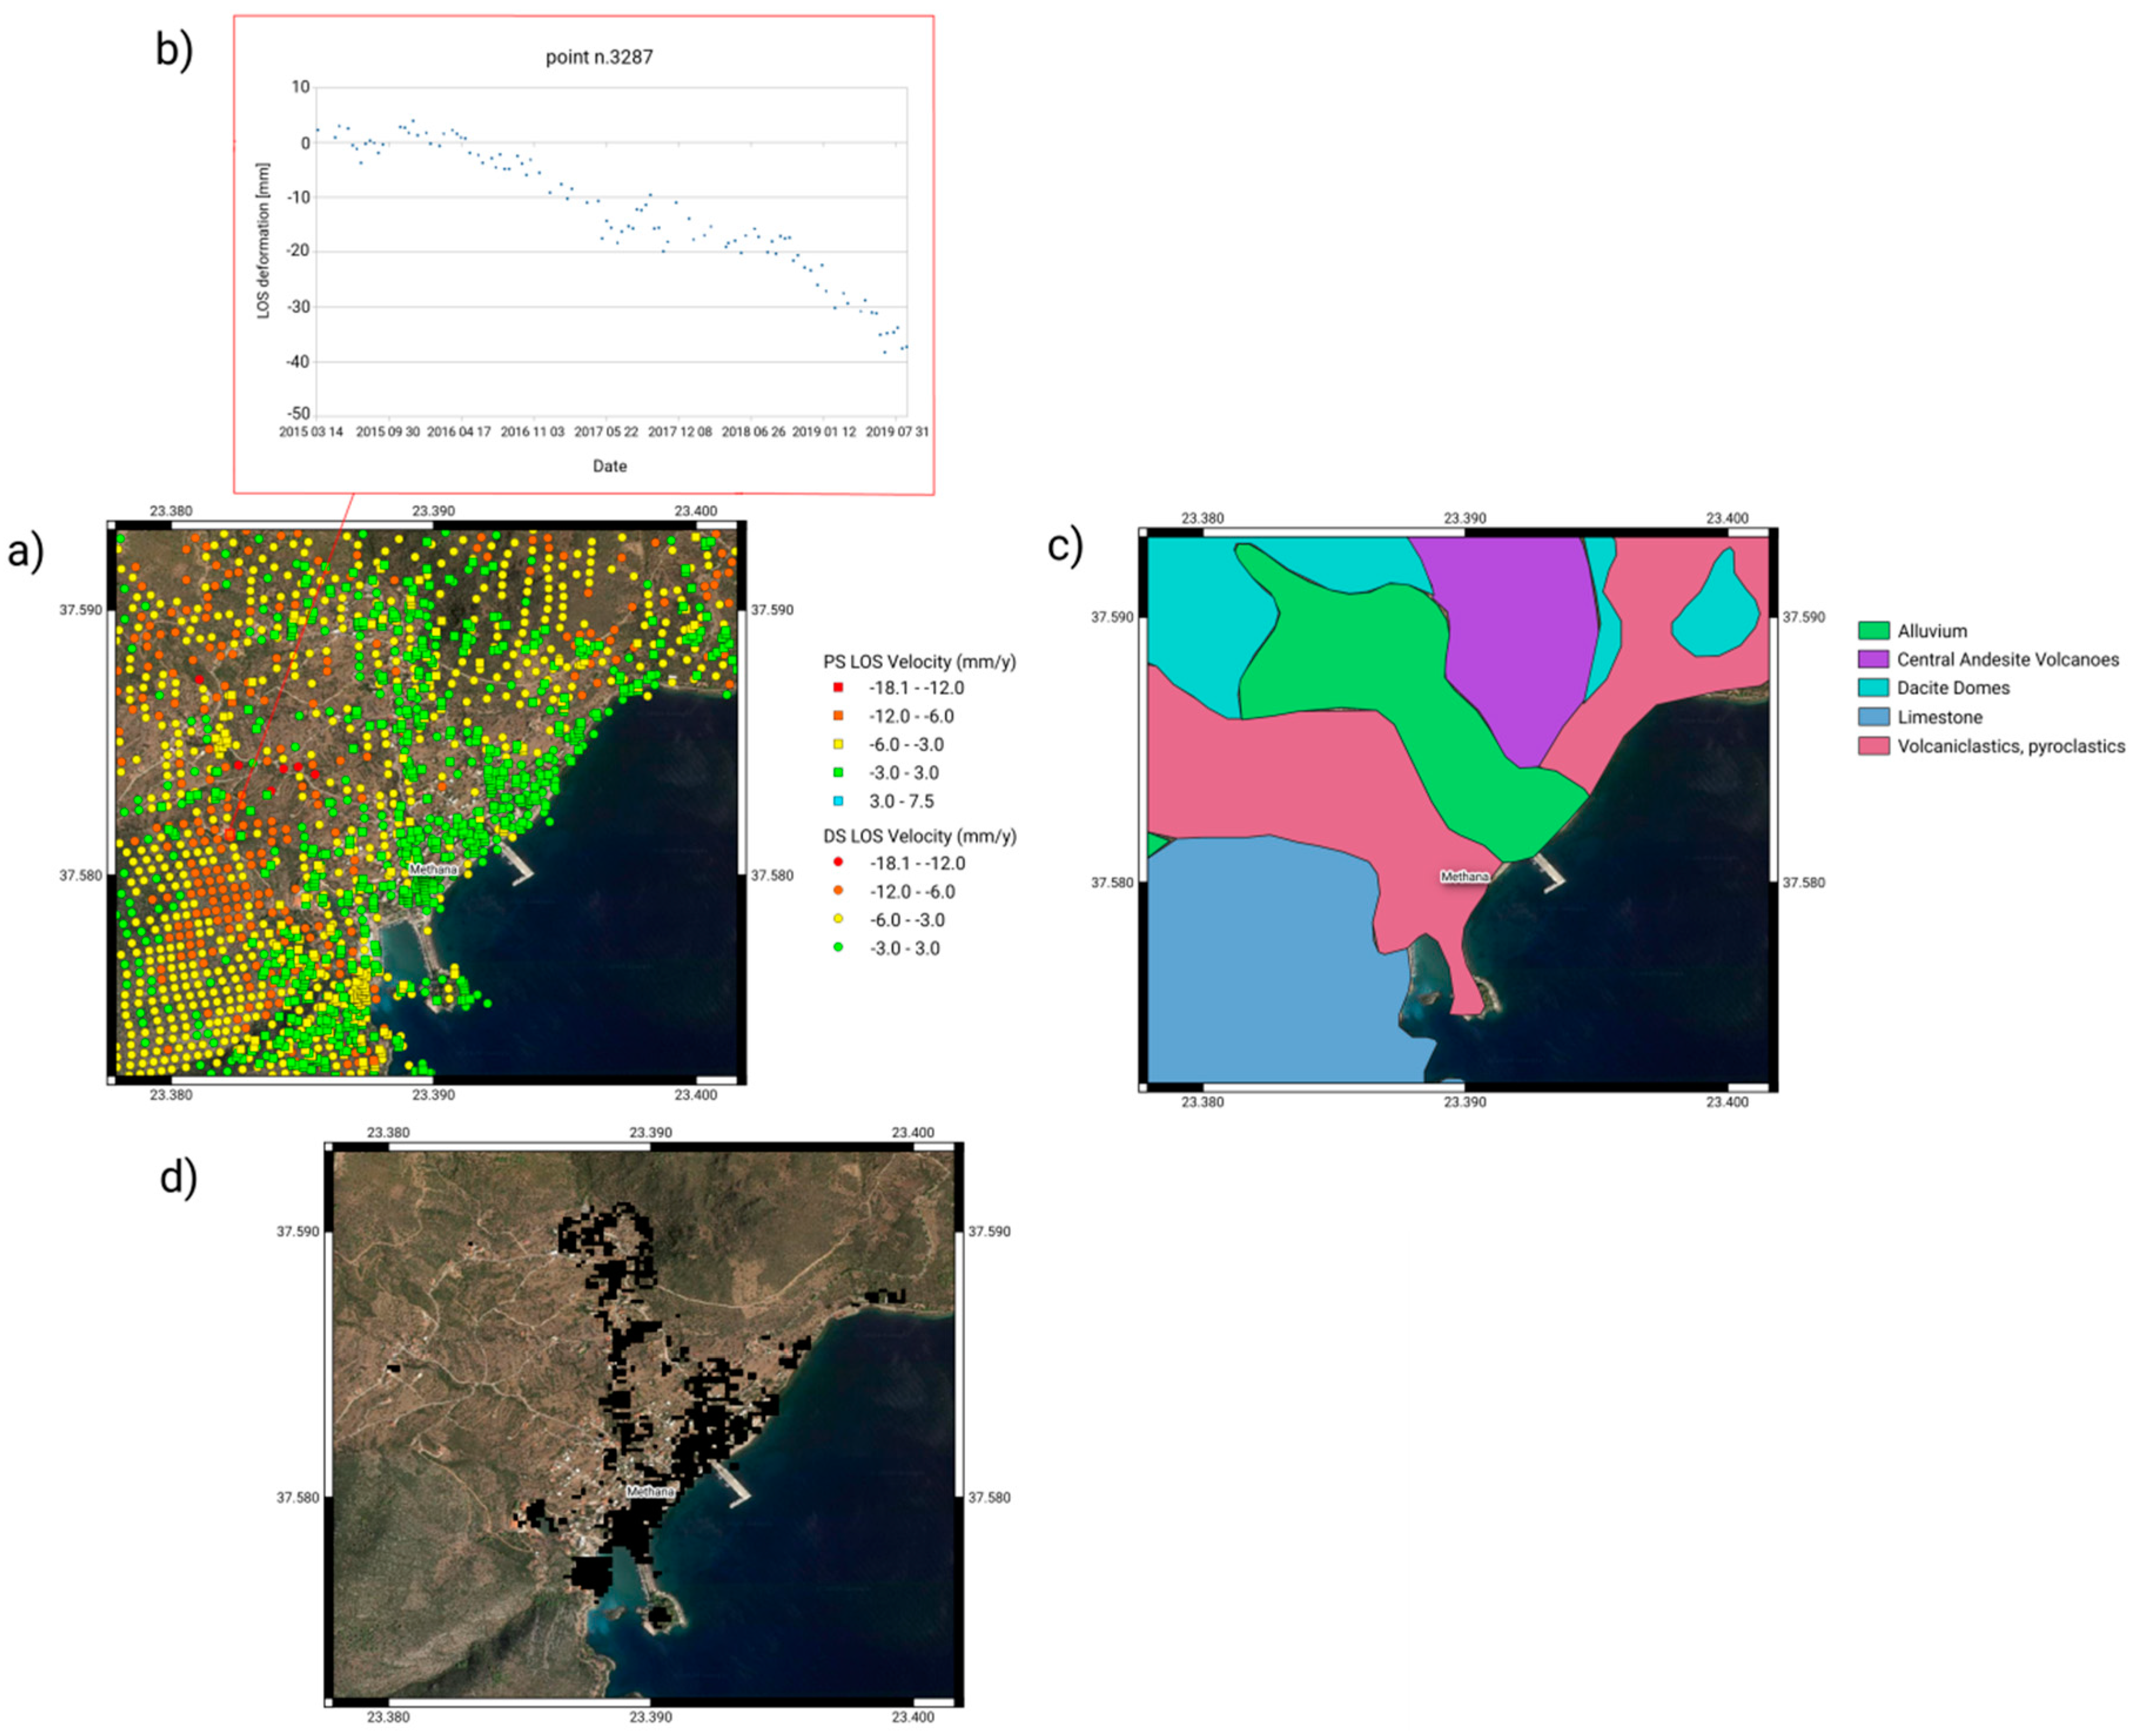
4.5. Interpretation of the Observed Ground Deformation
5. Conclusions
Author Contributions
Funding
Acknowledgments
Conflicts of Interest
Appendix A


References
- Zouros, N. Assessment, protection, and promotion of geomorphological and geological sites in the Aegean area, Greece. Géomorphosites Définition Évaluation Cartogr. 2005, 11, 227–234. [Google Scholar] [CrossRef]
- Kyriakopoulos, K.G. Volcanoes “Monuments of Nature”. In Natural Heritage from East to West: Case Studies from 6 EU Countries; Springer: Berlin/Heidelberg, Germany, 2010; pp. 59–70. ISBN 9783642015762. [Google Scholar]
- D’Alessandro, W.; Brusca, L.; Kyriakopoulos, K.; Michas, G.; Papadakis, G. Methana, the westernmost active volcanic system of the south Aegean arc (Greece): Insight from fluids geochemistry. J. Volcanol. Geotherm. Res. 2008, 178, 818–828. [Google Scholar] [CrossRef]
- Vougioukalakis, G.E.; Fytikas, M. Volcanic hazards in the Aegean area, relative risk evaluation, monitoring and present state of the active volcanic centers. Dev. Volcanol. 2005, 7, 161–183. [Google Scholar] [CrossRef]
- Makris, J.; Papoulia, J.; Drakatos, G. Tectonic deformation and microseismicity of the Saronikos Gulf, Greece. Bull. Seismol. Soc. Am. 2004, 94, 920–929. [Google Scholar] [CrossRef]
- Scientists Decide to Increase Monitoring of Methana Volcano Near Athens|Neos Kosmos. Available online: https://neoskosmos.com/en/130406/scientists-decide-increase-monitoring-of-methana-volcano-near-athens/ (accessed on 14 August 2020).
- NOANET, Station Mtna. Available online: http://geodesy.gein.noa.gr:8000/nginfo/mtna/ (accessed on 14 August 2020).
- Parcharidis, I.; Lagios, E. Deformation in Nisyros volcano (Greece) using differential radar interferometry. Bull. Geol. Soc. Greece 2001, 34, 1587. [Google Scholar] [CrossRef]
- Ganas, A.; Lagios, E.; Dietrich, V.J.; Vassilopoulou, S.; Hurni, L.; Stavrakakis, G. Interferometric Mapping of Ground Deformation in Nissyros Volcano, Aegean Sea, during 1995-1996. In Proceedings of the 6th Pan-Hellenic Geographical Congress, Thessaloniki, Greece, 3–6 October 2002; Volume II, pp. 135–141. [Google Scholar]
- Sachpazi, M.; Kontoes, C.; Voulgaris, N.; Laigle, M.; Vougioukalakis, G.; Sikioti, O.; Stavrakakis, G.; Baskoutas, J.; Kalogeras, J.; Lepine, J.C. Seismological and SAR signature of unrest at Nisyros caldera, Greece. J. Volcanol. Geotherm. Res. 2002, 116, 19–33. [Google Scholar] [CrossRef]
- Parcharidis, I.; Sakkas, V.A.; Ganas, A.; Katopodi, A. A production of Digital Elevation Model (DEM) by means of SAR tandem images in a volcanic landscape and its quality assessment. In Proceedings of the 6th Pan-Hellenic Geographical Conference of the Hellenic Geographical Society, Thessaloniki, Greece, 3–6 October 2002; Volume 2, pp. 201–207. [Google Scholar]
- Sykioti, O.; Kontoes, C.C.; Elias, P.; Briole, P.; Sachpazi, M.; Paradissis, D.; Kotsis, I. Ground deformation at Nisyros volcano (Greece) detected by ERS-2 SAR differential interferometry. Int. J. Remote Sens. 2003, 24, 183–188. [Google Scholar] [CrossRef]
- Parcharidis, I.; Lagios, E.; Sakkas, V. Differential interferometry as a tool of an early warning system in reducing the volcano risk: The case of Nisyros Volcano. In Proceedings of the of the 10th Congress of the Geological Society of Greece, Athens, Greece, 15–17 April 2004; Extended Abstracts. National Documentation Centre: Athina, Greece, 2004; pp. 913–918. [Google Scholar]
- Lagios, E.; Sakkas, V.; Parcharidis, I.; Dietrich, V. Ground deformation of Nisyros Volcano (Greece) for the period 1995–2002: Results from DInSAR and DGPS observations. Bull. Volcanol. 2005, 68, 201–214. [Google Scholar] [CrossRef]
- Mouratidis, A.F.; Tsakiri-Strati, M.; Astaras, T. SAR Interferometry for Geoscience applications in Greece. In The Apple of Knowledge: Volume in Honor of Prof. D. Arabelos; Kaltsikis, C., Kontadakis, M.E., Spatalas, S., Tziavos, I.N., Tokmakidis, K., Eds.; Publication of the School of Rural & Surveying Engineering: Thessaloniki, Greece, 2010; pp. 340–350. [Google Scholar]
- Foumelis, M.; Trasatti, E.; Papageorgiou, E.; Stramondo, S.; Parcharidis, I. Monitoring Santorini volcano (Greece) breathing from space. Geophys. J. Int. 2013, 193, 161–170. [Google Scholar] [CrossRef]
- Papageorgiou, E.; Foumelis, M.; Trasatti, E.; Ventura, G.; Raucoules, D.; Mouratidis, A. Multi-sensor SAR geodetic imaging and modelling of santorini volcano post-unrest response. Remote Sens. 2019, 11, 259. [Google Scholar] [CrossRef]
- Antoniou, V.; Nomikou, P.; Bardouli, P.; Lampridou, D.; Ioannou, T.; Kalisperakis, I.; Stentoumis, C.; Whitworth, M.; Krokos, M.; Ragia, L. An Interactive Story Map for the Methana Volcanic Peninsula. In Proceedings of the 4th International Conference on Geographical Information Systems Theory, Applications and Management (GISTAM 2018), Madeira, Portugal, 17–19 March 2018; Scitepress: Setúbal, Portugal, 2018; pp. 68–78. [Google Scholar]
- Nomikou, P.; Papanikolaou, D.; Alexandri, M.; Sakellariou, D.; Rousakis, G. Submarine volcanoes along the aegean volcanic arc. Tectonophysics 2013, 597–598, 123–146. [Google Scholar] [CrossRef]
- Francalanci, L.; Vougioukalakis, G.E.; Perini, G.; Manetti, P. A West-East Traverse along the magmatism of the south Aegean volcanic arc in the light of volcanological, chemical and isotope data. Dev. Volcanol. 2005, 7, 65–111. [Google Scholar] [CrossRef]
- Pe-Piper, G.; Piper, D.J.W. The effect of changing regional tectonics on an arc volcano: Methana, Greece. J. Volcanol. Geotherm. Res. 2013, 260, 146–163. [Google Scholar] [CrossRef]
- Popa, R.G.; Dietrich, V.J.; Bachmann, O. Effusive-explosive transitions of water-undersaturated magmas. The case study of Methana Volcano, South Aegean Arc. J. Volcanol. Geotherm. Res. 2020, 399, 106884. [Google Scholar] [CrossRef]
- Dotsika, E.; Poutoukis, D.; Raco, B. Fluid geochemistry of the Methana Peninsula and Loutraki geothermal area, Greece. J. Geochem. Explor. 2010, 104, 97–104. [Google Scholar] [CrossRef]
- Pe-Piper, G.; Piper, D.J.W. The Igneous Rocks of Greece: The Anatomy of an Orogen; Gebr. Borntraeger: Stuttgart, Germany, 2002; ISBN 9783443110307. [Google Scholar]
- Papanikolaou, D.; Chronis, G.; Lykousis, V.; Pavlakis, P. Submarine Neotectonic Map of Saronikos Gulf; Earthquake, Planning and Protection Organization of Greece: Thessaloniki, Greece, 1989. [Google Scholar]
- Pavlakis, P.; Lykoussis, V.; Papanikolaou, D.; Chronis, G. Discovery of a new submarine volcano in the western Saronic Gulf: The Paphsanias Volcano. Bull. Hell. Geol. Soc. Greece 1990, XXIV, 59–70. [Google Scholar]
- Fytikas, M.; Innocenti, F.; Kolios, N. The Plio-Quaternary volcanism of Saronikos area (western part of the active part of the Aegean volcanic arc). Ann. Géologiques Pays Helléniques 1988, 33, 23–45. [Google Scholar]
- Armijo, R.; Meyer, B.; King, G.C.P.; Rigo, A.; Papanastassiou, D. Quaternary evolution of the Corinth Rift and its implications for the Late Cenozoic evolution of the Aegean. Geophys. J. Int. 1996, 126, 11–53. [Google Scholar] [CrossRef]
- Makropoulos, K.; Kaviris, G.; Kouskouna, V. An updated and extended earthquake catalogue for Greece and adjacent areas since 1900. Nat. Hazards Earth Syst. Sci. 2012, 12, 1425–1430. [Google Scholar] [CrossRef]
- Dietrich, V.J.; Mercolli, I.; Oberhänsli, R. Dazite, High-Alumina-Basalte und Andesite als Produkte amphiboldominierter Differentation (Aegina und Methan, Ägäischer Inselbogen). Schweiz. Mineral. Petrogr. Mitt. 1988, 68, 21–39. [Google Scholar]
- Gaitanakis, P.; Dietrich, A.D. Geological Map of Methana Peninsula, 1:25 000; Swiss Federal Institute of Technology: Zurich, Switzerland, 1995. [Google Scholar]
- Pe-Piper, G.; Piper, D.J.W. The South Aegean active volcanic arc: Relationships between magmatism and tectonics. Dev. Volcanol. 2005, 7, 113–133. [Google Scholar] [CrossRef]
- Volti, T.K. Magnetotelluric measurements on the Methana Peninsula (Greece): Modelling and interpretation. Tectonophysics 1999, 301, 111–132. [Google Scholar] [CrossRef]
- Curlander, J.C.; Mcdonough, R.N. Synthetic Aperture Radar: Systems and Signal Processing; Wiley: Hoboken, NJ, USA, 1991; ISBN 978-0-471-85770-9. [Google Scholar]
- Torres, R.; Snoeij, P.; Geudtner, D.; Bibby, D.; Davidson, M.; Attema, E.; Potin, P.; Rommen, B.Ö.; Floury, N.; Brown, M.; et al. GMES Sentinel-1 mission. Remote Sens. Environ. 2012, 120, 9–24. [Google Scholar] [CrossRef]
- Berger, M.; Moreno, J.; Johannessen, J.A.; Levelt, P.F.; Hanssen, R.F. ESA’s sentinel missions in support of Earth system science. Remote Sens. Environ. 2012, 120, 84–90. [Google Scholar] [CrossRef]
- Bamler, R.; Hartl, P. Synthetic aperture radar interferometry. Inverse Probl. 1998, 14, R1. [Google Scholar] [CrossRef]
- Rosen, P.A.; Hensley, S.; Joughin, I.R.; Li, F.K.; Madsen, S.N.; Rodriguez, E.; Goldstein, R.M. Synthetic aperture radar interferometry. Proc. IEEE 2000, 88, 333–380. [Google Scholar] [CrossRef]
- Crosetto, M.; Monserrat, O.; Cuevas-González, M.; Devanthéry, N.; Crippa, B. Persistent Scatterer Interferometry: A review. ISPRS J. Photogramm. Remote Sens. 2016, 115, 78–89. [Google Scholar] [CrossRef]
- Amelung, F.; Galloway, D.L.; Bell, J.W.; Zebker, H.A.; Laczniak, R.J. Sensing the ups and downs of Las Vegas: InSAR reveals structural control of land subsidence and aquifer-system deformation. Geology 1999, 27, 483–486. [Google Scholar] [CrossRef]
- Dixon, T.H.; Amelung, F.; Ferretti, A.; Novali, F.; Rocca, F.; Dokka, R.; Sella, G.; Kim, S.W.; Wdowinski, S.; Whitman, D. Space geodesy: Subsidence and flooding in New Orleans. Nature 2006, 441, 587–588. [Google Scholar] [CrossRef]
- Herrera, G.; Davalillo, J.C.; Mulas, J.; Cooksley, G.; Monserrat, O.; Pancioli, V. Mapping and monitoring geomorphological processes in mountainous areas using PSI data: Central Pyrenees case study. Nat. Hazards Earth Syst. Sci. 2009, 9, 1587–1598. [Google Scholar] [CrossRef]
- Cigna, F.; Tapete, D.; Garduño-Monroy, V.H.; Muñiz-Jauregui, J.A.; García-Hernández, O.H.; Jiménez-Haro, A. Wide-area InSAR survey of surface deformation in urban areas and geothermal fields in the eastern Trans-Mexican Volcanic Belt, Mexico. Remote Sens. 2019, 11, 2341. [Google Scholar] [CrossRef]
- Spaans, K.; Hooper, A. InSAR processing for volcano monitoring and other near-real time applications. J. Geophys. Res. Solid Earth 2016, 121, 2947–2960. [Google Scholar] [CrossRef]
- Cigna, F.; Bianchini, S.; Casagli, N. How to assess landslide activity and intensity with Persistent Scatterer Interferometry (PSI): The PSI-based matrix approach. Landslides 2013, 10, 267–283. [Google Scholar] [CrossRef]
- Ferretti, A.; Prati, C.; Rocca, F. Nonlinear subsidence rate estimation using permanent scatterers in differential SAR interferometry. IEEE Trans. Geosci. Remote Sens. 2000, 38, 2202–2212. [Google Scholar] [CrossRef]
- Ferretti, A.; Prati, C.; Rocca, F. Permanent scatterers in SAR interferometry. IEEE Trans. Geosci. Remote Sens. 2001, 39, 8–20. [Google Scholar] [CrossRef]
- Berardino, P.; Fornaro, G.; Lanari, R.; Sansosti, E. A new algorithm for surface deformation monitoring based on small baseline differential SAR interferograms. IEEE Trans. Geosci. Remote Sens. 2002, 40, 2375–2383. [Google Scholar] [CrossRef]
- Ferretti, A.; Fumagalli, A.; Novali, F.; Prati, C.; Rocca, F.; Rucci, A. A new algorithm for processing interferometric data-stacks: SqueeSAR. IEEE Trans. Geosci. Remote Sens. 2011, 49, 3460–3470. [Google Scholar] [CrossRef]
- Shamshiri, R.; Nahavandchi, H.; Motagh, M.; Hooper, A. Efficient Ground Surface Displacement Monitoring Using Sentinel-1 Data: Integrating Distributed Scatterers (DS) Identified Using Two-Sample t-Test with Persistent Scatterers (PS). Remote Sens. 2018, 10, 794. [Google Scholar] [CrossRef]
- Cigna, F.; Sowter, A. The relationship between intermittent coherence and precision of ISBAS InSAR ground motion velocities: ERS-1/2 case studies in the UK. Remote Sens. Environ. 2017, 202, 177–198. [Google Scholar] [CrossRef]
- Werner, C.; Wegmüller, U.; Strozzi, T.; Wiesmann, A. Interferometric Point Target Analysis for Deformation Mapping. In Proceedings of the International Geoscience and Remote Sensing Symposium (IGARSS), Toulouse, France, 21–25 July 2003; Volume 7, pp. 4362–4364. [Google Scholar]
- Farr, T.G.; Rosen, P.A.; Caro, E.; Crippen, R.; Duren, R.; Hensley, S.; Kobrick, M.; Paller, M.; Rodriguez, E.; Roth, L.; et al. The shuttle radar topography mission. Rev. Geophys. 2007, 45, RG2004. [Google Scholar] [CrossRef]
- Papageorgiou, E. Crustal movements along the NW Hellenic volcanic arc from DGPS measurements. Bull. Geol. Soc. Greece 2010, 43, 331. [Google Scholar] [CrossRef]
- Chousianitis, K.; Ganas, A.; Gianniou, M. Kinematic interpretation of present-day crustal deformation in central Greece from continuous GPS measurements. J. Geodyn. 2013, 71, 1–13. [Google Scholar] [CrossRef]
- Dach, R.; Lutz, S.; Walser, P.; Fridez, P. Bernese GNSS Software Version 5.2; User Manual; Astronomical Institute, University of Bern, Bern Open Publishing: Bern, Switzerland, 2015. [Google Scholar]
- Ray, R.D.; Ponte, R.M. Barometric tides from ECMWF operational analyses. Ann. Geophys. 2003, 21, 1897–1910. [Google Scholar] [CrossRef]
- Klein, F.W. User’s Guide to HYPOINVERSE, a Program for VAX Computers to Solve for Earthquake Locations and Magnitudes; U.S. Geological Survey: Menlo Park, CA, USA, 1989. [Google Scholar]
- Karakonstantis, A.; Papadimitriou, P.; Millas, C.; Spingos, I.; Fountoulakis, I.; Kaviris, G. Tomographic imaging of the NW edge of the Hellenic volcanic arc. J. Seismol. 2019, 23, 995–1016. [Google Scholar] [CrossRef]
- Papanikolaou, D.; Lykousis, V.; Chronis, G.; Pavlakis, P. A comparative study of neotectonic basins across the Hellenic arc: The Messiniakos, Argolikos, Saronikos and Southern Evoikos Gulfs. Basin Res. 1988, 1, 167–176. [Google Scholar] [CrossRef]
- Bateson, L.; Cuevas, M.; Crosetto, M.; Cigna, F.; Schijf, M.; Evans, H. PANGEO: Enabling Access to Geological Information in Support of GMES: Deliverable 3.5 Production Manual. Version 1; European Commission: Brussels, Belgium, 2012. [Google Scholar]
- Climate-Data.org Methana Climate: Average Temperature, Weather by Month, Methana Water Temperature—Climate-Data.org. Available online: https://en.climate-data.org/europe/greece/methana/methana-27566/ (accessed on 18 August 2020).
- Berti, M.; Corsini, A.; Franceschini, S.; Iannacone, J.P. Automated classification of Persistent Scatterers Interferometry time series. Nat. Hazards Earth Syst. Sci. 2013, 13, 1945–1958. [Google Scholar] [CrossRef]
- Tzanis, A.; Efstathiou, A.; Chailas, S.; Lagios, E.; Stamatakis, M. The Methana Volcano—Geothermal Resource, Greece, and its relationship to regional tectonics. J. Volcanol. Geotherm. Res. 2020, 404, 107035. [Google Scholar] [CrossRef]
- Wessel, P.; Smith, W.H.F. New, improved version of Generic Mapping Tools released. EOS Trans AGU 1998, 79, 579. [Google Scholar] [CrossRef]


| Station | VE (mm/year) | VN (mm/year) | VU (mm/year) | STDVE (mm/year) | STDVN (mm/year) | STDVU (mm/year) |
|---|---|---|---|---|---|---|
| LYGO | 6.99 | −12.97 | −0.76 | 0.05 | 0.07 | 0.08 |
| MTNA | 7.02 | 3.35 | 4.88 | 1.26 | 1.76 | 6.37 |
| MENO | 6.50 | −12.89 | −0.21 | 0.21 | 0.33 | 0.30 |
| MESO | 7.02 | −12.77 | −5.24 | 0.15 | 0.08 | 1.12 |
| METH * | 6.77 | −12.51 | − | 0.45 | 0.44 | − |
| 010A * | 7.41 | −13.01 | − | 0.43 | 0.44 | − |
| Station | VE (mm/year) | VN (mm/year) | VU (mm/year) | STDVE (mm/year) | STDVN (mm/year) | STDVU (mm/year) |
|---|---|---|---|---|---|---|
| LYGO | − | − | − | |||
| MENO | −0.49 | 0.08 | 0.55 | 0.216 | 0.337 | 0.311 |
| MESO | 0.03 | 0.2 | −4.48 | 0.158 | 0.106 | 1.123 |
| METH * | −0.22 | 0.46 | − | 0.453 | 0.435 | |
| 010A * | 0.42 | −0.04 | − | 0.433 | 0.445 |
| Euler Angle | Degrees | Physical Interpretation |
|---|---|---|
| ωx | 0 | − |
| ωy | −37.1 | Incidence angle |
| ωz | 11 | Declination from the north (azimuth) |
© 2020 by the authors. Licensee MDPI, Basel, Switzerland. This article is an open access article distributed under the terms and conditions of the Creative Commons Attribution (CC BY) license (http://creativecommons.org/licenses/by/4.0/).
Share and Cite
Gatsios, T.; Cigna, F.; Tapete, D.; Sakkas, V.; Pavlou, K.; Parcharidis, I. Copernicus Sentinel-1 MT-InSAR, GNSS and Seismic Monitoring of Deformation Patterns and Trends at the Methana Volcano, Greece. Appl. Sci. 2020, 10, 6445. https://doi.org/10.3390/app10186445
Gatsios T, Cigna F, Tapete D, Sakkas V, Pavlou K, Parcharidis I. Copernicus Sentinel-1 MT-InSAR, GNSS and Seismic Monitoring of Deformation Patterns and Trends at the Methana Volcano, Greece. Applied Sciences. 2020; 10(18):6445. https://doi.org/10.3390/app10186445
Chicago/Turabian StyleGatsios, Theodoros, Francesca Cigna, Deodato Tapete, Vassilis Sakkas, Kyriaki Pavlou, and Issaak Parcharidis. 2020. "Copernicus Sentinel-1 MT-InSAR, GNSS and Seismic Monitoring of Deformation Patterns and Trends at the Methana Volcano, Greece" Applied Sciences 10, no. 18: 6445. https://doi.org/10.3390/app10186445
APA StyleGatsios, T., Cigna, F., Tapete, D., Sakkas, V., Pavlou, K., & Parcharidis, I. (2020). Copernicus Sentinel-1 MT-InSAR, GNSS and Seismic Monitoring of Deformation Patterns and Trends at the Methana Volcano, Greece. Applied Sciences, 10(18), 6445. https://doi.org/10.3390/app10186445