Article

Evaluation of Phenolic Compounds and Carotenoids Content and Mycotoxins Occurrence in Grains of Seventeen Barley and Eight Oat Cultivars Grown under Organic Management

by
Renata Kazimierczak
1,
Dominika Średnicka-Tober
1,*,
Danuta Leszczyńska
2,*,
Anna Nowacka
3,
Ewelina Hallmann
1,
Marcin Barański
1,
Klaudia Kopczyńska
1 and
Bogusław Gnusowski
3
1
Department of Functional and Organic Food, Institute of Human Nutrition Sciences, Warsaw University of Life Sciences, Nowoursynowska 159c, 02-776 Warsaw, Poland
2
Department of Cereal Crop Production, Institute of Soil Science and Plant Cultivation–State Research Institute, Czartoryskich 8, 24-100 Puławy, Poland
3
Institute of Plant Protection–National Research Institute, Władysława Węgorka 20, 60-318 Poznań, Poland
*
Authors to whom correspondence should be addressed.
Appl. Sci. 2020, 10(18), 6369; https://doi.org/10.3390/app10186369
Submission received: 9 August 2020 / Revised: 8 September 2020 / Accepted: 9 September 2020 / Published: 12 September 2020
(This article belongs to the Special Issue Organic Food)

Abstract

:

Featured Application

The commercial offer of organic seeds on the market is limited and does not guarantee the selection of the appropriate cultivar. In this situation, cultivars available in the general offer of breeding companies and included in the register of agricultural plant cultivars in Poland are selected for cultivation on organic farms. Research carried out by the Research Centre for Cultivar Testing in Poland (COBORU) and recommendations of breeding companies do not take into account the evaluation of cultivars in the conditions of organic production, which hinders the correct selection and increases the risk of cultivation. Thus, our research provides important data contributing to the assessment of suitability of cultivars of two cereal species for cultivation in organic production conditions. The evaluation of a number of barley and oat cultivars produced in the organic system carried out in our experiment meets the expectations of producers, who can thus obtain valuable information on selected quality and safety features of individual cultivars, including the content of bioactive compounds, such as polyphenols and carotenoids, and the presence of mycotoxins in the grain. The results of the presented research on 17 barley and 8 oat cultivars may enable the organic producers to select cultivars characterized by high quality features, which are also expected by consumers, who increasingly search for high quality organic foods. Moreover, these results may be a premise for further research towards developing seed production aimed at organic producers.

Abstract

In recent decades, organic farming based on natural means and methods of production is gaining more and more popularity. It is due to the growing awareness of the society regarding the harmfulness of chemicals used in intensive agriculture, which influences the growing interest of both producers and consumers in organic food. Searching for plant cultivars performing best under organic management in terms of crop quality is one of the important research topics of the recent years. The aim of the present study was therefore to compare 8 oat and 17 barley cultivars grown in identical organic production conditions in terms of polyphenols and carotenoids contents and the mycotoxins contamination in grains. The analyses of bioactive compounds were performed using HPLC and the mycotoxins occurrence using LC-MS/MS methods. Among the barley cultivars studied, the grains of SU Lolek, Rubaszek and Podarek accumulated the highest content of polyphenols. Grain of Soldo cultivar was richest in carotenoids, but at the same time most of the mycotoxins identified within the study were found in the grains of this cultivar. In the case of oat, the highest content of polyphenols was found in the grain of Harnaś, Nawigator and Arden cultivars, while Pascal and Amant grain was richest in carotenoids. Among all the oat cultivars tested, only Amant grain was free from the studied mycotoxins. These findings are important for producers as well as consumers, who search for quality organic foods.

1. Introduction

Both barley and oat are valuable resources in several countries and belong to the commonly cultivated crops worldwide, ranking fourth and seventh among cereal grains. According to FAO statistics, among the cereal crops grown in Europe, wheat production is on the top, followed by barley, with oat in fourth place. The top producers of oat in 2018 were Spain, Poland and Finland, whereas the biggest producers of barley were France, Germany and Spain [1].
The use of barley and oat for human nutrition is particularly important, since both are a source of starch, proteins, lipids, dietary fiber, B vitamins and phytochemicals with antioxidant activities, such as polyphenols, vitamin E and carotenoids [2,3,4]. In addition, oat grains contain avenanthramides, also known for their antioxidant activity [4].
Oat and barley are consumed in lower quantities compared to rice or wheat, but they are also rich sources of fiber, minerals, vitamins and other bioactive compounds, which may provide health benefits, such as a reduced risk of chronic diseases such as coronary heart disease, type 2 diabetes or cancers [2].
Among bioactive compounds occurring in oat and barley, phenolics, in that phenolic acids and flavonoids, gain significant attention, mainly due to their antiradical activities [5]. Phenolics are plant secondary metabolites, playing essential roles in the reproduction and growth of the plants and having important functions in defense mechanisms against pathogens and pests. Some of them also contribute to the color of plants [2,6]. In addition to their roles in plants, phenolic compounds in human diet may also provide significant health benefits. They show the ability to inhibit cancer development due to various mechanisms (antioxidant activity involving reactive oxygen species, gene expression, enzyme modulation and apoptosis). Furthermore, polyphenols have protective effects against heart diseases, by protecting LDL against oxidation [7].
From the group of phenolic acids, cereal grains contain hydroxybenzoic acids (p-hydroxybenzoic, vanillic, salicylic, gallic, ellagic and protocatechuic) and hydroxycinnamic acids (caffeic, ferulic, sinapic and p-coumaric). Ferulic and p-coumaric acid are the predominant phenolic acids in cereal grains. As reported in [8], ferulic acid is the main contributor to the antioxidant capacity of grains, which has been confirmed in the in vitro study showing that antioxidant potential of cereals is correlated with their ferulic acid content. The highest concentrations of the phenolic acids in cereals are found in whole grains and bran [6,8].
Flavonoids are present in very small quantities in cereal grains. They are found mainly in the seed coat, aleurone cells, hull (oat) and sometimes the embryo. Barley contains higher amounts of flavonoids than oat. Flavonoids are compounds of diverse structure. They show a strong antioxidant effect due to the ability to bind metal ions [9]. The content of both phenolic acids and flavonoids in cereal grains varies and depends on climatic and agrotechnical conditions, harvesting time, maturity and storage conditions. Genetic factors and species diversity of plants as well as part of the grain belong also to the very important factors [6].
The phytochemicals responsible for the characteristic yellow color of cereal grains are carotenoids. In plants, carotenoids have various functions related to the photosynthesis, photoprotection and they are precursors of phytohormones [10]. They act as powerful antioxidants in many biological systems, due to their ability to react with free radicals. Carotenoids have powerful activity against singlet oxygen generated from lipid peroxidation or radiation. β-carotene, α-carotene and β-cryptoxanthin show a provitamin A activity. One of the main pigments of cereal grains, lutein, together with zeaxanthin is accumulated in yellow spot of the retina in human eye, where it absorbs UV radiation and protects the eye from damage [6]. Carotenoids occur in small amounts in all anatomical parts of the caryopses, mainly in embryos, and cereals are a good source of them [8].
Besides the beneficial components, cereals may contain undesirable compounds, such as mycotoxins, which can be very harmful for human health [11]. The most common mycotoxin producing fungi found on cereals belong to the genera Fusarium, Aspergillus and Penicillium. The most important mycotoxins, with increasing occurrence in cereal grains in recent years, are trichothecenes such as deoxynivalenol (DON), T-2 toxin and HT-2 toxin, zearalenone (ZEN) and fumonisins [12,13]. As reported by Hietaniemi et al. [14], DON, T-2 toxin, HT-2 toxin and ZEN occur very often in cereal crops cultivated in northern temperate regions. DON is the most frequently found contaminant of oat, barley, wheat and corn throughout the world. While the type A trichothecenes (T-2 toxin, HT-2 toxin, diacetoxyscirpenol (DAS) and neosolaniol) show acute toxicity at low doses, type B trichothecenes (DON and NIV (nivalenol)) are associated with more chronic toxicity. During improper storage of cereals, ochratoxin A (OTA) and aflatoxins are produced in grain by fungi of the Aspergillus and Penicillium genera. The toxic effect of mycotoxins on animals is manifested by growth inhibition and reproductive, immune and digestive disorders. OTA, a toxin most frequently found in cereals cultivated in the temperate climate zone, is potentially carcinogenic to humans [12,13,15]. Aflatoxins are also known for their mutagenicity and carcinogenicity, although the mechanisms of their actions remain to be elucidated [16]. The risk of mycotoxins occurrence in cereals and cereal-based products can be reduced by selecting cultivars that show resistance to fungal infestation, appropriate cultivation of the soil and applying proper care treatments during the growing season. Some of the currently available varieties provide better fungi resistance than others, but they may react differently under different growing and post-harvest conditions. In organic farming, there is a strong emphasis on cultivation procedures following the requirements of good agricultural practice, thus protecting crops against the possibility of being infested by mycotoxins producing fungi. A well-managed organic production system, through the use of diverse crop rotations, non-use of synthetic pesticides in plant protection and the appropriate fertilization management (without mineral nitrogen fertilizers), prevents the occurrence of mycotoxins related to the production [17,18,19,20]. Organic agronomic systems compared to the conventional, more intensive practices, are often reported to provide crops richer in bioactive compounds such as polyphenols and carotenoids [21,22,23], which is known to be associated with a lower nitrogen availability as well as natural defense mechanisms of plants in the organic system [24]. However, there are also studies which do not confirm the above described effect of the agronomic system on bioactive compounds concentrations in crops, including cereal grains [25].
As the necessity for finding the best cultivars of plants for organic production is still a very important topic, the aim of this study was to investigate selected quality and safety features (phenolics and carotenoids concentrations and mycotoxin occurrence) of a number of oat and barley cultivars grown organically in a controlled field trial. Barley and oat produced in Poland is currently intended for animal feeds and malt, but also for human consumption. Therefore, the presented research on the bioactive compounds profiles and mycotoxin contamination in these cereals’ grain may be of interest especially to the producers to enable them to select cultivars characterized by high quality values, which are also expected by the consumers. Moreover, these results may be a premise for further research towards developing seed production aimed at organic producers. All the cultivars tested in the study are on the list of cultivars recommended for cultivation in Poland by the Research Centre for Cultivar Testing.

2. Materials and Methods

2.1. Field Experiment

The field experiment was carried out at the experimental Organic Farm in Chwałowice (Iłża Municipality, Radom County, Masovia Region, Poland), which belongs to the Agricultural Advisory Center in Brwinów, Radom, Poland (51°18′ N, 21°30′ E). The field trial was set up as a split block design with three replications, on brown soil. Neither pest nor disease and weed control was applied in the trial. Organic fertilization of the plots in the form of compost was applied, in the amount of 60 dt ha−1.
Investigations were carried out on 17 spring barley cultivars (Hordeum vulgare L.: Natasia, SU Lolek, Britney, Ella, KWS Dante, KWS Atrika, Olimpic, Rubaszek, Oberek, Baryłka, Tocada, Podarek, Soldo, Penguin, Fabienne, Fariba and Argento) and 8 oat cultivars (Avena sativa L.: Harnaś, Haker, Arden, Bingo, Nawigator, Krezus, Pascal and Amant). The cultivars were selected from the Polish National List of Agricultural Plant Varieties. The performance of cultivars registered on the National List was previously tested by The Research Centre for Cultivar Testing (COBORU) at average and intensive level of agrotechnics. For our experiment, we selected cultivars recommended for average level of agrotechnics based on their performance in terms of yielding and disease resistance.
Weather conditions during the development stage of plants are shown in Table 1. In May, the precipitation was found to be higher than the multiannual average. From June to August, a deepening drought occurred, with temperatures higher than the multiannual average.
The grains of barley and oat cultivars were harvested at the stage of full maturity. The grain samples (500 g each) after collection (2015 harvest) were stored at room conditions (23 ± 1 °C, ~60% relative humidity) and milled in the MLU-202 laboratory mill (Bühler GmbH, Uzwil, Switzerand). Until chemical analyses, the milled samples were stored in −20 °C.

2.2. Chemicals

The following were used: acetone (HPLC grade) from Sigma-Aldrich (Poznań, Poland); acetonitrile (HPLC grade) from Chempur (Piekary Śląskie, Poland); acetonitrile (for LC-MS) from Sigma-Aldrich (Steinheim, Germany); ammonium formate and formic acid from Sigma-Aldrich (Steinheim, Germany); carotenoids (lutein and β-carotene), chlorophyll (chlorophyll a and chlorophyll b) and phenolic (caffeic acid, chlorogenic acid, ferulic acid, gallic acid, glycoside-3-O-kaempferol, p-coumaric acid, quercetin and rutinoside-3-O-quercetine) standards (HPLC grade 99.5–99.9% pure) from Fluka and Sigma-Aldrich (Poznań, Poland); ethyl acetate from Sigma Aldrich (Poznań, Poland); l-ascorbic acid, dehydroascorbic acid from Sigma-Aldrich (Poznań, Poland); magnesium carbonate (ultrapure) from Chempur (Piekary Śląskie, Poland); meta-phosphoric acid from Sigma-Aldrich (Poznań, Poland); Methanol (HPLC grade) from Chempur (Piekary Śląskie, Poland); methanol hypergrade for LC-MS from Merck (Darmstadt, Germany); ortho-phosphoric acid from Chempur (Piekary Śląskie, Poland); and water, ultrapure grade (18.2 MΩ cm) from a Milli-Q Academic A10 Water Purification System (Millipore Ltd., Bedford, USA).

2.3. Dry Matter Content

Dry matter content was analyzed with a gravimetric method, following the Polish standard PN-EN 12, 145 2001 [26]. Samples were dried in glass beakers at 105 ± 1 °C, for 48 h, using a FP-25W Farma Play dryer (Marki, Poland). Dried samples were cooled in a desiccator and weighed. Dry matter concentration was expressed in g 100 g−1 f.w.

2.4. HPLC Analysis of Phenolic Acids and Flavonoids

Phenolic acids and flavonoids in the barley and oat samples were analyzed by High Performance Liquid Chromatography (HPLC) using Shimadzu HPLC system (USA Manufacturing Inc., Canby, OR, USA) equipped with two LC-20AD pumps, a SIL-20AC autosampler, a CMB-20A system controller, a CTD-20AC oven, an ultraviolet-visible SPD-20AV detector and a Fusion-RP 80A column (250 mm × 4.60 mm, particle size: 4 µm) [27]. Two hundred milligrams of grain powder were used to prepare extract with 80% methanol, using an ultrasonic bath (10 min, 30 °C, 5500 Hz). Next, the samples were centrifuged (5 min, 3180× g, 2 °C), and then the 1-mL aliquots of the supernatant were transferred to HPLC vials and analyzed by HPLC. Water with acetonitrile (10% in Phase A and 55% in Phase B) were used as a gradient solvent. The time of the analysis was 36 min. The gradient program was as follows: 0–21.00 min: 95% Solvent A and 5% Solvent B; 21.01–25.00 min: 50% Solvent A and 50% Solvent B; 25.01–27.00 min: 20% Solvent A and 80% Solvent B; 27.01–32.00 min: 20% Solvent A and 80% Solvent B; and 32.01–36.00 min: 95% Solvent A and 5% Solvent B. The flow rate was 1 mL min−1. The wavelength range used was 270–360 nm. The column temperature was 30 °C. For particular compounds identification, the Fluka and Sigma-Aldrich (Poznań, Poland) external standards of phenolic compounds with purities of 95.00–99.99% were used. HPLC chromatograms presenting time of retention and peaks of the phenolic acids and flavonoids identified in oat and barley grain samples are presented in Figures S1 and S2, respectively. The concentrations of phenolic compounds were calculated based on the standard curves (Figures S4 and S5).

2.5. HPLC Analysis of Carotenoids

Carotenoid compounds separation was performed with the use of the previously described HPLC Shimadzu equipment and a Max-RP 80A column (250 mm × 4.60 mm, particle size: 4 µm) [27]. The grain samples of 100 mg were weighed and placed in plastic tubes. Pure acetone was added, and the samples were mixed for 5 min by a Vortex mixer. The samples were incubated in a cold ultrasonic bath (15 min, 0 °C, 5500 Hz) and then centrifuged (3180× g, 10 min, 0 °C). One milliliter of supernatant was transferred to dark HPLC vials and used for analysis. Two mobile phases were used: (A) acetonitrile/methanol (90:10); and (B) methanol/ethyl acetate (64:36). The time of the analysis was 28 min. The gradient program was as follows: 0–16.00 min: 95% Solvent A and 5% Solvent B; 16.01–21.00 min: 50% Solvent A and 50% Solvent B; 21.01–25.00 min: 20% Solvent A and 80% Solvent B; and 26.01–28.00 min: 20% Solvent A and 80% Solvent B. The flow rate was 1 mL min−1. The column temperature was 25 °C. The wavelength range used for detection was 445−450 nm. For carotenoids identification, the external standards of β-carotene and lutein with a purity of 99.98% were used. The HPLC chromatograms presenting retention time for carotenoids identified in barley and oat grain samples are presented in Figure S3. The concentrations of carotenoid compounds were calculated based on the standard curves (Figure S6).

2.6. LC-MS/MS Analysis of Mycotoxins

Sample extraction was done according to the method developed by Spanjer et al. (2008) [28] with slight changes. Ground sample material (5 g) was shaken in 50 mL plastic falcon tube with 5 mL of water for 30 min (Multi Reax, Heidolph, Schwabach, Germany). Then, 15 mL of acetonitrile were added and the sample was shaken on horizontal shaker (HS 501 digital, IKA-Werke GmbH & CO. KG, Staufen, Germany) for 2 h and centrifuged twice at 4143× g (Rotina 420R, Hettich Zentrifugen, Tuttlingen, Germany) for 3.5 min at 15 ± 1 °C. A 200-μL clear extract was pipetted into a 2-mL chromatography vial, and 750 μL of LC mobile phase (95% A and 5% B) and 50 μL of internal standard (ILS) were added allowing to obtain 20-fold dilution minimizing the matrix effect.
The method was validated with both the tested matrices as well as the purchased European Reference Materials (ERMs). Recovery experiments were performed to evaluate the method accuracy. The recoveries were in the range of 70–120% and precision (RSD) ≤20%. The suitability of the method for testing was confirmed in 2 rounds of proficiency tests organized by TestQual Proficiency Testing Schemes (Murcia, Spain), TestQual 85 and TestQual 88, as well as in Romer Labs Check Sample Survey (CSSMY018-M20161DZO).
The LC-MS/MS system consisting of an Eksigent expert ultraLC 100-XL (Eksigent Technologies, Dublin, CA, USA) coupled to triple quadrupole mass spectrometer QTRAP 6500 (AB Sciex Instruments, Foster City, CA, USA) was used for the analysis of the mycotoxins. A 10-μL aliquot (cooled to 8 ± 1 °C) was injected on Kinetex core–shell C18 100 Å (100 mm × 2.1 mm, 2.6 µm) column (Phenomenex, Torrance, CA, USA) at 40 °C column temperature. The gradient was composed of solvents A (0.1% formic acid and 5 mM ammonium formate in water) and B (0.1% formic acid and 5 mM ammonium formate in methanol) at a flow rate of 0.5 mL min−1. The gradient elution was started with 98% A and 2% B and held for 1.0 min, then rising linearly to 2% A and 98% B in 9 min and held for 3.0 min. The composition of the mobile phase was returned to starting condition over 0.1 min, followed by a column re-equilibration phase of 2.9 min. The total time of data acquisition was 16.0 min. The MS/MS 6500 QTRAP was operated in electrospray ionization positive (ESI+) and negative (ESI-) mode, at capillary voltage of 4500 or −4500 V, the desolvation temperature of 500 °C, the entrance potential (EP) of 10 or −10 V, with nitrogen as the curtain (CUR), nebulizer (GS1) and auxiliary (GS2) gas, at a pressure of 30, 60 and 50 psi, respectively. Nitrogen was also used as collision gas. Ionization and MS/MS collision energy settings were optimized while continuously infusing mycotoxin solution at a flow-rate of 100 μL min−1 via a syringe pump. For each mycotoxin, the parent and two daughter ions were selected and the first one was used for quantification and the second one for confirmation. Data acquisition was performed in the multiple reaction monitoring mode (MRM). LC-MS/MS chromatograms of representative samples are shown in Figure S8.
Analyst Software version 1.6.2 and MultiQuant Software version 3.0.2 (AB Sciex) were used for data acquisition and processing. Retention time (RT), precursor and product ions monitored and optimized collision energy, declustering potential, collision energy and cell exit potential for the ESI+ and ESI- ionization mode are demonstrated for each mycotoxin in Table S1.
Certified liquid standards of single and multiple mycotoxins (manufacturer: Romer Labs Diagnostic, Tulin, Austria) were used to prepare a stock standard mixture of 14 mycotoxins in acetonitrile, containing following concentrations: 0.025 μg mL−1 of aflatoxin B2 (AFLB2) and aflatoxin G2 (AFLG2), 0.1 μg mL−1 of aflatoxin B1 (AFLB1) and aflatoxin G1 (AFLG1), 0.5 μg mL−1 of ochratoxin A (OTA), 5.0 μg mL−1 of fumonisin B1 (FB1), fumonisin B2 (FB2), T-2 toxin (T-2), HT-2 toxin (HT-2) and zearalenone (ZEA), 20 μg mL−1 of deoxynivalenol (DON), 3-acetyldeoxynivalenol (3-AcDON), 15-acetyldeoxynivalenol (15-AcDON) and nivalenol (NIV). Working solutions were made by 5-, 10-, 50-, 100-, 500-, 1000- and 5000-fold dilution of the stock mixture with acetonitrile. The isotopically labeled standard solution of 13C17–ALFB1 at the concentration of 0.01 μg mL−1 prepared in acetonitrile by 50 times dilution of 1 mL of 0.5 μg mL−1 stock solution was used as internal standard (ILS). The stock and working mycotoxin standard mixtures were used to determine the calibration curves, recoveries and the limit of detections (LOD). All standard solutions and mixtures were kept in a freezer at −20 °C.
Calibration mixtures of seven concentration levels were prepared by pipetting the following into 2-mL chromatography vials: 100 µL of each standard mixture, 850 µL of LC mobile phase (95% A and 5% B) and 50 µL of internal standard (ILS). Internal standard 13C17-AB1 (ILS) was added to the final acetonitrile extracts just prior to determination step, in order to control the accurate injection of calibration standards and sample extracts into the LC-MS/MS system. The solution concentrations were as follows: for AFLB1 and AFLG1, in the range of 0.002–2 ng mL−1 (corresponding to 0.04–40 µg kg−1); for AFLB2 and AFLG2, in the range of 0.0005-0.5 ng mL−1 (corresponding to 0.01–10 µg kg−1); for OTA, in the range of 0.01–10 ng mL−1 (corresponding to 0.2–200 µg kg−1); for FB1, FB2, HT-2 toxin, T-2 toxin and ZEA, in the range of 0.1–100 ng mL−1 (corresponding to 2–2000 µg kg−1); and for DON, 3-AcDON, 15-AcDON and NIV, in the range of 0.4–400 ng mL−1 (corresponding to 8–8000 µg kg−1). The limit of quantification was set at 0.04 µg kg−1 for AFLB1 and AFLG1; 0.01 µg kg−1 for AFLB2 and AFLG2; 1 µg kg−1 for OTA; 10 µg kg−1 for FB1 and FB2; 1 µg kg−1 for HT-2 toxin and T-2 toxin; 2 µg kg−1 for ZEA; 4 µg kg−1 for 15-AcDON; and 40 µg kg−1 for DON, 3-AcDON and NIV. Estimation of LOD for each mycotoxin was done via calibration approach according to the “Guideline for the estimation of LOD and LOQ for the measurement of contaminants in feed and food” [29] based on linear multi-point calibration curve, including lowest calibration level (LCL), characterized by R2 ≥ 0.995. LOQ was estimated as equivalent to 3.3 × LOD. It was assumed for simplicity that LOQ for most mycotoxins is equivalent to the level of lowest calibration level (LCL), while for HT-2 toxin, T-2 toxin and 15-AcDON as equal to 1/2 LCL.

2.7. Statistical Analyses

The impact of cultivar on the grain compositional parameters of barley and oat were assessed using one-way analysis of variance (ANOVA), followed by the post-hoc Tukey’s HSD test, and the differences were considered significant at p < 0.05. A principal component analysis (PCA) was performed to explore possible differences and similarities between barley and oat cultivars in the identified bioactive compounds’ concentrations and the mycotoxins occurrence. The PCA was conducted using the correlation matrix, which corresponds to the analysis of standardized data. Additionally, Pearson’s product–moment correlation analysis was carried out to identify potential linear associations between the concentrations of individual and groups of polyphenols in grain samples of each species. The Statgraphics 5.1. Software (StatPoint Technologies, Warrenton, VA, USA) was used for the ANOVA analysis, XLSTAT Excel add-on for PCA figures preparation and R (R Foundation for Statistical Computing, Vienna, Austria) for correlation calculations and visualization.

3. Results and Discussion

3.1. Polyphenols and Carotenoids Content

This part of the presented research focused on the bioactive compounds’ profiles of seventeen barley and eight oat cultivars grown in the controlled field trial under the organic farming conditions. The results of the analyses of phenolic acids, flavonoids and carotenoids concentrations are presented in Table 2, Table 3, Table 4, Table 5 and Table 6.
Phenolic acids, constituting the main group of polyphenols in barley and oat grains, have been linked to the prevention of many non-communicable diseases caused by the oxidative stress, partly due to the presence of unsaturated carboxylic group in their structure [30]. The concentrations of phenolic acids in the analyzed samples of barley and oat are shown in Table 2 and Table 3. The HPLC method allowed for the separation, identification and quantitation of six phenolic acids in the analyzed samples: gallic acid, ferulic acid, caffeic acid, p-coumaric acid, sinapic acid and t-cinnamic acid. In the case of both cereal species, there were significant differences between the cultivars in the summary concentration of all the identified phenolic acids, as well as in the concentrations of majority of the individual compounds (p < 0.05). The SU Lolek, Rubaszek and Podarek barley cultivars had the highest content of phenolic acids, while the lowest phenolic acids content was found in the Natasia and Britney cultivars (Table 2). Among the oat cultivars, the highest amount of phenolic acids was found in the Harnaś and Nawigator cultivars and the lowest in the Haker and Amant cultivars (Table 3). The dominant phenolic acid in both barley and oat was ferulic acid. In barley, it accounts for 84.8% of total phenolic acids and in oat for 88.7%, on average. This is in agreement with the previous findings that ferulic and p-coumaric acids are the major low-molecular weight phenolic acids in barley [30,31] and oat [32] grains. As previously reported, in barley grain, they are mainly found in the outer layers, but also in endosperm, while, in the oat grain, in the outer layer of the kernel, in the bran fraction of the grain. Other bound phenolic acids previously found to occur in barley and oat grain are vanillic and p-hydroxybenzoic acid [31,32,33].
Our results partly correspond with the results of other authors. Chen et al. (2018) [33] reported the influence of genetic factors on phenolics contents of two varieties of Avena sativa L., six varieties of Avena nuda L. and one variety of wild oat (Avena fatua L.). In this research, gallic acid, protocatechuic acid, p-hydroxybenzoic acid and vanillic acid were the major phenolic acids found in all the samples, while in our research the most abundant were ferulic, p-coumaric and caffeic acid. Although the contents of some of the individual phenolic acids in the present study were different from those reported by other researchers [33], the sum of the concentrations of all the identified phenolic acids was similar. Carvalho and co-authors [31], who investigated phenolics content in different barley varieties, detected seven phenolic acids (gallic, protocatechuic, vanillic, caffeic, p-coumaric, t-ferulic and sinapic). Their results are in line with ours in the main phenolic acids occurrence, because in both studies ferulic, p-coumaric and caffeic acids were the most abundant ones.
Flavonoids are present in cereals in smaller quantities than phenolic acids [31], but they have an important role in the cereal plants, acting as ultraviolet B radiation absorbing compounds and thus protecting plants against excessive short-wavelength solar radiation [34]. At the same time, high dietary flavonoid intake has been shown to be inversely correlated with the risk of many non-communicable diseases associated with oxidative stress [35]. In the present study, flavonoids constituted around 26% of all polyphenols identified in barley and oat. The results on the flavonoids content (sum and individual compounds) in grains of all tested barley and oat cultivars are presented in Table 4 and Table 5. We separated, identified and quantified six flavonoids in grains: quercetin-3-O-rutinoside, apigenin, kaempferol-3-O-glucoside, quercetin, kaempferol and luteolin. Among the tested barley cultivars, the highest summary concentration of all the identified flavonoids was found in Ella, followed by Natasia, Soldo and Oberek cultivars (Table 4). Among the oat cultivars, Haker and Krezus were richest in flavonoids (Table 5). Quercetin-3-O-rutinoside was the most abundant flavonoid in barley. On average, it accounted for 37.8% of total flavonoids concentration. In oat, kaempferol and apigenin had a major share, accounting for 30.1% and 27.3% of the total flavonoid concentration, respectively. This is partly in line with the review on the antioxidants in oat [4], which indicated apigenin, luteolin and tricin as the main flavonoids in oat, but also confirmed the presence of some others glycosidic derivatives (i.e., 6-C and 8-C-glucoside apigenin and 3-O-rutinosides of quercetin and kaempferol). According to Xu and Chang [36], the observed variation in the phenolic acids and flavonoids profiles reported in different studies is probably due to the different cultivars used, environmental conditions and degree of ripeness, as well as the extraction solvents and testing methods applied.
Since the greatest amounts of phenolic acids (constituting main polyphenols occurring in barley and oat) were observed in the grains of Podarek, SU Lolek and Rubaszek barley cultivars, and in the grains of Harnaś and Nawigator oat, these cultivars were the richest in total polyphenols (Table 6). Bloksma et al. [37] pointed out a number of genetic, environmental and agricultural factors that affect phenolic compounds concentrations in plant tissues. In our experiment, the environmental conditions and agricultural practices were comparable, so the cultivar and species were the main factors influencing on the polyphenol content in grain. The existence of differences in the content of polyphenols in different cultivars of cereals and leguminous plants was confirmed by many authors [38,39,40,41].
Despite occurring at low concentrations in cereal grains, carotenoids belong to the nutritionally important compounds, with proven health enhancing properties. The available research results on the carotenoids content and profile in barley and oat are limited. The main carotenoid compound in oat and barley is lutein [42]. Lutein and zeaxanthin presence in retina is associated with reduced risk of cataract development and age-related macular degeneration (AMD) [43]. The barley and oat grain samples analyzed within the present study contained, on average, 800.13 and 757.69 μg kg−1 of lutein, respectively. Although identified in the tested samples, β-carotene content was very low compared to lutein (Table 6). Panfili et al. (2004) [44], in their study on the extraction and determination of carotenoids in cereals and cereal byproducts, confirmed the presence of lutein, α-carotene and β-carotene in barley and oat. According to the authors, barley contained on average 860 μg of lutein per kg d.w., while oat had 230 μg of lutein per kg d.w. This is in line with our results in the case of barley, but we obtained, on average, higher lutein content in oat grains. This variation may be due to the different cultivars used in the experiment. When comparing individual cultivars in terms of lutein content, again Soldo cultivar of barley was the richest in this carotenoid, and in the case of oat highest contents of this compound were found in the grain of Amant, Pascal and Krezus cultivars.

3.2. Mycotoxin Occurrence

Amongst the analyzed mycotoxins, fumonisin B2 (FB2) was the most frequently detected one in both oat and barley grains (Table 7 and Table 8). The percentage of positive (contaminated) samples was as follows: FB2 96%, OTA 84%, fumonisin B1 (FB1) 12%, 15-AcDON 8% and 4% each of T-2 toxin, HT-2 toxin, DON and ZEA. However, all detected mycotoxin concentrations were below the maximum levels set for mycotoxins in cereal grains [45]. The following mycotoxins analyzed within the study were not detected in any of the tested cereal samples: NIV (Nivalenol), AFLB1 (Aflatoxin B1), AFLB 2 (Aflatoxin B2), AFLG1 (Aflatoxin G1), AFLG2 (Aflatoxin G2) and 3-AcDON (3-acetyldeoxynivalenol). Mycotoxin-producing molds attack crops before and after harvest. Fumonisins, DON, ZEA and trichothecenes are the toxins produced by fungi of the genus Fusarium, which belong to pathogens occurring during plant growth, while OTA is produced by Penicillium verrucosum, a post-harvest mold, as well as by many species of Aspergillus [12]. Critical period for contamination with mold and mycotoxins is the end of the growing season, when the crops are mature and begin to dry, as well as during harvesting and immediately after harvest. Rainfall is a very important factor at the crop maturity stage, since it slows down the drying process and causes the development of Fusarium and production of its mycotoxins. Colonies of these fungi can be moved to storage and continue to grow if the relative humidity remains high. Prolongation of rainfall during harvest create ideal conditions for the development of many postharvest fungi [12]. Mannaa and Kim (2017) also confirmed that the occurrence and growth of fungi producing mycotoxins are controlled by various environmental and ecological factors [46]. Pre-harvest contamination by mycotoxin-producing fungi is mainly influenced by interactions between the host plant genotype, soil type and a number of biological factors. The growth and development of fungi after harvest depends on the pre-harvest soil and plant condition (i.e., nutrient-impoverished soils and damaged grain increase susceptibility), environmental factors (temperature and humidity) and the presence of biotic factors such as pests and microorganisms. In general, high humidity and temperature increase the susceptibility of crops to mycotoxin contamination. According to Mannaa and Kim, the optimum temperatures for growth and mycotoxin production of the major mycotoxigenic fungal species range from 20 to 35 °C, but its activity may continue even below 0 °C. Very interesting observations were made by Yli-Mattila et al. (2013), who monitored the levels of mycotoxins and the presence of fungal DNA as well as their correlations in samples of Finnish oats [47]. Their investigations indicate that in Europe it is possible to distinguish two populations of F. graminearum occurring in different host plants. According to their research, the 3-AcDON chemotype source population is dominant in northern Europe and has recently spread from Finland to northwest Russia, while the 15-AcDON chemotype population is dominant in Central and Southern Europe and has spread to Denmark. The 3-AcDON chemotype is rare in Germany, England, Poland, Hungary, Luxembourg and Italy. These findings suggest possible correlation between mycotoxins occurrence and geographical area/climate conditions. Other studies have shown similar observations confirming the existence of geographical differences in the composition of Fusarium community in different regions of Sweden, where F. graminearum was more abundant in the western part of the country [20].
The average FB2 concentration of all barley grain samples tested was 139.05 μg kg−1 (Table 7), whereas in the case of oat it was 39.16 μg kg−1 (Table 8). High contents of FB2, within a range of 289.52–645.34 μg kg−1, were found in a few individual barley grain samples of SU Lolek, Britney and Natasia cultivars. The concentrations of fumonisins in the oat samples were rather low, not far above the limit of quantification, which is 10 μg kg−1. The DON, ZEA, T-2 and HT-2 toxins were detected only in Soldo cultivar of barley. However, the contents of all four toxins were very low. 15-AcDON was found only in Fariba barley and Arden oat samples. Most of the tested barley and oat grain samples contained OTA contamination. It was not detected only in the grain samples of three barley (Olimpic, Fariba and Fabienne) and one oat (Amant) cultivars. Among all the barley and oat grain samples tested, no mycotoxin contaminations were found only in the case of one oat cultivar—Amant (Table 8). According to Jouany (2007), genetic susceptibility and several environmental factors and agricultural practices, such as tillage, soil fertilization, planting dates, pest and weed control, physiological stage of plants and pre- and post-harvest conditions, can influence the crop mycotoxin contamination [17]. Czaban et al. (2015) also reported that cereal grain infection by fungi depends on many factors, including environmental conditions, agricultural practices (e.g., crop production technology) and mostly the level of resistance of the host variety [48]. In our experiment, most of the mentioned practices and conditions were the same for all experimental plots. Hence, it appears that the observed mycotoxin contamination was mainly due to cultivar features.

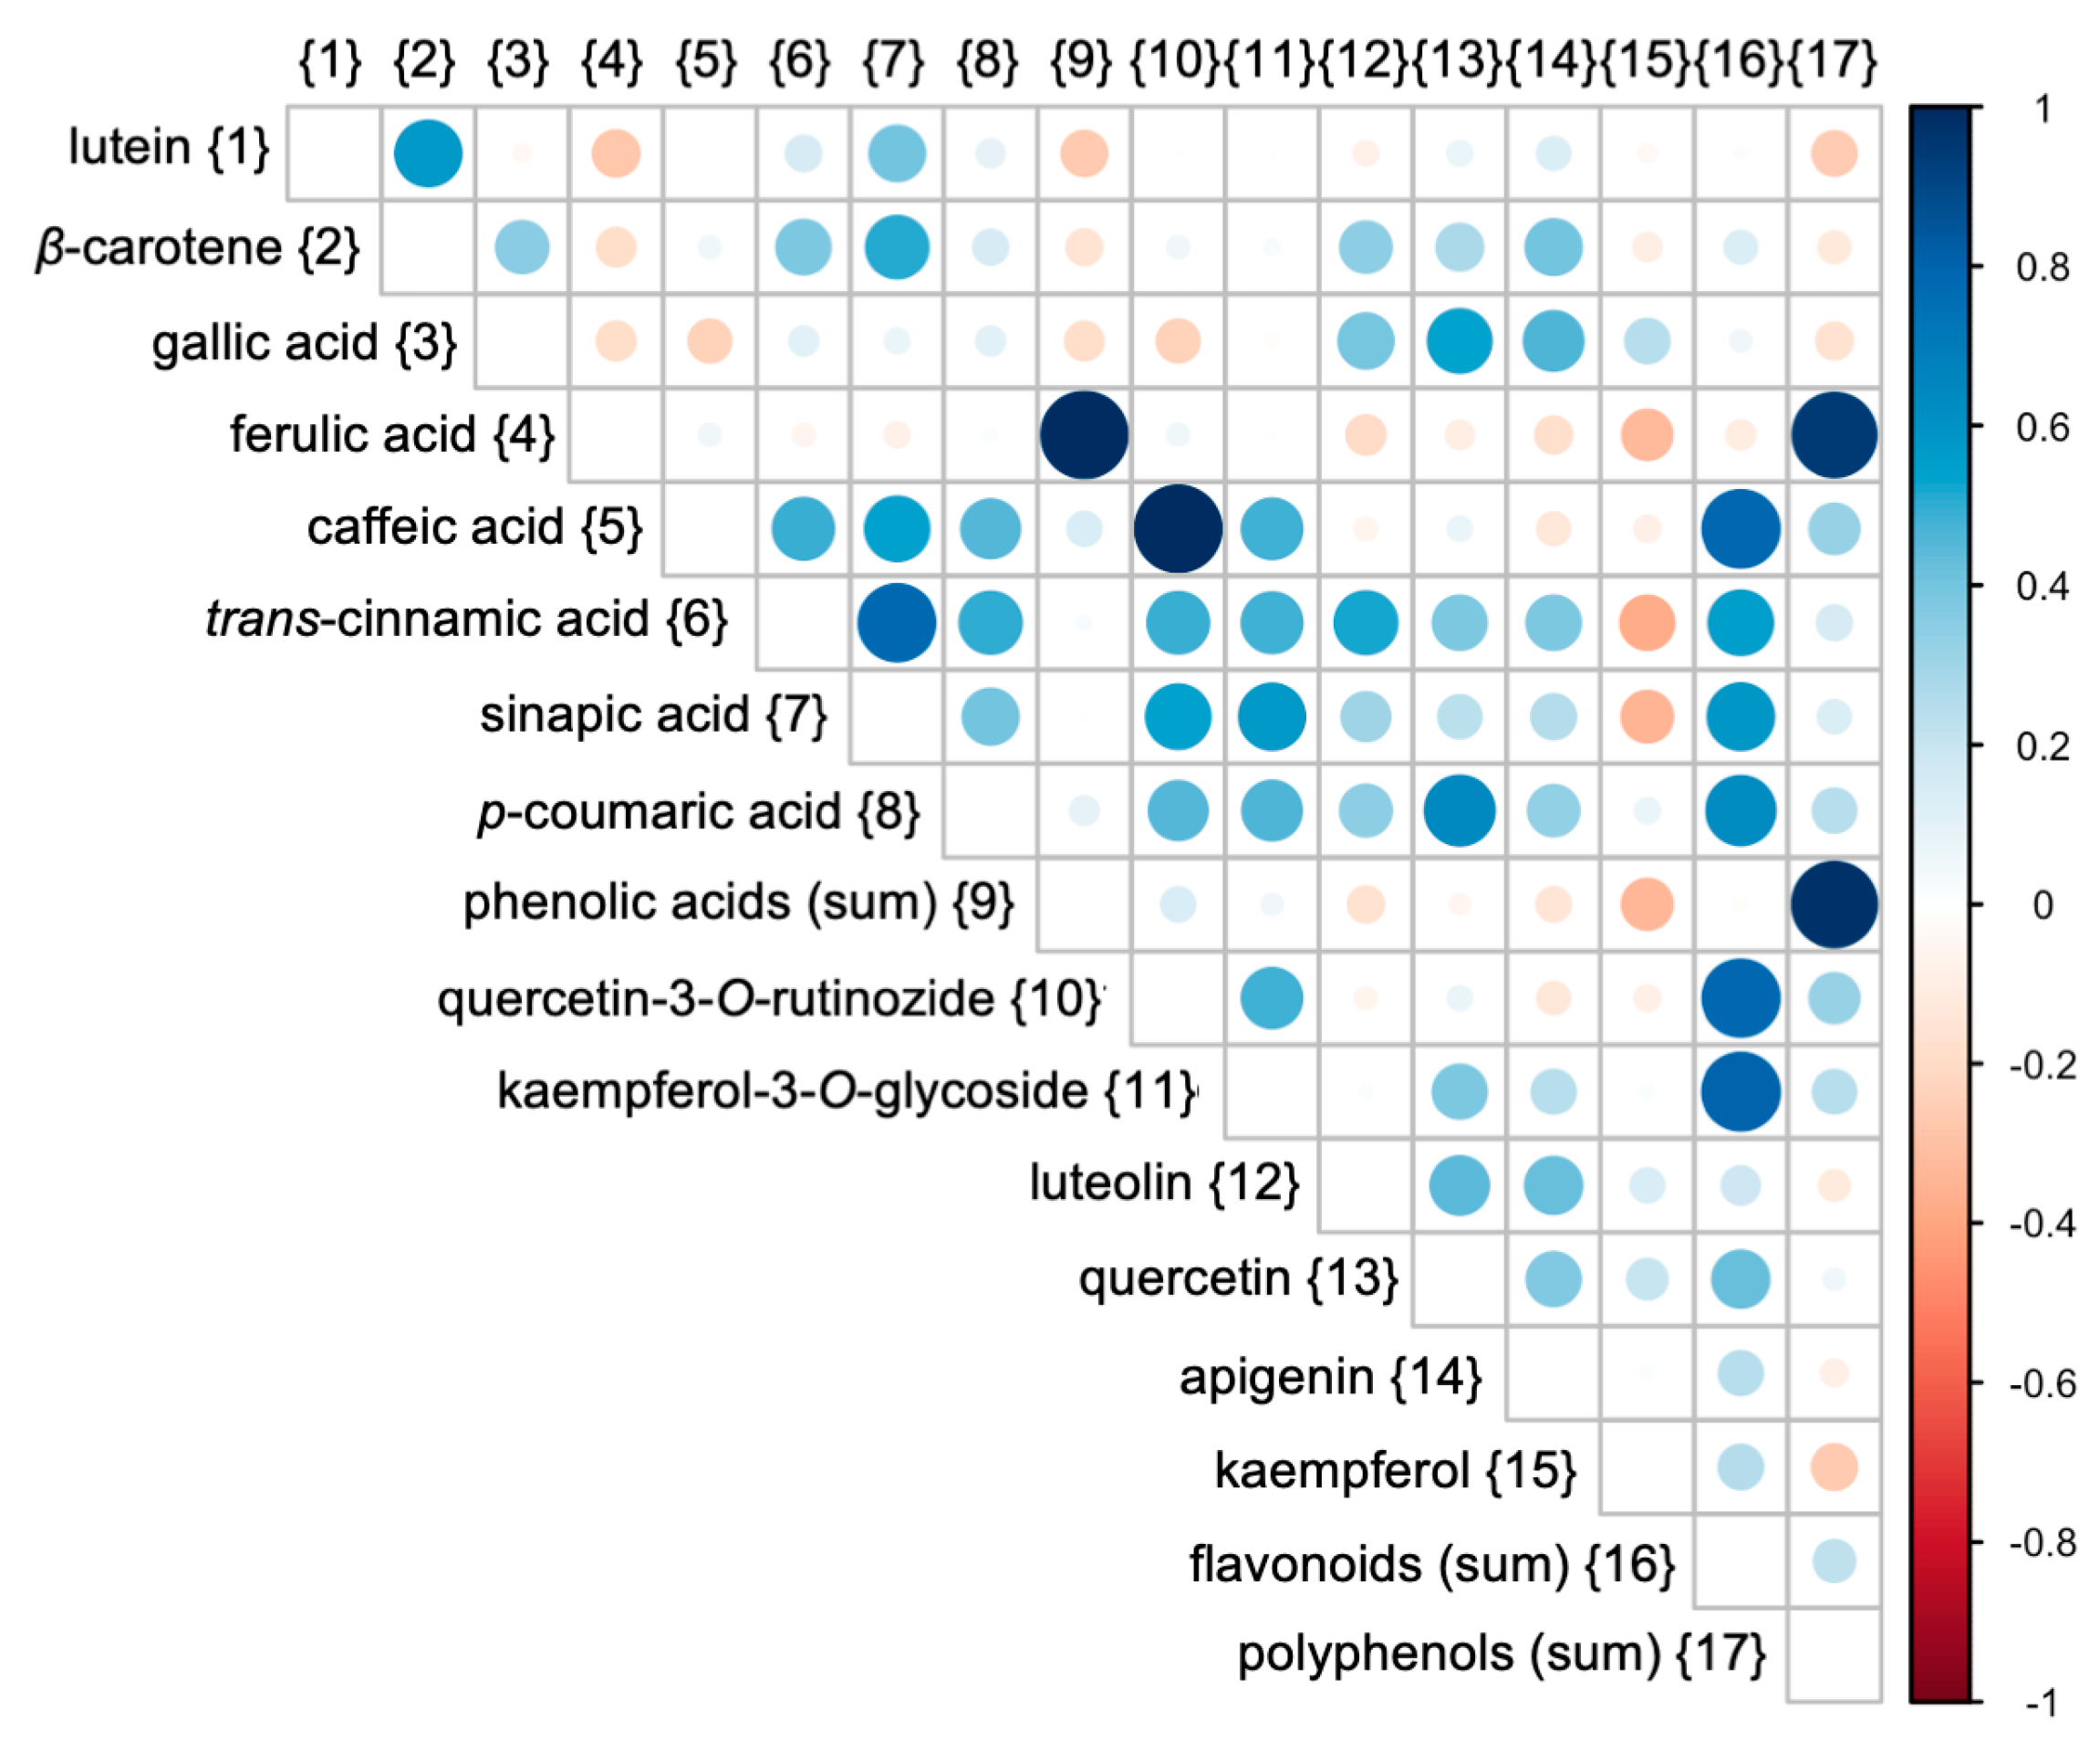
3.3. Relations Between Cultivars and Parameters Tested

To further explore the differences and similarities between the tested barley and oat cultivars produced in the organic farming conditions in terms of the contents of polyphenolic and carotenoid compounds and mycotoxins contamination, a principal component analysis (PCA) was performed (Figure 1, Figure 2, Figure 3 and Figure 4). The result of the PCA for the bioactive compounds of barley and oat cultivars showed a high overall variation (54.34% and 53.28%, respectively) explained by PC1 and PC2 (Figure 1 and Figure 2). Three groups of barley cultivars located in different quarters of the PCA plot were associated with different groups of compounds (Figure 1). Among all cultivars in the experiment, Rubaszek, SU Lolek and Podarek were characterized by a higher content of ferulic acid (main phenolic acid) and phenolics in general. In comparison, cultivars such as Soldo and Ella were associated with a higher content of flavonoids when compared to others. This confirms significant differences in the bioactive compound profiles/patterns between groups of barley cultivars tested. Oat cultivars are more scattered across the PCA plot, which suggests the absence of strong similarities between cultivars tested for bioactive compounds (Figure 2). For example, cultivars Arden and Nawigator were similar in the content of kaempferol and sinapic acid, while differed in the content of ferulic acid, kaempferol-3-O-glucoside, gallic acid or quercetin-3-O-glucoside. The results of the PCA for the mycotoxin contamination showed that the first two components describe 85.19% (in barley cultivars) and 97.74% (in oat cultivars) of the initial variability (Figure 3 and Figure 4). A strong divergence was observed between the barley cultivars (Figure 3). In comparison with all other cultivars, Soldo was strongly associated with the contamination of DON, T-2, HT-2 and ZEA mycotoxins. In addition, strong associations were found for Natasia and SU Lolek cultivars and the content of mycotoxins FB1, FB2 and OTA. All other cultivars were associated with mycotoxin contamination in a much lesser extent. Oat cultivars Harnaś and Haker were both associated with OTA and FB2, and cultivar Arden with 15-AcDON mycotoxins contamination (Figure 4).
The Pearson’s correlation analysis showed some significant relationships between the content of the analyzed groups of bioactive compounds and the individual antioxidants in oat and barley grain samples (Figure 5 and Figure 6). In barley, the strongest positive correlations were identified between the contents of the sum of polyphenols and the sum of phenolic acids (r = 0.97, p < 0.001) and between the sum of polyphenols and ferulic acid (r = 0.95, p < 0.001), which indicates that phenolic acids were a predominant group of phenolics in the barley grain, and ferulic acid was their predominant representative (Figure 5). Similar positive correlations between the contents of the sum of polyphenols and the sum of phenolic acids (r = 1.00, p < 0.001) and ferulic acid (r = 1.00, p < 0.001) were observed in oat. Moreover, significant negative correlation was observed between the content of p-coumaric acid and apigenin in oat grain samples (r = −0.34, p = 0.050) (Figure 6).

4. Conclusions

Our research showed some significant differences between 17 barley and 8 oat cultivars produced under organic management system in the phenolic and carotenoid compounds content and mycotoxins contamination in grains. Among the barley cultivars studied, the grains of SU Lolek, Rubaszek and Podarek were richest in polyphenols, including phenolic acids. The grain of Soldo cultivar accumulated the highest content of carotenoids (lutein and β-carotene), but at the same time most of the mycotoxins identified within the study were found in the grains of this cultivar. In the case of oat, the cultivars Harnaś, Nawigator and Arden stood out from the rest in terms of the highest content of phenolic acids and total polyphenols in the grain, while Pascal and Amant grains were richest in carotenoids. Among all the oat cultivars tested, only Amant grain was free from the studied mycotoxins.
These findings, showing a more favorable chemical composition of some cultivars compared to the others, and allowing for initial identification of barley and oat cultivars with the highest quality traits, may be of importance for the organic producers as well as for the consumers, who increasingly search for high quality organic foods. Moreover, these results may be a premise for further research towards developing cereal seed production aimed at organic producers. The next important step of research could also be to define and promote the best storage and processing technologies that would enable the preservation of high quality and safety attributes of the examined organic cereals in food products.

Supplementary Materials

The following are available online at https://www.mdpi.com/2076-3417/10/18/6369/s1, Figure S1: Chromatograms showing retention time for phenolic acids identified in organic oat grains (A): (1) gallic acid (0.40 µg mL−1), (2) t-cinnamic acid (0.40 µg mL−1), (3) caffeic acid (0.30 µg mL−1), (4) ferulic acid (9.59 µg mL−1), (5) sinapic acid (0.28 µg mL−1), (6) p-coumaric acid (0.82 µg mL−1); and in organic barley grains (B): (1) gallic acid (0.30 µg mL−1), (2) t-cinnamic acid (0.10 µg mL−1), (3) caffeic acid (0.08 µg mL−1), (4) ferulic acid (4.07 µg mL−1), (5) sinapic acid (0.27 µg mL−1), (6) p-coumaric acid (0.79 µg mL−1), Figure S2: Chromatograms showing retention time for flavonoids identified in organic oat grains (A): (1) quercetin-3-O-rutinoside (1.29 µg mL−1), (2) kaempferol-3-O-glucoside (0.78 µg mL−1), (3) luteolin (0.42 µg mL−1), (4) quercetin (0.46 µg mL−1), (5) apigenin (1.16 µg mL−1), (6) kaempferol (1.18 µg mL−1); and in organic barley grains (B): (1) quercetin-3-O-rutinoside (0.62 µg mL−1), (2) kaempferol-3-O-glucoside (0.65 µg mL−1), (3) luteolin (0.50 µg mL−1), (4) quercetin (0.65 µg mL−1), (5) apigenin (1.91 µg mL−1), (6) kaempferol (2.04 µg mL−1), Figure S3: Chromatograms showing retention time for carotenoids in organic oat grains (A): (1) lutein (1.73 µg mL−1), (2) β-carotene (0.03 µg mL−1); and in organic barley grains (B): (1) lutein (1.33 µg mL−1), (2) β-carotene (0.03 µg mL−1), Figure S4: Standard curves with R2 for all identified phenolic acids in cereal grains, Figure S5: Standard curves with R2 for all identified flavonoids in cereal grains, Figure S6: Standard curves with R2 for the identified carotenoids in cereal grains, Figure S7: Total ion chromatogram of mycotoxins, Figure S8: LC-MS/MS chromatograms of mycotoxins in representative grain samples: A - HT-2 toxin (HT-2) (3.42 µg kg−1); B - T-2 toxin (T-2) (3.55 µg kg−1); C - fumonisin B2 (FB2) (33.74 µg kg−1); D - ochratoxin A (OTA) (1.53 µg kg−1); E - zearalenone (ZEA) (8.00 µg kg−1); F - deoxynivalenol (DON) (58.71 µg kg−1) (barley, Soldo); G - 15-acetyldeoxynivalenol (15-AcDON) (2.28 µg kg−1) (oat, Arden), Table S1: Multiple reaction monitoring (MRM) transitions with retention times, ion ratio, declustering potential, collision energy and cell exit potential used to detect target mycotoxins using a single method with negative and positive polarity.

Author Contributions

Conceptualization, R.K., D.L. and B.G.; Data curation, R.K., D.Ś.-T., M.B. and E.H.; Formal analysis, E.H., A.N., D.L. and K.K.; Funding acquisition, D.Ś.-T.; Investigation, R.K., D.L., D.Ś.-T. and A.N.; Methodology, R.K., D.L., A.N., M.B. and E.H.; Resources, E.H.; Supervision, R.K. and D.Ś.-T.; Visualization, E.H., K.K. and M.B.; Writing—original draft, R.K.; and Writing—review and editing, R.K., D.Ś.-T., D.L., A.N., E.H., M.B. and B.G. All authors have read and agreed to the published version of the manuscript.

Funding

This research was funded by the Polish Ministry of Science and Higher Education with funds of the Institute of Human Nutrition Sciences, Warsaw University of Life Sciences (WULS), for scientific research and by The Office of the Marshal of the Mazowieckie Voivodeship in Warsaw, and were supervised by the COBORU Experimental Station for Variety Testing in Seroczyn. The publication charges are covered with a grant from the Financial Support System for Scientists and Research Teams in the Warsaw University of Life Sciences (WULS) (awarded in 2020 to Doc. D. Średnicka-Tober, grant number 504-02-780400-S00123-99).

Acknowledgments

We gratefully acknowledge the technical support of MSc Tomasz Strok in the preparation of oat and barley grain samples.

Conflicts of Interest

The authors declare no conflict of interest. The funders had no role in the design of the study, in the collection, analyses, or interpretation of data, in the writing of the manuscript, or in the decision to publish the results.

References

  1. FAOSTAT Statistics 2018. Available online: http://www.fao.org/faostat/en/#data/QC/visualize (accessed on 17 July 2020).
  2. Gangopadhyay, N.; Hossain, M.B.; Rai, D.K.; Brunton, N.P. A review of extraction and analysis of bioactives in oat and barley and scope for use of novel food processing technologies. Molecules 2015, 20, 10884–10909. [Google Scholar] [CrossRef] [PubMed]
  3. De Paula, R.; Rabalski, I.; Messia, M.C.; Abdel-Aal, E.-S.M.; Marconi, E. Effect of processing on phenolic acids composition and radical scavenging capacity of barley pasta. Food Res. Int. 2017, 102, 136–143. [Google Scholar] [CrossRef] [PubMed]
  4. Peterson, D.M. Oat antioxidants. J. Cereal Sci. 2001, 33, 115–129. [Google Scholar] [CrossRef]
  5. Hajji, T.; Mansouri, S.; Vecino-Bello, X.; Cruz-Freire, J.M.; Rezgui, S.; Ferchichi, A. Identification and characterization of phenolic compounds extracted from barley husks by LC-MS and antioxidant activity in vitro. J. Cereal Sci. 2018, 81, 83–90. [Google Scholar] [CrossRef] [Green Version]
  6. Liu, R.H. Whole grain phytochemicals and health. J. Cereal Sci. 2007, 46, 207–219. [Google Scholar] [CrossRef]
  7. Amarowicz, R. Natural phenolic compounds protect LDL against oxidation. Eur. J. Lipid Sci. Technol. 2016, 118, 677–679. [Google Scholar] [CrossRef] [Green Version]
  8. Gani, A.; Wani, S.; Masoodi, F.; Hameed, G. Whole-grain cereal bioactive compounds and their health benefits: A review. J. Food Process. Technol. 2012, 3, 146. [Google Scholar] [CrossRef] [Green Version]
  9. Kasprzak, M.M.; Erxleben, A.; Ochocki, J. Properties and applications of flavonoid metal complexes. RSC Adv. 2015, 5, 45853–45877. [Google Scholar] [CrossRef]
  10. Zhai, S.; Xia, X.; He, Z. Carotenoids in staple cereals: Metabolism, regulation, and genetic manipulation. Front. Plant Sci. 2016, 7, 1–13. [Google Scholar] [CrossRef] [Green Version]
  11. Juan, C.; Covarelli, L.; Beccari, G.; Colasante, V.; Mañes, J. Simultaneous analysis of twenty-six mycotoxins in durum wheat grain from Italy. Food Control 2016, 62, 322–329. [Google Scholar] [CrossRef]
  12. Golob, P. Good practices for animal feed and livestock. In On-Farm Mycotoxin Control in Food and Feed Grain; Training Manual 1; Food & Agriculture Organization: Roma, Italy, 2007; ISBN 978-92-5-105852-7. [Google Scholar]
  13. Tola, M.; Kebede, B. Occurrence, importance and control of mycotoxins: A review. Cogent Food Agric. 2016, 2, 1–12. [Google Scholar] [CrossRef]
  14. Hietaniemi, V.; Kontturi, M.; Rämö, S.; Eurola, M.; Kangas, A.; Niskanen, M.; Saastamoinen, M. Contents of trichothecenes in oats during official variety, organic cultivation and nitrogen fertilization trials in Finland. Agric. Food Sci. 2004, 13, 54–67. [Google Scholar] [CrossRef]
  15. Malir, F.; Ostry, V.; Pfohl-Leszkowicz, A.; Malir, J.; Toman, J. Ochratoxin A: 50 Years of Research. Toxins 2016, 8, 191. [Google Scholar] [CrossRef] [PubMed] [Green Version]
  16. Benkerroum, N. Chronic and Acute Toxicities of Aflatoxins: Mechanisms of Action. Int. J. Environ. Res. Public Health 2020, 17, 423. [Google Scholar] [CrossRef] [Green Version]
  17. Jouany, J.P. Methods for preventing, decontaminating and minimizing the toxicity of mycotoxins in feeds. Anim. Feed Sci. Technol. 2007, 137, 342–362. [Google Scholar] [CrossRef]
  18. Bernhoft, A.; Clasen, P.-E.; Kristoffersen, A.B.; Torp, M. Less Fusarium infestation and mycotoxin contamination in organic than in conventional cereals. Food Addit. Contam. Part A 2010, 27, 842–852. [Google Scholar] [CrossRef]
  19. Edwards, S.G. Fusarium mycotoxin content of UK organic and conventional oats. Food Addit. Contam. Part A Chem. Anal. Control. Expo. Risk Assess. 2009, 26, 1063–1069. [Google Scholar] [CrossRef] [Green Version]
  20. Karlsson, I.; Friberg, H.; Kolseth, A.-K.; Steinberg, C.; Persson, P. Agricultural factors affecting Fusarium communities in wheat kernels. Int. J. Food Microbiol. 2017, 252, 53–60. [Google Scholar] [CrossRef] [Green Version]
  21. Sturite, I.; Kruma, Z.; Tomsone, L.; Åssveen, M.; Kronberga, A.; Straumite, E.; Galoburda, R. Effect of organic and conventional farming system on the total phenolic content and antioxidant activity of oats and barley grains. In Proceedings of the 4th Organic Conference: Organics for Tomorrow’s Food Systems, Mikkeli, Finland, 19–21 June 2017; Aakkula, J., Hakala, K., Huhta, H., Iivonen, S., Jurvanen, U., Kreismane, D., Land, A., Lähdesmäki, M., Malingen, M., Mikkola, M., et al., Eds.; Organic Eprints, NJF Report. 2017; 13, pp. 89–91. [Google Scholar]
  22. Ostrowska-Kołodziejczak, A.; Stuper-Szablewska, K.; Kulik, T.; Buśko, M.; Rissmann, I.; Wiwart, M.; Perkowski, J. Concentration of fungal metabolites, phenolic acids and metals in mixtures of cereals grown in organic and conventional farms. J. Anim. Feed Sci. 2016, 25, 74–81. [Google Scholar] [CrossRef]
  23. Barański, M.; Średnicka-Tober, D.; Volakakis, N.; Seal, C.; Sanderson, R.; Stewart, G.B.; Benbrook, C.; Biavati, B.; Markellou, E.; Giotis, C.; et al. Higher antioxidant and lower cadmium concentrations and lower incidence of pesticide residues in organically grown crops: A systematic literature review and meta-analyses. Br. J. Nutr. 2014, 112, 794–811. [Google Scholar] [CrossRef] [Green Version]
  24. Brandt, K.; Leifert, C.; Sanderson, R.; Seal, C. Agroecosystem management and nutritional quality of plant foods: The case of organic fruits and vegetables. CRC Crit. Rev. Plant Sci. 2011, 30, 177–197. [Google Scholar] [CrossRef]
  25. Mazzoncini, M.; Antichi, D.; Silvestri, N.; Ciantelli, G.; Sgherri, C. Organically vs conventionally grown winter wheat: Effects on grain yield, technological quality, and on phenolic composition and antioxidant properties of bran and refined flour. Food Chem. 2015, 175, 445–451. [Google Scholar] [CrossRef] [PubMed]
  26. The Polish Committee for Standarization. Polish Norm: Fruits and Vegetable Juices—Determination of Dry Matter—Gravimetric Method; PN-EN 12145 2001; The Polish Committee for Standarization: Warsaw, Poland, 2001. [Google Scholar]
  27. Hallmann, E.; Kazimierczak, R.; Marszałek, K.; Drela, N.; Kiernozek, E.; Toomik, P.; Matt, D.; Luik, A.; Rembiałkowska, E. The nutritive value of organic and conventional white cabbage (Brassica oleracea L. var. Capitata) and anti-apoptotic activity in gastric adenocarcinoma cells of sauerkraut juice produced therof. J. Agric. Food Chem. 2017, 65, 8171–8183. [Google Scholar] [CrossRef] [PubMed]
  28. Spanjer, M.; Rensen, P.; Scholten, J. LC-MS/MS multi-method for mycotoxins after single extraction, with validation data for peanut, pistachio, wheat, maize, cornflakes, raisins and figs. Food Addit. Contam. Part A Chem. Anal. Control. Expo. Risk Assess. 2008, 25, 472–489. [Google Scholar] [CrossRef]
  29. Wenzl, T.; Haedrich, J.; Schaechtele, A.; Robouch, P.; Stroka, J. Guidance Document for the Estimation of LOD and LOQ for Measurements in the Field of Contaminants in Feed and Food; Publications Office of the European Union: Luxembourg, 2016; pp. 7–32. [Google Scholar]
  30. Idehen, E.; Tang, Y.; Sang, S. Bioactive phytochemicals in barley. J. Food Drug Anal. 2017, 25, 148–161. [Google Scholar] [CrossRef] [Green Version]
  31. Carvalho, D.O.; Curto, A.F.; Guido, L.F. Determination of phenolic content in different barley varieties and corresponding malts by liquid chromatography-diode array detection-electrospray ionization tandem mass spectrometry. Antioxidants 2015, 4, 563–576. [Google Scholar] [CrossRef] [Green Version]
  32. Rasane, P.; Jha, A.; Sabikhi, L.; Kumar, A.; Unnikrishnan, V.S. Nutritional advantages of oats and opportunities for its processing as value added foods—A review. J. Food Sci. Technol. 2013, 52, 662–675. [Google Scholar] [CrossRef] [Green Version]
  33. Chen, C.; Wang, L.; Wang, R.; Luo, X.; Li, Y.; Li, J.; Li, Y.; Chen, Z. Phenolic contents, cellular antioxidant activity and antiproliferative capacity of different varieties of oats. Food Chem. 2018, 239, 260–267. [Google Scholar] [CrossRef]
  34. Agati, G.; Tattini, M. Multiple functional roles of flavonoids in photoprotection. New Phytol. 2010, 186, 786–793. [Google Scholar] [CrossRef]
  35. Knekt, P.; Kumpulainen, J.; Järvinen, R.; Rissanen, H.; Heliövaara, M.; Reunanen, A.; Hakulinen, T.; Aromaa, A. Flavonoid intake and risk of chronic diseases. Am. J. Clin. Nutr. 2002, 76, 560–568. [Google Scholar] [CrossRef] [Green Version]
  36. Xu, B.; Chang, S.K.C. Comparative study on antiproliferation properties and cellular antioxidant activities of commonly consumed food legumes against nine human cancer cell lines. Food Chem. 2012, 134, 1287–1296. [Google Scholar] [CrossRef] [PubMed]
  37. Bloksma, J.; Northolt, M.; Huber, M.; van der Burgt, G.J.; van de Vijver, L. A new food quality concept based on life processes. In Handbook of Organic Food Safety and Quality; Cooper, J., Niggli, U., Leifert, C., Eds.; Woodhead Publishing Limited: Cambridge, England, 2007; pp. 53–73. ISBN 978-0-8493-9154-5. [Google Scholar]
  38. Klepacka, J.; Gujska, E.; Michalak, J. Phenolic compounds as cultivar- and variety-distinguishing factors in some plant products. Plant Foods Hum. Nutr. 2011, 66, 64–69. [Google Scholar] [CrossRef] [PubMed] [Green Version]
  39. Vollmannova, A.; Margitanova, E.; Tóth, T.; Timoracká, M.; Urminska, D.; Bojnanska, T.; Čičová, I. Cultivar influence on total polyphenol and rutin contents and total antioxidant capacity in buckwheat, amaranth, and quinoa seeds. Czech J. Food Sci. 2013, 31, 589–595. [Google Scholar] [CrossRef] [Green Version]
  40. Gałązka, A.; Gawryjołek, K.; Zuchowski, J. Evaluation of the content of phenolic acids and their antioxidant activity in winter cereal seeds. J. Elem. 2012, 22, 593–605. [Google Scholar] [CrossRef]
  41. Wu, G.; Johnson, S.K.; Bornman, J.F.; Bennett, S.J.; Fang, Z. Changes in whole grain polyphenols and antioxidant activity of six sorghum genotypes under different irrigation treatments. Food Chem. 2017, 214, 199–207. [Google Scholar] [CrossRef]
  42. Ndolo, V.U.; Beta, T. Distribution of carotenoids in endosperm, germ, and aleurone fractions of cereal grain kernels. Food Chem. 2013, 139, 663–671. [Google Scholar] [CrossRef]
  43. Roberts, J.; Dennison, J. The photobiology of lutein and zeaxanthin in the eye. J. Ophthalmol. 2015, 2015, 1–8. [Google Scholar] [CrossRef] [Green Version]
  44. Panfili, G.; Fratianni, A.; Irano, M. Improved normal-phase high-performance liquid chromatography procedure for the determination of carotenoids in cereals. J. Agric. Food Chem. 2004, 52, 6373–6377. [Google Scholar] [CrossRef]
  45. The Commission of the European Communities. Commission Regulation (EC) No 1881/2006 of 19 December 2006 setting maximum levels for certain contaminants in foodstuffs. Off. J. Eur. Union 2006, L364, 5–24. [Google Scholar]
  46. Mannaa, M.; Kim, K.D. Influence of temperature and water activity on deleterious fungi and mycotoxin production during grain storage. Mycobiology 2017, 45, 240–254. [Google Scholar] [CrossRef]
  47. Yli-Mattila, T.; Rämö, S.; Hietaniemi, V.; Hussien, T.; Carlobos-Lopez, A.L.; Cumagun, C.J.R. Molecular quantification and genetic diversity of toxigenic fusarium species in Northern Europe as compared to those in Southern Europe. Microorganisms 2013, 1, 162–174. [Google Scholar] [CrossRef] [PubMed]
  48. Czaban, J.; Wróblewska, B.; Sułek, A.; Mikos, M.; Boguszewska, E.; Podolska, G.; Nieróbca, A. Colonisation of winter wheat grain by Fusarium spp. and mycotoxin content as dependent on a wheat variety, crop rotation, a crop management system and weather conditions. Food Addit. Contam. Part A Chem. Anal. Control. Expo. Risk Assess. 2015, 32, 874–910. [Google Scholar] [CrossRef] [PubMed]
Figure 1. PCA biplot showing the relationships between the chemical composition of grains of the studied barley cultivars. Lutein (Lut), β-carotene (B-C), gallic acid (GA), ferulic acid (FA), caffeic acid (CA), t-cinnamic acid (t-CA), sinapic acid (S), p-coumaric acid (p-C), sum of phenolic acids (TPA), quercetin-3-O-glucoside (Q-3-O-R), kaempferol-3-O-glucoside (K-3-O-G), luteolin (L), quercetin (Q), apigenin (Ap), kaempferol (K), total flavonoids (TF), total polyphenols (TP).
Applsci 10 06369 g001
Figure 2. PCA biplot showing the relationships between the chemical composition of grains of the studied oat cultivars. Lutein (Lut), β-carotene (B-C), gallic acid (GA), ferulic acid (FA), caffeic acid (CA), t-cinnamic acid (t-CA), sinapic acid (S), p-coumaric acid (p-C), sum of phenolic acids (TPA), quercetin-3-O-glucoside (Q-3-O-R), kaempferol-3-O-glucoside (K-3-O-G), luteolin (L), quercetin (Q), apigenin (Ap), kaempferol (K), total flavonoids (TF), total polyphenols (TP).
Applsci 10 06369 g002
Figure 3. PCA biplot showing the relationships between the mycotoxins contamination of grains of the studied barley cultivars. Ochratoxin A (OTA), fumonisin B1 (FB1), fumonisin B2 (FB2), zearalenone (ZEN), T-2 toxin (T-2), HT-2 toxin (HT-2), deoxynivalenol (DON), 15-acetylodeoxynivalenol (15-DON).
Applsci 10 06369 g003
Figure 4. PCA biplot showing the relationships between the mycotoxins contamination of grains of the studied oat cultivars. Ochratoxin A (OTA), fumonisin B1 (FB1), fumonisin B2 (FB2), zearalenone (ZEN), T-2 toxin (T-2), HT-2 toxin (HT-2), deoxynivalenol (DON), 15-acetylodeoxynivalenol (15-DON).
Applsci 10 06369 g004
Figure 5. Pearson’s correlations between the concentrations of bioactive compounds (phenolics and carotenoids) identified in barley samples. Color (red/blue) and color intensity indicate the direction and the strength of the association, while size of the circle reflects statistical significance of the correlation (p-value).
Applsci 10 06369 g005
Figure 6. Pearson’s correlations between the concentrations of bioactive compounds (phenolics and carotenoids) identified in oat samples. Color (red/blue) and color intensity indicate the direction and the strength of the association, while size of the circle reflects statistical significance of the correlation (p-value).
Applsci 10 06369 g006
Table 1. Weather conditions in vegetation season of barley and oat cultivation at Chwałowice experimental farm in 2015.
MonthsTemperature (°C)Long-Term Average
Temperature (1871–2000) (°C)
Rainfall (mm)Long-Term Average
Rainfall (1871–2000) (mm)
March5.21.66030
April8.67.75039
May13.013.413957
June17.316.72871
July20.118.33284
August22.417.31475
Table 2. Phenolic acids concentrations (mg 100 g−1) in the grain of 17 barley cultivars grown organically in the controlled field trial in Poland.
Barley CultivarsGallic AcidFerulic AcidCaffeic Acidt-Cinnamic AcidSinapic AcidP-Coumaric AcidSum of Phenolic Acids
Natasia2.12 ± 0.01 1 cdefg 242.87 ± 0.06 a8.37 ± 0.01 g1.82 ± 0.02 de1.51 ± 0.000 ghi7.38 ± 0.13 fg64.08 ± 0.21 a
SU Lolek1.68 ± 0.30 a164.69 ± 18.70 e4.16 ± 0.18 d1.26 ± 0.06 cd1.42 ± 0.013 cd6.89 ± 0.45 efg180.10 ± 18.29 d
Britney1.92 ± 0.12 abcd53.52 ± 7.85 ab1.85 ± 0.50 c2.10 ± 0.13 e1.41 ± 0.007 bc3.8 ± 0.45 a64.60 ± 7.92 a
Ella1.96 ± 0.09 abcde79.30 ± 16.52 abcd5.34 ± 1.16 ef2.05 ± 0.15 e1.52 ± 0.002 hi8.71 ± 2.38 gh98.87 ± 15.55 abc
KWS Dante1.87 ± 0.08 abc106.61 ± 64.51 d4.45 ± 0.16 d1.76 ± 0.31 de1.43 ± 0.009 d8.65 ± 0.81 gh124.77 ± 65.26 c
KWS Atrika1.83 ± 0.07 ab70.13 ± 14.02 abcd1.39 ± 0.03 c0.96 ± 0.10 abc1.46 ± 0.004 e3.87 ± 0.23 a79.64 ± 14.05 ab
Olimpic1.99 ± 0.11 bcdef62.87 ± 4.75 abc4.29 ± 0.36 d1.78 ± 0.47 de1.51 ± 0.004 ghi5.00 ± 0.49 abcd77.45 ± 4.97 ab
Rubaszek2.18 ± 0.13 defg156.34 ± 11.41 e4.59 ± 0.14 de2.07 ± 0.26 e1.43 ± 0.001 d5.33 ± 0.31 abcde171.94 ± 11.08 d
Oberek2.16 ± 0.15 defg66.19 ± 10.00 abc5.71 ± 0.07 f4.20 ± 0.82 f1.53 ± 0.003 i7.49 ± 0.43 fg87.28 ± 11.32 abc
Baryłka2.12 ± 0.13 cdefg61.62 ± 9.67 abc4.32 ± 0.18 d1.37 ± 0.01 cd1.5 ± 0.0190 fgh4.99 ± 1.59 abcd75.91 ± 10.94 ab
Tocada1.99 ± 0.03 bcdef66.96 ± 2.16 abc4.31 ± 0.05 d1.15 ± 0.34 bc1.49 ± 0.007 fg4.44 ± 0.19 ab80.33 ± 2.40 ab
Podarek2.14 ± 0.01 cdefg170.84 ± 0.32 e4.07 ± 0.21 d1.36 ± 0.02 cd1.50 ± 0.027 fgh4.68 ± 0.04 abc184.6 ± 0.15 d
Soldo2.36 ± 0.04 g81.63 ± 2.65 bcd5.83 ± 0.18 f5.46 ± 0.16 g1.73 ± 0.006 j9.39 ± 0.23 h106.4 ± 3.26 bc
Penguin2.24 ± 0.02 efg68.21 ± 13.24 abc4.06 ± 0.03 d2.32 ± 0.08 e1.48 ± 0.003 ef6.79 ± 1.50 def85.1 ± 14.84 ab
Fabienne2.25 ± 0.07 fg97.92 ± 3.56 cd1.19 ± 0.54 bc2.05 ± 0.11 e1.52 ± 0.003 hi5.45 ± 0.31 abcde110.38 ± 4.45 bc
Fariba2.73 ± 0.21 h61.25 ± 5.28 abc0.57 ± 0.16 ab0.59 ± 0.06 ab1.39 ± 0.001 ab6.28 ± 0.09 cdef72.80 ± 5.67 ab
Argento2.35 ± 0.28 g62.19 ± 0.43 abc0.01 ± 0.02 a0.52 ± 0.01 a1.37 ± 0.015 a5.84 ± 0.67 bcdef72.29 ± 1.35 ab
Mean2.11 ± 0.2686.65 ± 41.303.79 ± 2.141.93 ± 1.231.48 ± 0.0806.18 ± 1.80102.15 ± 41.67
1 Data are presented as means ± standard deviations (SD), n = 3; 2 Within columns, mean values followed by different letters (a–j) are significantly different at p < 0.05.
Table 3. Phenolic acids concentrations (mg 100 g−1) in the grain of eight oat cultivars grown organically in the controlled field trial in Poland.
Oat CultivarsGallic AcidFerulic AcidCaffeic Acidt-Cinnamic AcidSinapic Acidp-Coumaric AcidSum of Phenolic Acids
Harnaś1.34 ± 0.01 1 ab 2136.38 ± 16.25 d0.44 ± 0.03 ab0.43 ± 0.02 a1.36 ± 0.001 a4.06 ± 0.23 a144.01 ± 16.48 d
Haker1.49 ± 0.03 c16.15 ± 5.91 a0.38 ± 0.01 ab0.48 ± 0.03 a1.37 ± 0.001 a3.74 ± 0.33 a23.61 ± 6.30 a
Arden1.49 ± 0.07 c125.05 ± 4.69 cd0.34 ± 0.02 ab0.68 ± 0.01 b1.40 ± 0.006 b7.59 ± 0.22 c136.55 ± 4.87 cd
Bingo1.44 ± 0.02 bc20.19 ± 0.63 a0.31 ± 0.06 a0.67 ± 0.08 b1.35 ± 0.001 a7.07 ± 0.09 c31.03 ± 0.77 a
Nawigator1.41 ± 0.06 abc142.69 ± 21.24 d0.53 ± 0.05 b1.01 ± 0.02 c1.48 ± 0.037 c7.35 ± 0.21 c154.48 ± 21.15 d
Krezus1.34 ± 0.10 ab105.02 ± 3.47 bc3.19 ± 0.24 e1.07 ± 0.15 c1.37 ± 0.012 ab6.02 ± 0.85 b118.01 ± 2.60 bc
Pascal1.29 ± 0.06 a100.86 ± 9.26 b0.95 ± 0.01 d0.34 ± 0.02 a1.35 ± 0.002 a5.25 ± 0.31 b110.04 ± 9.66 b
Amant1.46 ± 0.05 bc13.88 ± 0.95 a0.74 ± 0.03 c0.69 ± 0.08 b1.37 ± 0.001 a7.19 ± 0.55 c25.32 ± 1.65 a
Mean1.41 ± 0.0882.43 ± 54.900.93 ± 0.860.67 ± 0.261.38 ± 0.0406.03 ± 1.5192.88 ± 55.22
1 Data are presented as means ± standard deviations (SD), n = 3; 2 Within columns, mean values followed by different letters (a–e) are significantly different at p < 0.05.
Table 4. Flavonoids concentrations (mg 100 g−1) in the grain of 17 barley cultivars grown organically in the controlled field trial in Poland.
Barley CultivarsQuercetin-3-O-RutinosideKaempferol-3-O-GlucosideLuteolinQuercetinApigeninKaempferolSum of Flavonoids
Natasia27.08 ± 0.03 1 g 25.54 ± 0.01 fg1.87 ± 0.00 a2.37 ± 0.03 abc6.16 ± 0.02 ab9.04 ± 0.23 f52.07 ± 0.15 j
SU Lolek14.46 ± 0.55 d3.62 ± 0.45 de2.21 ± 0.18 ab2.15 ± 0.15 a6.14 ± 0.82 ab5.57 ± 0.27 d34.15 ± 1.52 fgh
Britney7.53 ± 1.50 c3.91 ± 0.02 e2.32 ± 0.30 ab2.38 ± 0.12 abc5.77 ± 0.06 a6.03 ± 0.15 d27.94 ± 1.99 bc
Ella17.99 ± 3.48 ef19.43 ± 0.41 j1.75 ± 0.06 a3.63 ± 0.21 fgh7.48 ± 1.37 bc7.21 ± 0.24 e57.50 ± 4.40 k
KWS Dante15.34 ± 0.48 d2.28 ± 0.22 cd1.88 ± 0.03 a2.89 ± 0.29 bcd5.80 ± 0.20 ab2.07 ± 0.10 a30.26 ± 1.31 cd
KWS Atrika6.15 ± 0.08 c0.92 ± 0.32 ab1.81 ± 0.08 a2.01 ± 0.01 a4.71 ± 0.21 a1.88 ± 0.04 a17.48 ± 0.75 a
Olimpic14.86 ± 1.07 d5.48 ± 0.12 fg2.02 ± 0.06 ab2.09 ± 0.09 a5.52 ± 0.32 a1.82 ± 0.00 a31.78 ± 1.30 def
Rubaszek15.75 ± 0.42 de7.48 ± 0.27 h1.97 ± 0.06 a2.64 ± 0.20 abcd5.78 ± 0.30 a2.11 ± 0.10 a35.72 ± 1.34 h
Oberek19.12 ± 0.22 f6.57 ± 0.36 gh3.74 ± 0.10 c3.29 ± 0.44 def8.02 ± 0.33 c2.75 ± 0.09 b43.47 ± 0.38 i
Baryłka14.93 ± 0.55 d6.46 ± 1.16 gh2.24 ± 1.08 ab2.65 ± 0.74 abcd5.65 ± 0.92 a4.43 ± 0.82 c36.36 ± 0.21 h
Tocada14.90 ± 0.15 d4.76 ± 0.92 ef2.08 ± 0.07 ab2.23 ± 0.19 a5.56 ± 0.05 a5.70 ± 0.18 d35.23 ± 0.74 gh
Podarek14.19 ± 0.62 d3.84 ± 1.62 e1.97 ± 0.12 a2.58 ± 0.27 abc5.26 ± 0.01 a3.09 ± 0.57 b30.92 ± 2.66 cde
Soldo19.46 ± 0.55 f11.67 ± 0.32 i4.28 ± 0.55 c3.69 ± 0.13 gh8.52 ± 0.03 cd2.99 ± 0.01 b50.60 ± 0.41 j
Penguin14.17 ± 0.08 d3.96 ± 1.08 e2.01 ± 0.20 ab3.01 ± 0.70 cde9.02 ± 2.53 cd1.96 ± 0.04 a34.12 ± 3.00 fgh
Fabienne5.54 ± 1.62 bc6.49 ± 0.07 gh1.85 ± 0.41 a2.27 ± 0.12 ab10.08 ± 0.76 d1.82 ± 0.13 a28.05 ± 0.13 bc
Fariba3.69 ± 0.48 ab2.14 ± 0.32 bc2.69 ± 0.07 b4.14 ± 0.11 h7.50 ± 0.02 bc9.01 ± 0.12 f29.17 ± 1.07 bcd
Argento2.02 ± 0.05 a0.72 ± 0.05 a3.75 ± 0.10 c2.56 ± 0.04 abc8.11 ± 0.60 c9.13 ± 0.03 f26.28 ± 0.67 b
Means13.36 ± 6.415.60 ± 4.402.38 ± 0.802.74 ± 0.656.77 ± 1.624.51 ± 2.7235.36 ± 10.16
1 Data are presented as means ± standard deviations (SD), n = 3; 2 Within columns, mean values followed by different letters (a–k) are significantly different at p < 0.05.
Table 5. Flavonoids concentrations (mg 100 g−1) in the grain of eight oat cultivars grown organically in the controlled field trial in Poland.
Oat CultivarsQuercetin-3-O-RutinosideKaempferol-3-O-GlucosideLuteolinQuercetinApigeninKaempferolSum of Flavonoids
Harnaś3.30 ± 0.10 1 ab 21.09 ± 0.10 ab2.44 ± 0.24 ab3.38 ± 0.32 a11.93 ± 6.51 b9.96 ± 0.80 ab32.11 ± 5.14 b
Haker3.13 ± 0.03 ab4.06 ± 1.15 de2.38 ± 0.18 a2.97 ± 0.41 a18.42 ± 1.61 c9.36 ± 1.21 ab40.32 ± 2.22 d
Arden3.00 ± 0.05 ab4.66 ± 0.09 e4.95 ± 0.41 c2.95 ± 0.05 a7.94 ± 0.18 ab10.50 ± 0.33 b34.00 ± 1.11 bc
Bingo2.91 ± 0.17 a3.04 ± 0.02 cd4.84 ± 0.02 c2.79 ± 0.14 a6.75 ± 0.14 ab9.70 ± 0.13 ab30.02 ± 0.04 b
Nawigator3.57 ± 0.14 b4.12 ± 1.01 de4.36 ± 0.37 c2.92 ± 0.21 a7.31 ± 0.38 ab10.22 ± 0.45 ab32.49 ± 0.50 b
Krezus11.54 ± 0.72 d3.73 ± 0.37 de3.30 ± 0.79 b2.78 ± 0.38 a6.44 ± 0.47 ab9.99 ± 0.01 ab37.78 ± 0.56 cd
Pascal4.83 ± 0.03 c0.45 ± 0.02 a2.61 ± 0.25 ab2.73 ± 0.42 a4.93 ± 1.18 a8.93 ± 0.69 a24.48 ± 1.73 a
Amant4.21 ± 0.08 c1.92 ± 0.19 bc3.26 ± 0.15 b2.73 ± 0.26 a7.29 ± 0.41 ab9.55 ± 0.48 ab28.95 ± 1.57 ab
Means4.56 ± 2.802.88 ± 1.553.52 ± 1.062.91 ± 0.308.88 ± 4.569.78 ± 0.6732.52 ± 5.08
1 Data are presented as means ± standard deviations (SD), n = 3; 2 Within columns, mean values followed by different letters (a–e) are significantly different at p < 0.05.
Table 6. Total polyphenols, lutein and β-carotene content in grains of barley and oat cultivars grown organically in the controlled field trial in Poland.
CultivarTotal Polyphenols (mg 100 g−1)Lutein (μg kg−1)β-Carotene (μg kg−1)
Barley
Natasia116.15 ± 0.35 1 abc 2834.44 ± 15.02 fgh1.16 ± 0.05 b
SU Lolek214.25 ± 16.77 e810.30 ± 20.20 ef1.06 ± 0.12 b
Britney92.53 ± 9.90 a843.85 ± 32.48 gh1.23 ± 0.13 b
Ella156.37 ± 19.95 d793.22 ± 2.95 de0.96 ± 0.34 ab
KWS Dante155.04 ± 16.57 cd808.20 ± 10.14 def1.16 ± 0.09 b
KWS Atrika97.12 ± 13.31 a860.52 ± 4.54 h0.92 ± 0.21 ab
Olimpic109.24 ± 6.27 ab798.93 ± 5.43 de1.20 ± 0.04 b
Rubaszek207.67 ± 9.74 e596.69 ± 6.60 a0.91 ± 0.02 a
Oberek130.75 ± 11.71 abcd737.59 ± 6.63 c0.89 ± 0.10 b
Baryłka112.27 ± 11.15 ab777.69 ± 4.54 d1.48 ± 0.01 c
Tocada115.56 ± 1.66 abc810.62 ± 23.80 ef1.31 ± 0.13 b
Podarek215.52 ± 2.51 e812.37 ± 10.90 efg1.20 ±0.02 b
Soldo157.00 ± 3.67 d897.34 ± 28.41 i1.72 ± 0.24 c
Penguin119.22 ± 11.84 abcd838.15 ± 20.26 fgh1.56 ± 0.15 b
Fabienne138.43 ± 4.58 bcd858.44 ± 18.11 h1.35 ± 0.05 b
Fariba101.97 ± 6.74 ab852.84 ± 10.05 h1.50 ± 0.14 b
Argento98.57 ± 0.68 a671.03 ± 1.74 b1.22 ± 0.07 b
Mean137.51 ± 42.73800.13 ± 73.361.23 ± 0.31
Oat
Harnaś176.12 ± 11.35 cd688.95 ± 9.95 a1.53 ± 0.11 b
Haker63.93 ± 8.51 a664.29 ± 4.08 a1.61 ± 0.40 a
Arden170.55 ± 5.98 cd652.98 ± 1.19 a0.89 ± 0.02 ab
Bingo61.05 ± 0.73 a686.54 ± 15.04 a1.32 ± 0.39 ab
Nawigator186.97 ± 21.65 d700.71 ± 12.63 a1.19 ± 0.14 ab
Krezus155.79 ± 2.04 bc828.98 ± 35.03 b1.07 ± 0.11 ab
Pascal134.51 ± 11.39 b908.79 ± 33.32 bc0.82 ± 0.57 ab
Amant54.27 ± 3.23 a930.30 ± 1.58 c1.40 ± 0.04 ab
Mean125.40 ± 55.15757.69 ± 83.511.23 ± 0.38
1 Data are presented as means ± standard deviations (SD), n = 3; 2 Within columns, mean values followed by different letters (a–i) are significantly different at p < 0.05.
Table 7. Concentrations (μg kg−1) of mycotoxins found in grains of 17 barley cultivars grown organically in the controlled field trial in Poland.
OTA 1FB1 2FB2 3FB1 + FB2ZEA 4HT-2 5T-2 6HT2 + T2DON 715-AcDON 8
Maximum levels for mycotoxins in cereal grains 95.0- 10--100.0--200.01250.0-
Barley cultivars
Natasia3.48141.37645.34786.71------
SU Lolek2.9083.59393.13476.72------
Britney2.68-289.52289.52------
Ella2.04-197.50197.50------
KWS Dante2.16-181.32181.32------
KWS Atrika1.84-148.48148.48------
Olimpic--89.0389.03------
Rubaszek1.78-72.3972.39------
Oberek1.61-60.5560.55------
Baryłka1.62-52.8552.85------
Tocada1.53-40.9840.98------
Podarek1.50-45.4345.43------
Soldo1.53-33.7433.748.003.423.556.9758.71-
Penguin1.53-30.6130.61------
Fabienne-28.9533.5762.52------
Fariba--26.3426.34-----6.1
Argento1.47-23.1323.13------
Means1.6314.94139.05153.990.470.200.210.413.450.36
1 Ochratoxin A (OTA); 2 Fumonisin B1 (FB1); 3 Fumonisin B2 (FB2); 4 Zearalenone (ZEA); 5 T-2 toxin (T-2); 6 HT-2 toxin (HT-2); 7 Deoxynivalenol (DON); 8 15-Acetylodeoxynivalenol (15-AcDON); 9 Acc. to the Commission Regulation (EC) No. 1881/2006 of 19 December 2006 setting maximum levels for certain contaminants in foodstuffs [45]; 10 Maximum level not set for barley and oat in the EU regulations.
Table 8. Concentrations (μg kg−1) of mycotoxins found in grains of 8 oat cultivars grown organically in the controlled field trial in Poland.
OTA 1FB1 2 FB2 3FB1 + FB2 ZEA 4HT-2 5T-2 6HT2 + T2DON 715-AcDON 8
Maximum levels for mycotoxins in cereal grains 95.0- 10--100.0--200.01250.0-
Oat cultivars
Harnaś2.02-69.7269.72------
Haker1.93-52.0752.07------
Arden1.80-49.4849.48-----2.28
Bingo1.51-36.0736.07------
Nawigator1.71-38.9038.90------
Krezus1.42-33.2733.27------
Pascal1.49-33.7533.75------
Amant----------
Means1.490.0039.1639.160.000.000.000.000.000.29
1 Ochratoxin A (OTA); 2 Fumonisin B1 (FB1); 3 Fumonisin B2 (FB2); 4 Zearalenone (ZEA); 5 T-2 toxin (T-2); 6 HT-2 toxin (HT-2); 7 Deoxynivalenol (DON); 8 15-Acetylodeoxynivalenol (15-AcDON); 9 Acc. to the Commission Regulation (EC) No. 1881/2006 of 19 December 2006 setting maximum levels for certain contaminants in foodstuffs [45]; 10 Maximum level not set for barley and oat in the EU regulations.

