Abstract
Current trends in designing medical and tissue engineering systems rely on the incorporation of micro- and nano-topographies for inducing a specific cellular response within the context of an aimed application. As such, dedicated studies have recently focused on understanding the possible effects of high and low density packed topographies on the behavior of epithelial cells, especially when considering their long-term viability and functionality. We proposed to use stair-like designed topographies with three different degrees of distribution, all created in polydimethylsiloxane (PDMS) as active means to monitor cell behavior. Our model cellular system was human bronchial epithelial cells (BEAS-2B), a reference line in the quality control of mesenchymal stem cells (MSCs). PDMS microtextured substrates of 4 µm square unit topographies were created using a mold design implemented by a KrF Excimer laser. Varying the spacing between surface features and their multiscale level distribution led to irregular stairs/lines in low, medium and high densities, respectively. Profilometry, scanning electron and atomic force microscopy, contact angle and surface energy measurements were performed to evaluate the topographical and interface characteristics of the designed surfaces, while density-induced cellular effects were investigated using traditional cell-based assays. Our analysis showed that microstructure topographical distribution influences the adhesion profiles of epithelial cells. Our analysis hint that epithelial organoid formation might be initiated by the restriction of cell spreading and migration when using user-designed, controlled micro-topographies on engineered surfaces.
1. Introduction
Besides composition, topography represents another key factor in research aimed at categorizing and influencing the hierarchical organization of cells into distinct tissue [1]. Studies showed that topography plays a crucial role in initiating processes required for inducing and maintaining a specific cellular response or tissue-related activities, for instance. Specifically, recent trends in tissue engineering technologies [2] have focused on understanding such organization and how could it be designed to instill both nano to macroscale functionality when cell adhesion and orientation are considered [3,4,5]. For instance, various studies have evaluated both specific topography and cell functionality for understanding cellular activity towards a desired response, with most of these studies using macrophages, osteoblasts, mesenchymal stem cells (MSCs), and fibroblasts, etc. [6,7,8]. In other analyses, topographic organization has been used to modulate the phenotype of osteoblasts [9] and fibroblasts [10,11]. More recently, additional reports evaluated how surface topography affects epithelial tissue functionality [12,13,14,15]. The additional focus on epithelial cells was motivated by several factors including their known roles in maintaining the integrity and functionality of a tissue to be translated to artificial tissue [16] formation, their demonstrated abilities to create biochemical gradients to help guide cell positioning into a specific location [17] or potential to serve as a model system for stem cells’ analysis [18,19]. Immortalized human bronchial epithelial cells (BEAS-2B), for instance, are now established as non-tumorigenic epithelial cell lines from human bronchial epithelium and are used as an in vitro cell model for respiratory diseases studies [20] or more recently, as a model for human umbilical cord-derived MSCs cell lines [18,19]. Cell-specific expression profiles of surface markers, the exhibition of similar osteogenic and adipogenic differentiation potential and suppressive activities on proliferation of mitogen-activated total T lymphocytes, but not on type 2 macrophage polarization, have been shown to be extremely beneficial when implementing these cells in artificial tissue function design and structural functionality.
More recent studies showed how using topography with restrictive effects could impact epithelial organoids formation, with such analysis also describing the roles of surface topographies in inducing rapid epithelial polarization and tissue organization [21,22]. For instance, a wire-like topography induced localized restrictive effects on cell spreading [23,24], with cultured human airway epithelial cells (Calu-3) and Madin–Darby canine kidney cells (MDCK-II) forming organoids that closely resembled in vivo morphologies [25]. Notably, in such studies and despite research imposing distinct geometries and mechanical restrictions to cell spreading, the possible effects of high and low densities packed micro topographies have not been fully investigated. Future developments in tissue engineering design and subsequent integration in synthetic applications should consider both cell functionality as well as how surface topographical effects dictate and/or control such functionality.
We hypothesized that a user-directed design strategy could be implemented to define surface topographies to be further used to control the density and functionality of epithelial cells. To demonstrate our hypothesis, we used polydimethylsiloxane (PDMS) replicated microtextured substrates with three degrees of densities and depths, all designed by the user, and evaluated the early response and organization of BEAS-2B cells exposed to such surfaces. The choice of PDMS was motivated by its known biocompatibility and ease in implementation for creation of engineered cellular scaffolds [26,27]. The user-defined topographies were created with a mold polycarbonate (PC)-replication and a KrF excimer laser [6,28], with the design allowing not only for organization of square micrometric base units (depth/height and width, of the 250 nm/4 µm square side sizes), but further, for controlled spacing and distribution on multiscale levels of such features.
Our analysis of BEAS-2B cell number showed that surface topography is essential in both controlling cell activity as well as its organization; for instance, the surface that had a rarer distribution of the step-like structures allowed for the agglomeration of cells to support the hypothesis that epithelial organoid formation might be initiated by the restriction of cell spreading and migration.
Our results offer additional perspectives for future tissue constructs formation, with such perspectives being supported by the intensive user-directed role when scaffold formation and organization are envisioned.
2. Materials and Methods
2.1. Substrate Fabrication
Textured substrates were obtained by replication in polydimethylsiloxane (PDMS; Sylgard 184 Silicone Elastomer Kit; Dow Corning, USA MI,; 1:10) using polycarbonate (PC) multi-scaled molds micromachined by a projection laser ablation system equipped with a KrF excimer laser (Exitech PPM-601E Gen6 Tool, Oxford, UK), (20 ns pulse, 248 nm wavelength, 50 Hz repetition rate, average fluence at the substrate level 400 mJ cm−2 per pulse), as described in [6,28]. Briefly, the laser beam was collimated on a grey level mask, focused on the PC substrate, with the de-magnification factor of 5, and the mask was moved in a controlled manner under the beam to lead to a design on a 1 cm2 area. The residual ablated particles were aspired during the texturing process. Before being used for replication, the PC molds were cleaned by ultrasonication for 10 min, sequentially, in isopropyl alcohol (IPA)(Chemical Company, Iasi, Romania) and Millipore ultrapure water (R = 18 MΩ), followed by their subsequent drying with an air gun.
The liquid PDMS obtained from mixing the two above components was placed onto the PC mold for 48 h at room temperature, and then heated at 80 °C for 1 h [29,30]. The resulting PDMS samples were subsequently removed from the mold and cleaned by ultrasonication, twice, with each 10 min cleaning step being performed in Millipore ultrapure water. Three degrees of densities were created using the mold design, with 4 µm2 units and varying the spacing between the features and their disposal at multiscale levels; specifically, irregular stairs/lines in low, medium and high densities were created [28]. Such structures were further referred to as low-density square unit-LDSU, medium density square unit-MDSU and high-density square unit-HDSU, respectively (Supplementary Materials Figure S1).
2.2. Substrates Topography Characterization
The morphology of the PDMS samples was characterized using optical and scanning electron microscopy (i.e., OM and SEM, respectively), as well as atomic force microscopy (i.e., AFM). SEM investigations were performed using a scanning electron microscope (JSM-531 Inspect S Electron Scanning Microscope, FEI Company, Hillsboro, OR, USA), at accelerating voltages between 5 and 25 kV after the samples were coated with a 10 nm thin gold layer deposited using a sputter coater (Agar Scientific Ltd, Essex, UK).
All AFM investigations were performed using a XE100 AFM from Park Systems, Suwon, South Korea, in ambient conditions. Topography analysis was evaluated in non-contact mode. PDMS samples’ elastic flexibility and AFM tip adhesion to the PDMS surfaces were determined by force versus distance measurements, at three points situated at different heights, all randomly chosen [31] (Supplementary Materials Figure S2). Silicon tips with a resonance frequency of approximately 70 kHz and an elastic constant of 2 N∙m-1 were used. Height between two primary units (high and an intermediate), as well as between the intermediate and a shallow one, respectively, were measured using contact mode.
The surface of PDMS samples was also evaluated using a profilometer (P-7 stylus profiler, KLA, Milpitas, CA, USA) to help determine the distribution of the height profiles as created using the molds. The profilometer was equipped with a diamond tip and a radius of 2 µm. For analysis, the sample areas of 400 × 400 mm2 with a distance of 10 µm between adjacent profiles, at a scanning rate of 100 µm/s, and an applied mass of 0.5 mg, were used. The results were analyzed via APEX 3D BASIC V7USA, (Milpitas, CA, USA) dedicated software and the density of square unit per surface area was calculated using the Abbott–Firestone algorithm, a cumulative probability density function of the total measured heights [32,33,34].
2.3. Wetting Behavior
The hydrophobicity of the PDMS samples (with different topographical characteristics) was evaluated by contact angle measurements when using a KSV CAM101 microscope (KSV Instruments Ltd., Espoo, Finland) equipped with a video camera and FireWire interface which allowed the acquisition of images with a resolution of 640 × 480 pixels. For this, the sessile drop method was applied at constant room temperature (20 °C) by using a syringe containing Millipore water and di-iodomethane (Sigma Aldrich, St. Louis, MO, USA). The reported values were obtained from three independent measurements made on different areas of each sample. Surface free energy (SFE) was also evaluated and the two wetting agents, namely water and di-iodomethane, were obtained using the Owens, Wendt, Rabel and Kaelble (OWRK) method [35,36,37].
2.4. In Vitro Studies
PDMS samples were sterilized in 70% ethanol for 1 h. For cell culture experiments, samples were washed twice with sterile warm phosphate buffered saline solution (i.e., PBS Fisher Scientific, USA), pH = 7.4 prior to cell seeding. Immortalized human bronchial epithelial cells (BEAS-2B) from American Type Culture Collection (ATCC, USA) were cultured in 100 mm dishes (Corning, Inc., Corning, NY, USA) in Dulbecco’s Modified Eagle Medium (DMEM) containing 5% Fetal Bovine Serum (FBS), 1% L-glutamine, and 1 % penicillin–streptomycin (all reagents were purchased from Life Technologies, USA). The cells were incubated at 37 °C, 5% CO2, and in an 80% relative humidity; consistent sub-culturing took place using 0.05 or 0.25% trypsin (Invitrogen). Before each experiment, cells were grown to a monolayer of 90–100% confluency and cells in the 3rd–6th passage were used. Experiments were performed in replicates, in three different blocks designs.
2.5. Cell viability analysis
BEAS-2B cells were seeded onto the samples, overnight, at a density of 2.5 × 10⁵ cells/mL. Subsequently, the cells were incubated with 10 µg∙mL-1 of Hoechst 33,342 (Molecular Probes, Eugene, OH, USA) for 30 min at 37 °C and then analyzed using fluorescence microscopy (Leica Microsystems, Wetzlar, Germany) to assess the percentage of intensely condensed chromatin and/or fragmented nuclei. The apoptotic percentage was calculated as the percentage of cells with apoptotic nuclei over the total number of cells, both per field of view. Experiments were performed in replicates, in three different block designs.
3. Results and Discussion
It has been demonstrated that cells assemble into structures that mimic surface’s topographies, with such structure formation relying on specific cellular responses to external cues [1,2,3,4]. In our work, we hypothesized that, by providing surface topographies of random distribution in low (LDSU), medium (MDSU) and high densities (HDSU), a user-controlled effect is induced on exposed epithelial cells. It is envisioned that our analysis will be able to shine light onto hierarchical cellular organization and its role in tissues structure formation to be used for future synthetic applications.
3.1. Formation and Characterization of the Micro-Structured Surfaces
We first designed polydimethylsiloxane (PDMS) substrates of known morphologies using replica demolding from a laser textured polycarbonate (PC) substrate. In our approach, the short pulse of 20 ns allowed a non-thermal ablative removal of the mold material and controlled formation of depth profiles with spatial resolution in the order of 0.1 and 1 μm. Scanning electron microscopy (SEM) analysis (Figure 1a–c) and atomic force microscopy (AFM; Figure 1d–f) images allowed the evaluation of such structures and showed surfaces with a base unit of 250 nm/4 µm square side size with varying spacing between their features. Moreover, analysis showed that such user-designed surfaces displayed multiscale level architectures of well-maintained dispositions (Supplementary Materials Figure S1).

Figure 1.
Scanning Electron Microscopy images of surface structures polydimethylsiloxane (PDMS) (a) Low-density square unit (LDSU), (b) Medium-density square unit (MDSU), and (c) High-density square unit (HDSU), with scale bar of 50 µm. Atomic Force Microscopy images of the PDMS structures of (d) LDSU, (e) MDSU, and (f) HDSU, respectively, with corresponding topographies in 3D and 2D representations combined with a synthetic illumination effect used to enhance the contour of each obtained slope.
The distribution and density of the square units as well as root mean square (RMS) analysis revealed changes in surface roughness values from 11.5 mm for control (flat PDMS) [38,39] to 110.7 nm for the PDMS-LDSU sample (Figure 2a), 226.9 nm for the PDMS-MDSU (Figure 2b), and 358.4 nm for the PDMS-HDSU sample (Figure 2c), respectively.
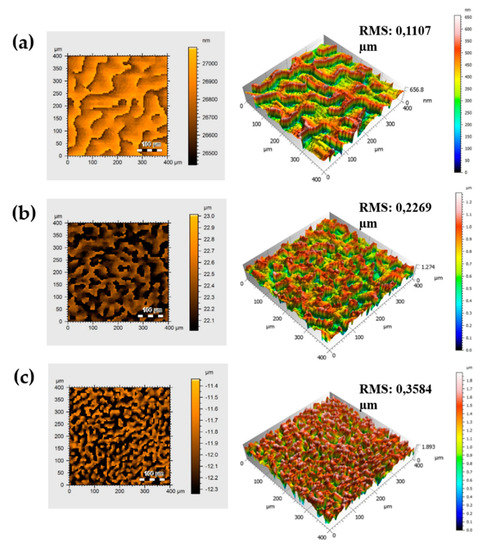
Figure 2.
Profilometry analysis of the PDMS samples; top view results on the left-side and 3D maps on the right-side together with root mean square (RMS) values for: (a) LDSU; (b) MDSU and (c) HDSU, respectively.
Sample microstructure height values were evaluated by the Abbott–Firestone algorithm and are revealed in Figure 3. As shown, for the PDMS-LDSU (Figure 3a), the predominant depths values were in the 0.164–0.330 µm range, while the ranges for PDMS-MDSU (Figure 3b) and PDMS-HDSU (Figure 3c) samples were between 0.320–0.640 and 0.200–0.670 µm, respectively. Further, analysis showed that PDMS–MDSU and PDMS–HDSU samples had approximately the same height of their surface structures, while PDMS–LDSU showed the smallest height structures.
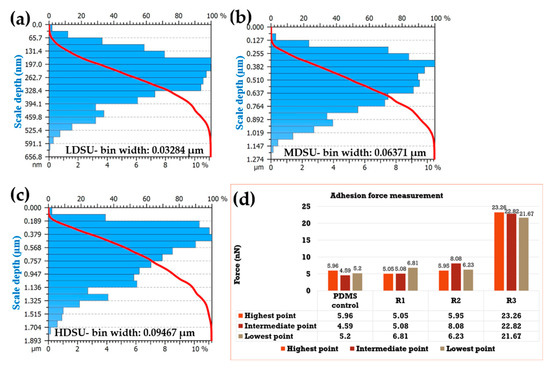
Figure 3.
Distribution of PDMS depths: (a) LDSU; (b) MDSU and (c) HDSU. The obtained histograms show the depth values on the vertical left-side; each histogram contains a number of 20 bins, with the bin width of 0.03284 µm (a-PDMS–LDSU), 0.06371 µm (b-PDMS–MDSU) and 0.09467 µm (c-PDMS–HDSU), respectively. The bin widths were assigned automatically by the software (APEX 3D BASIC software analyses V7, Digital Surf, Besançon, France, 2016, approved by ISO 25178). (d) Histogram representation showing the adhesion force values of the different PDMS replicates.
The above results were also confirmed by AFM analysis (Supplementary Materials Figure S3). Specifically, analysis showed a value of 0.67 µm between two primary units (high and an intermediate), as well as between the intermediate and a shallow one for the HDSU probe.
The force–displacement data were further used to estimate the elasticity of the samples; it is known that manipulating substrate’s elasticity or topography could be used to promote organized epitheliogenesis and controlled cell proliferation and differentiation [40,41]. Previous studies have shown that a number of cellular processes including adhesion, migration and proliferation [40] could be influenced by the substrate itself to determine cell fate. Contact mode and force versus distance and tip-substrate adhesion AFM measurements were evaluated at shallow, medium and higher point of each substrate (Supplementary Materials Figure S2), revealing that most significant adhesion forces were held by the HDSU samples whose density of primary units were much higher than compared to the other two surfaces.
Lastly, contact angle measurements and surface free energy analysis were performed to evaluate the degree of contact surface wetting and the hydrophobicity of PDMS, respectively. As shown in Figure 4a, even though the PDMS contact angles changed with the various types of structure densities, all surfaces remained hydrophobic. Analysis also showed that increasing the density of the primary units on the individual PDMS replicas induced an increase in the contact angle value. Our results are in good agreement with the data obtained using the sessile drop technique and reported in literature—i.e., 95.2 ± 0.9 [38]. Surface free energy, as determined by the OWRK method, showed that the energy profiles mimic the hydrophobicity ones. Analysis also showed that, as the polar component increased, the density of the structural units increased, with the exception of HDSU interface that maintained this component close to that of the PDMS used as a control (1.34 mN∙m-1) [42,43]. An increase in the polar component of surface energy (1.55 to 4.59 mN∙m-1) was observed and correlated to the increase in density of structural units for LDSU and MDSU, respectively.
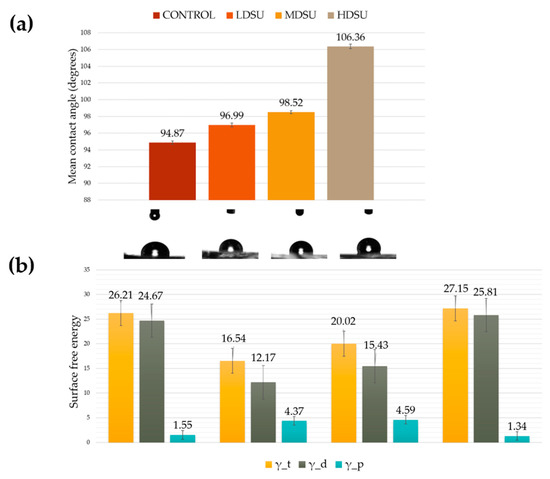
Figure 4.
(a) Histogram showing the contact angle values of PDMS samples. (b) Histogram showing the values of surface energies for the PDMS replicates.
3.2. Evaluation of Cell Behavior on Micro-Structured Surfaces
Above designed and characterized PDMS-based samples were next exposed to human lung epithelial cells (BEAS-2B) with cellular behavior being evaluated after 24, 48 and 72 h, respectively. Such analysis aimed to understand whether the (1) contact orientation can be minimized when structures are distributed to restrict cell spreading, migration and proliferation; (2) intensity, dynamic and reciprocal interactions between cells and topographic models can be achieved when accessibility and flexibility of the substrate are controlled [44]. Using optical microscopy, the influence of the topography on morphological profiles of the cells as well as on the cell numbers was evaluated. Analysis of the surface effects on cell attachment and growth showed a surface-dependent behavior, with trends towards specific cellular density adaptations as related to the LDSU, MDSU or HDSU surface topographies, respectively (Figure 5a–f).
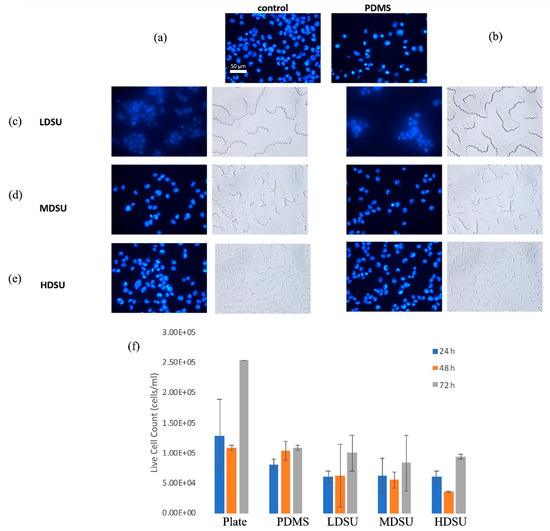
Figure 5.
Fluorescence microscopic images (40×) of Hoechst-labeled BEAS 2B cell nuclei (blue); (a) control cells, cells on control (b) PDMS, (c) LDSU, (d) MDSU, and (e) HDSU samples, respectively. (f) Quantification of BEAS-2B live cells seeded on PDMS microstructures with different topographies (n = 4).
The distribution of attached cells seemed to conform to the surface’s axis of elongation [45]. Briefly, analysis showed that BEAS-2B cells spread on the microstructures of medium heights, avoiding the highest primary units. On a stiff substrate, such as control glass, cells are known to lengthen in the direction of the developing major axis, while on PDMS, a more radial distribution was observed. Cells grown on top of HDSU also seemed to assume a more individual distribution profile, while cells grown on top of LDSU and MDSU had more conglomerated profiles (Supporting Figure S4).
The individual or conglomerate profiles were presumably determined by the overall topography and the amount of interactions between individual cells and respective surfaces. Specifically, close interactions between cells and substrates are known to be essential for improved cellular responses, especially when considering the development of tissue constructs, enhanced cytoskeletal organization, cell growth and cell proliferation, respectively [46]. When comparing the cell numbers for the different surface morphologies (Figure 5f), analysis showed that there was generally a relatively homogenous response of the exposed cells. Specifically, the number of the cells grown on different surfaces showed no significant differences after 24, 48 or 72 h, respectively, all relative to controls. After 24 h, cell activity, however, seemed to decrease on PDMS, regardless of the presence or absence of topographic features; however, at 72 h, the HDSU replica appeared to favor cell proliferation, as shown in Figure 5f and supported by the lower variation in the cell numbers as reported relative to MDSU and LDSU surfaces, respectively [47,48].
Our analyses support that a multi-dimensional design controls cell attachment and implicitly, cell density; moreover, our studies emphasize that, in order to trigger a more localized cellular response, one could use different modulation factors to direct cellular growth and, further, cell proliferation and differentiation. For instance, one could envision topographical features with different growth factors or stimulants to be released upon established cellular contact, to thus provide a localized cell fate response. Lastly, since establishing a strong cellular focal adhesion profile is vital for cell fate, one could also imagine that inter-spacing variation both in y (height) and x (distance) directions would not only establish the density of possible tissue constructs on synthetic surfaces, but further, would allow for a more-directed response to be exploited when tissue constructs are to be formed through synthetic techniques.
4. Conclusions
In this work, user-designed topographies with three different densities were obtained by replication in PDMS; subsequently, the surfaces were used to evaluate the preliminary response of BEAS-2B epithelial cells. SEM, AFM and profilometry analysis showed that the user-designed surfaces displayed multiscale level architectures of well-maintained dispositions (with a base unit of 250 nm/4 µm square side size) with such interfaces being characterized by hydrophobic profiles. Topographic quantifications, contact angles and the surface free energy of the surfaces analyses were shown to support in vitro assays and correlated with the BEAS-2B epithelial cell behavior. Taking into account that the microtopography of a substrate is one of the first physical cues to be detected by attaching cells when the organization of a tissue is being considered, the approach presented herein offers exciting perspectives for formation of specific epithelial-type tissue.
Supplementary Materials
The following are available online at https://www.mdpi.com/2076-3417/10/18/6299/s1, Figure S1: Optical microscopy images of the surface of polycarbonate structures (a) LDSU, (b) MDSU, (c) HDSU at 10× magnification, and (d) LDSU, (e) MDSU, (f) HDSU at 40× magnification respectively, Figure S2: Force versus distance curves recorded using contact mode AFM on PDMS replicates; analyses were performed in three zones with different heights being analyzed on (a) PDMS controls, (b) LDSU, (c) MDSU, and (d) HDSU structures respectively, Figure S3: Representative AFM image depicting analysis of distance between high, intermediate (red) and shallow structures (red), Figure S4: Representative images at 24 h for (a) control cells, (b) cells on PDMS, (c) cells on LDSU, (d) cells on MDSU, and (e) cells on HDSU respectively, taken at 10× via use of optical microscopy.
Author Contributions
Conceptualization, V.D. and C.Z.D.; methodology.; investigation, A.B., A.W., V.M. and A.M.; resources; writing—original draft preparation, A.B., V.D. and C.Z.D.; writing—review and editing; supervision, V.D. and C.Z.D. All authors have read and agreed to the published version of the manuscript.
Funding
This research was funded by Sciex-Project 12.313, Nucleu 16N/2019 program and National Science Foundation (NSF) 1454230.
Acknowledgments
Authors acknowledge E. Can Siringil, K. Bohen and P. Hoffmann for the assistance and support for molds obtaining.
Conflicts of Interest
The authors declare no conflict of interest.
References
- Antmen, E. Micro and Nanofabrication methods to control cell-substrate interactions and cell behavior: A review from the tissue engineering perspective. Bioact. Mater. 2018, 3, 355–369. [Google Scholar] [CrossRef]
- Winkler, B.; Aranson, I.S.; Ziebert, F. Confinement and substrate topography control cell migration in a 3D computational model. Commun. Phys. 2019, 2, 82. [Google Scholar] [CrossRef]
- Kim, H.N.; Jiao, A.; Hwang, N.S.; Kim, M.S.; Kang, D.H.; Kim, D.H.; Suh, K.Y. Nanotopography-guided tissue engineering and regenerative medicine. Adv. Drug Deliv. Rev. 2013, 65, 536–558. [Google Scholar] [CrossRef] [PubMed]
- Huang, J.; Chen, Y.; Tang, C.; Fei, Y.; Ruan, D.; Chen, W.; Shen, W.; Wu, H.; Paul, M.E.; Chen, X.; et al. The relationship between substrate topography and stem cell differentiation in the musculoskeletal system. Cell. Mol. Life Sci. 2019, 76, 505–521. [Google Scholar] [CrossRef]
- Sniadecki, N.J.; Desai, R.A.; Ruiz, S.A.; Chen, C.S. Nanotechnology for cell-substrate interactions. Ann. Biomed. Eng. 2006, 34, 59–74. [Google Scholar] [CrossRef] [PubMed]
- Malheiro, V.; Lehner, F.; Dinca, V.; Hoffmann, P.; Maniura-Weber, K. Convex and concave micro-structured silicone controls the shape, but not the polarization state of human macrophages. Biomater. Sci. 2016, 4, 1562–1573. [Google Scholar] [CrossRef] [PubMed]
- Loesberg, W.A.; te Riet, J.; Van Delft, F.; Schön, P.; Figdor, C.; Speller, S.; Loon, J.; Walboomers, X.; Jansen, J. The threshold at which substrate nanogroove dimensions may influence fibroblast alignment and adhesion. Biomaterials 2007, 28, 3944–3951. [Google Scholar] [CrossRef] [PubMed]
- Dinca, V.; Sima, L.; Rusen, L.; Lippert, T.; Bonciu, A.; Dinescu, M.; Farsari, M. Bio-Interfaces Engineering Using Laser-Based Methods for Controlled Regulation of Mesenchymal Stem Cell Response In Vitro. Recent Adv. Biopolym. 2016, 221–251. [Google Scholar] [CrossRef]
- Biggs, M.J.; Richards, R.G.; Gadegaard, N.; Wilkinson, C.D.; Dalby, M.J. The effects of nanoscale pits on primary human osteoblast adhesion formation and cellular spreading. J. Mater. Sci. Mater. Med. 2007, 18, 399–404. [Google Scholar] [CrossRef]
- Curtis, A.S.; Gadegaard, N.; Dalby, M.J.; Riehle, M.O.; Wilkinson, C.D.; Aitchison, G. Cells react to nanoscale order and symmetry in their surroundings. IEEE Trans. Nanobiosci. 2004, 3, 61–65. [Google Scholar] [CrossRef]
- Berry, C. The influence of microscale topography on fibroblast attachment and motility. Biomaterials 2004, 25, 5781–5788. [Google Scholar] [CrossRef] [PubMed]
- Thery, M. Micropatterning as a tool to decipher cell morphogenesis and functions. J. Cell Sci. 2010, 123, 4201–4213. [Google Scholar] [CrossRef] [PubMed]
- Kim, D.H.; Provenzano, P.P.; Smith, C.L.; Levchenko, A. Matrix nanotopography as a regulator of cell function. J. Cell Biol. 2012, 197, 351–360. [Google Scholar] [CrossRef] [PubMed]
- Bettinger, C.J.; Langer, R.; Borenstein, J.T. Engineering substrate topography at the micro-and nanoscale to control cell function. Angew. Chem. Int. Ed. 2009, 48, 5406–5415. [Google Scholar] [CrossRef] [PubMed]
- Wang, Y.; Ahmad, A.A.; Sims, C.E.; Magness, S.T.; Allbritton, N.L. In vitro generation of colonic epithelium from primary cells guided by microstructures. Lab Chip 2014, 14, 1622–1631. [Google Scholar] [CrossRef]
- Vrana, N.E.; Lavalle, P.; Dokmeci, M.R.; Dehghani, F.; Ghaemmaghami, A.M.; Khademhosseini, A. Engineering functional epithelium for regenerative medicine and in vitro organ models: A review. Tissue Eng. Part. B Rev. 2013, 19, 529–543. [Google Scholar] [CrossRef]
- Torras, N.; García-Díaz, M.; Fernández-Majada, V.; Martínez, E. Mimicking Epithelial Tissues in Three-Dimensional Cell Culture Models. Front. Bioeng. Biotechnol. 2018, 6, 197. [Google Scholar] [CrossRef]
- Yamamoto, Y.; Ochiya, T. Epithelial stem cell culture: Modeling human disease and applications for regenerative medicine. Inflamm. Regener. 2017, 37, 3. [Google Scholar] [CrossRef]
- Awatade, N.T.; Wong, S.L.; Hewson, C.K.; Fawcett, L.K.; Kicic, A.; Jaffe, A.; Waters, S.A. Human primary epithelial cell models: Promising tools in the era of cystic fibrosis personalized medicine. Front. Pharmacol. 2018, 9, 1429. [Google Scholar] [CrossRef]
- Han, X.; Na, T.; Wu, T.; Yuan, B.Z. Human lung epithelial BEAS-2B cells exhibit characteristics of mesenchymal stem cells. PLoS ONE 2020, 15, e0227174. [Google Scholar] [CrossRef]
- Huh, D.; Hamilton, G.A.; Ingber, D.E. From 3D cell culture to organs-on chips. Trends Cell Biol. 2011, 21, 745–754. [Google Scholar] [CrossRef]
- Sato, T.; Vries, R.G.; Snippert, H.J.; van de Wetering, M.; Barker, N.; Stange, D.E.; van Es, J.H.; Abo, A.; Kujala, P.; Peters, P.J.; et al. Single Lgr5 stem cells build crypt villus structures in vitro without a mesenchymal niche. Nature 2009, 459, 262–265. [Google Scholar] [CrossRef] [PubMed]
- Piret, G.; Galopin, E.; Coffinier, Y.; Boukherroub, R.; Legrand, D.; Slomianny, C. Culture of mammalian cells on patterned superhydrophilic/superhydrophobic silicon nanowire arrays. Soft Matter 2011, 7, 8642–8649. [Google Scholar] [CrossRef]
- Kim, W.; Ng, J.K.; Kunitake, M.E.; Conklin, B.R.; Yang, P. Interfacing silicon nanowires with mammalian cells. J. Am. Chem. Soc. 2007, 129, 7228–7229. [Google Scholar] [CrossRef]
- Shen, Y.; Hou, Y.; Yao, S.; Huang, P.; Yobas, L. In vitro epithelial organoid generation induced by substrate nanotopography. Sci. Rep. 2015, 5, 9293. [Google Scholar] [CrossRef] [PubMed]
- Chuah, Y.J.; Koh, Y.T.; Lim, K.; Menon, N.V.; Wu, Y.; Kang, Y. Simple surface engineering of polydimethylsiloxane with polydopamine for stabilized mesenchymal stem cell adhesion and multipotency. Sci. Rep. 2015, 5, 18162. [Google Scholar] [CrossRef]
- Torino, S.; Corrado, B.; Iodice, M.; Coppola, G. PDMS-Based Microfluidic Devices for Cell Culture. Inventions 2018, 3, 65. [Google Scholar] [CrossRef]
- Schmidt, A.M.; Fagerer, S.R.; Jefimovs, K.; Buettner, F.; Marro, C.; Siringil, E.C.; Boehlen, K.L.; Pabst, M.; Ibáñez, A.J. Molecular phenotypic profiling of a Saccharomyces cerevisiae strain at the single-cell level. Analyst 2014, 139, 5709–5717. [Google Scholar] [CrossRef]
- Vudayagiri, S.; Yu, L.; Hassouneh, S.; Skov, A. Hot embossing of microstructures on addition curing polydimethylsiloxane films. J. Elastomers Plast. 2013, 46, 623–643. [Google Scholar] [CrossRef]
- Delille, R. Benchtop polymer MEMS. J. Microelectromech. Syst. 2006, 15, 1108–1120. [Google Scholar] [CrossRef]
- Vlassov, S.; Oras, S.; Antsov, M.; Sosnin, I.; Polyakov, B.; Šutka, A.; Krauchanka, M.; Dorogin, L. Adhesion and Mechanical Properties of PDMS-Based Materials Probed with AFM: A Review. Rev. Adv. Mater. Sci. 2018, 56, 62. [Google Scholar] [CrossRef]
- Nita, S.L.; Mihailescu, M.I.; Pau, V.C. Security and cryptographic challenges for authentication based on biometrics data. Cryptography 2018, 2, 39. [Google Scholar] [CrossRef]
- Nita, S.L.; Mihailescu, M.I. On artificial neural network used in cloud computing security—A survey. In Proceedings of the 10th International Conference on Electronics, Computers and Artificial Intelligence (ECAI), Iasi, Romania, 28–30 June 2018; pp. 1–6. [Google Scholar]
- Dumitru, L.A.; Eftimie, S.; Mihailescu, M.I.; Nita, S.L.; Opris, V.; Racuciu, C. A novel architecture for authenticating scalable resources in hybrid cloud. In Proceedings of the 2016 International Conference on Communications (COMM), Bucharest, Romania, 9–10 June 2016; pp. 251–254. [Google Scholar]
- Kaelble, D.H. Dispersion-Polar Surface Tension Properties of Organic Solids. J. Adhesion 1970, 2, 66–81. [Google Scholar] [CrossRef]
- Owens, D.; Wendt, R. Estimation of the Surface Free Energy of Polymers. J. Appl. Polym. Sci. 1969, 13, 1741–1747. [Google Scholar] [CrossRef]
- Rabel, W. Einige aspekte der benetzungstheorie und ihre anwendung auf die untersuchung und veränderung der oberflächeneigenschaften von polymeren. Farbe Lack 1971, 77, 997–1005. [Google Scholar]
- Cordeiro, A.; Zschoche, S.; Janke, A.; Nitschke, M.; Werner, C. Fluorination of poly(dimethylsiloxane) surfaces by low pressure CF4 plasma—Physicochemical and antifouling properties. Express Polym. Lett. 2009, 3, 70–83. [Google Scholar] [CrossRef]
- Raveendran, R.; Namboothiry, M. Surface-treated poly(dimethylsiloxane) as a gate dielectric in solution-processed organic field-effect transistors. ACS Omega 2018, 3, 11278–11285. [Google Scholar] [CrossRef]
- Wang, H.B.; Dembo, M.; Wang, Y.L. Substrate flexibility regulates growth and apoptosis of normal but not transformed cells. Am. J. Physiol. Cell Physiol. 2000, 279, C1345–C1350. [Google Scholar] [CrossRef]
- Pelham, R.J., Jr.; Wang, Y. Cell locomotion and focal adhesions are regulated by substrate flexibility. Proc. Natl. Acad. Sci. USA 1997, 94, 13661–13665. [Google Scholar] [CrossRef]
- Surface Energy Data for PDMS: Polydimethylsiloxane, CAS #9016-00-6, ©2009 Diversified Enterprises. Available online: www.accudynetest.com/polymer_surface_data/polydimethylsiloxane.pdf (accessed on 6 September 2020).
- Khorasani, T.; Kermani, Z. Wettability of porous polydimethylsiloxane surface: Morphology study. Appl. Surf. Sci. 2005, 242, 339–345. [Google Scholar] [CrossRef]
- Xi, W.; Saw, T.B.; Delacour, D.; Lim, C.T.; Ladoux, B. Material approaches to active tissue mechanics. Nat. Rev. Mater. 2019, 4, 23–44. [Google Scholar] [CrossRef]
- Yang, Y.; Wang, K.; Gu, X.; Leong, K.W. Biophysical regulation of cell behavior—Cross talk between substrate stiffness and nanotopography. Engineering 2017, 3, 36–54. [Google Scholar] [CrossRef] [PubMed]
- Dhawan, U.; Pan, H.A.; Lee, C.H.; Chu, Y.H.; Huang, G.S.; Lin, Y.R.; Chen, W.L. Spatial control of cell-nanosurface interactions by tantalum oxide nanodots for improved implant geometry. PLoS ONE 2016, 11, e0158425. [Google Scholar] [CrossRef] [PubMed]
- Schendzielorz, P.; Froelich, K.; Rak, K.; Gehrke, T.; Scherzad, A.; Hagen, R.; Radeloff, A. Labeling Adipose-Derived Stem Cells with Hoechst 33342: Usability and Effects on Differentiation Potential and DNA Damage. Stem Cells Int. 2016, 2016, 6549347. [Google Scholar] [CrossRef]
- Ligasová, A.; Koberna, K. Quantification of fixed adherent cells using a strong enhancer of the fluorescence of DNA dyes. Sci. Rep. 2019, 9, 8701. [Google Scholar] [CrossRef]
© 2020 by the authors. Licensee MDPI, Basel, Switzerland. This article is an open access article distributed under the terms and conditions of the Creative Commons Attribution (CC BY) license (http://creativecommons.org/licenses/by/4.0/).