Article

PMMA Intraocular Lenses Changes after Treatment with Nd:Yag Laser: A Scanning Electron Microscopy and X-ray Spectrometry Study

by
Alessandro Meduri
1,
Alice Antonella Severo
1,
Antonio De Maria
1,
Pietro Perroni
1,
Giuseppe Acri
1,
Barbara Testagrossa
1,
Domenico Puzzolo
1,
Giuseppe Montalbano
2,
Pasquale Aragona
3,* and
Antonio Girolamo Micali
1
1
Department of Biomedical and Dental Sciences and Morphofunctional Imaging, University of Messina, Via Consolare Valeria 1, 98125 Messina, Italy
2
Department of Veterinary Sciences, University of Messina, Annunziata Universitary Pole, Viale Annunziata, 98168 Messina, Italy
3
Department of Biomedical and Dental Sciences and Morphofunctional Imaging, Regional Referral Center for the Ocular Surface Diseases, University of Messina, Via Consolare Valeria 1, 98125 Messina, Italy
*
Author to whom correspondence should be addressed.
Appl. Sci. 2020, 10(18), 6321; https://doi.org/10.3390/app10186321
Submission received: 30 July 2020 / Revised: 2 September 2020 / Accepted: 9 September 2020 / Published: 11 September 2020
(This article belongs to the Section Optics and Lasers)

Abstract

:

Featured Application

The clinical relevance of this experiment is to demonstrate that PMMA lenses have a moderate resistance to laser treatment if they are hit by a low number of spots, but significant structural changes occur when a higher number of spots reach their surface. The effect of multiple laser spots on IOLs is relevant even because this is what may happen in procedures carried out by residents at their early stages of training.

Abstract

Neodymium:yttrium-aluminum-garnet (Nd:YAG) laser may cause intraocular lenses (IOLs) damages. Therefore, the effects of Nd:YAG laser on IOLs were evaluated. Twenty-four IOLs (copolymer of 2-hydroxyethylmethacrylate and 2-ethoxyethylmethacrylate) were used. For scanning electron microscope (SEM), twelve IOLs were divided into three groups: Group 1, controls; Group 2, IOLs treated with two laser spots (YC-1800 Nidek Nd:YAG laser set at 1.2 mJ); and Group 3, IOLs treated with six laser spots. All IOLs were critical point dried in CO2 and viewed in a Zeiss EVO LS10 SEM. For Energy Dispersive X-ray spectrometry (EDX), four IOLs of each group were examined with a Jeol JMC-6000 SEM. With SEM, Group 1 IOLs showed well-preserved size, shape and surface. Group 2 IOLs exhibited normal shape and margins, a peripheral furrow with irregular blebs, straight clefts and holes on the wrinkled surface. Group 3 IOLs were swollen and broken into two or three parts. With SEM and EDX, Group 1 and the undamaged surfaces of Groups 2 and 3 showed evident carbon and oxygen peaks, while, in the damaged areas, both atoms were significantly reduced. Nd:YAG laser induced evident changes in IOLs morphology and organic alterations in their chemistry: great care during posterior capsule opacification treatment is required.

1. Introduction

Cataract is the most common cause of blindness worldwide [1]; its current treatment is the surgical removal and the replacement with an intraocular lens (IOL) [2]. Phacoemulsification is considered the preferred surgical technique [3].
Implanted IOLs are available in four types of optic material: polymethylmethacrylate (PMMA), hydrophilic acrylic, hydrophobic acrylic and hydrophobic silicone. Hydrophobic acrylic IOLs are considered the best recommendation [3].
During the surgical procedure, however, all epithelial cells (LECs) from the lens capsular bag cannot be mechanically removed; as a consequence, the residual equatorial LECs proliferate, migrate, transdifferentiate into myofibroblasts and form posterior capsule opacification (PCO) [4], a fibrotic condition whose incidence is reported between 22.8% and 38.5% in cataract patients [5]. PCO causes light scatter within the visual axis, thus interfering with various aspects of visual function, including glare disability, contrast sensitivity, color and stereoscopic vision [6].
PCO is usually treated with Neodymium:yttrium-aluminum-garnet (Nd:YAG) laser to create an opening in the central posterior lens capsule [7]. This procedure, although considered safe, may lead to some complications, among which intraocular pressure rise, cystoid macular edema, retinal detachment and IOL damage have been described [8].
The effects of Nd:YAG laser treatment on IOLs surface were examined with the scanning electron microscope (SEM) [9,10,11,12]. It was shown that each lens type had different patterns of lesions on their surface: in fact, stellate craters were present in PMMA IOLs, while smooth splash-like craters were demonstrated in silicone IOLs [8]. Furthermore, the role of IOLs material was considered, demonstrating that PMMA IOLs were more resilient to laser damage [13].
However, as far as we know, no data are currently available on the response of the same type of IOLs to the same physical stress after a different number of laser treatments. For this purpose, the effects of critical point drying (CPD), a common and reliable procedure of dehydration of biological samples [14], were studied on PMMA IOLs. Furthermore, IOLs surface around and into the laser-damaged zones was examined with Energy Dispersive X-ray spectrometry (EDX) to evaluate the possible changes in their organic composition.

2. Materials and Methods

2.1. IOLs Characteristics and Treatment

Twenty-four I-stream Microflex (MD Tech, Rome, Italy) IOLs made of a copolymer of 2-hydroxyethylmethacrylate and 2-ethoxyethylmethacrylate (Figure 1) were used. Twelve of these were used for the SEM study, while the other twelve were used for the SEM and EDX analyses. To perform the laser treatment, each single lens was held with forceps in front of the laser beam. To reproduce what could happen in real life treatment for posterior capsule opacification, the IOL was hit by randomly directed spots in the central area of the lens.

2.2. Scanning Electron Microscopy

For SEM, twelve IOLs were divided into three groups of four IOLs each: Group 1, control group; Group 2, IOLs treated with two laser spots; and Group 3, IOLs treated with six laser spots. A YC-1800 Nidek Nd:YAG laser (Nidek Co., Gamagori, Japan) was used for treated groups, set at 1.2 mJ, and the central part of each IOL of Groups 2 and 3 was hit. All IOLs were dehydrated with ethanol, critical point dried in CO2, covered with gold and viewed and photographed in a Zeiss EVO LS10 (Carl Zeiss, Oberkochen, Germany) SEM adjusted at 20 kV. All images were digitized and stored as Tagged Image File Format (TIFF.) files in the microscope computer.

2.3. SEM and EDX Analyses

For EDX, four IOLs of each group were air-dried and examined with a Jeol JMC-6000 (Jeol Co., Akishima, Tokyo, Japan) SEM coupled with the EDX, recording a single spot from the intact surface of Group 1 IOLs. On the contrary, in the damaged IOLs of both Groups 2 and 3, three different spots were recorded: in particular, Spot α was obtained from the undamaged surface, Spot β from the edge of the laser hit and Spot γ from the center of the laser injury.

2.4. Statistical Analysis

The number of counts of carbon (C) and oxygen (O) EDX peaks from all examined IOLs was recorded and the results were analyzed using the ANOVA test for comparison among groups. All data are expressed as mean ± standard deviation (SD) and p ≤ 0.05 was considered statistically significant.

3. Results

3.1. Scanning Electron Microscopy

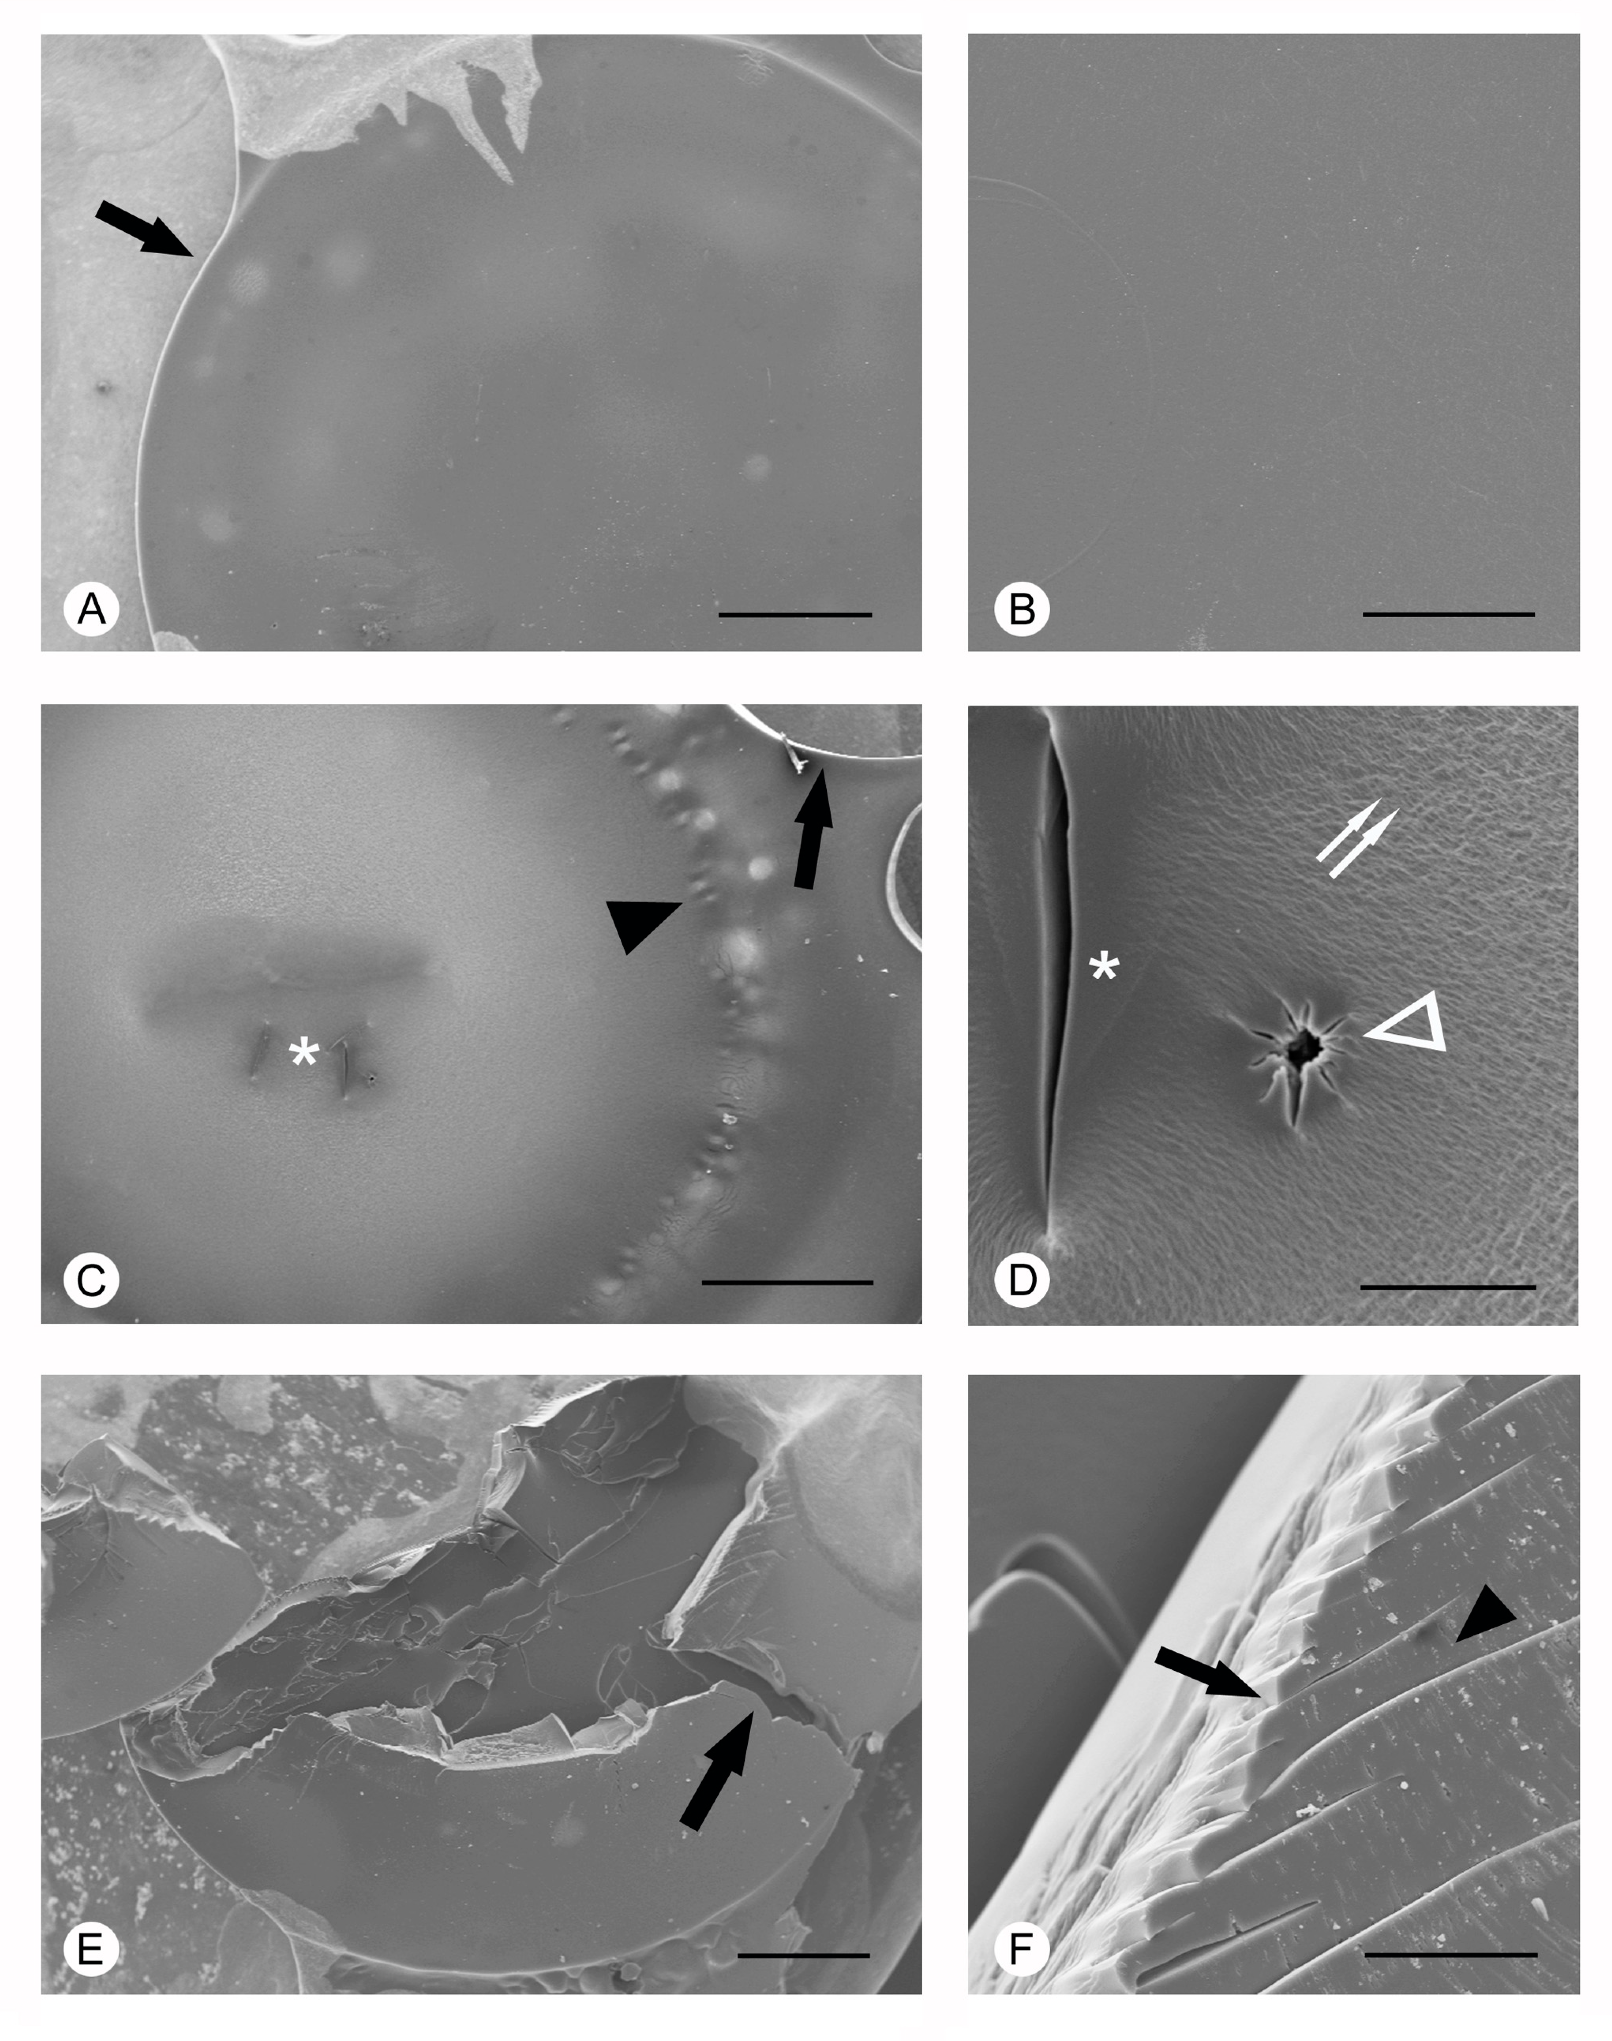
When processed for SEM with CPD, Group 1 IOLs, at both low (Figure 2A) and high (Figure 2B) magnification, showed a normal flat shape, regular margins and smooth surface. Group 2 IOLs maintained a normal shape and regular margins (Figure 2C). However, the peripheral part showed a hollow furrow with small irregular blebs, while, in the central part, the effects of the laser spots were evident. In fact, at higher magnification (Figure 2D), some straight breaking lines and round holes with radial spokes were present. The entire surface was wrinkled. Group 3 IOLs were swollen and broken with many long, irregular breaking lines; the internal part of the IOLs was empty (Figure 2E). At higher magnification (Figure 2F), the lines margins had a saw-tooth course and were formed by flat overlapping leaflets of different length.

3.2. SEM and EDX Analyses

Using SEM and EDX analyses, all IOLs of the same group showed similar values; therefore, a single datum is provided for each considered parameter as mean ± SD.
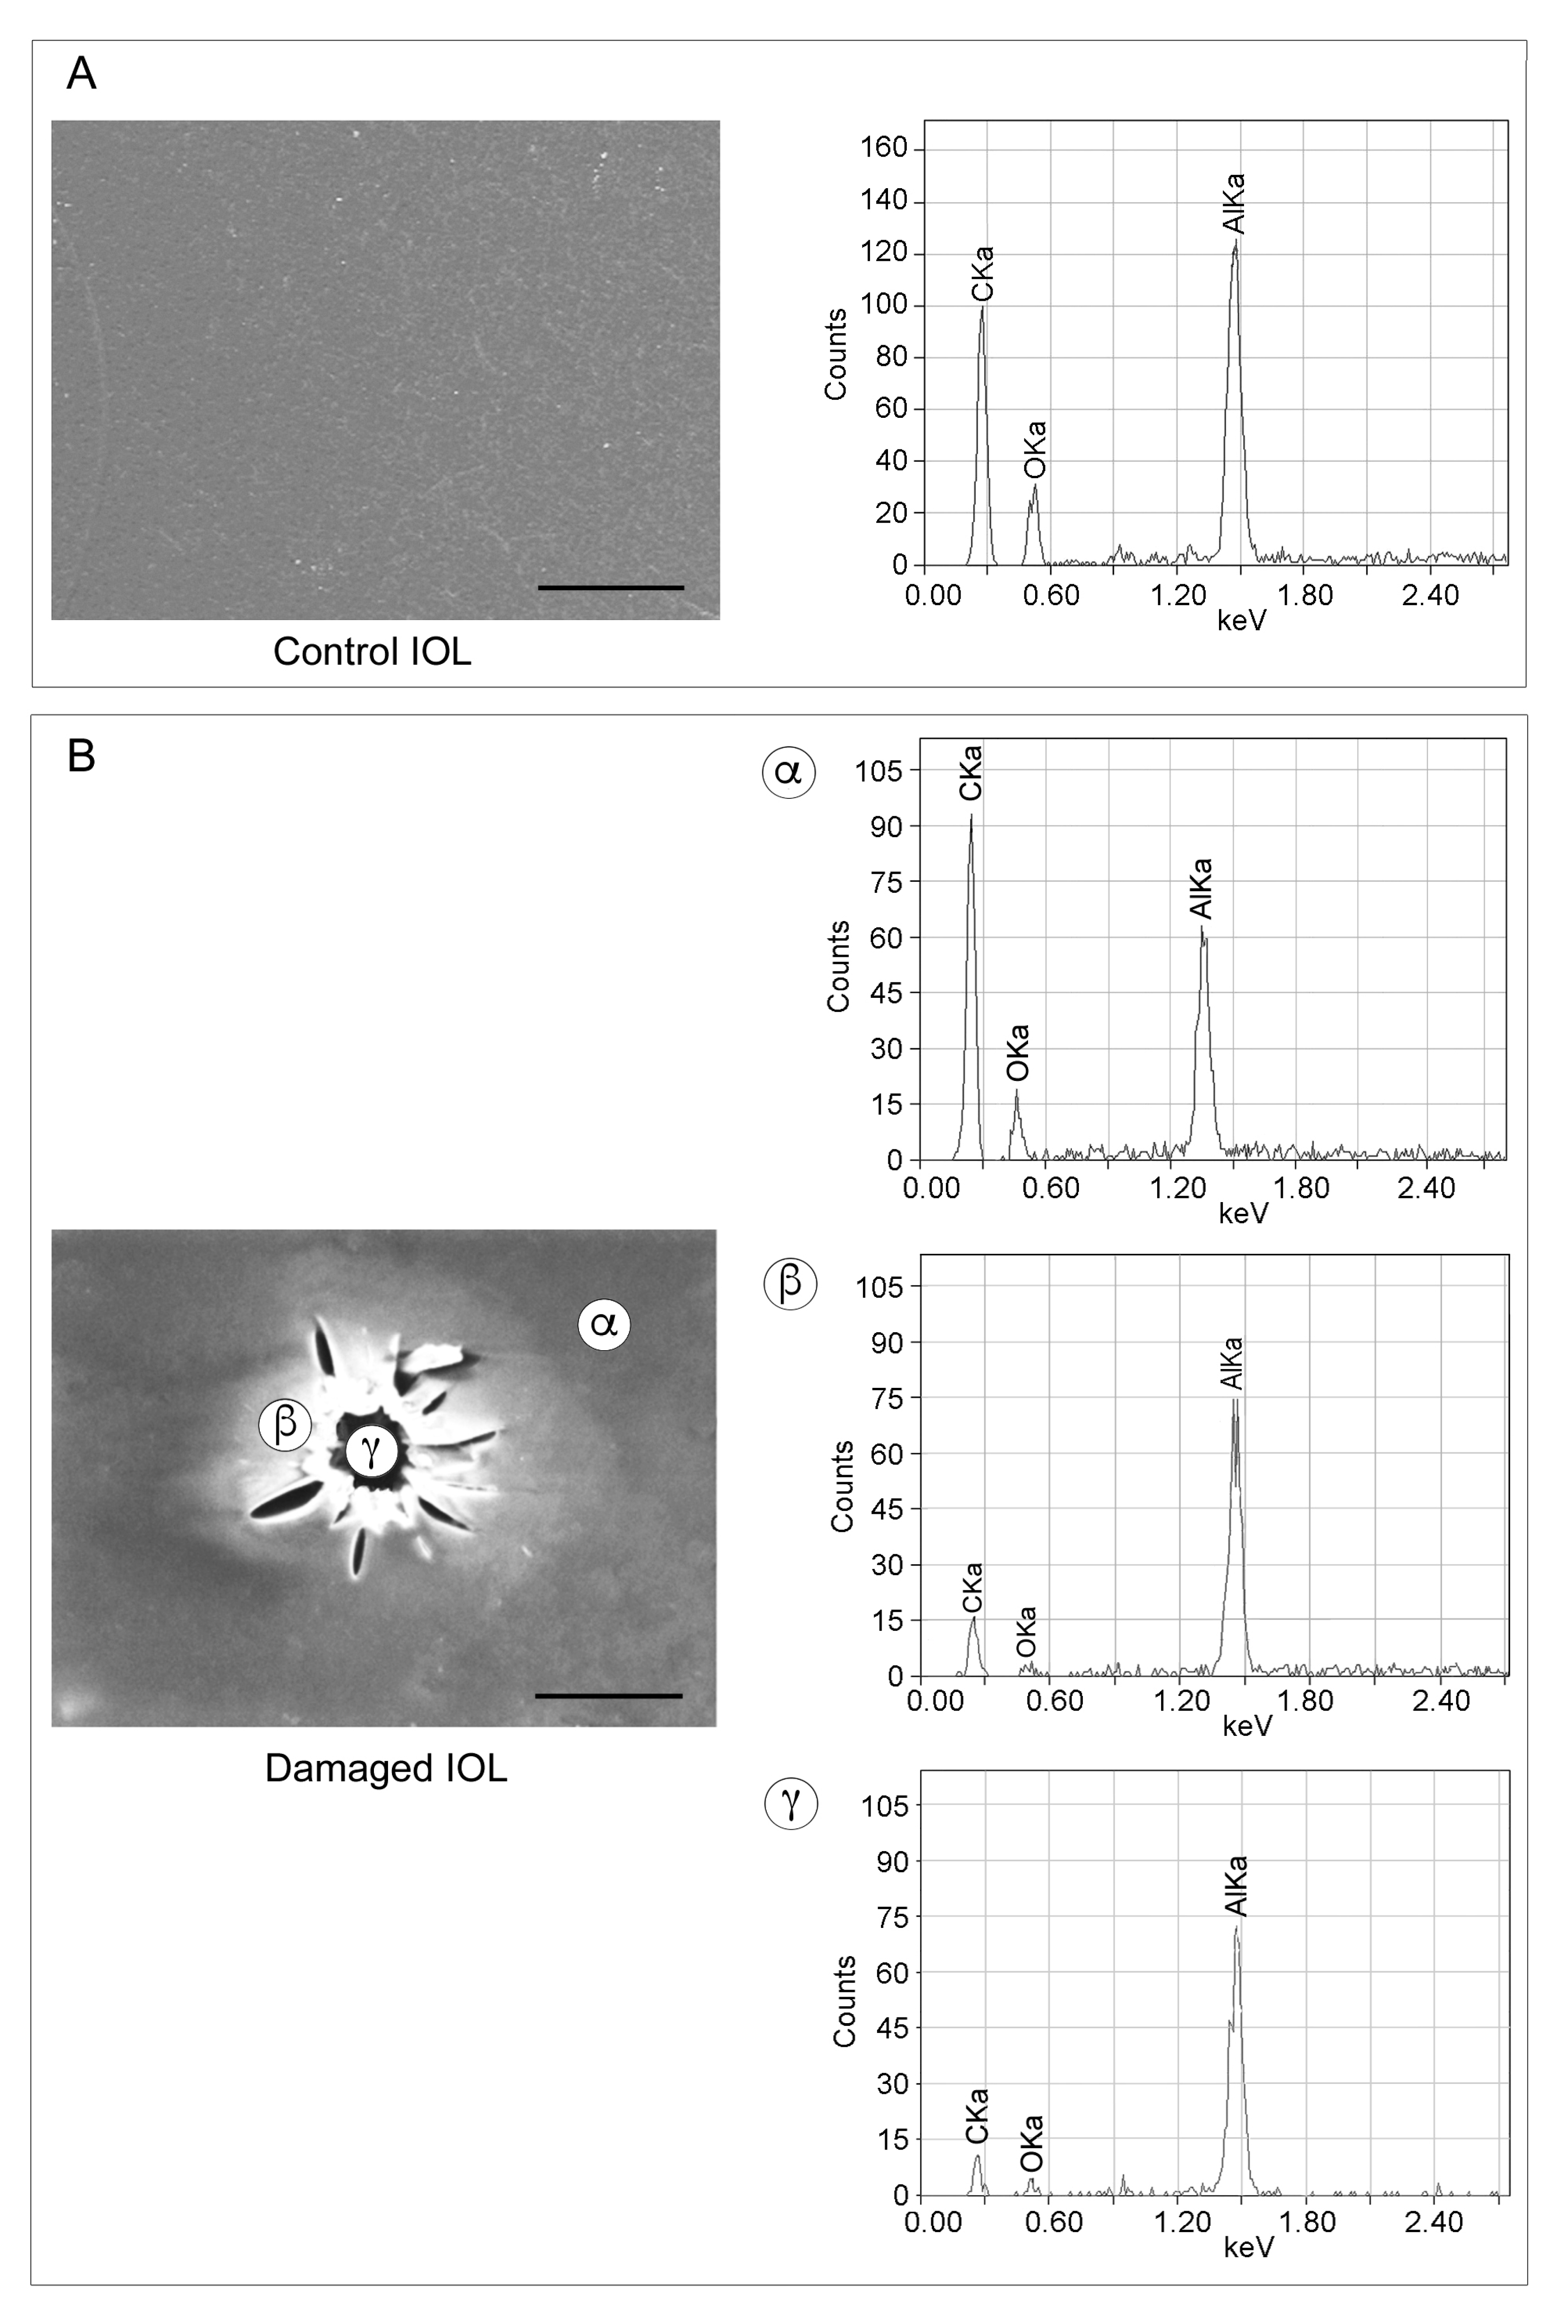
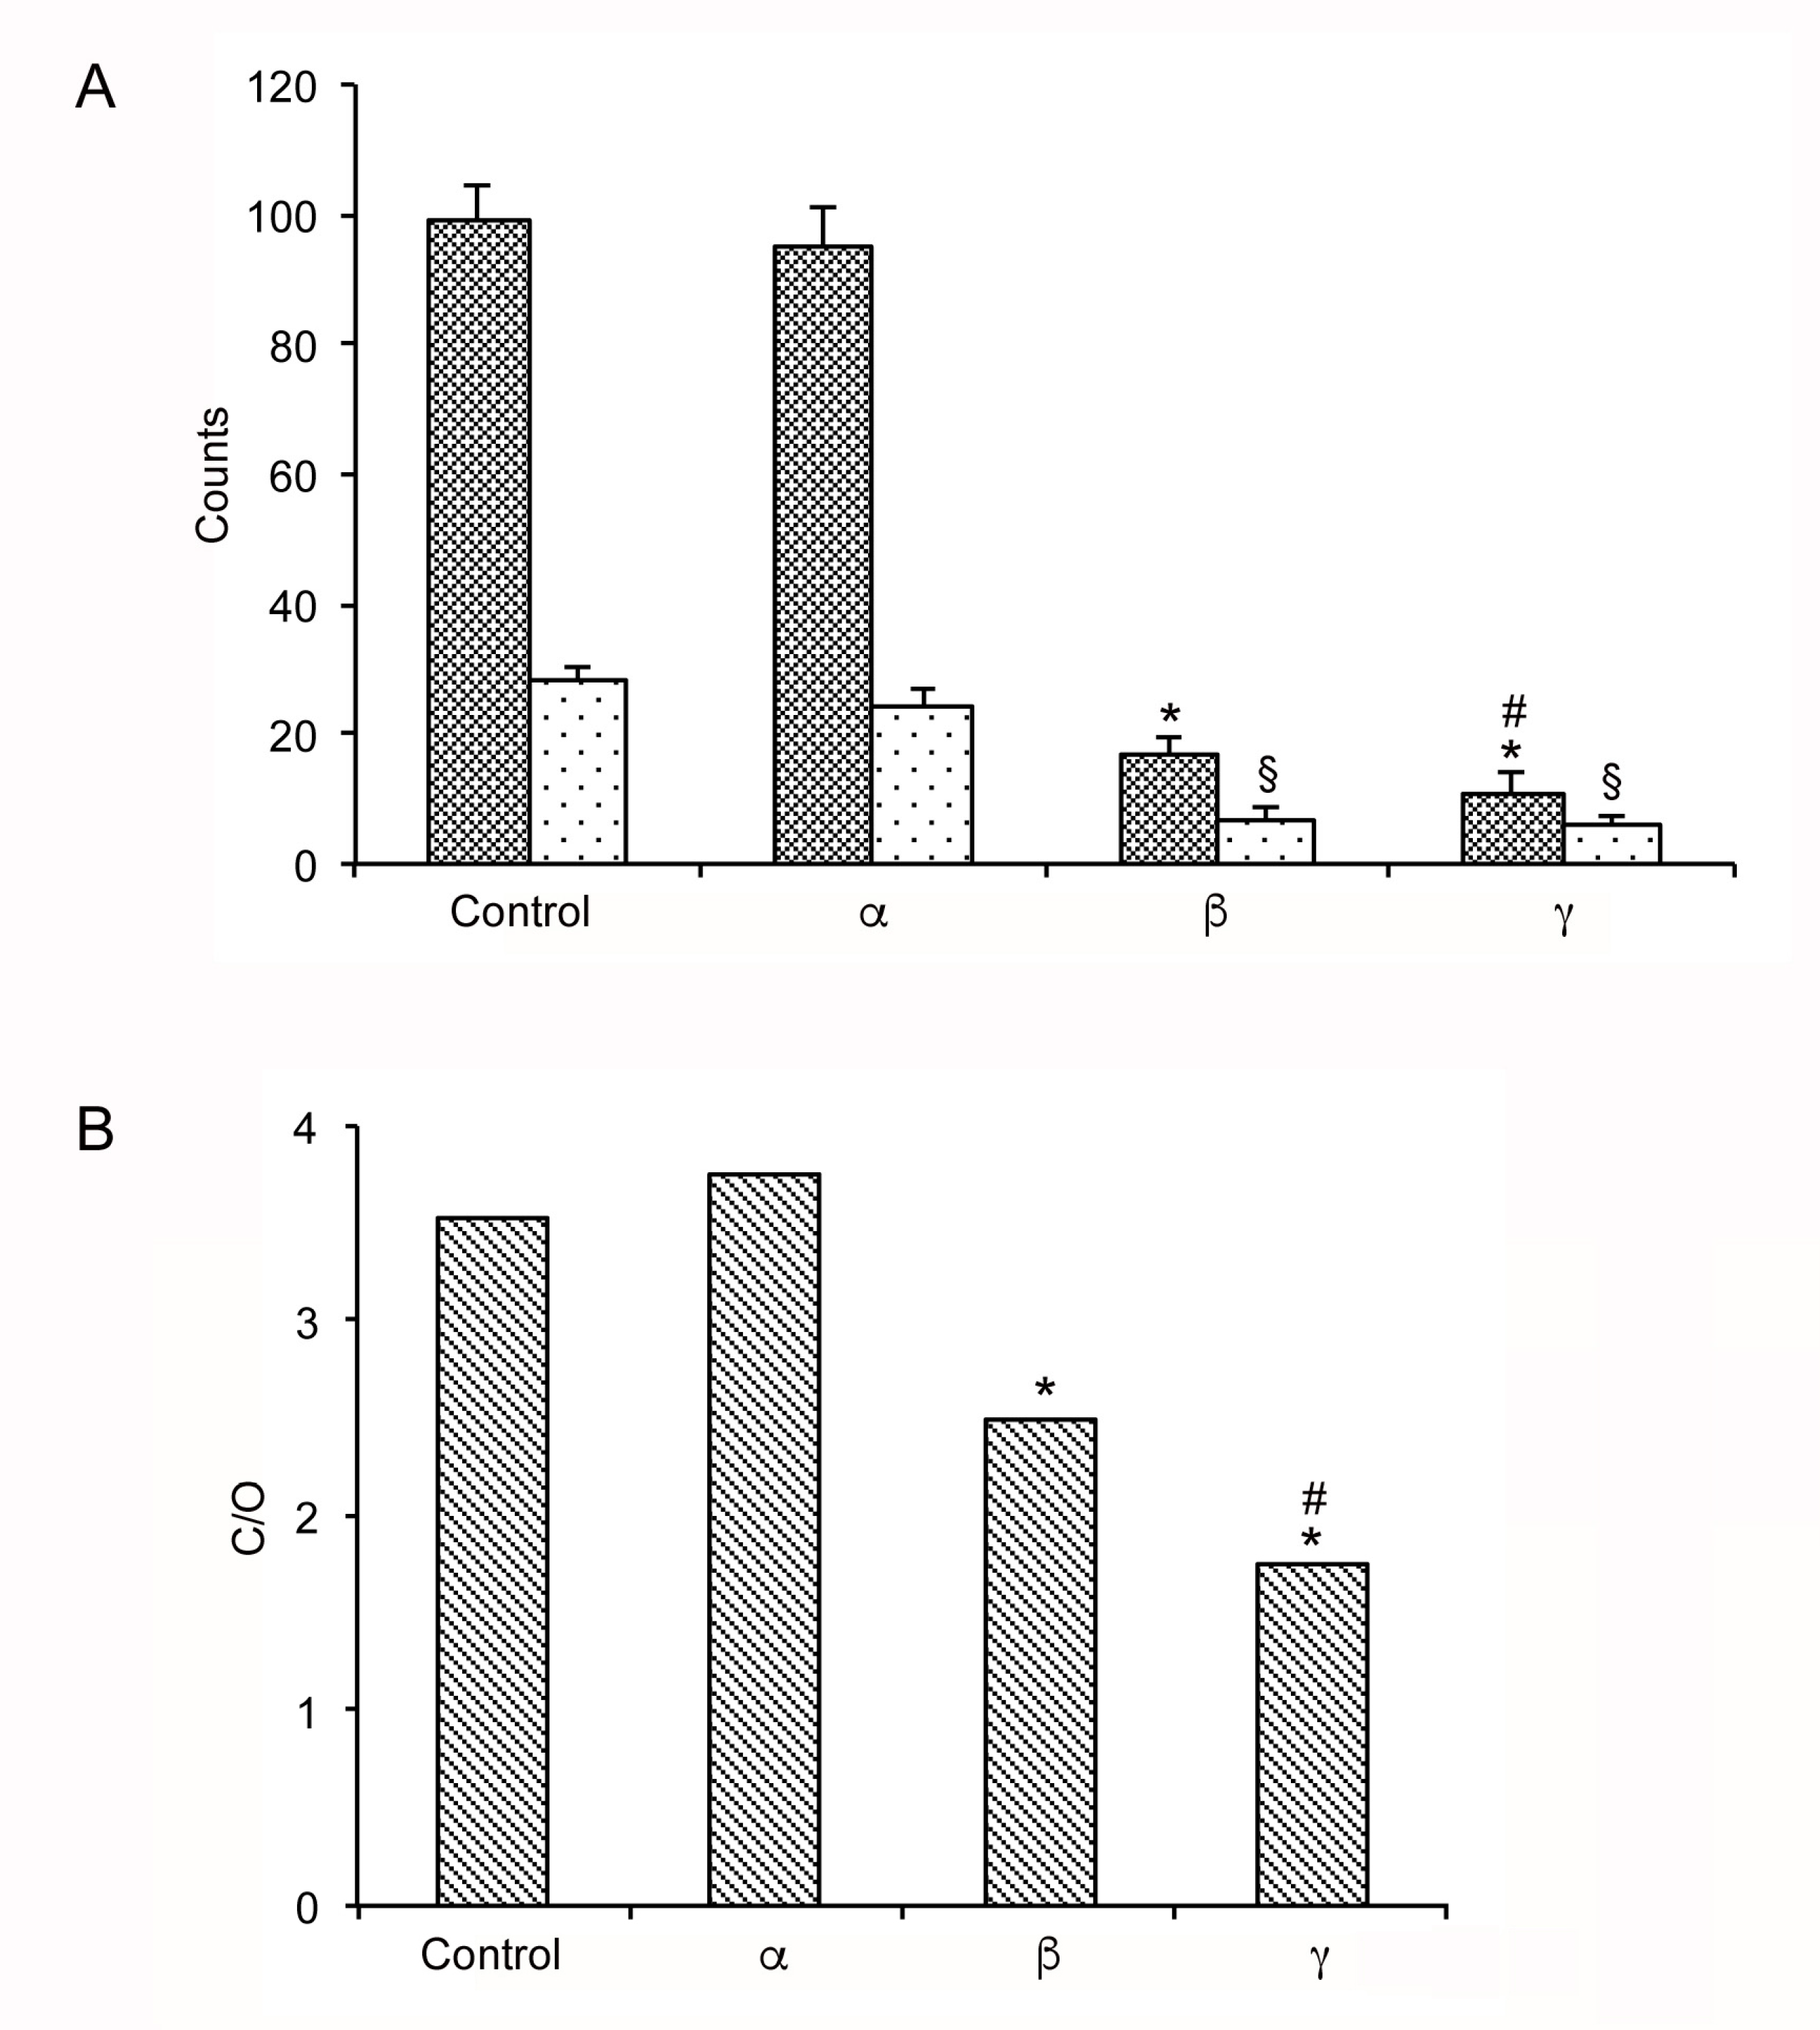
In control IOLs C and O, the basic organic components of PMMA, showed evident peaks (Figure 3A and Figure 4A), with a ratio of 3.5 (Figure 4B).
In damaged IOLs of both Groups 2 and 3 (Figure 3B), the EDX peaks obtained from Spots α, β and γ were compared with those obtained from the control IOLs surface. As expected, the peak from Spot α was similar to the control IOLs surface, with no statistical significance for both C and O (p = 0.29 and p = 0.1, respectively) (Figure 3A and Figure 4A). Their ratio was 3.7 (Figure 4B). This result was reasonable because Spot α was obtained from an undamaged zone. The EDX spectrum of Spot β showed a significant decrease in C and O contents equal to 82.6% and 75.8% (Figure 3B and Figure 4A) when compared to controls (p = 0.001 and p = 0.001, respectively), with a significantly reduced ratio of 2.5 (Figure 4B). The intensity of the peaks from Spot γ, that is the center of the laser shot, demonstrated a further significant decrease in C and O content (88.9% and 73.5%, respectively), when compared to controls (p = 0.001 and p = 0.001) (Figure 3B and Figure 4A), with a significant lower ratio of 1.7 (Figure 4B). Furthermore, Spots β and γ showed a significant difference in C content (p = 0.02), while no difference was observed in O content (p = 0.55) (Figure 4A). The Al (Kα) contribution was not considered in all the spectra, as it was related to the specimen holder.

4. Discussion

The negative effects of Nd:YAG laser treatment on IOLs surface have been extensively demonstrated with SEM [9,10,11,12]: in fact, in PMMA IOLs, surface star-like craters were observed, while, in silicone IOLs, smooth splash-like craters were present [9]. However, in all these studies, the technique used to dehydrate IOLs prior to SEM examination was not indicated. Only in an experimental work in canine cadaver eyes the examined specimens were treated with CPD: at high energy, in PMMA IOLs, sharp, irregular central pits with radiating fractures were demonstrated [15].
In this study, we confirmed that Nd:YAG laser treatment, even at the low energy level (1.2 mJ) currently used in the clinical practice, induced evident damage on IOL surface, closely related to the number of spots applied.
However, no data were available on IOL behavior under physical stress. Therefore, we evaluated the effects of the process of dehydration with CPD, ideal for SEM observation, on both normal and laser-treated IOLs.
Most soft biological specimens are damaged when water is allowed to dry by evaporation. The damage is triggered when the air/water meniscus or interface passes through the specimen, creating surface tension forces of 2000 PSI and inducing the collapse of the tissues [16]. To prevent structural damages, prior to CPD water is substituted with ethanol and then with liquid CO2, which, at a specific temperature and a corresponding pressure (critical point), is converted to gas that is slowly released, eliminating the hazardous air/water interface. For liquid CO2, the critical point is 31.1 °C at 1073 PSI [16]. Therefore, CPD technique can reliably preserve the spatial and structural integrity of tissues and soft specimens [14,17].
After CPD, it was demonstrated that Group 1 IOLs had regular shape, margins and surface. Mild changes were observed in Group 2 IOLs, which showed irregular surface, peripheral blebs and evident cracks starting from the laser-induced holes. On the contrary, in Group 3 IOLs, after an elevated number of laser shots, even the biologically harmless tension force (1073 PSI) created during CPD was followed by collapse and burst of the IOL.
Therefore, laser treatment at low energy (1.2 mJ) was able to induce moderate structural changes when few spots were applied, while a higher number of spots induced structural weakness of the IOL, with an evident change of its shape and lower resistance of the materials even to low physical stress [18].
The second target of this study was to evaluate the same type of IOLs after the different laser treatments (two and six spots) with SEM and EDX. This analytical technique provides a chemical characterization of the samples detecting the elements by which they are formed [19]. The spectra indicate the single elements with objective data about their concentration.
Recently, IOLs have been examined with SEM and EDX analyses. However, these studies analyzed explanted IOLs after opacification induced by calcification [20]. No data, as far as we know, are currently available on the possible changes in chemical composition of IOL materials after Nd:YAG laser treatment. With SEM and EDX, we demonstrated that in control and in the undamaged surface of laser treated IOLs spectra were similar for intensity, expressed in counts, of the organic elements (C and O) typical of 2-hydroxyethyl-methacrylate and 2-ethoxyethylmethacrylate [21,22].
On the contrary, the spots obtained from the edge and from the center of the laser hits in both Group 2 and Group 3 showed a significant reduction in signal strength of both C and O, indicating changes in IOL chemistry into and around the surface hit by the laser, able to induce degradation of the IOLs material [18].

5. Conclusions

It was possible to demonstrate that even few shots of Nd:YAG laser can induce modifications in the physical behavior of the IOLs, most likely responsible of their morphological changes under stress. This could be related to the reduced C and O content and to the changes in their reciprocal relations, indicating a chemical effect of laser on the acrylic material of the IOLs. In light of these results, further studies should be done to evaluate if the structural modifications induced by laser could also cause refractive alterations with significant impact on the visual quality of patients.

Author Contributions

Conceptualization, P.A., A.M. and G.A.; Methodology and Software, A.G.M.; Formal Analysis and Data Curation, B.T. and G.M.; Investigation, A.A.S., A.D.M. and P.P.; Writing—Original Draft Preparation, D.P.; and Writing—Review and Editing, P.A., A.M. and G.A. All authors approved the final version of the manuscript.

Funding

This research received no external funding.

Conflicts of Interest

The authors declare no conflict of interest.

References

  1. Lee, C.M.; Afshari, N.A. The global state of cataract blindness. Curr. Opin. Ophthalmol. 2017, 28, 98–103. [Google Scholar] [CrossRef] [PubMed]
  2. Liu, Y.C.; Wilkins, M.; Kim, T.; Malyugin, B.; Mehta, J.S. Cataracts. Lancet 2017, 390, 600–612. [Google Scholar] [CrossRef]
  3. Lundström, M.; Barry, P.; Henry, Y.; Rosen, P.; Stenevi, U. Evidence-based guidelines for cataract surgery: Guidelines based on data in the European Registry of Quality Outcomes for Cataract and Refractive Surgery database. J. Cataract. Refract. Surg. 2012, 38, 1086–1093. [Google Scholar] [CrossRef] [PubMed]
  4. Nibourg, L.M.; Gelens, E.; Kuijer, R.; Hooymans, J.M.; van Kooten, T.G.; Koopmans, S.A. Prevention of posterior capsular opacification. Exp. Eye Res. 2015, 136, 100–115. [Google Scholar] [CrossRef]
  5. Kossack, N.; Schindler, C.; Weinhold, I.; Hickstein, L.; Lehne, M.; Walker, J.; Neubauer, A.S.; Häckl, D. German claims data analysis to assess impact of different intraocular lenses on posterior capsule opacification and related healthcare costs. Z. Gesundh. Wiss. 2018, 26, 81–90. [Google Scholar] [CrossRef] [Green Version]
  6. Iliescu, I.M.; Constantin, M.A.; Cozma, C.; Moraru, O.M.; Moraru, C.M. Posterior Capsule Opacification and Nd-YAG rates evaluation in a large series of pseudophakic cases. Rom. J. Ophthalmol. 2017, 61, 267–274. [Google Scholar] [CrossRef]
  7. Aslam, T.M.; Devlin, H.; Dhillon, B. Use of Nd:YAG laser capsulotomy. Surv. Ophthalmol. 2003, 48, 594–612. [Google Scholar] [CrossRef]
  8. Karahan, E.; Er, D.; Kaynak, S. An Overview of Nd:YAG Laser Capsulotomy. Med. Hypothesis Discov. Innov. Ophthalmol. 2014, 3, 45–50. [Google Scholar]
  9. Bath, P.E.; Boerner, C.F.; Dang, Y. Pathology and physics of YAG-laser intraocular lens damage. J. Cataract Refract. Surg. 1987, 13, 47–49. [Google Scholar] [CrossRef]
  10. Bath, P.E.; Hoffer, K.J.; Aron-Rosa, D.; Dang, Y. Glare disability secondary to YAG laser intraocular lens damage. J. Cataract Refract. Surg. 1987, 13, 309–313. [Google Scholar] [CrossRef]
  11. Capon, M.R.; Docchio, F.; Leoni, G.; Trabucchi, G.; Brancato, R. Comprehensive study of damage to intraocular lenses by single and multiple nanosecond neodymium: YAG laser pulses. J. Cataract Refract. Surg. 1990, 16, 603–610. [Google Scholar] [CrossRef]
  12. Newland, T.J.; Auffarth, G.U.; Wesendahl, T.A.; Apple, D.J. Neodymium:YAG laser damage on silicone intraocular lenses. A comparison of lesions on explanted lenses and experimentally produced lesions. J. Cataract Refract. Surg. 1994, 20, 527–533. [Google Scholar] [CrossRef]
  13. Trinavarat, A.; Atchaneeyasakul, L.; Udompunturak, S. Neodymium:YAG laser damage threshold of foldable intraocular lenses. J. Cataract Refract. Surg. 2001, 27, 775–780. [Google Scholar] [CrossRef]
  14. Nweke, M.C.; Turmaine, M.; McCartney, R.G.; Bracewell, D.G. Drying techniques for the visualisation of agarose-based chromatography media by scanning electron microscopy. Biotechnol. J. 2017, 12, 1600583. [Google Scholar] [CrossRef] [PubMed]
  15. Beale, A.B.; Salmon, J.; Michau, T.M.; Gilger, B.C. Effect of ophthalmic Nd:YAG laser energy on intraocular lenses after posterior capsulotomy in normal dog eyes. Vet. Ophthalmol. 2006, 9, 335–340. [Google Scholar] [CrossRef]
  16. Bozzola, J.J. Conventional specimen preparation techniques for scanning electron microscopy of biological specimens. In Electron Microscopy: Methods and Protocols, Methods in Molecular Biology; Humana Press: Totowa, NJ, USA, 2014; pp. 133–150. [Google Scholar]
  17. Pinna, A.; Sechi, L.A.; Zanetti, S.; Delogu, D.; Carta, F. Adherence of ocular isolates of staphylococcus epidermidis to ACRYSOF intraocular lenses. A scanning electron microscopy and molecular biology study. Ophthalmology 2000, 107, 2162–2166. [Google Scholar] [CrossRef]
  18. Chirila, T.V.; Constable, I.J.; van Saarloos, P.P.; Barrett, G.D. Laser-induced damage to transparent polymers: Chemical effect of short-pulsed (Q-switched) Nd:YAG laser radiation on ophthalmic acrylic biomaterials. I. A review. Biomaterials 1990, 11, 305–312. [Google Scholar] [CrossRef]
  19. Núñez-López, M.T.; del Rosario-Hernández, G.; López-Gómez, L.; Mestres-Ventura, P. Specimen preparation for “block face” scanning electron microscopy (BFSEM). An energy-dispersive X-ray spectroscopy study. Eur. J. Anat. 2018, 22, 471–481. [Google Scholar]
  20. Gartaganis, S.P.; Prahs, P.; Lazari, E.D.; Gartaganis, P.S.; Helbig, H.; Koutsoukos, P.G. Calcification of Hydrophilic Acrylic Intraocular Lenses with a Hydrophobic Surface: Laboratory Analysis of 6 Cases. Am. J. Ophthalmol. 2016, 168, 68–77. [Google Scholar] [CrossRef]
  21. Rapado, M.; Peniche, C. Synthesis and characterization of pH and temperature responsive poly(2-hydroxyethyl methacrylate-co-acrylamide) hydrogels. Polímeros 2015, 25, 547–555. [Google Scholar] [CrossRef] [Green Version]
  22. Faraguna, F.; Siuc, V.; Vidović, E.; Jukić, A. Reactivity ratios and properties of copolymers of 2-ethoxyethyl methacrylate with dodecyl methacrylate or styrene. J. Polym. Res. 2015, 22, 245. [Google Scholar] [CrossRef]
Figure 1. Chemical structure of: 2-hydroxyethylmethacrylate (A); and 2-ethoxyethylmethacrylate (B).
Applsci 10 06321 g001
Figure 2. Scanning electron micrographs of IOLs. (A) In Group 1 (control IOLs), at low magnification, the flat shape is well preserved and margins are regular (arrow). (B) At higher magnification, the entire surface is regular and smooth. (C) In Group 2 (IOLs treated with two laser spots), the shape is still preserved with regular margins (arrow). All along the peripheral part of the IOLs, a hollow furrow with irregular blebs is present (arrowhead), while, in the central part, some straight breaking lines are evident (*). (D) At higher magnification, straight breaking lines (*) and a round hole with small radial spokes (open arrowhead) are present. The surface is wrinkled (double arrow). (E) Group 3 IOLs (treated with six laser spots) are swollen, empty and broken, owing to the presence of many long irregular fracture lines (arrow). (F) At higher magnification, the margins of the lines show a saw-tooth appearance (arrow) and are formed by flat overlapping leaflets of different length (arrowhead). Scale bars: (A,C,E) 1 mm; (B,D,F) 100 μm.
Applsci 10 06321 g002
Figure 3. Scanning electron microscopy and energy dispersive X-ray spectrometry of IOLs. (A) In Group 1 (control IOLs), the presence of C and O is evident. (B) In the damaged IOL, three different spots are considered: Spot α (undamaged surface), Spot β (edge of the surface hit by the laser) and Spot γ (center of the laser injury). Note that Spot α is comparable with the control IOL spectrum. Spots β and γ show a sharp decrease in C and O contents. Scale bar: 50 μm.
Applsci 10 06321 g003
Figure 4. (A) Carbon (C) and oxygen (O) counts in control IOLs and in the spots (Spot α (undamaged surface), Spot β (edge of the surface hit by the laser) and Spot γ (center of the laser injury)) of the laser damaged IOLs. * p < 0.05 versus C of control and Spot α; § p < 0.05 versus O of control and Spot α; # p < 0.05 versus C of Spot β. (B) Carbon (C) and oxygen (O) counts ratio in control IOLs and in the spots (Spot α (undamaged surface), Spot β (edge of the surface hit by the laser) and Spot γ (laser injury)) of the laser damaged IOLs. * p < 0.05 versus control and Spot α; # p < 0.05 versus Spot β.
Applsci 10 06321 g004