Abstract
This work aims to identify the damping properties of a commercial viscoelastic material that can be embedded and cured between the layers of composite laminates. The material may be adopted for reducing the vibration response of composite panels, typically used in automotive and aerospace applications, e.g., as vehicle body shell components. In order to objectively estimate the actual potential to enhance the noise vibration and harshness aspects, the effects of the viscoelastic material on the modal parameters of carbon/epoxy thin panels are quantitatively assessed through experimental modal analysis. Two different experiments are conducted, namely impact hammer tests and shaker excitation measurements. Based on the results of the experimental campaign, the investigated material is confirmed as a promising solution for possibly reducing the severity of vibrations in composite panels, thanks to its high damping properties. Indeed, the presence of just one layer proves to triple the damping properties of a thin panel. An approximate damping model is derived from the measured data in order to effectively simulate the dynamic response of new design solutions, including thin composite panels featuring the viscoelastic material.
1. Introduction
The number of technological applications featuring composite materials is constantly increasing. For instance, composites are commonly adopted for manufacturing ship hulls and possible solutions to improve their resistance to slamming damage are currently investigated [1]. Additional examples are machine tools with parallel kinematics architecture [2] and robotic exoskeletons [3], to which the use of composite materials has been recently extended.
With reference to automotive applications, carbon fiber reinforced polymer (CFRP) laminates have been used in the past three decades to manufacture body shell components of sports cars, like the hood, since they exhibit a convenient combination of high strength and low weight [4]. Currently, they are under consideration also for possible use in other (mass-market) classes of cars, notwithstanding higher production costs [5,6]. Indeed, the use of lightweight materials is essential to lower the power consumption, particularly for hybrid and electric vehicles, hence, permitting them to fulfill sustainable mobility policies [4,5,7,8,9]. Moreover, they may permit to meet more stringent safety requirements in case of impacts [10,11,12,13].
The vehicle body shell components can be particularly critical from the noise vibration and harshness (NVH) standpoint. Indeed, such parts may exhibit undesired elastodynamic effects triggered by several sources, e.g., the engine/driveline operation, vibrations due to the road roughness, aerodynamic loads, and possible impacts with small particles, like raindrops [14,15,16,17]. This may result in a reduced comfort for driver and passengers. Hence, in this perspective, the dynamic response of CFRP panels for automotive applications must be carefully assessed.
Numerous advanced materials have been developed to limit the vibration severity of structures and components by increasing their structural damping [18,19,20,21,22,23,24]. While the research is still ongoing, promising results have been obtained [1,25,26,27]. In particular, Townsend et al. [1] studied the use of acrylonitrile butadiene styrene (ABS) cells filled with thermoplastic polyurethane (TPU) elastomer to improve the durability of glass fiber reinforced polymer (GFRP) hulls for high-speed boats. Liao et al. [26] investigated the influence of fiber orientation on the damping properties of CFRP cantilever beams featuring a single viscoelastic layer (copolymer of ethylene and acrylic acid—(PEAA)). Similarly, Berthelot and Sefrani [27] studied the effects of multiple design parameters (e.g., thickness and position of the viscoelastic layers) on the structural damping of GFRP cantilever beams with the addition of neoprene. Araùjo et al. [25] investigated the possibility of enhancing the structural damping of laminates with a viscoelastic core by optimizing the core thickness through genetic algorithms. This study focuses on a viscoelastic material that can be embedded and cured inside CFRP laminates, known as SMACWRAP®, manufactured by SMAC-Montblanc Technologies (Toulon, France). Such material has been preliminarily selected by the industrial partner involved in the research, on the basis of market analysis, supply chain policy, and technical aspects (e.g., stacking and lamination processes). Its effects on the modal parameters of thin carbon/epoxy panels are investigated by means of back-to-back experimental tests on very simple specimens. The main goal is to quantitatively assess its actual damping properties. To the authors best knowledge, whereas the dynamic response of composite sandwich beams with lightweight honeycomb core and SMACWRAP® layers has been assessed in [28,29], no data are available on thin panels.
The paper outline is as follows: Section 2 describes the tested specimens, the experimental setup and the signal processing techniques adopted for the analyses; a numerical model implemented to support the analysis of the data is also illustrated. In Section 3, the results of the experiments are reported and discussed; in addition, a possible approximate damping model is defined. In the final section, the main conclusions of the study are drawn.
2. Materials and Methods
2.1. Specimens
Two specimens are produced for the experimental tests, namely CFRP rectangular panels with a layer of SMACWRAP® embedded (referred to as PY) and without the viscoelastic material (PN), respectively.
The panel PN is a carbon/epoxy laminate consisting of four twill plies, hand lay-up with a 0°/0°/0°/0° stacking sequence. Lamination is performed by means of vacuum bagging and autoclave process. The overall dimensions of the panel PN after lamination, namely the sides of the rectangular shape, pl and ps, and the total thickness, as well as its final mass are reported in Table 1.

Table 1.
Specimen overall properties.
The specimen PY has the same length (pl) and width (ps) of the panel PN (Figure 1, Table 1). It is produced by embedding three strips of SMACWRAP® of length sl and width sw (Table 2) between the two plies of the stack that are closest to the mold, according to the schematic shown in Figure 1, which represents the top view of the rectangular panel. Hence, the three strips lie on the same layer of the stack. A proper spacing, cs, is left between adjacent strips to improve the structural properties of the laminate, as suggested by the manufacturer of the viscoelastic material. Conversely, only a small spacing, ss, (or no spacing at all) is left between the strips and the panel sides, because the specimen is going to be clamped at all its edges for the experimental tests (see Section 2.2). Then, the panel is laminated with the same process adopted for the PN specimen. The geometric and mass properties of the PY panel, after lamination, are shown in Table 1.
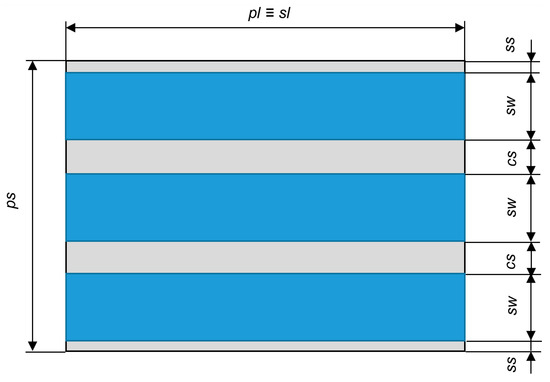
Figure 1.
Schematic of the PY panel layout (top view).
Table 2.
Properties of the SMACWRAP® strips embedded in the panel.
2.2. Experimental Setup and Test Procedures
In order to perform the measurements, each panel is fastened between two steel frames (Figure 2) by means of sixteen M10 through-screws, tightened with a controlled torque of 30 Nm. The size and mass properties of the steel frames are summarized in Table 3. The outer dimensions of the frames match the dimensions of the specimens. Hence, each specimen can vibrate as a rectangular plate characterized by the inner frame dimensions (il and is in Figure 2a and Table 3) and clamped at its edges. This kind of constraint aims to simulate typical boundary conditions featured by CFRP panels used in automotive applications, such as the car roof fixed to the vehicle body. Then, the steel frame is suspended by using low-stiffness elastic ropes, with the short sides vertically directed (Figure 2b).
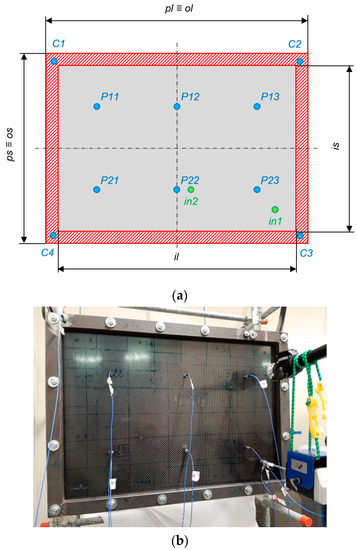
Figure 2.
Experimental setup: (a) schematic of the steel frame and of the excitation/measurement nodes; (b) photo of the specimen PN excited by the shaker at node in1.
Table 3.
Properties of the steel frames.
Experimental modal analysis (EMA) is performed by using two different excitation techniques, namely impact and shaker excitations. A modal geometry consisting of 12 nodes is adopted to represent the specimens (Figure 3). In particular, 6 nodes (referred to as Pij, i = 1, 2 and j = 1, …, 3) are associated with the panel; 4 nodes (Ck, k = 1, …, 4) are associated with the corners of the steel frame; 2 nodes (in1 and in2) are the locations on the panels excited by the shaker. It can be noticed that only six accelerometers are attached to the panels, to not significantly alter the tested system dynamics due to excessive additional masses. Such a limited spatial resolution is reasonably supposed to cause an aliased estimation of the mode shapes. A simple finite element (FE) model of the panels was thus preliminarily implemented with the aim (i) to let the numerical modal analysis support the experimental data processing (see Section 2.4) and (ii) to pinpoint adequate locations of nodes Pij for a straightforward visual identification of the main mode shapes. The vibration response of the specimens along the Z direction (perpendicular to the panel plane) is measured at all nodes Pij and at node C1 by means of IEPE piezoelectric accelerometers (PCB Piezotronics Inc., Depew, NY, USA). Node C1 permits to monitor the behavior of the steel frame, in order to possibly identify spurious mode shapes involving vibrations of the frame itself, which should be excluded from the analysis.
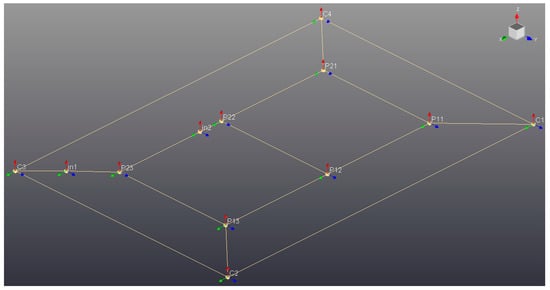
Figure 3.
Geometry of the modal model: C2–C4 are active in the impact tests only; in1 and in2 are active in the shaker tests only.
Impact test is performed by exciting all the specimens’ nodes except in1 and in2, perpendicularly to the panel plane, with an impulse force hammer (PCB 086C04, PCB Piezotronics Inc., Depew, NY, USA). Hence, a total amount of 7 response nodes and 10 reference nodes (i.e., the nodes impacted by the hammer) are used for the analysis (in1 and in2 are deactivated in the modal model). This setup may be seen as the combination of the so-called roving hammer and roving sensors approaches, thus generating a redundant dataset that may be exploited to find the most convenient subset of frequency response functions (FRFs) estimates that EMA is based on.
The second test is conducted by exciting the specimens with an electrodynamic shaker (TMS-K2007E01, The Modal Shop Inc., Cincinnati, OH, USA) along the Z direction at the input nodes in1 and in2 (Figure 3). The excitation force and the acceleration at nodes in1 and in2 are measured by an IEPE piezoelectric impedance head (PCB 288D01, PCB Piezotronics Inc., Depew, NY, USA). The input nodes in1 and in2 are excited in distinct runs (i.e., not simultaneously), so that only a reference node at a time is considered in the analyses. The results obtained by using the in2 reference point basically match those obtained with excitation applied at node in1. Hence, only the results concerning the in1-case are reported in this paper, whereas the in2-case is neglected hereafter. For a better graphical representation of the results, nodes C2, C3, and C4 are kept visible in the modal geometry also in shaker tests, although no data are associated with them. Two different excitation profiles are adopted, namely burst random and chirp signals, and two excitation levels are set for each one (also to investigate possible non-linear dynamic response of the CFRP panels).
All the experimental campaigns are performed by using an LMS SCADAS SCM-05 frontend and LMS Test.Lab software package (Siemens Digital Industries Software, Plano, TX, USA), with the following acquisition setup parameters:
- Sampling frequency: FSh = 512 Hz (impact hammer tests), FSs = 2048 Hz (shaker tests);
- Bandwidth: BWh = 0.5–256 Hz (impact hammer tests), BWs = 5–1024 Hz (shaker tests);
- Acquisition duration: T = 8 s (spectral frequency resolution: Δf = 0.125 Hz);
- Number of averages: Nav = 10;
- Shaker excitation levels: LR = 0.2 V, 1 V (Random tests), LC = 0.1 V, 0.5 V (Chirp tests).
The frequency bandwidth in impact tests is lower than in shaker tests due to practical constraints: the excitation is in fact provided by an impact hammer featuring a plastic covered tip (to preserve the thin panels integrity), and the corresponding force spectrum proves almost flat up to 300 Hz only.
2.3. Signal Processing and Analysis
It is known that structural damping is generally difficult to identify and even more difficult to model. The literature offers a number of parameters to quantify damping, depending on the specific sector of application, e.g., damping ratio, logarithmic decrement, loss factor, quality factor, decay constant. In practice, they carry very similar information, being interrelated through analytical formulations [30]. In the field of sound and vibration, the damping properties are commonly determined in the Frequency domain. In particular, from the EMA/modal identification, modal coefficients related to the several identified mode shapes are obtained; from these ones, a damping ratio per mode shape can be defined. Indeed, in this study, the damping ratio (ζ) is chosen to quantitatively assess the structural damping associated with each vibration mode.
For all the tests, the FRFs between response and reference signals, acceleration and force respectively, are estimated. Then, the modal parameters of the specimens, i.e., mode shapes Xi, natural frequencies fi, and damping ratios ζi (i = 1, 2…) are computed.
Numerous data processing are performed for each of the five experimental campaign (impact test and four shaker tests), in order to get reliable and robust results. Indeed, it is well known that EMA results might prove significantly sensitive to the frequency band and/or the FRF set chosen for the analysis, as well as to the values set up for certain parameters of EMA algorithms. In particular: algorithms in the time and frequency domains are used; different combinations of FRF sets are selected as the basis for the modal parameter computations; different bandwidths are defined (e.g., 5–1000 Hz, 5–200 Hz, 200–1000 Hz).
2.4. FE Model
The PN panel is modelled by using the FE analysis software Ansys® (Ansys Inc., Canonsburg, PA, USA). After a—straightforward—mesh convergence analysis, a regular mesh of 630 nodes is generated by using 4-noded quadrilateral shell elements (SHELL181). The 6 Degrees of Freedom (DOFs) of all the nodes on the edges of the panel are fixed to the ground to represent (ideal) clamped boundary conditions. The composite material is modelled as a homogeneous equivalent material, by assigning laminate material properties. This simplified representation is assumed as largely adequate to evaluate the global dynamic response of the panel [31]. Indeed, the numerical modal analysis of the clamped plate is performed to support the correct interpretation of mode shapes retrieved from EMA avoiding the possible spatial aliasing issues mentioned in Section 2.2. The accurate estimation of the natural frequencies is not required; hence, model updating to match the experimental resonances is not performed in this study.
3. Results and Discussion
The redundancy of both the test campaigns and the analyses prove fundamental for the final outcomes, as the correct estimation of the modal parameters has been possible only by exploiting different combinations. As an example, Figure 4 reports the FRF-sum amplitudes obtained from burst random (excitation level 1 V) and Chirp periodic (excitation level 0.5 V) tests, respectively. The former is globally less scattered, thus making the response peaks emerge very clearly. On the other hand, the latter can catch resonances of modes that are poorly excited in the previous case.
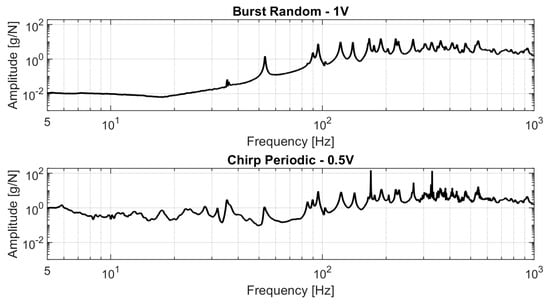
Figure 4.
Sum of frequency response functions (FRFs), limited to 5–1000 Hz, estimated in two tests performed on panel PN.
3.1. Impact Hammer Tests
The impact hammer testing (practically simpler to set up) proves inadequate to perform the EMA correctly: indeed, in this case, acceptable values are hardly obtained for the three main parameters that indicate the reliability of the EMA results, namely modal phase collinearity (MPC), mean phase deviation (MPD), and modal participation (MP) [32,33]. Overall results are not consistent with the modal parameters computed through numerical analysis nor with those estimated through shaker tests EMA, and thus they are not reported in the following. This trouble might be reasonably explained considering the effects of localized impact forces on thin CFRP panels: significant local deformations may prevent the panel mode shapes to be effectively excited. The possibility of achieving more satisfactory results by using a miniature impact hammer may be verified in future tests.
3.2. Shaker Excitation Tests
The results obtained from the analyses of the shaker excitation measurements for the first ten vibration modes are summarized in Table 4, where subscripts PN, PY, and i refer to panel PN, panel PY, and mode ranking, respectively. Such results are computed as an average of the values obtained from the different modal identification processes, by also varying the excitation profile/level and the computational algorithm (in the time and frequency domains, respectively), while keeping fixed the frequency range (5–200 Hz). Only the results characterized by satisfactory values of the parameters MPC, MPD, and MP have been included in the average. The mode shapes are described by means of two parameters, namely m and n, according to a conventional notation frequently adopted for the vibrations of rectangular plates [34]. In particular, in the case of a rectangular plate made of a homogeneous material with all the sides clamped, m and n refer to the number of half-sine waves along the direction of the long and short sides, respectively. The comparison between the natural frequencies and the damping ratios of the PN and PY panels is also reported, in terms of percentage variations Δfi and Δζi, respectively, normalized to the panel PN values; moreover, factors of damping increment (i.e., the ratios between the damping ratios) ρYN,i = ζPY,i/ζPN,i are provided as well. The result presentation is limited to the first ten modes, below 200 Hz, since, for higher ranking modes—above all for panel PY—the mode shape estimation proves not extremely reliable (with fuzzy values for MPC, MPD, and MP parameters) and a robust association with the PN panel ones is not straightforward, thus making the direct comparison uncertain.
Table 4.
Modal parameters estimated from shaker tests experimental modal analysis (EMA).
The comparison between the FE model (FEM) and the EMA results for the PN panel vibration modes #1, #6, and #9 (chosen as examples) is reported in Figure 5.
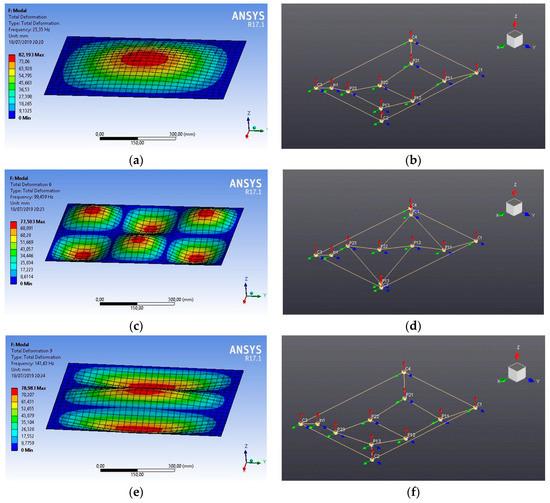
Figure 5.
PN panel results, finite element model (FEM) vs. EMA vibration modes: (a) FEM #1; (b) EMA #1; (c) FEM #6; (d) EMA #6; (e) FEM #9; (f) EMA #9.
In particular, it can be observed that the limited resolution of the modal geometry (Pij, C1, and in1 nodes) causes a very similar representation for the mode shapes #1 and #9. This confirm the usefulness of the FEM results for properly identifying the mode shapes estimated through the EMA, thus, partially solving the shape aliasing problem.
The natural frequency variations between the two panels remain rather limited for all the vibration modes, the maximum difference being less than 10%. The mode ranking remains the same except for modes #3 and #4. The trend of Δfi is not monotonic: in particular Δfi > 0 for modes with n ≥ m (apart from n = 1), due to the stiffening effect of the additional thickness of the SMACWRAP® layer on the mode shapes featuring more waves along the short side with respect to the long one (e.g., mode #9 in Figure 5e). On the contrary, the slight decrement in other natural frequencies is due to the additional mass effect.
The damping ratios characterizing the PY panel are significantly higher than in the PN panel, for all the vibration modes, with percentage increment ranging from 123% to 303%, depending—apparently inconsistently—on the single modes. For an overall evaluation, Table 5 reports the mean values (μ), standard deviations (σ) and relative standard deviations (σ* = σ/μ 100) of the damping ratios computed for the two panels and their fraction (i.e., the results shown in Table 4). On the average, the presence of the viscoelastic material triples the damping properties of the panel, thus, proving its effectiveness as a possible solution to dampen vibrations in thin CFRP panels. The measured damping ratios are basically in agreement with the values found in [28] for sandwich beams with lightweight honeycomb core and one SMACWRAP® layer. However, therein a smaller increment in the damping properties is generally observed, since the untreated specimen exhibits higher damping ratios.
Table 5.
Statistical parameter values of the EMA damping ratios and corresponding fraction.
Further indications on the effectiveness of the tested viscoelastic material may be obtained from a comparison with the results presented by Liao et al. [26] and by Berthelot and Sefrani [27]. In the former, the damping ratio of the first mode of a CFRP cantilever beam (thickness of 1.5 mm) appears to be almost doubled by adding a 0.1 mm layer of PEAA. In the latter, one result is that an increment of almost three times could be achieved for the first mode of a GFRP cantilever beam (thickness of 2.4 mm) with a 0.2 mm layer of neoprene.
3.3. Damping Model of the Specimens
The vibration modes identified through the analyses of the shaker excitation measurements in the frequency range 5–1000 Hz are 39 and 21 for the PN and PY panels, respectively. The damping ratio experimental estimates are plotted over the corresponding natural frequencies in Figure 6.
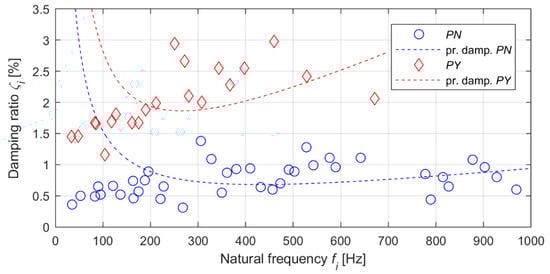
Figure 6.
Modal parameters with proportional damping interpolating curves.
Firstly, data fitting by means of a proportional damping model is evaluated. With this popular model, also known as Rayleigh model [35,36], solving the structural dynamics/multibody dynamics problem is remarkably simpler. Indeed, it is largely adopted (e.g., for FE modelling and analysis), even if it may lead to inaccurate results [37]. Under the hypothesis of proportional damping, the following relation holds:
where α and β are the proportional damping coefficients, ωi = 2πfi, and mi, ki, ci, are the modal mass, modal stiffness, and modal damping of the i-th mode, respectively. After determining the modal parameters fi and ζi for N vibration modes, the coefficients α and β can be estimated through least-squares approximation, by using the following expression:
where
The proportional damping curves computed for the PN and PY panels are plotted in Figure 6. From the comparison with the corresponding experimental data, such models do not appear suitable for the tested specimens, since the damping ratios of modes at the lowest natural frequencies are not correctly fitted.
The EMA results show that the PY panel exhibits a quite evident growth of the damping ratios as the natural frequencies increase. A slight increment in ζi apparently characterizes the PN panel as well. Linear regression models, described by the expression
are, thus, computed for possibly describing the observed trends of the damping ratios as linear functions of the natural frequencies. The experimental values of the damping ratios and the corresponding regression lines are plotted in Figure 7 for both the panels. The estimates of the intercept (λ0) and of the slope (λ1) of the regression lines are reported in Table 6, with the corresponding p-values. It is worth recalling that the p-value measures the probability that the estimated parameter has a correlation with the measured data, i.e., whether it is relevant for the regression model (a p-value of 0.05 or lower being the level of significance commonly accepted to reject the null hypothesis). For each specimen, the coefficient of determination, R2 (also known as R-squared), and the p-value of the regression model as a whole are also shown. The former, ranging from 0 to 1, indicates which fraction of the variability exhibited by the dependent variable is explained by the regression model. The latter assesses the level of significance of the regression model and, for the models here considered, basically coincides with the p-value of λ1, since there is only one independent variable (i.e., the frequency).

Figure 7.
Modal parameters with linear regression fitting lines.
Table 6.
Linear regression parameters.
The regression model explains almost 45% of the variability in the damping ratios of the PY panel (R2 = 0.444) and appears sufficiently reliable (p-value = 9.81 × 10⁻⁴). Hence, it can be considered as a satisfactory approximation of the PY damping trend. Regarding the PN panel, the regression model accounts for only 15% of the data variability, but the approximation still appears acceptable. Additionally, the linear regression model clearly appears to approximate better the data, when compared to the Rayleigh damping hypothesis. The comparison between the two computed regression lines further confirms the dampening capabilities of the tested viscoelastic material, over a quite wide frequency range.
It is worth noting that the regression model of the PY panel represents the behavior of the composite laminate and not the intrinsic characteristics of the viscoelastic material. The usefulness of its implementation may be thus limited, but identifying the damping properties of only a single viscoelastic layer through EMA (which this study is based on) is objectively impossible, due to its extremely low thickness. Nonetheless, it may be used as a reference for predicting the dynamic response of CFRP laminates featuring overall characteristics similar to the panels targeted in this study (which are assumed reasonably quite common in a number of applications). For instance, it may be adopted to perform structural dynamics analyses of CFRP laminates within a FE code, in case the composite can be modelled with an equivalent material (see Section 2.4). Therefore, the proposed damping model may usefully support the investigation of new design solutions of components that include thin composite panels featuring the investigated viscoelastic material: in particular, when the target of elastodynamic simulations is the back-to-back comparison of different design solutions, the absolute accuracy of results is often of secondary importance.
4. Conclusions
This study investigates, through experimental modal analysis, the damping properties of a commercial viscoelastic material that can be embedded in CFRP laminates for reducing the vibration response. Impact tests and shaker excitation tests are performed on thin panels in clamped boundary conditions. The former proves not adequate to provide satisfactory results, due to the local deformation of the thin panels under impact loads. The presented results, retrieved from many combinations of signal analyses performed on shaker test data, show a significant increment of the damping ratio over a wide frequency range. Hence, the viscoelastic material proves its high damping capability and is thus confirmed as a promising solution to be possibly adopted in automotive applications for addressing NVH issues.
Finally, a simple damping model is formulated based on linear regression of the measured data. The proposed model may be adopted for a preliminary estimation of the dynamic response of carbon/epoxy thin panels featuring the investigated viscoelastic material, thus possibly guiding the design process of new composite structure solutions in the early phases.
Author Contributions
Conceptualization, M.T. and S.T.; Methodology, M.T.; Software, M.T. and S.T.; Validation, M.T.; Formal Analysis, M.T. and A.M.; Investigation, M.T. and A.M.; Resources, M.T., S.T. and A.R.; Data Curation, M.T. and S.T.; Writing—Original Draft Preparation, M.T. and A.M.; Writing—Review and Editing, M.T., S.T., A.R. and A.M.; Visualization, M.T. and A.M.; Supervision, M.T.; Project Administration, M.T. All authors have read and agreed to the published version of the manuscript.
Funding
This research received no external funding.
Conflicts of Interest
The authors declare no conflict of interest.
References
- Townsend, P.; Suárez, J.C.; Sanz-Horcajo, E.; Pinilla-Cea, P. Reduction of slamming damage in the hull of high-speed crafts manufactured from composite materials using viscoelastic layers. Ocean Eng. 2018, 159, 253–267. [Google Scholar] [CrossRef]
- Neumann, K.-E. True Mobile/Portable Drilling and Machining, a Paradigm Shift in Manufacturing; SAE Technical Paper; SAE International: Warrendale, PA, USA, 2017. [Google Scholar] [CrossRef]
- Pappas, G.A.; Botsis, J. Design optimization of a CFRP–aluminum joint for a bioengineering application. Des. Sci. 2019, 5, 14. [Google Scholar] [CrossRef]
- Fuchs, E.R.; Field, F.R.; Roth, R.; Kirchain, R. Strategic materials selection in the automobile body: Economic opportunities for polymer composite design. Compos. Sci. Technol. 2008, 68, 1989–2002. [Google Scholar] [CrossRef]
- Lutsey, N. Review of Technical Literature and Trends Related to Automobile Mass-Reduction Technology; Research Report—UCD-ITS-RR-10-10; Institute of Transportation Studies, University of California: Davis, CA, USA, 2010. [Google Scholar]
- Anwar, M.; Sukmaji, I.C.; Wijang, W.R.; Diharjo, K. Application of carbon fiber-based composite for electric vehicle. Adv. Mater. Res. 2014, 896, 574–577. [Google Scholar] [CrossRef]
- Arifurrahman, F.; Budiman, B.A.; Aziz, M. On the lightweight structural design for electric road and railway vehicles using fiber reinforced polymer composites—A Review. Int. J. Sustain. Transp. Technol. 2018, 1, 21–29. [Google Scholar] [CrossRef]
- Tsirogiannis, C.E. Design and modelling methodologies of an efficient and lightweight carbon-fiber reinforced epoxy monocoque chassis, suitable for an electric car. Mater. Sci. Eng. Adv. Res. 2017, 2, 5–12. [Google Scholar] [CrossRef]
- Odabaşı, V.; Maglio, S.; Martini, A.; Sorrentino, S. Static stress analysis of suspension systems for a solar-powered car. FME Trans. 2019, 47, 70–75. [Google Scholar] [CrossRef]
- Sukmaji, I.C.; Anwar, M.; Wijang, W.R.; Danardono, D.P.D. Hybrid carbon-glass fiber composite for the door electric car application. In Proceedings of the 2013 Joint International Conference on Rural Information & Communication Technology and Electric-Vehicle Technology (rICT & ICeV-T), Bandung, Indonesia, 26–28 November 2013; Institute of Electrical and Electronics Engineers (IEEE): Piscataway, NJ, USA, 2013; pp. 1–3. [Google Scholar]
- Sudirja Hapid, A.; Kaleg, S.; Budiman, A.C.; Amin. The crumple zone quality enhancement of electric cars bumper fascia using a carbon fiber reinforced vinyl ester—Microsphere composites. In Proceedings of the 2019 International Conference on Sustainable Energy Engineering and Application (ICSEEA), Tangerang, Indonesia, 23–24 October 2019. [Google Scholar]
- Ahmed, A.; Wei, L. Introducing CFRP as an alternative material for engine hood to achieve better pedestrian safety using finite element modeling. Thin Walled Struct. 2016, 99, 97–108. [Google Scholar] [CrossRef]
- Bang, S.; Park, Y.; Kim, Y.; Shin, T.; Back, J.; Lee, S.K. Effect of the fiber lamination angle of a carbon-fiber, laminated composite plate roof on the car interior noise. Int. J. Automot. Technol. 2019, 20, 73–85. [Google Scholar] [CrossRef]
- Raghuvanshi, J.; Palsule, A.; Bodhale, N.; Kharade, A.; Pol, A. Sensitivity Study of Different Damping Treatments Using Simulation and Physical Testing Methodologies on Structure Borne Driver’s Ear Noise Performance in a Premium Hatchback Car; SAE Technical Paper; SAE International: Warrendale, PA, USA, 2019. [Google Scholar] [CrossRef]
- Gur, Y.; Wagner, D. Damping properties and NVH modal analysis results of carbon fiber composite vehicle components. SAE Int. J. Mater. Manuf. 2017, 10, 198–205. [Google Scholar] [CrossRef]
- Yu, Z.; Cheng, D.; Huang, X. Low-frequency road noise of electric vehicles based on measured road surface morphology. World Electr. Veh. J. 2019, 10, 33. [Google Scholar] [CrossRef]
- Martini, A.; Bellani, G.; Fragassa, C. Numerical assessment of a new hydro-pneumatic suspension system for motorcycles. Int. J. Automot. Mech. Eng. 2018, 15, 5308–5325. [Google Scholar] [CrossRef]
- House, J.R.; Hilliar, A.E. Vibration Damping Materials. Patent WO-90/01645, 22 February 1990. [Google Scholar]
- Fujimoto, J.; Tamura, T.; Furihata, T.; Suzuki, Y.; Kauchi, K. Laminated Vibration-Damping Material. U.S. Patent US-005368916, 29 November 1994. [Google Scholar]
- Sutton, S.P.; Principe, F.; Gentile, M.M. Vibration Damping Composite Material. U.S. Patent US-5965249, 12 October 1999. [Google Scholar]
- Ellis, J.; Hadley, P. Composite Material. Patent WO-2014/147243, 25 September 2014. [Google Scholar]
- Sumita, M.; Kaneko, H.; Murase, K. Composite Damping Material. U.S. Patent US-20160040744A1, 11 February 2016. [Google Scholar]
- Stopin, G.; Tesse, C. Constrained-Layer Damping Material. U.S. Patent US-9243402B2, 26 January 2016. [Google Scholar]
- Alexander, J.H.; Eichhorn, G.; Gerdes, R.W.; Hanschen, T.P.; Herdtle, T.; Yoo, T. Multilayer Damping Material. U.S. Patent US-20180156296A1, 7 June 2018. [Google Scholar]
- Araújo, A.; Martins, P.; Soares, C.M.; Herskovits, J. Damping optimization of viscoelastic laminated sandwich composite structures. Struct. Multidiscip. Optim. 2009, 39, 569–579. [Google Scholar] [CrossRef]
- Liao, F.-S.; Su, A.-C.; Hsu, T.-C.J. Vibration damping of interleaved carbon fiber-epoxy composite beams. J. Compos. Mater. 1994, 28, 1840–1854. [Google Scholar] [CrossRef]
- Berthelot, J.-M.; Sefrani, Y. Damping analysis of unidirectional glass fiber composites with interleaved viscoelastic layers: Experimental investigation and discussion. J. Compos. Mater. 2006, 40, 1911–1932. [Google Scholar] [CrossRef]
- Fotsing, E.; Sola, M.; Ross, A.; Ruiz, E. Lightweight damping of composite sandwich beams: Experimental analysis. J. Compos. Mater. 2012, 47, 1501–1511. [Google Scholar] [CrossRef]
- Piollet, E.; Fotsing, E.R.; Ross, A.; Michon, G. High damping and nonlinear vibration of sandwich beams with entangled cross-linked fibres as core material. Compos. Part B Eng. 2019, 168, 353–366. [Google Scholar] [CrossRef]
- Gade, S.; Herlufsen, H. Digital filter vs fft techniques for damping measurements. J. Sound Vib. 1990, 24, 24–32. [Google Scholar]
- Barbero, E.J. Finite Element Analysis of Composite Materials Using Ansys®; Informa UK Limited: London, UK, 2013. [Google Scholar]
- Heylen, W.; Lammens, S.; Sas, P. Modal Analysis Theory and Testing, 2nd ed.; Katholieke Universiteit Leuven: Leuven, Belgium, 1998. [Google Scholar]
- Juang, J.-N.; Pappa, R.S. An eigensystem realization algorithm for modal parameter identification and model reduction. J. Guid. Control. Dyn. 1985, 8, 620–627. [Google Scholar] [CrossRef]
- Leissa, A.W. Vibrations of Plates; National Aeronautics and Space Administration (NASA): Washington, DC, USA, 1969. [Google Scholar]
- Ewins, D.J. Modal Testing: Theory, Practice and Application, 2nd ed.; Research Studies Press Ltd.: Baldock, UK, 2000. [Google Scholar]
- Rao, S.S. Mechanical Vibrations, 5th ed.; Prentice Hall: Upper Saddle River, NJ, USA, 2004. [Google Scholar]
- Charney, F.A. Unintended consequences of modeling damping in structures. J. Struct. Eng. 2008, 134, 581–592. [Google Scholar] [CrossRef]
© 2020 by the authors. Licensee MDPI, Basel, Switzerland. This article is an open access article distributed under the terms and conditions of the Creative Commons Attribution (CC BY) license (http://creativecommons.org/licenses/by/4.0/).