Abstract
A simple and accurate evaluation method of broken rock zone thickness (BRZT), which is usually used to describe the broken rock zone (BRZ), is meaningful, due to its ability to provide a reference for the roadway stability evaluation and support design. To create a relationship between various geological variables and the broken rock zone thickness (BRZT), the multiple linear regression (MLR), artificial neural network (ANN), Gaussian process (GP) and particle swarm optimization algorithm (PSO)-GP method were utilized, and the corresponding intelligence models were developed based on the database collected from various mines in China. Four variables including embedding depth (ED), drift span (DS), surrounding rock mass strength (RMS) and joint index (JI) were selected to train the intelligence model, while broken rock zone thickness (BRZT) is chosen as the output variable, and the k-fold cross-validation method was applied in the training process. After training, three validation metrics including variance account for (VAF), determination coefficient (R2) and root mean squared error (RMSE) were applied to describe the predictive performance of these developed models. After comparing performance based on a ranking method, the obtained results show that the PSO-GP model provides the best predictive performance in estimating broken rock zone thickness (BRZT). In addition, the sensitive effect of collected variables on broken rock zone thickness (BRZT) can be listed as JI, ED, DS and RMS, and JI was found to be the most sensitive factor.
1. Introduction
After the excavation of the tunnel, the original stress balance of the rock mass around the roadway was destroyed, which leads to the redistribution of original stress and has an impact on the surrounding underground structures including surrounding rock mass and surrounding filling bodies [1,2,3]. Meanwhile, the reduction of surrounding rock mass strength and the stress concentration will appear. The rock mass will be ruptured while the concentrated stress is greater than the surrounding rock mass strength, until the new stress balance created, and a broken rock zone (BRZ) will be developed during that process (see Figure 1). According to the study of Zhao and Wu [4] and Xu and Jing [5], the broken rock zone thickness (BRZT) can be used to describe the broken rock zone (BRZ), analyze the roadway surrounding rock stability and guide the roadway support design. Therefore, a simple and high-precision broken rock zone (BRZ) predictive method is important and meaningful.
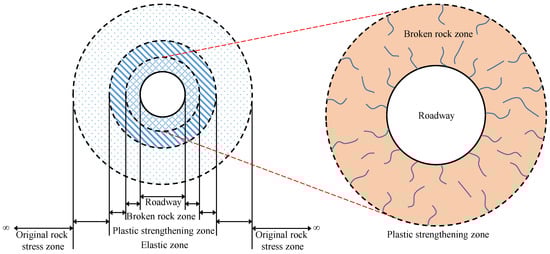
Figure 1.
Broken rock zone around the roadway.
For the accurate broken rock zone thickness (BRZT) determination, three methods including the empirical formula method, the on-site measurement method and the machine learning method were proposed.
For the empirical formula method, Yan [6] proposed an empirical formula for the thickness prediction based on the wave velocity of rock mass and rock. Shemyakin [7,8,9,10] proposed the discontinuous zone concept and the empirical formula of the discontinuous zone thickness. Dong [11] proposed a broken rock zone predictive formula based on the indoor test and filed experience. Although these formulas can be used to predict the broken rock zone thickness (BRZT), only a few factors are considered, a few engineering sites have been verified, and it is hard to be applied in the complex engineering environment.
For the on-site measurement method, the geological radar method, the borehole camera method and the ultrasonic method were considered in the broken rock zone (BRZ) measurement, and were applied in many successful cases, such as Tongsheng Tunnel [12] and Jiaojia Gold Mine [13]. These on-site measurement methods are practical but time- and labor-consuming.
For the machine learning method, several studies were conducted by worldwide researchers. For example, Zhou and Li [14] tested the feasibility of using a support vector machine to evaluate the broken rock zone thickness (BRZT) based on 132 datasets collected from many coal roadways. Zhao and Wu [4] also proposed a support vector machine (SVM) model to determine the broken rock zone thickness (BRZT), and the average relative error of that model is 2.66%, which means that the obtained results agree well with the actual BRZT values. Ma [15] combined the PSO algorithm and least square support vector machines (LSSVM), based on a 32 datasets database, and the developed PSO-LSSVM was verified to have the characteristic of fast convergence speed and high calculation accuracy. Zhu [16] utilized the artificial neural network (ANN) model to predict the broken rock zone thickness (BRZT), and the relative error of 9% can powerfully prove that the developed ANN model has high precision. Peng [17] proposed an RBF neural network model based on Matlab 6.5, and the relative error of two testing datasets is respectively 0.4% and 0.92%. Jing [18] and Xu et al. [19] applied the adaptive neuro-fuzzy network to predict the broken rock zone thickness (BRZT) and achieved nice predictive performance. Xue [20] combined the genetic algorithm (GA) and backpropagation (BP) neural network to analyze an 18 datasets database and found that the predictive performance of the new proposed GA-BP is much better than the original BP model. Liu et al. [21] utilized a wavelet relevance vector machine in broken rock zone (BRZ) prediction, and the proposed model is showing a square correlation coefficient of 0.95.
In recent years, artificial intelligence (AI) technology has developed very rapidly [22,23]. Some new methods such as Gaussian process (GP) were proposed, and the performance of that method was verified by many successful applications [24,25,26,27,28]. Although some artificial intelligence models were applied in the roadways broken rock zone (BRZ) prediction, the application of the Gaussian process (GP) was not analyzed, the effect of various factors on the broken rock zone thickness (BRZT) was also not conducted. Hence, the Gaussian process (GP) method was selected to predict the broken rock zone thickness (BRZT) in this study, the PSO algorithm was utilized to search the optimal hyper-parameter combination for optimal predictive performance, and a sensitivity analysis was carried out to find the most sensitive factor in the present paper.
2. Theoretical Background
2.1. Gaussian Process (GP)
GP is a nonparametric model and consists of a set of random variables with the Gaussian distribution. For a GP model, it can be determined after selecting the mean function and covariance function . So a GP model can be expressed by using the following equation [29,30].
When used for regression, GP will encrypt the uncertainty before executing the training. Then, Bayes rule will be used to update the beliefs through the function and calculate the posterior distribution [31]. To the authors’ best knowledge, the GP model has not been used in broken rock zone (BRZ) prediction, so a GP model associated with the rational quadratic covariance function was developed. For a high-performance GP development, it is necessary to select the optimal hyper-parameter combination, due to its huge impact on model performance. That combination can be obtained by using an optimization method or test-and-trial method, and the most widely used approach is to maximize the log marginal likelihood, and the conjugate gradient method is an effective method for these aims.
It should be noted that only a brief introduction was described here, more theory of GP can be found in the study of Rasmussen [29].
2.2. Particle Swarm Optimization Algorithm (PSO)
PSO is a popular meta-heuristic optimization algorithm, and the successful application of PSO can be found in many cases, including flyrock [32,33,34,35,36], air-overpressure [37] and rock strength [38,39]. In PSO, various particles will be created in a search space with randomly set location and velocity, then, the fitness value of each particle will be calculated by using the specified fitness function. In practice, particles in search space represent various solutions, and the main task of PSO is to find the optimal solution to the selected problem. For this aim, these particles move according to the velocity and location update equations with the guidance of the fitness value, and that procedure will be ended when the optimal solution was found [40].
To find the best position (gbest) of the particle, the velocity and position of particles were updated from the current position (Xc) and velocity value (Vc) to a new position (Xn) and velocity value (Vn), using the following equations [41,42].
where the optimal position of a particle is expressed by using Pbest. p1, p2, c1 and c2 are two random values and two positive acceleration constants.
2.3. PSO-GP Model Process
Using the PSO to optimize the GP model includes the following 5 steps (see Figure 2):
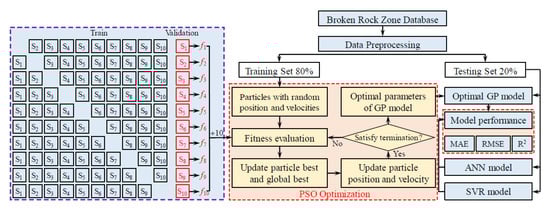
Figure 2.
Flowchart of the particle swarm optimization algorithm (PSO)-Gaussian process (GP) model.
- (1)
- Randomly divide the database into training datasets and testing datasets with a ratio of 80% and 20% [43,44,45].
- (2)
- Scale the training datasets and testing datasets into the range of 0 to 1 for reducing the calculation difficulties.
- (3)
- Find the optimal hyper-parameter combination of the GP model.
- (4)
- Develop the optimal training GP model.
- (5)
- Check the predictive performance of the trained GP model using testing datasets and verification metrics.
2.4. Artificial Neural Network (ANN)
ANN has been utilized in the science and engineering area for more than 80 years, and its performance in creating a high-level and non-linear relationship for the selected variables have been verified in many cases [46,47,48,49,50,51,52]. ANN is inspired by the neural structure of the human brain, and various network architecture, learning algorithms and transfer functions were proposed after long-term development [53,54]. Among ANN, the multi-layer perceptron (MLP) was considered to be the best ANN architecture and contains five parts, including the input layer, the hidden layer, the output layer, neurons in the layer and weight among these neurons. The back-propagation (BP) algorithm is the most popular MLP, and the knowledge form the training datasets will be forwarded, while the errors will be passed back to guide the updating of weights value [55,56,57]. During BP training, the weight updated according to the cost function for achieving better training performance, and that process will be ended when the cost function equal to or less than the setting level [58].
2.5. Multiple Linear Regression (MLR)
MLR is a simple method for creating a linear relationship between the independent variables and dependent variables, and that method can be carried out by many software such as Matlab, SPSS and Python [59]. In many published papers, MLR was often utilized as a robust regression method to summarize rules and predict engineering phenomena. Generally, the empirical formula obtained by using MLR can be expressed as [60,61]:
In Equation (3), a and b represent the obtained constant of the developed linear relationship, X and Y are respectively the selected input and output variables.
2.6. K-Fold Cross-Validation and Verification Metrics
K-fold cross-validation is an obvious method for generalization performance evaluation. Generally, the k-fold cross-validation is inserted in the model training process, the results of k-fold cross-validation can guide the hyper-parameters updating [62,63]. After reviewing, 10-fold cross-validation was accepted by most researchers, and considered to be a suitable model verification method [64]. For carrying out that procedure, the training dataset will be divided into 10 parts, and 9 parts will be trained with current hyper-parameters. After this, the developed predictive model will be checked using the remaining part, and each dataset has the opportunity to be tested during the 10-fold cross-validation process [65]. After 10 runs, the average performance, which is normally evaluated by RMSE, will be used to represent the generalization performance of the trained model.
After model training, the trained model should be evaluated to check the applicability of unknown data prediction by using testing datasets, so some verification metrics should be selected. In this study, VAF (variance account for), R2 (determination coefficient) and RMSE (root mean squared error) were employed to evaluate the relationship between predicted BRZT (BRZTPRE) and actual BRZT (BRZTACT) [66,67,68,69,70,71].
Here, n means the number of checked datasets, the best values of VAF, R2, and RMSE are respectively 100, 1 and 0.
3. Application
3.1. Broken Rock Zone Database
After reviewing the previous literature [14,18,72,73], a roadways broken rock zone (BRZ) database with 181 datasets consists of embedding depth (ED), drift span (DS), surrounding rock mass strength (RMS), joint index (JI) and broken rock zone thickness (BRZT) was collected. For the deamination of JI values, the overall, block, layered, fragmented and loose rock mass were assigned a value of 1 to 5, respectively. For the determination of BRZT values, some mines in this database use the ultrasonic detection method, and some mines use the geophysical detecting radar method. Among these 181 datasets, there are 154 datasets were collected from the roadway with depth of less than 800 m. Considering that there is a zoning rupture phenomenon when the excavation works enter deep mining, the concept of broken rock zone (BRZ) cannot fully describe the rapture of rock around the roadway [4]. In China, most scientists think that deep than 800 m can be judged as deep mining [74,75], so only the datasets (see Figure 3) with depth less than 800 m were analyzed in this paper. In Figure 3, the asterisks means the significance levels of the correlations, the more asterisks, the smaller the p value.
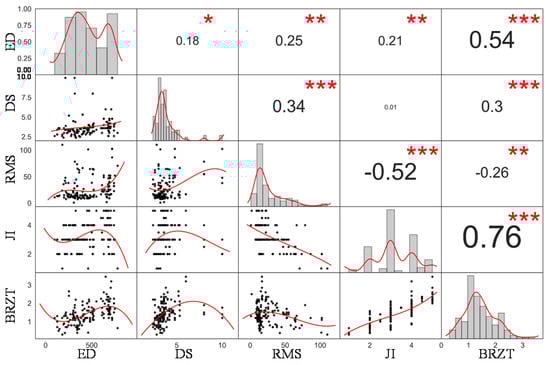
Figure 3.
Scatter plot matrix of the broken rock zone (BRZ) database.
As shown, the lower and upper triangle respectively represent the pairwise relationships and correlation coefficients, and the marginal distribution was shown by using the diagonal of Figure 3. It can be seen that there is an important relationship between these input variables. For better understanding, the maximum, minimum, standard deviation values of these five collected variables were tabulated by using Table 1.

Table 1.
Descriptive statistical values of the five collected variables in this paper.
3.2. Artificial Intelligence Model Results
3.2.1. Multiple Linear Regression Model
For broken rock zone prediction, the MLR method was utilized and the following empirical formula was created after using SPSS software.
By using the above formula, the predicted BRZT can be calculated and the predicting results with VAF of 76.2155, R2 of 0.7639 and RMSE of 0.2973 for training datasets and VAF of 88.6696, R2 of 0.8899 and RMSE of 0.1678 for testing datasets can be found in Figure 4.
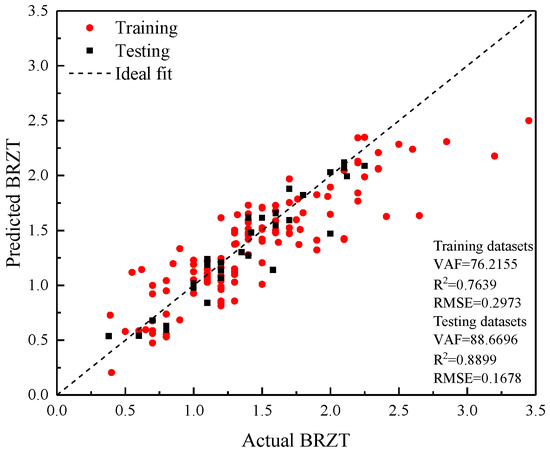
Figure 4.
Performance of the multiple linear regression (MLR) model.
3.2.2. Artificial Neural Network Results
For an accurate ANN model development, the structure of the hidden layer including the number of hidden layers and nodes in hidden layers should be determined first. Given the study of Mohamad et al. [38] and Hasanipahah et al. [40], the application of only a hidden layer also has a nice performance in solving the regression problems. Meanwhile, studies of Nguyen [76,77] also show that the ANN model with two layers is often used for more complex problems. Hence, a parameter investigation was carried out to find out the optimal number of nodes and the optimal number of hidden layers for BRZ prediction. In this investigation, various ANN models with the number of nodes from 1 to 9 and the number of hidden layers for 1 to 3 were developed, the 10-fold cross-validation method was applied, each model was run five times, and the optimal ANN models with different structure will be compared. After comparing, 2 was found to be the optimal number of hidden layers, 7 and 4 were respectively found to be the optimal number of nodes in the first hidden layer and the second hidden layer. Then, the predictive performance with VAF of 90.7759, R2 of 0.9086 and RMSE of 0.1779 for training datasets and VAF of 88.4466, R2 of 0.8993 and RMSE of 0.1630 for testing datasets was achieved (see Figure 5).
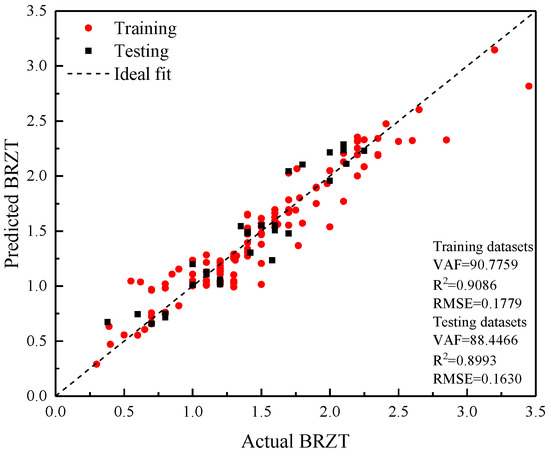
Figure 5.
Performance of the optimal artificial neural network (ANN) model.
3.2.3. Gaussian Process Results
Using the Gaussian process method, the hyper-parameters were searched, and the prepared training datasets were trained. After analyzing, the results show that the Gaussian process model can provide the predictive performance with VAF of 90.4209, R2 of 0.9051 and RMSE of 0.1798 for training datasets and VAF of 86.7895, R2 of 0.8900 and RMSE of 0.1733 for testing datasets, and the actual BRZT and predicted BRZT were plotted in Figure 6.
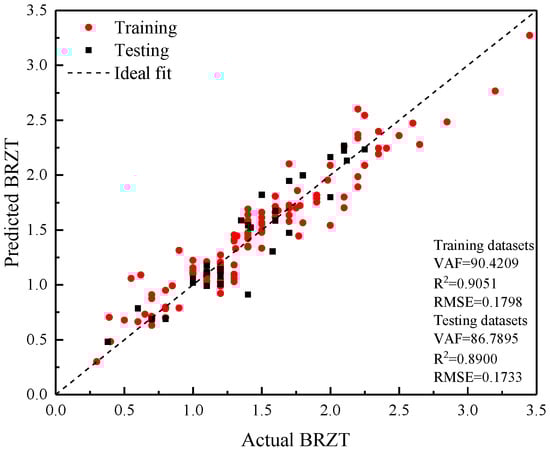
Figure 6.
Performance of the GP model.
3.2.4. PSO-GP Results
Before using the PSO to find the hyper-parameter of the GP model for achieving the best predictive performance, several parameters including the number of particles and the maximum number of iterations of PSO should be defined by the user. In the study of Fang et al. [78], Koopialipoor et al. [79] and Nguyen et al. [80], it can be found that the optimization algorithm such as GA, PSO and ABC can usually get stable results with the maximum number of iterations of 1000. Therefore, a parameter investigation for 9 PSO-GP models with the various number of particles from 20 to 300, the maximum number of iterations of 1000 and a search range of −10 to 10 was carried out, and it was found that the PSO model marked by 300 particles and 1000 iterations yield the lowest fitness curve. Moreover, no change of the fitness curve can be found after 200 iterations, so 300 and 200 were determined to be optimal parameters combination of the PSO-GP model. After calculation, the optimal PSO-GP model is showing the VAF of 94.3008, R2 of 0.9438 and RMSE of 0.1387 for training datasets, and the VAF of 89.2192, R2 of 0.9153 and RMSE of 0.1591 for testing datasets, and the actual BRZT and predicted BRZT were shown in Figure 7.

Figure 7.
Performance of the PSO-GP model.
3.3. Comparisons and Discussions
To compare the predictive performance of developed four predictive models and verify the optimization capability of PSO, the predictive performance of these models was compared by using Figure 8 and a ranking method provided by Zorlu [81] (see Figure 9).
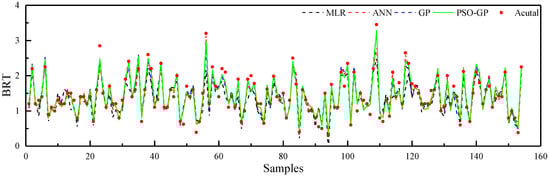
Figure 8.
Predictive results of the four predictive models.
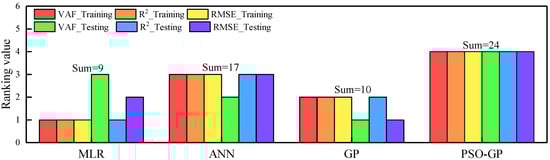
Figure 9.
Histogram of the ranking values of four predictive models.
As shown in Figure 8, predicted results provided by PSO-GP are most consistent with the actual measurement results, and the best predictive performance was also proved by the highest total ranking values of 24 by using Zorlu’s method.
For a better understanding of roadways broken rock zone (BRZ), a sensitivity analysis using cosine amplitude method [82] was carried out here to determine the influenced factors of these input variables on broken rock thickness. The sensitivity factor was obtained by using the following equations:
After calculating, the influenced factors of ED, DS, RMS and JI to BRZT are, respectively, 0.9384, 0.9162, 0.6651 and 0.9711, and it can be concluded that the joint index (JI) has the most influence on broken rock zone thickness (BRZT) prediction under the collected database.
In this study, four predictive models for roadway the broken rock zone (BRZ) prediction, including MLR model, ANN model, GP model and PSO-GP model were proposed and can provide the nice predictive performance of that engineering problem. However, some limitations can be found as follows:
- Due to the difference in mechanical behavior between shallow and deep mining, this paper focuses on shallow mining and can just be used in the prediction of roadway broken rock zone (BRZ) with depth less than 800 m.
- A large-scale and comprehensive comparison with various artificial intelligence models for a specified engineering problem and the same database is meaningful and can provide a guide for the on-site application. Although MLR, ANN, GP and PSO-GP were utilized in this paper, other methods, such as random forest (RF), support vector machine (SVM), extreme learning machine (ELM) and gene expression programming (GEP) were not analyzed, and other optimization algorithms, such as artificial bee colony algorithm (ABC), Salp Swarm algorithm (SSA), Harris Hawks optimization algorithm (HHO) and cuckoo search algorithm (CS), were not utilized.
- Although it is now possible to use some methods, such as borehole camera, geophysical detecting radar and ultrasonic detection, to measure the broken rock zone, it is still hard to develop a big enough database with enough datasets and enough factors. Though the authors tried the best to collect datasets, only 181 datasets were found, and that database is far from the big data level. Some studies [83,84] show that the broken rock zone is quite complex issue and is affected by many factors, such as rock beds gradient, drivage in the fold, seismic activity, goafs, drivage with blasting, etc. A qualified database should contain as many mine data as possible, due to the different conditions of each mine, we failed for developing a big enough database with various factors, so only four factors were utilized in this paper. In addition, the measurement method of broken rock zone thickness for some mines are different, for example, the BRZT was determined by using ultrasonic detection in Baizigou Coal Mine, Shuanggou Coal Mine and Jianchang Coal Mine, while it was determined by using geophysical detecting radar in Huafeng Coal Mine. Although these methods were utilized in many mines for BRZT measurement, the BRZT values in the collected database may not maintain uniform precision, due to the influence of the measurement method and measuring instruments.
As a data-driven method, the proposed models in this study are developed based on the collected BRZT database, so these models may provide nice performance when predicting BRZT of the mines contained in this database, but the performance cannot be guaranteed for the mines that have never been trained. Meanwhile, the limitations analyzed above may affect the analysis results, including intelligence predictive performance and sensitivity analysis results, and these limitations should be considered in the future investigation.
Nevertheless, this study is a powerful supplement to the roadway broken rock zone (BRZ) prediction and is a pioneer work, due to the application of GP and PSO-GP having not been introduced for that engineering problem.
4. Conclusions
For the simple and accurate prediction of roadways broken rock zone (BRZ), a Gaussian process model optimized by PSO based on a 181 datasets database was proposed. During the training process, 10-k-fold cross-validation was utilized for evaluating the generalization performance and guide the model training, three validation metrics including VAF, R2 and RMSE were used to verify the predictive performance of developed intelligence models. After comparing with the prediction performance of MLR (VAF of 76.2155, R2 of 0.7639 and RMSE of 0.2973 for training datasets and VAF of 88.6696, R2 of 0.8899 and RMSE of 0.1678 for testing datasets), ANN (VAF of 90.7759, R2 of 0.9086 and RMSE of 0.1779 for training datasets and VAF of 88.4466, R2 of 0.8993 and RMSE of 0.1630 for testing datasets) and GP (VAF of 90.4209, R2 of 0.9051 and RMSE of 0.1798 for training datasets and VAF of 86.7895, R2 of 0.8900 and RMSE of 0.1733 for testing datasets), the obtained results show that the PSO-GP shows the best performance with VAF of 94.3008, R2 of 0.9438 and RMSE of 0.1387 for training datasets and the VAF of 89.2192, R2 of 0.9153 and RMSE of 0.1591 for testing datasets. Meanwhile, the obvious optimization performance of the PSO algorithm was also verified. Last, the sensitivity analysis shows that there is no big difference between the effect of ED, RMS and JI on BRZT, and JI was found to be the most sensitive factor. The developed predictive model in this paper provides a simple and accurate method for broken rock zone thickness (BRZT) prediction, and can be referenced when solving similar complex engineering problems.
Author Contributions
Conceptualization, R.H.; methodology, Z.Y. and J.Z.; software, Z.Y.; validation, X.S. and J.Z.; formal analysis, Z.Y. and Y.G.; investigation, Z.Y. and Y.G.; resources, Z.Y.; data curation, Z.Y.; writing-original draft preparation, Z.Y. and R.H.; writing-review and editing, Z.Y. and J.Z.; visualization, Z.Y. and Y.G.; supervision, R.H. and Y.G.; project administration, Z.Y. and X.S.; funding acquisition, Z.Y., X.S., J.Z. All authors have read and agreed to the published version of the manuscript.
Funding
This study is supported by the National Natural Science Foundation Project of China (Grant Nos. 51874350 and 41807259), the National Key R&D Program of China (2017YFC0602902), the Innovation-Driven Project of Central South University (2020CX040) and the Fundamental Research Funds for the Central Universities of Central South University (2018zzts217).
Conflicts of Interest
The authors declare no conflict of interest.
References
- Zhao, G.Y.; Liang, W.Z.; Wang, S.F.; Hong, C.S. Prediction model for extent of excavation damaged zone around roadway based on dimensional analysis. Yantu Lixue/Rock Soil Mech. 2016, 37, 1–7. [Google Scholar]
- Chen, X.; Shi, X.; Zhou, J.; Yu, Z.; Huang, P. Determination of mechanical, flowability, and microstructural properties of cemented tailings backfill containing rice straw. Constr. Build. Mater. 2020, 246, 118520. [Google Scholar] [CrossRef]
- Wang, D.; Zhang, Q.; Chen, Q.; Qi, C.; Feng, Y.; Xiao, C. Temperature Variation Characteristics in Flocculation Settlement of Tailings and Its Mechanism. Int. J. Miner. Metall. Mater. 2020. [Google Scholar] [CrossRef]
- Zhao, G.Y.; Wu, H. Support vector machine model for predicting the thickness of excavation damaged zone. J. Guangxi Univ. Nat. Sci. Ed. 2013, 38, 4–10. [Google Scholar]
- Xu, G.A.; Jing, H.W. Study on intelligent prediction of broken rock zone thickness of coal mine roadways. Zhongguo Kuangye Daxue Xuebao/J. China Univ. Min. Technol. 2005, 34, 152–155. [Google Scholar]
- Yan, I. Derivation of excavation damazed zone’s thickness and plastic zone’s scope of tunnel. Jpn. Railw. Tech. Res. Rep. 1974, 900, 1–38. [Google Scholar]
- Shemyakin, I.; Fisenko, G.L.; Kurlenya, M.V. Zonal distintegration of rocks around underground workings.Ⅳ. practical applications. Soc. Min. Sci. 1988, 24, 297–302. [Google Scholar]
- Shemyakin, I.; Fisenko, G.L.; Kurlenya, M.V. Zonal distitegration of rocks around underground worikings.Ⅲ. theoretical notions. Sov. Min. Sci. 1987, 23, 1–6. [Google Scholar] [CrossRef]
- Shemyakin, I.; Fisenko, G.L.; Kurlenya, M.V. Zonal disintegration of rocks around underground workings.Ⅱ. disintegration of rocks on models of equivalent materials. Sov. Min. Sci. 1986, 22, 223–232. [Google Scholar] [CrossRef]
- Shemyakin, I.; Fisenko, G.L.; Kurlenya, M.V. Zonal disintegration of rocks around underground workings.I. data of insitu observations. Sov. Min. Sci. 1986, 22, 157–168. [Google Scholar] [CrossRef]
- Dong, F.T. The Supporting Theory Based on Broken Rock Zone and Its Application Technology; China Coal Industry Publishing Home: Beijing, China, 2001. [Google Scholar]
- Shen, F.; Zhong, W.; Liu, G.B.; Guo, W.Q. Test and analysis on loose circle of surrounding rock to large distortion region of tongsheng tunnel. Chin. J. Eng. Geophys. 2011, 8, 3–6. [Google Scholar]
- Zhang, Z.H.; An, L.; Wu, D.W.; Wu, C. Field detection of roadway surrounding rock loose zone and support technology of broken rock mass in jiaojia gold mine. Met. Mine 2019, 12, 56–61. [Google Scholar]
- Zhou, J.; Li, X.B. Evaluating the thickness of broken rock zone for deep roadways using nonlinear SVMs and multiple linear regression model. Procedia Eng. 2011, 26, 972–981. [Google Scholar] [CrossRef][Green Version]
- Ma, W.T. Predicative study of loosening zones around roadways with least square support vector machines method with optimized parameters. Yantu Lixue/Rock Soil Mech. 2007, 28, 460–464. [Google Scholar]
- Zhu, C.Q. The stable classification of gateway surrounding rock and the prediction of thickness of relaxation zone. Gold Sci. Technol. 1999, 7, 63–66. [Google Scholar]
- Peng, Z.Y. Prediction on the thickness of flexible wall rocks based on RBF neural network. In Proceedings of the National Symposim on New Mining Technology of Metal Mines, Beijing, China, 1 August 2007. [Google Scholar]
- Jing, H.W. Study on the Intelligence Prediction of Thickness of Broken Rock Zone for Coal Mine Roadwasys and Its Application; Tongji University: Shanghai, China, 2004. [Google Scholar]
- Xu, G.A.; Jing, H.W.; Li, K.G.; Chen, K.F. Development and application of intelligent prediction software for broken rock zone thickness of drifts. J. China Univ. Min. Technol. Ed. 2005, 15, 86–90. [Google Scholar]
- Xue, X.H. Application of algorithm neural network method in the prediction of loosen zone around roadway. Geotech. Eng. Tech. 2006, 20, 237–239. [Google Scholar]
- Liu, Y.; Ye, Y.; Wang, Q.; Liu, X.; Wang, W. Predicting the loose zone of roadway surrounding rock usingwavelet relevance vector machine. Appl. Sci. 2019, 9, 2064. [Google Scholar] [CrossRef]
- Zhou, J.; Li, X.; Shi, X. Long-term prediction model of rockburst in underground openings using heuristic algorithms and support vector machines. Saf. Sci. 2012, 50, 629–644. [Google Scholar] [CrossRef]
- Zhou, J.; Li, X.; Mitri, H.S. Evaluation method of rockburst: State-of-the-art literature review. Tunn. Undergr. Sp. Technol. 2018, 81, 632–659. [Google Scholar] [CrossRef]
- Ocak, I.; Seker, S.E. Calculation of surface settlements caused by EPBM tunneling using artificial neural network, SVM, and Gaussian processes. Environ. Earth Sci. 2013, 70, 1263–1276. [Google Scholar] [CrossRef]
- Bonakdari, H.; Ebtehaj, I.; Samui, P.; Gharabaghi, B. Lake water-level fluctuations forecasting using minimax probability machine regression, relevance vector machine, gaussian process regression, and extreme learning machine. Water Resour. Manag. 2019, 33, 3965–3984. [Google Scholar] [CrossRef]
- Arthur, C.K.; Temeng, V.A.; Ziggah, Y.Y. Novel approach to predicting blast-induced ground vibration using Gaussian process regression. Eng. Comput. 2019, 36, 29–42. [Google Scholar] [CrossRef]
- Liu, K.; Li, Y.; Hu, X.; Lucu, M.; Widanage, W.D. Gaussian process regression with automatic relevance determination kernel for calendar aging prediction of lithium-ion batteries. IEEE Trans. Ind. Inform. 2020, 16, 3767–3777. [Google Scholar] [CrossRef]
- Hewing, L.; Kabzan, J.; Zeilinger, M.N. Cautious model predictive control using gaussian process regression. IEEE Trans. Control Syst. Technol. 2019, 1–8. [Google Scholar] [CrossRef]
- Rasmussen, C.E. Gaussian processes in machine learning. J. Cardiovasc. Surg. 2004, 19, 63–71. [Google Scholar]
- Bui, X.-N.; Nguyen, H.; Le, H.-A.; Bui, H.-B.; Do, N.-H. Prediction of blast-induced air over-pressure in open-pit mine: Assessment of different artificial intelligence techniques. Nat. Resour. Res. 2020, 29, 571–591. [Google Scholar] [CrossRef]
- Le, L.T.; Nguyen, H.; Zhou, J.; Dou, J.; Moayedi, H. Estimating the heating load of buildings for smart city planning using a novel artificial intelligence technique PSO-XGBoost. Appl. Sci. 2019, 9, 2714. [Google Scholar] [CrossRef]
- Hasanipanah, M.; Jahed Armaghani, D.; Bakhshandeh Amnieh, H.; Majid, M.Z.A.; Tahir, M.M.D. Application of PSO to develop a powerful equation for prediction of flyrock due to blasting. Neural Comput. Appl. 2017, 28, 1043–1050. [Google Scholar] [CrossRef]
- Kalaivaani, P.T.; Akila, T.; Tahir, M.M.; Ahmed, M.; Surendar, A. A novel intelligent approach to simulate the blast-induced flyrock based on RFNN combined with PSO. Eng. Comput. 2019, 36, 435–442. [Google Scholar] [CrossRef]
- Zhou, J.; Koopialipoor, M.; Murlidhar, B.R.; Fatemi, S.A.; Tahir, M.M.; Jahed Armaghani, D.; Li, C. Use of intelligent methods to design effective pattern parameters of mine blasting to minimize flyrock distance. Nat. Resour. Res. 2019. [Google Scholar] [CrossRef]
- Armaghani, D.J.; Hajihassani, M.; Mohamad, E.T.; Marto, A.; Noorani, S.A. Blasting-induced flyrock and ground vibration prediction through an expert artificial neural network based on particle swarm optimization. Arab. J. Geosci. 2014, 7, 5383–5396. [Google Scholar] [CrossRef]
- Koopialipoor, M.; Fallah, A.; Armaghani, D.J.; Azizi, A.; Mohamad, E.T. Three hybrid intelligent models in estimating flyrock distance resulting from blasting. Eng. Comput. 2019, 35, 243–256. [Google Scholar] [CrossRef]
- Hasanipanah, M.; Shahnazar, A.; Bakhshandeh Amnieh, H.; Jahed Armaghani, D. Prediction of air-overpressure caused by mine blasting using a new hybrid PSO–SVR model. Eng. Comput. 2017, 33, 23–31. [Google Scholar] [CrossRef]
- Mohamad, E.T.; Jahed Armaghani, D.; Momeni, E.; Alavi Nezhad Khalil Abad, S.V. Prediction of the unconfined compressive strength of soft rocks: A PSO-based ANN approach. Bull. Eng. Geol. Environ. 2015, 74, 745–757. [Google Scholar] [CrossRef]
- Mahdiyar, A.; Armaghani, D.J.; Marto, A.; Nilashi, M.; Ismail, S. Rock tensile strength prediction using empirical and soft computing approaches. Bull. Eng. Geol. Environ. 2019, 78, 4519–4531. [Google Scholar] [CrossRef]
- Hasanipanah, M.; Noorian-Bidgoli, M.; Jahed Armaghani, D.; Khamesi, H. Feasibility of PSO-ANN model for predicting surface settlement caused by tunneling. Eng. Comput. 2016, 32, 705–715. [Google Scholar] [CrossRef]
- Zhou, J.; Li, X.; Hani, S.M.; Wang, S.; Wei, W. Identification of large-scale goaf instability in underground mine using particle swarm optimization and support vector machine. Int. J. Min. Sci. Technol. 2013, 23, 701–707. [Google Scholar] [CrossRef]
- Zhang, X.; Nguyen, H.; Bui, X.N.; Tran, Q.H.; Nguyen, D.A.; Bui, D.T.; Moayedi, H. Novel soft computing model for predicting blast-induced ground vibration in open-pit mines based on particle swarm optimization and XGBoost. Nat. Resour. Res. 2019, 29, 1–11. [Google Scholar] [CrossRef]
- Yu, Z.; Shi, X.; Zhou, J.; Chen, X.; Qiu, X. Effective assessment of blast-induced ground vibration using an optimized random forest model based on a harris hawks optimization algorithm. Appl. Sci. 2020, 10, 1403. [Google Scholar] [CrossRef]
- Yu, Z.; Shi, X.; Zhou, J.; Rao, D.; Chen, X.; Dong, W.; Miao, X.; Ipangelwa, T. Feasibility of the indirect determination of blast-induced rock movement based on three new hybrid intelligent models. Eng. Comput. 2019. [Google Scholar] [CrossRef]
- Zhou, J.; Li, E.; Yang, S.; Wang, M.; Shi, X.; Yao, S.; Mitri, H.S. Slope stability prediction for circular mode failure using gradient boosting machine approach based on an updated database of case histories. Saf. Sci. 2019, 118, 505–518. [Google Scholar] [CrossRef]
- Koopialipoor, M.; Fahimifar, A.; Ghaleini, E.N.; Momenzadeh, M.; Armaghani, D.J. Development of a new hybrid ANN for solving a geotechnical problem related to tunnel boring machine performance. Eng. Comput. 2019, 1–13. [Google Scholar] [CrossRef]
- Ahmad, M.W.; Mourshed, M.; Rezgui, Y. Trees vs Neurons: Comparison between random forest and ANN for high-resolution prediction of building energy consumption. Energy Build. 2017, 147, 77–89. [Google Scholar] [CrossRef]
- Shi, X.; Huang, D.; Zhou, J.; Zhang, S. Combined ANN prediction model for rock fragmentation distribution due to blasting. J. Inf. Comput. Sci. 2013, 10, 3511–3518. [Google Scholar] [CrossRef]
- Khandelwal, M.; Armaghani, D.J. Prediction of drillability of rocks with strength properties using a hybrid GA-ANN technique. Geotech. Geol. Eng. 2016, 34, 605–620. [Google Scholar] [CrossRef]
- Yu, Z.; Shi, X.; Zhou, J.; Chen, X.; Miao, X.; Teng, B.; Ipangelwa, T. Prediction of blast-induced rock movement during bench blasting: Use of Gray wolf optimizer and support vector regression. Nat. Resour. Res. 2020, 29, 843–865. [Google Scholar] [CrossRef]
- Zhou, J.; Koopialipoor, M.; Li, E.; Armaghani, D.J. Prediction of rockburst risk in underground projects developing a neuro-bee intelligent system. Bull. Eng. Geol. Environ. 2020. [Google Scholar] [CrossRef]
- Zhou, J.; Li, X.; Mitri, H.S. Classification of rockburst in underground projects: Comparison of ten supervised learning methods. J. Comput. Civ. Eng. 2016, 30, 4016003. [Google Scholar] [CrossRef]
- Khandelwal, M.; Singh, T.N. Prediction of blast induced ground vibrations and frequency in opencast mine: A neural network approach. J. Sound Vib. 2006, 289, 711–725. [Google Scholar] [CrossRef]
- Khandelwal, M.; Singh, T.N. Prediction of blast-induced ground vibration using artificial neural network. Int. J. Rock Mech. Min. Sci. 2009, 46, 1214–1222. [Google Scholar] [CrossRef]
- Marto, A.; Hajihassani, M.; Jahed Armaghani, D.; Tonnizam Mohamad, E.; Makhtar, A.M. A novel approach for blast-induced flyrock prediction based on imperialist competitive algorithm and artificial neural network. Sci. World J. 2014, 2014, 643715. [Google Scholar] [CrossRef] [PubMed]
- Zhou, J.; Guo, H.; Koopialipoor, M.; Jahed Armaghani, D.; Tahir, M.M. Investigating the effective parameters on the risk levels of rockburst phenomena by developing a hybrid heuristic algorithm. Eng. Comput. 2020. [Google Scholar] [CrossRef]
- Asteris, P.G.; Tsaris, A.K.; Cavaleri, L.; Repapis, C.C.; Papalou, A.; Di Trapani, F.; Karypidis, D.F. Prediction of the fundamental period of infilled rc frame structures using artificial neural networks. Comput. Intell. Neurosci. 2016, 2016, 5104907. [Google Scholar] [CrossRef]
- Moghaddasi, M.R.; Noorian-Bidgoli, M. ICA-ANN, ANN and multiple regression models for prediction of surface settlement caused by tunneling. Tunn. Undergr. Sp. Technol. 2018, 79, 197–209. [Google Scholar] [CrossRef]
- Faradonbeh, R.S.; Hasanipanah, M.; Amnieh, H.B.; Armaghani, D.J.; Monjezi, M. Development of GP and GEP models to estimate an environmental issue induced by blasting operation. Environ. Monit. Assess. 2018, 190, 351. [Google Scholar] [CrossRef]
- Hasanipanah, M.; Jahed, D.; Hassan, A.; Amnieh, B. A risk-based technique to analyze flyrock results through rock engineering system. Geotech. Geol. Eng. 2018, 36, 2247–2260. [Google Scholar] [CrossRef]
- Armaghani, D.J.; Hasanipanah, M.; Mahdiyar, A.; Abd Majid, M.Z.; Bakhshandeh Amnieh, H.; Tahir, M.M.D. Airblast prediction through a hybrid genetic algorithm-ANN model. Neural Comput. Appl. 2018, 29, 619–629. [Google Scholar] [CrossRef]
- Qi, C.; Tang, X. Slope stability prediction using integrated metaheuristic and machine learning approaches: A comparative study. Comput. Ind. Eng. 2018, 118, 112–122. [Google Scholar] [CrossRef]
- Qi, C.; Fourie, A.; Ma, G.; Tang, X. A hybrid method for improved stability prediction in construction projects: A case study of stope hangingwall stability. Appl. Soft Comput. J. 2018, 71, 649–658. [Google Scholar] [CrossRef]
- Kohavi, R. A study of cross-validation and bootstrap for accuracy estimation and model selection. Int. Jt. Conf. Artif. Intell. 1995, 2, 1137–1143. [Google Scholar]
- Hajihassani, M.; Kalatehjari, R.; Marto, A.; Mohamad, H.; Khosrotash, M. 3D prediction of tunneling-induced ground movements based on a hybrid ANN and empirical methods. Eng. Comput. 2020, 36, 251–269. [Google Scholar] [CrossRef]
- Zhou, J.; Li, C.; Koopialipoor, M.; Jahed Armaghani, D.; Thai Pham, B. Development of a new methodology for estimating the amount of PPV in surface mines based on prediction and probabilistic models (GEP-MC). Int. J. Mining Reclam. Environ. 2020, 1–21. [Google Scholar] [CrossRef]
- Jahed Armaghani, D.J.; Asteris, P.G.; Askarian, B.; Hasanipanah, M.; Tarinejad, R.; Huynh, V.V. Examining hybrid and single svm models with different kernels to predict rock brittleness. Sustainability 2020, 12, 2229. [Google Scholar] [CrossRef]
- Mirjalili, S.; Faris, H.; Aljarah, I. Evolutionary Machine Learning Techniques Algorithms and Applications; Springer: Basel, Switzerland, 2019; ISBN 9789813299894. [Google Scholar]
- Zhang, H.; Zhou, J.; Jahed Armaghani, D.; Tahir, M.M.; Pham, B.T.; Huynh, V.V. A Combination of feature selection and random forest techniques to solve a problem related to blast-induced ground vibration. Appl. Sci. 2020, 10, 869. [Google Scholar] [CrossRef]
- Asteris, P.G.; Nikoo, M. Artificial bee colony-based neural network for the prediction of the fundamental period of infilled frame structures. Neural Comput. Appl. 2019, 31, 4837–4847. [Google Scholar] [CrossRef]
- Chen, X.; Shi, X.; Zhang, S.; Chen, H.; Zhou, J.; Yu, Z.; Huang, P. Fiber-Reinforced Cemented Paste Backfill: The Effect of Fiber on Strength Properties and Estimation of Strength Using Nonlinear Models. Materials 2020, 13, 718. [Google Scholar] [CrossRef]
- Zhu, Z.J.; Zhang, H.W.; Chen, Y. Prediction model of loosening zones around roadway based on MPSO-SVM. Comput. Eng. Appl. 2014, 50, 1–5. [Google Scholar]
- Pang, J.Y.; Guo, L.B. Overall classification or rocks stability of coal roadway and rational choice of rocks bolting. J. Huainan Min. Inst. 1998, 18, 9–15. [Google Scholar]
- Liu, T.Y. Developing tendency of international mining technique. China Mine Eng. 2005, 34, 35–40. [Google Scholar]
- Zhang, X.; Zhang, X.; Liu, M.; Zhao, L. Deep structural characteristics and seismogenesis of the M≥8.0 earthquakes in North China. Acta Seismol. Sin. 2003, 16, 148–155. [Google Scholar] [CrossRef]
- Nguyen, H.; Bui, X.N.; Bui, H.B.; Mai, N.L. A comparative study of artificial neural networks in predicting blast-induced air-blast overpressure at Deo Nai open-pit coal mine, Vietnam. Neural Comput. Appl. 2018, 5. [Google Scholar] [CrossRef]
- Nguyen, H.; Drebenstedt, C.; Bui, X.N.; Bui, D.T. Prediction of blast-induced ground vibration in an open-pit mine by a novel hybrid model based on clustering and artificial neural network. Nat. Resour. Res. 2019. [Google Scholar] [CrossRef]
- Fang, Q.; Yazdani Bejarbaneh, B.; Vatandoust, M.; Jahed Armaghani, D.; Ramesh Murlidhar, B.; Tonnizam Mohamad, E. Strength evaluation of granite block samples with different predictive models. Eng. Comput. 2019. [Google Scholar] [CrossRef]
- Koopialipoor, M.; Jahed Armaghani, D.; Hedayat, A.; Marto, A.; Gordan, B. Applying various hybrid intelligent systems to evaluate and predict slope stability under static and dynamic conditions. Soft Comput. 2019, 23, 5913–5929. [Google Scholar] [CrossRef]
- Nguyen, H.; Choi, Y.; Bui, X.-N.N.; Nguyen-Thoi, T. Predicting blast-induced ground vibration in open-pit mines using vibration sensors and support vector regression-based optimization algorithms. Sensors 2020, 20, 132. [Google Scholar] [CrossRef]
- Zorlu, K.; Gokceoglu, C.; Ocakoglu, F.; Nefeslioglu, H.A.; Acikalin, S. Prediction of uniaxial compressive strength of sandstones using petrography-based models. Eng. Geol. 2008, 96, 141–158. [Google Scholar] [CrossRef]
- Yang, Y.; Zhang, Q. A hierarchical analysis for rock engineering using artificial neural networks. Rock Mech. Rock Eng. 1997, 30, 207–222. [Google Scholar] [CrossRef]
- Canbulat, I. Roadway roof support design in critical areas at anglo American metallurgical coal’s underground operations. In Proceedings of the 2010 Coal Operator’s Conference, Mining Engineering, Wollongong, Australia, 18–20 February 2019. [Google Scholar]
- Niedbalski, Z.; Majcherczyk, T. Indicative assessment of design efficiency of mining roadways. J. Sustain. Min. 2018, 17, 131–138. [Google Scholar] [CrossRef]
© 2020 by the authors. Licensee MDPI, Basel, Switzerland. This article is an open access article distributed under the terms and conditions of the Creative Commons Attribution (CC BY) license (http://creativecommons.org/licenses/by/4.0/).