1. Introduction
The rapid introduction of fifth generation (5G) mobile networks is causing major public concern. Notably, the use of new frequency bands below and above 6 GHz, as well as the need for a denser base station infrastructure, and the proposed waiving of or reduction in precautionary limits in some countries are intensifying the debate. Frequency bands above 6 GHz will be opened for 5G, which require additional risk assessment research [
1,
2,
3,
4,
5,
6]. However, the first 5G network installations will make use only of frequencies below 6 GHz, the frequency range that has been utilized for wireless communications for the past two decades. Nevertheless, there is very little practical and theoretical knowledge about the expected exposure from upcoming 5G networks in this frequency range. In addition, the most recent studies on the analysis of human exposure to mobile communication networks focus either on the exposure from an individual’s mobile device [
7,
8] or the base station network [
9] separately. There are various recent studies [
10,
11,
12,
13,
14,
15] that have been published, aimed at the optimization of wireless networks with respect to energy efficiency, and human exposure. From those studies, only [
12] analyses the network infrastructure for the exposure to uplink signals from mobile devices. On the other hand, [
12] does not consider different usage patterns or attempts to combine uplink, downlink, and bystander exposure. However, in modern, highly dynamic and adaptive networks, the mobile device, the network, and the data usage cannot be regarded as standalone when evaluating the total dose.
In this study, we investigate the combined dose from a user’s mobile device and the surrounding base station network for various usage scenarios, user locations, and network topologies. As there is very little reliable data on the performance behavior of 5G networks in real implementations to date, we extrapolated performance behavior from measured 4th generation (4G) Long Term Evolution (LTE) mobile network data. Based on inputs from Swiss mobile operators, their performance targets for 5G networks are to provide data rates of 100 MBit/s everywhereand 3 GBit/s in peak locations. It is important to note that the everywhere requirement is a factor of about 10–20 higher than that for current LTE networks. This study is not designed to allow conclusions to be drawn about absolute levels of exposure, but rather to differentially evaluate the various scenarios of 5G networks. Other sources of exposure, e.g., wireless local area network (WLAN), radio, and television (TV) broadcast, etc., are excluded. Most 5G networks will rely on a hybrid network topology. Therefore, one focus of this study is on the effect on the total dose of the percentage of indoor cells used in such a hybrid network. This study is based on the supposition that the network topologies can be achieved; we do not look into how network coverage will be realized.
In summary, the overall objective of this study is to evaluate total human exposure in hypothetical 5G networks for different topologies and user scenarios and to identify factors that minimize the total exposure of the population.
2. Methods
The influence of various factors on total dose in mobile communication networks was modeled and analyzed with the help of the Monte Carlo simulation technique. The total dose is described here as the local peak specific absorption rate (SAR) spatially averaged over any 10 g of tissue mass (psaSAR
10g) over a period of 6 min. The unit psaSAR
10g was chosen because it defines the governing basic restriction for wireless exposure, as the whole-body average SAR limits (wbaSAR) are intrinsically met if the limits of local exposure are satisfied. The averaging duration of 6 min constitutes the internationally accepted averaging time to prevent thermal hazards at frequencies below 6 GHz, as instantaneous values have little justification [
16]. Despite new revisions of safety guidelines being available [
17,
18] we focus on [
16] here as this is the most widely adopted guideline internationally. However, both [
17,
18] implement averaging times of 6 min for localized SAR for the considered frequency range. It should be noted that some regulators, e.g., the US Federal Communications Commission (FCC), define shorter averaging time periods of 100 s.
2.1. Full Wave Electromagnetic Simulations
The implementation of 5G networks in many countries adds a novel frequency band at around 3.6 GHz. The local absorption characteristics, e.g., in the human head, are frequency dependent [
7] and need to be accounted for in this study. To be able to cover the frequency-dependent effects for 5G, we extended the work of [
7], applying the same methods to the newly added frequencies at 3.6 GHz.
2.2. Monte Carlo Estimation Model
The analysis of the total dose can be summarized in the following steps:
derive a closed-form expression for the total psaSAR10g with respect to the study input variables;
describe the study input variables by means of probability distributions and constants;
combine the different probability distributions by means of the Monte Carlo simulation technique;
provide results by means of statistical summaries.
The total dose in this study is defined as:
where SAR
10gmobile is the 10 g SAR in the body of the user caused by exposure to the uplink signal of his/her own mobile device, SAR
10gbase station is the 10 g SAR caused by exposure to the base station downlink signal, and SAR
10gbystander is the exposure caused by the mobile uplink signal of the mobile devices of bystanders. We assume that the exposure from bystander mobile devices and base stations is homogenous over the entire body when averaged over the 6-min intervals. The contribution of the user’s own mobile phone is determined by:
where psaSAR
10gmobile is the maximum SAR of the mobile phone measured at maximum output power, its relative transmit power
, and the duty cycle of the user’s own data transmission usage (
own). We determine
based on the reference signal received power (
) and path loss (
) in the network and use a factor of
N (0...100%) to model enhanced indoor coverage in the network:
is limited to 0 to −40 dB (1/10,000) based on mobile station dynamic range measurements in 4G networks [
8]. Similarly, we calculate the SAR from the uplink of any bystander mobile phone:
which is based on the assumption that the bystander is transmitting with the same power control level
as the subject’s own mobile phone, but with a distinctly different bystander duty cycle
. The maximum output power of the bystander’s mobile phone is assumed to be 0.2 W [
8], with an estimated uplink radiation factor
(loss) of 6 dB or a factor of 4 based on various studies in this area [
19,
20,
21]. Based on the assumption that the propagation is isotropic (
), we assume that there is a bystander at the distance
r, where
r is dependent on the population density at a geographical location under investigation. The coupling factor (
) translates the incident power density from the bystander into the induced quantity SAR. Based on [
22], an average coupling factor of 0.054
is applied to convert the incident power density to SAR.
Similarly, the SAR from the base station can be calculated on the basis of the incident power density (
S) and a coupling factor (
):
The scaling factor
N is again used to include indoor coverage systems in the network topology differentially. The
is determined per resource element (bandwidth) and is therefore multiplied by a factor of 12 for each resource block bandwidth, as this data originates from LTE. Note: while in LTE, each resource block can only have 12 subcarriers with 15 kHz bandwidths per resource block; there are more options in 5G new radio (NR).
is the number of resource blocks occupied in the downlink. The authors in [
23] report an average per-user downlink data rate of approximately 20 Mbps in an LTE cell with a 100% load, a 15-MHz bandwidth and an
of
dBm at the cell edge and a 2 × 2 multiple-input multiple-output (MIMO). Based on this information, we observe that an LTE cell with 75 resource blocks in the downlink can achieve a per-user downlink capacity of 20 Mbps with a cell edge
of <
dBm and no MIMO present. The factor
eff4G5G is the increase in spectral efficiency between 5G and LTE. Based on [
24],
eff4G5G is assumed to be 3, but this factor of 3 can be disputed, especially in initial implementations of 5G networks [
25]. However, in this study design, with an emphasis on relative statements, the same factor applies to mobile stations and base stations and is therefore not relevant to evaluate differential effects of network structures and data usage.
data4G5G, the increase in data capacity required for transitioning from LTE to 5G, is expected to be at least 5 with respect to the reference LTE cell with 20 Mbps at a cell edge
of <
, i.e., 100 Mbps.
is the uplink radiation factor accounting for propagation losses in the user equipment (UE) and the user’s body (6dB).
Ae is the effective aperture of the UE antenna that measures the
. We apply the
Ae of a dipole antenna at 2 GHz.
2.2.1. Exposure Categories and Scenarios
We evaluated the model for a set of exposure scenarios defined by (1) geographical location, (2) base station cell type, (3) level of indoor coverage, and (4) usage behavior. Three different geographical locations based on the number of citizens within 500 m from the base station were defined by the operator that provided the data:
rural: 0–800 citizens, bystander distance m;
suburban: 801–4000 citizens, bystander distance; m;
urban: >4000 citizens, bystander distance m ( m for trains/urban centers).
Measured LTE cells were categorized as macrocells (rural, suburban, and urban) and additionally as mini and microcells (urban as well as indoor). Additionally, we simulated a shrinking cell size corresponding to 6, and 12 dB increases at the cell edge. The increase in indoor coverage was simulated in the range from 0% to 100% for each cell type. We also defined four user types based on their daily data usage:
non-user: does not own a mobile phone;
light user: uses 100 MByte/day;
medium user: 1 GByte/day;
heavy user: 10 GByte/day.
2.2.2. Model Input
Key to our statistical model are the categorized
and
measurements in a Swiss mobile LTE network.
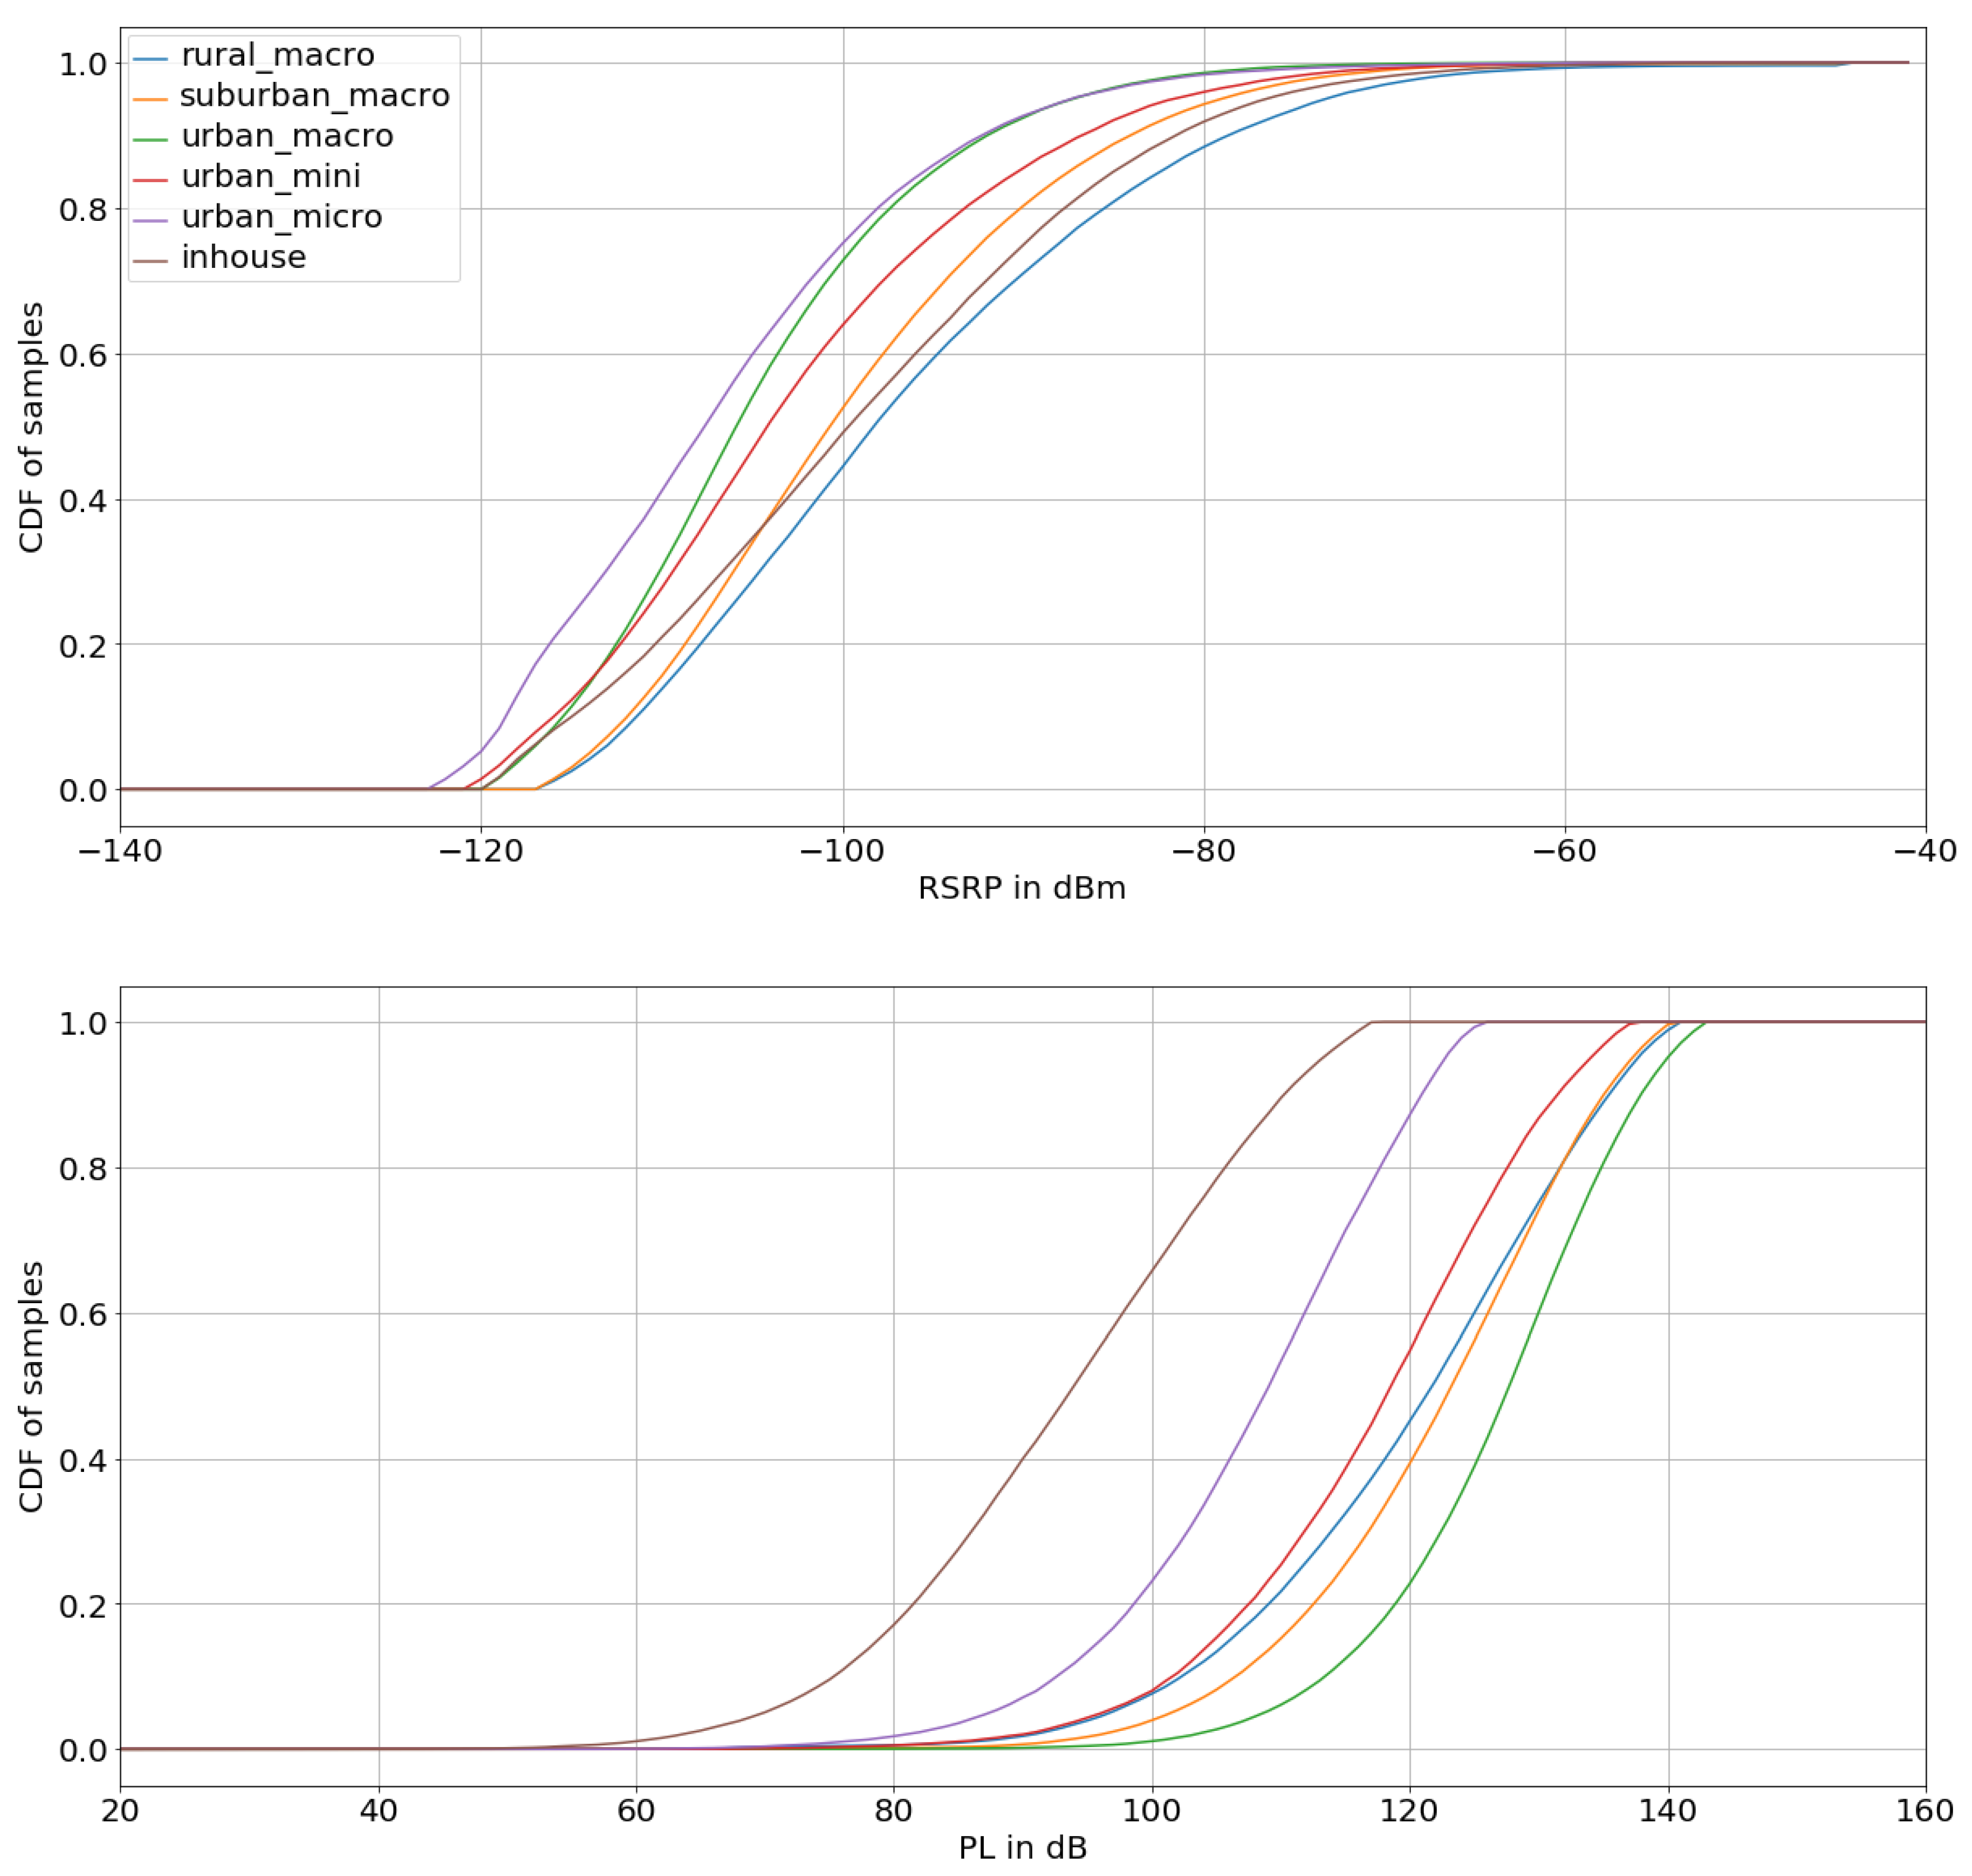
Figure 1 shows the cumulative distribution functions (CDF) of the measured
and
data for different geographical locations used in this study. In the Monte Carlo model, we randomly draw
and
pairs to simulate the mobile phones’ received power, which is related to the incident power density, and the mobile phones’ output power and available data rate, which are inversely related to the path loss.
As there is still very little traffic in real 5G networks, we used the LTE data and the processes described above to extrapolate to the foreseeable behavior in 5G networks. Specifically, we scaled the LTE data by the improved spectral efficiency and data bandwidth (more than tenfold) in the hypothetical 5G networks.
Based on [
22], an average coupling factor of 0.054
is applied to convert the incident power density from base station and bystanders to SAR. To determine psaSAR
10gmobile, we analyzed the full psaSAR test reports [
26] of the latest models from Apple, Samsung, and Huawei with more than 2000 SAR measurements in total covering the frequency range from 700 MHz–2.6 GHz. We found that the average psaSAR values from the phones of these vendors are 0.16, 0.3, and 0.52 W/kg, respectively, with standard deviations of <3 dB. Because of the small spread, a psaSAR
10gmobile value of 0.33 W/kg was selected, and the statistical distribution of the mobile phone psaSAR is not included in the Monte Carlo analysis.
As there are no data in the literature covering the analysis of uplink usage statistics in modern 4G mobile networks, we generated hypothetical usage patterns. We generated uplink data traffic, as summarized in
Table 1. The traffic is quantized in atomic units that are transmitted at the maximum possible data rate at once, e.g., uploading a video and streaming units that require a certain data rate for a specific duration (e.g., a video call). We randomly distributed the required atomic and streaming data units for each user type over a 14 h time frame from 8 am to 10 pm, with a resolution of 1 s, referred to as
(
t, user), being the required data rate in each second. As the data rate may be limited due to the signal quality, we then filtered the peak data rate of
(
t, user) for the following path loss and data rate pairs: ≥130, 10 Mbps; <130, 15 Mbps; <120, 20 Mbps; <110, 30 Mbps; <100, 45 Mbps; <90, 60 Mbps; <80, 90 Mbps; <70, 120 Mbps; and <60, 180 Mbps. These data rates were chosen based on an uplink to downlink ratio of 1/10, a minimum downlink data rate requirement of 100 Mbps at the cell edge, and a maximum downlink data rate of approximately 2 Gbps. In the case that the available data rate (depending on the
) is insufficient at any instant of time, the transmission duration is prolonged at the maximum rate until all data is transmitted. In the simulations, it is assumed that all cell types can reach their full theoretical capacity in the future, even though this may not be the case for all types to date.
The resulting filtered data rate time course is referred to as
(
t, user,
). For each instant of time, we calculated the duty cycle (
) of the mobile phone with respect to the maximum possible data rate for each
range:
The time course is then subdivided into 6-min intervals over which the average duty cycle
6min-avg(
N, user,
) is calculated:
resulting in 140 samples of 6-min averaged duty cycles for each user type and
level to be used in the Monte Carlo simulation.
2.2.3. Numerical Modelling and Analysis
The Monte Carlo model was implemented with Jupyter Python Notebooks. A total of 224 scenarios were analyzed for the aforementioned input variables and categories, with 10,000 to 40,000 simulation iterations for each scenario. Statistical summaries were calculated for log10(SAR10gtotal) in the form of histograms, cumulative distribution functions, median, and 95th percentiles. A logarithmic representation was chosen, as the underlying data is log-normally distributed.
3. Results
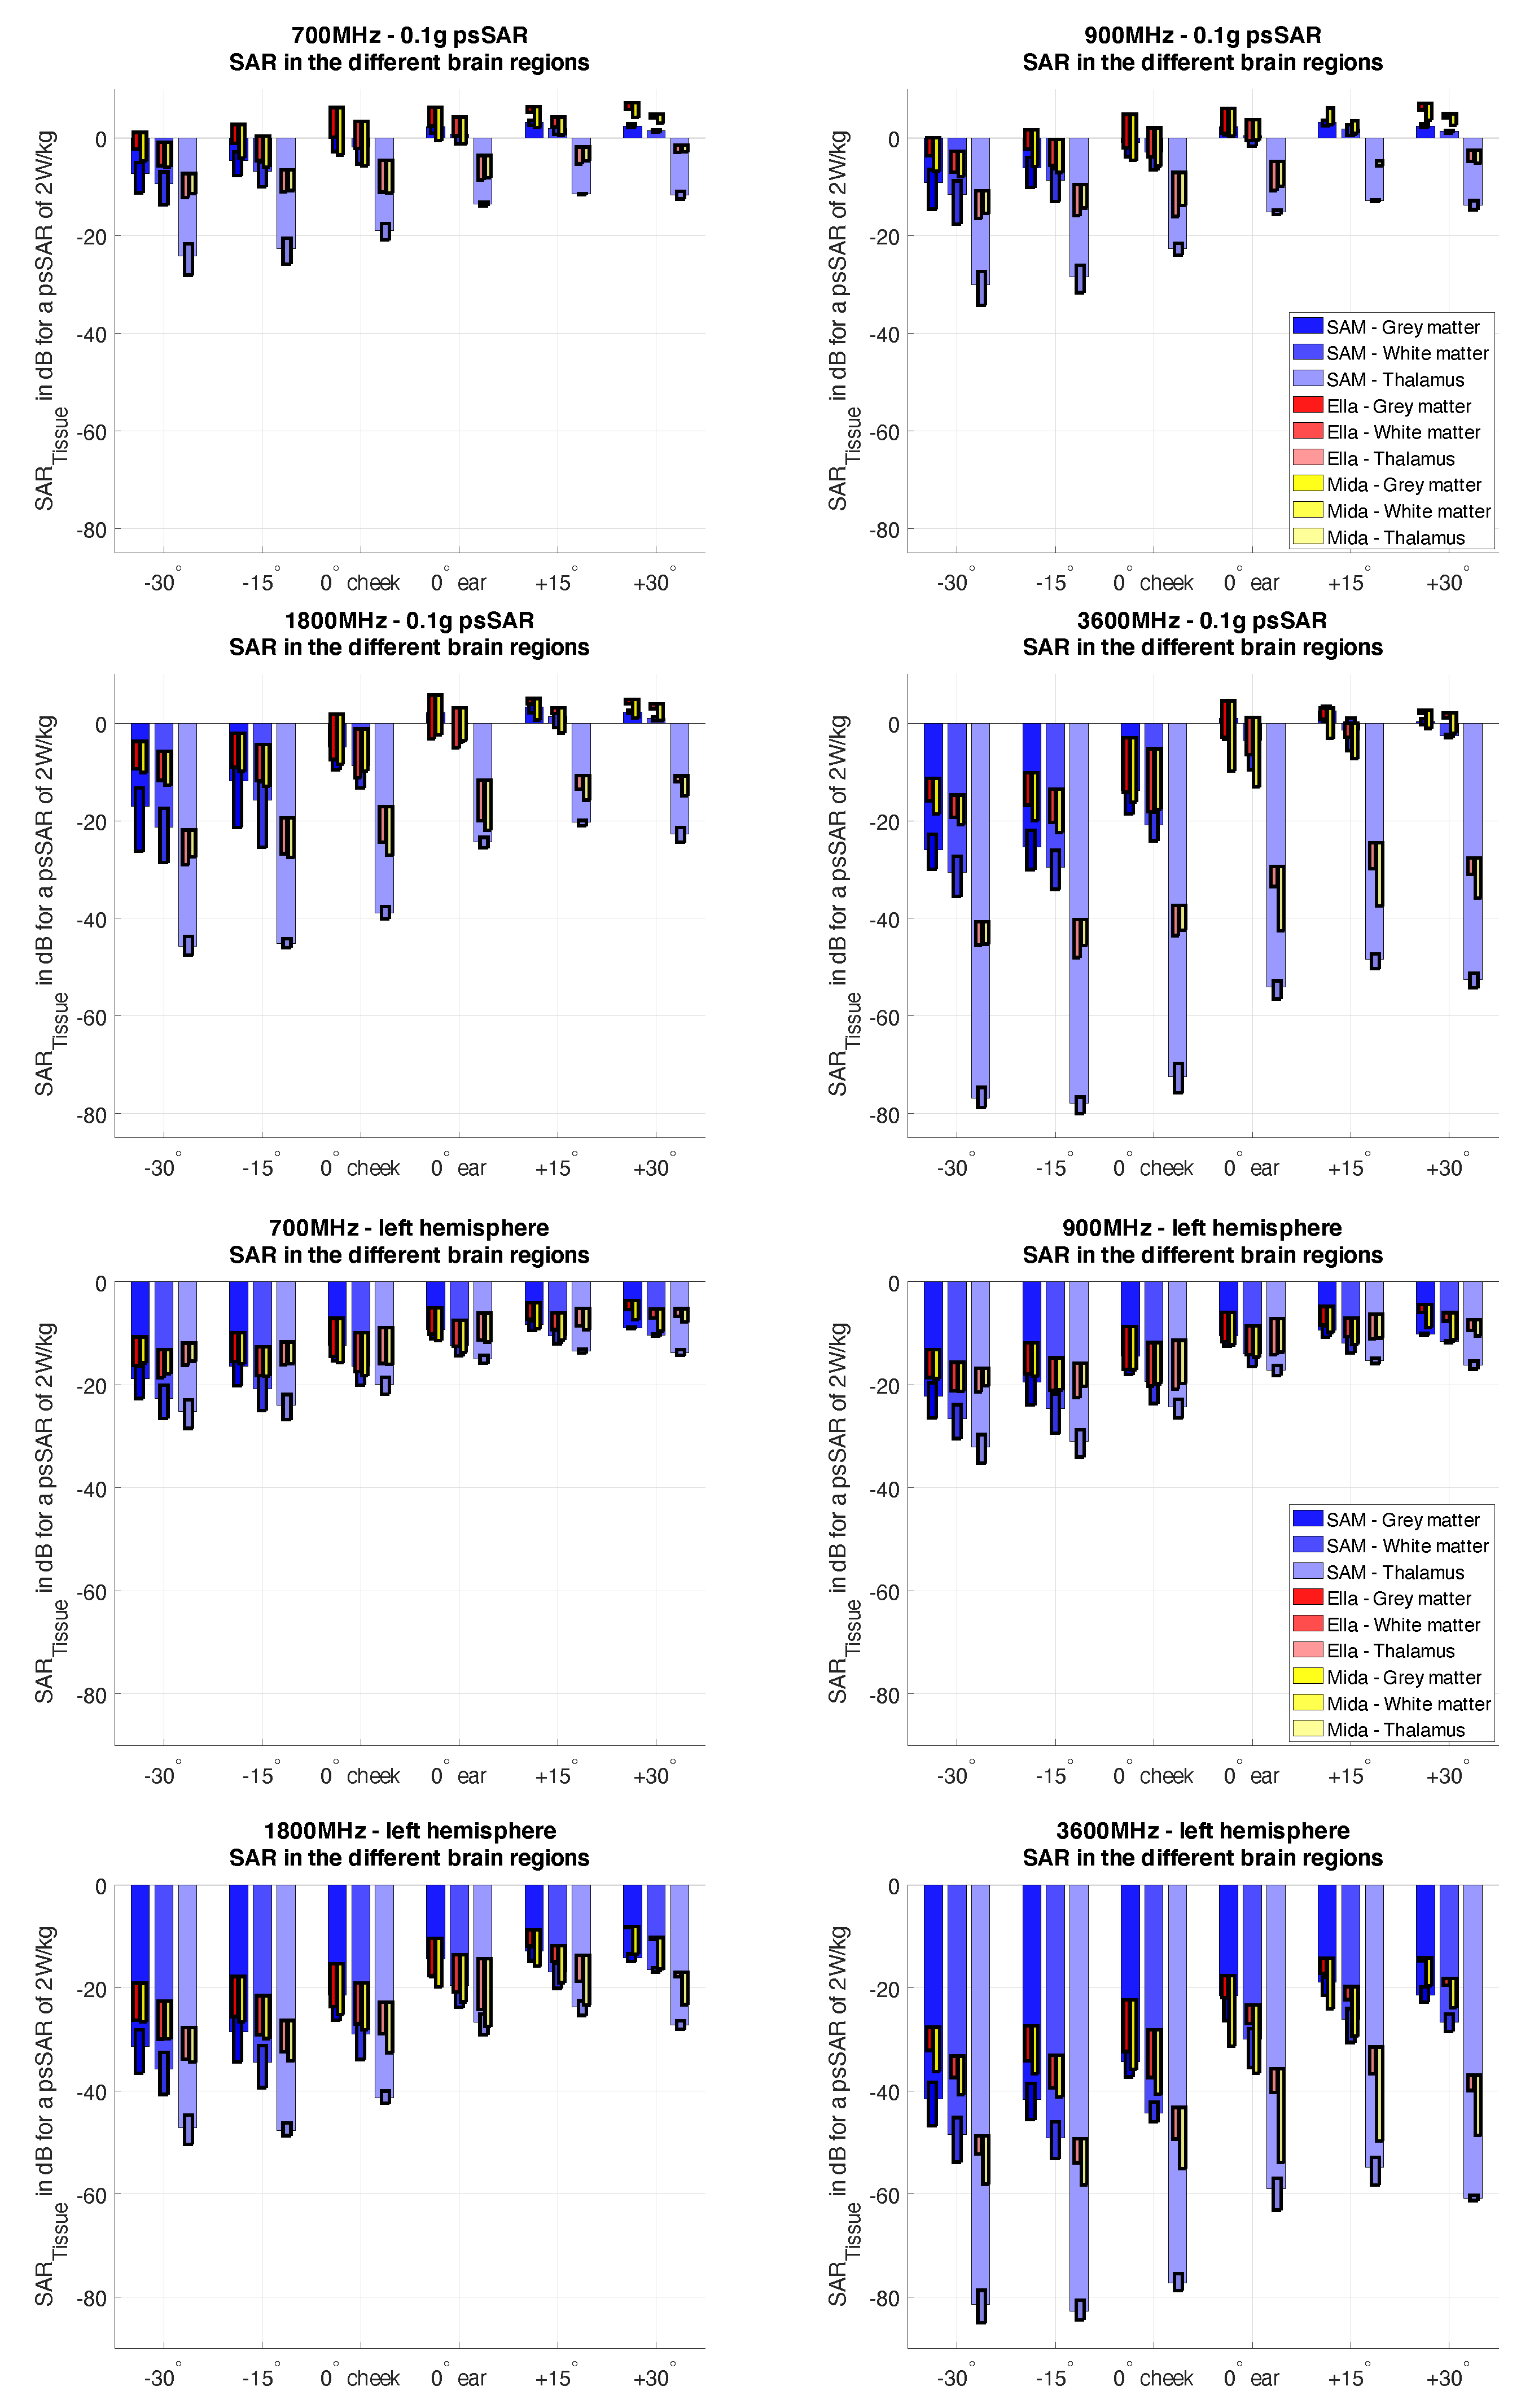
Figure 2 shows the differences in absorbed energy in various brain regions (tissue averaged) in the human head of the Multimodal Imaging-Based Detailed Anatomical (MIDA) phantom [
27], the Ella phantom [
28] and the homogeneous specific anthropomorphic mannequin (SAM) phantom with virtual brain regions mapped inside [
29] when exposed to generic near-field sources in the frequency range 700–3600 MHz. The results illustrate the absorption characteristics in the human head as a function of frequency. In general, the higher the frequency, the lower the penetration of electromagnetic energy into the brain due to the stronger attenuation at higher frequencies. The tissue-averaged SAR in the outermost region (grey matter) is about a factor of 6 lower at 3.6 GHz than at 700 MHz. However, the local peak SAR (0.1 g average) on the outer surface of the grey matter remains approximately the same (±3 dB) over all frequencies, as shown in
Figure 2. The differences in attenuation also lead to changes in the exposure levels of the different brain regions. Due to the frequency-dependent attenuation, the difference in the tissue-averaged SAR between the grey matter and the thalamus increases from 3–6 dB at 700 MHz to >20 dB at 3.6 GHz.
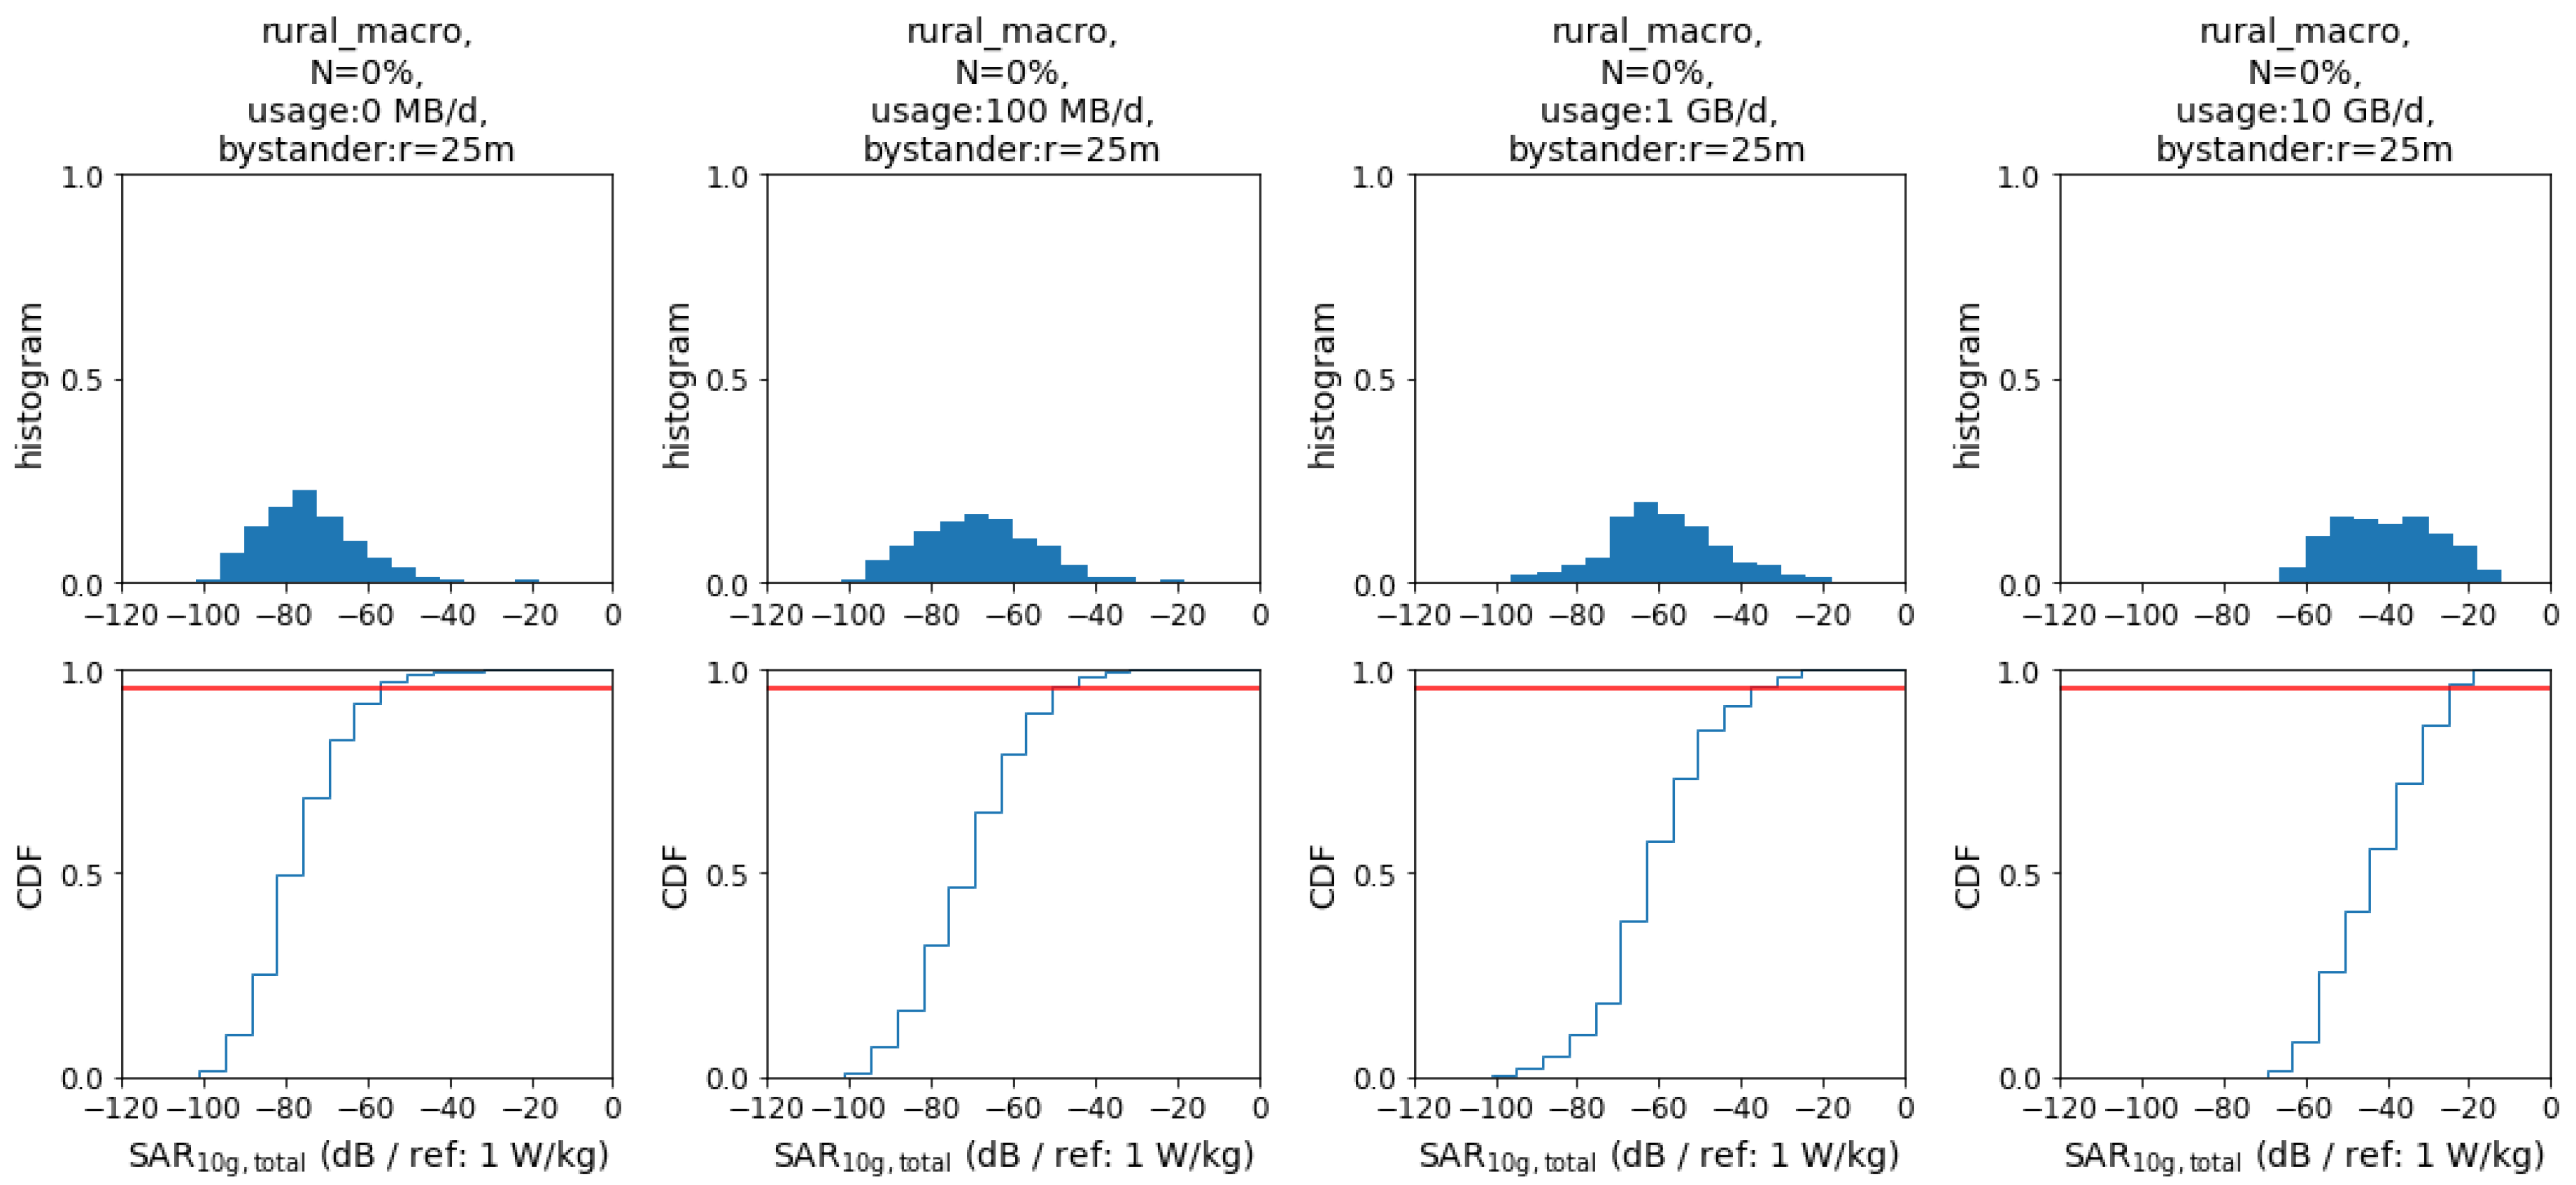
Histograms, as shown in
Figure 3, were generated for the following study variables: location: rural, suburban, urban; bystander (dependent on the population density of the location); indoor coverage: 0–100%; daily usage: 0–10 GByte/d; and cell size (edge signal reduction by 0 dB, 6 dB, or 12 dB).
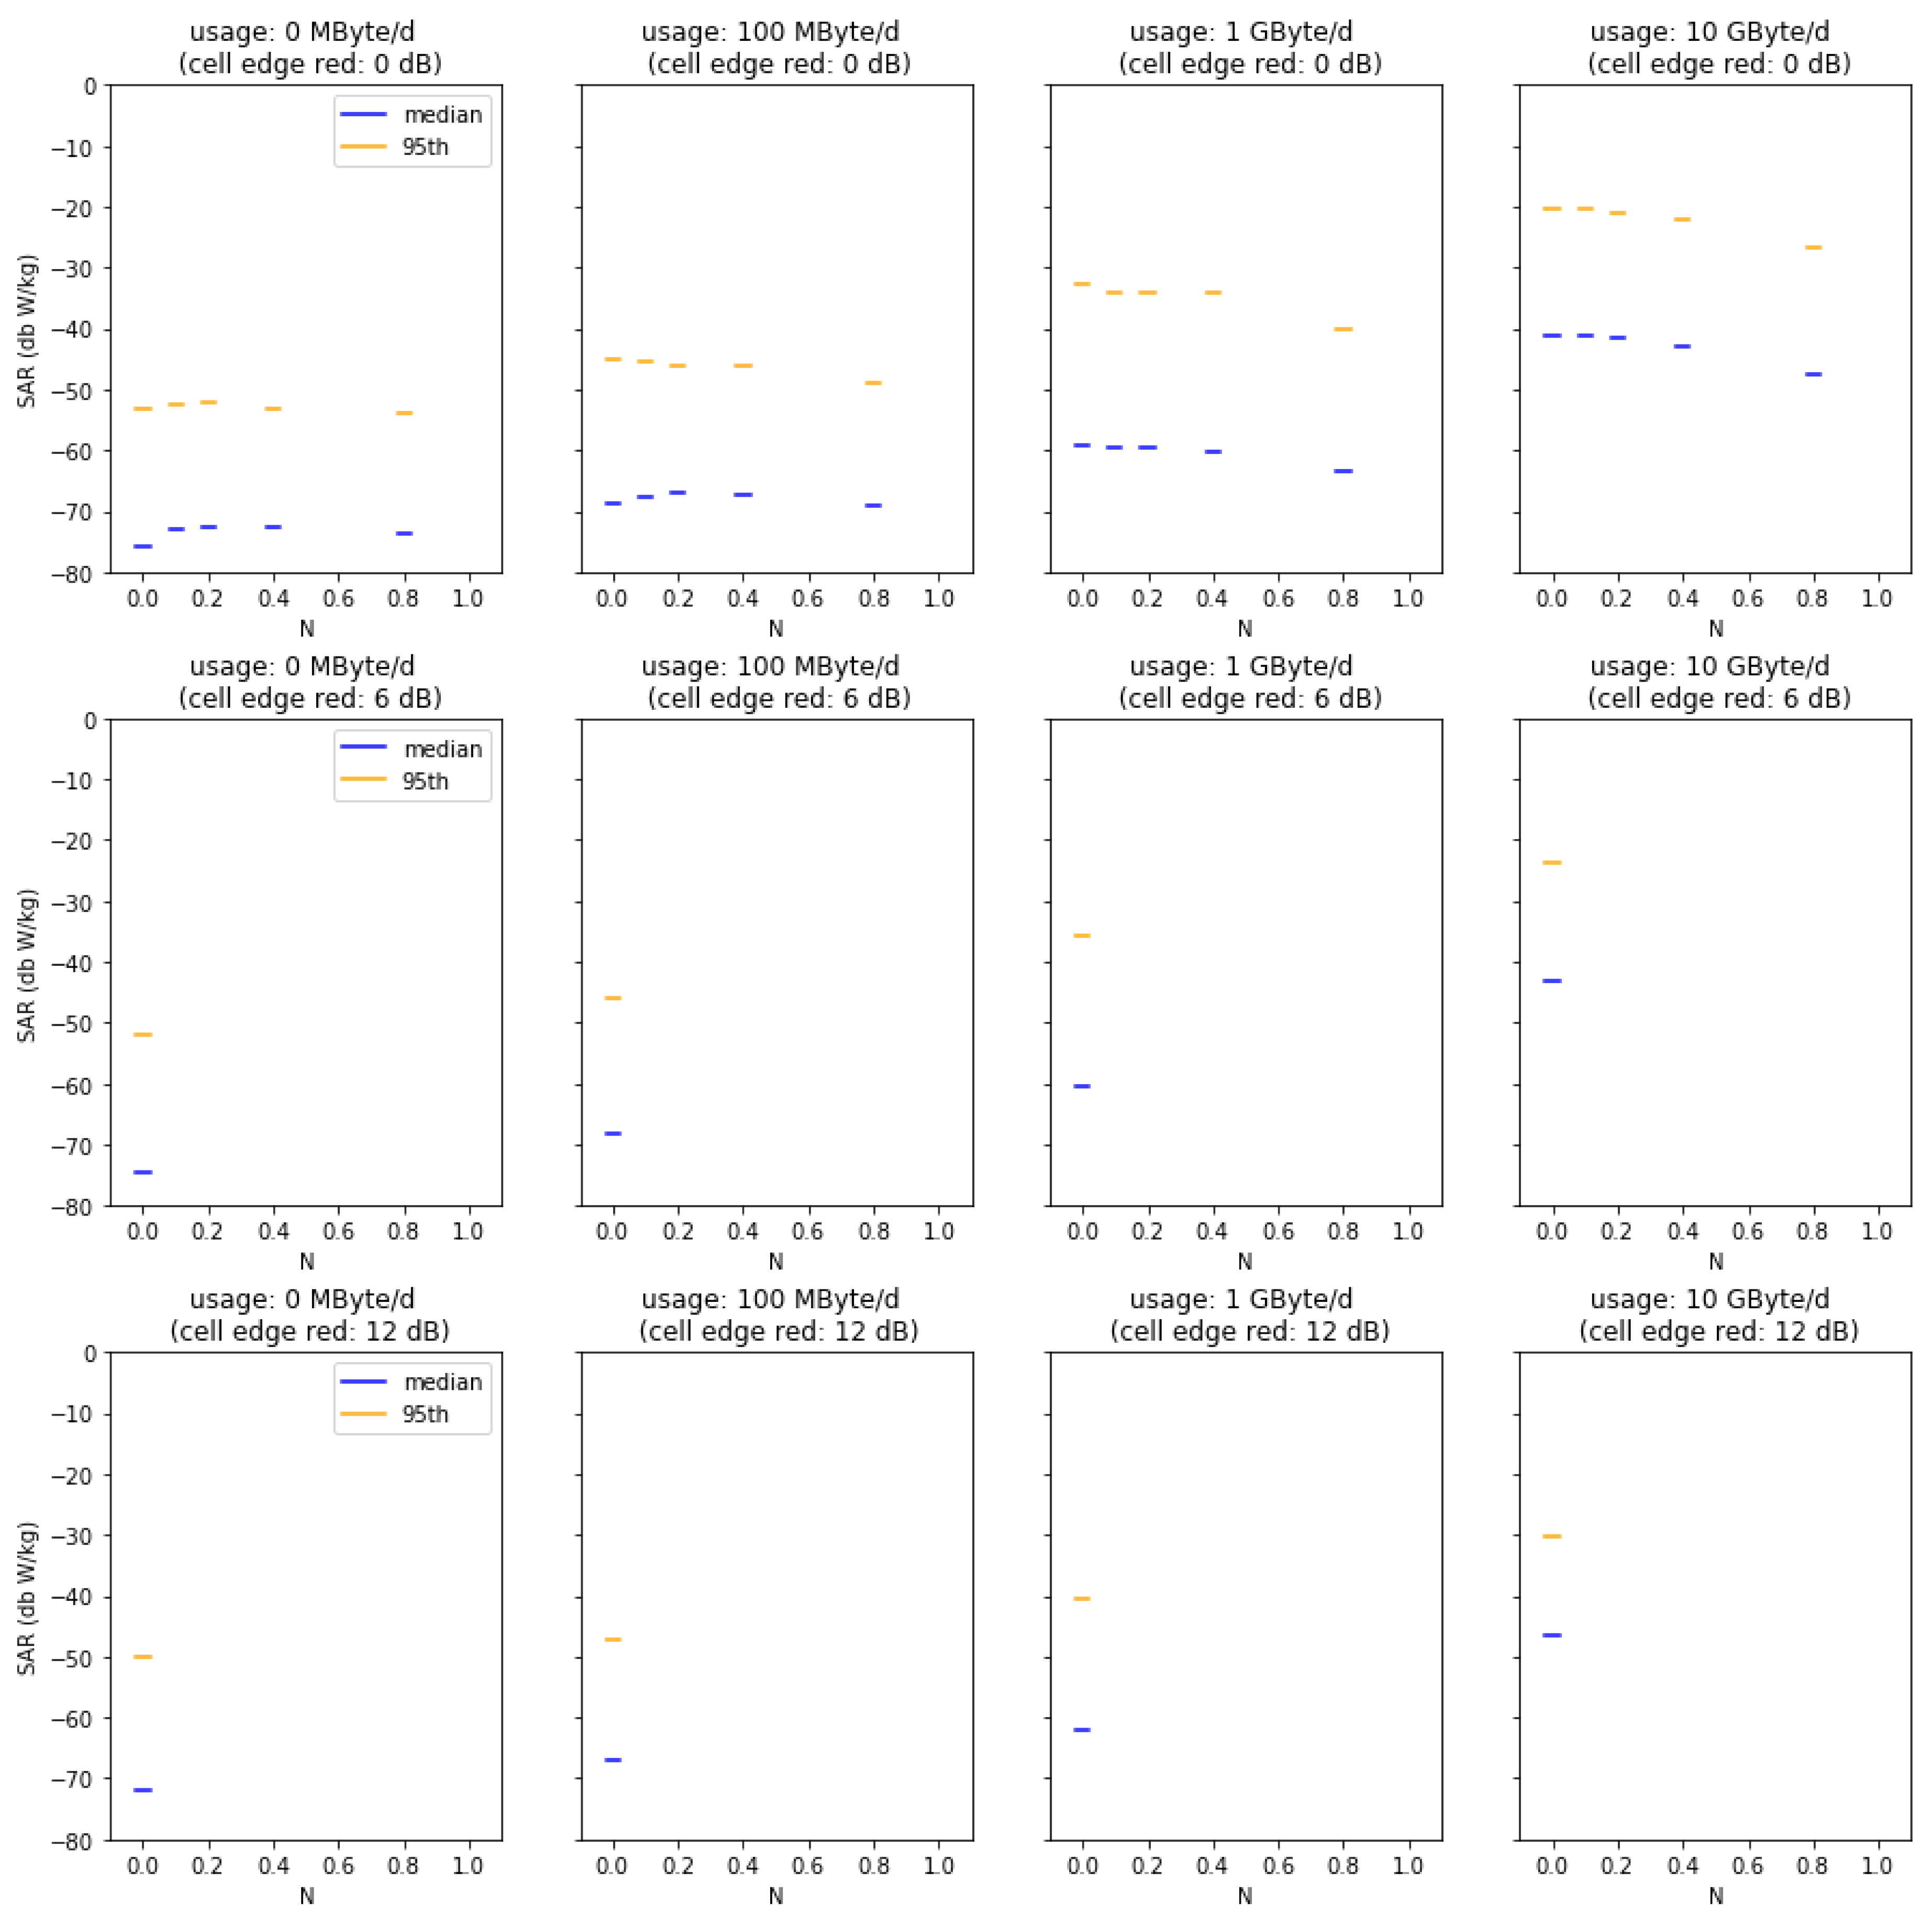
Median and 95th percentile statistical summaries were then calculated to evaluate the differential effect of the study variables on the total dose. The 95th percentile is particularly interesting, as precautionary and safety limits are designed to limit the highest exposures. We therefore present only the 95th percentile values in the tables below and make reference to the median results in the text where necessary. Summary plots for both median and 95th percentiles are available in the
Appendix A.
Table 2 shows the effect of the level of indoor coverage on peak SAR exposure (95th percentile) for non-users and heavy users. From the data, it is obvious that heavy users can benefit from indoor coverage, as it reduces their dose by more than 20 dB for full indoor coverage. There is a consistent trend that, with increasing N, the dose of heavy users decreases for all geographical locations and cell types. On the other hand, non-users are subjected to more exposure, as more indoor coverage generally results in stronger incident fields. This effect is the largest in urban microcells because RSRP levels there are much lower than than the ones measured from indoor base stations. For rural areas, more indoor coverage can decrease the exposure due to lower RSRP levels from indoor cells than from rural macrocells. In comparison, it should be noted that the absolute peak exposure of non-users is a factor of 10 to 1000 lower than for active users of any type. The same effect can be observed upon shrinking the cell sizes by 6 and 12 dB. The higher signal strengths and lower path losses in the cells result in lower doses for active users. For non-users, the dose is increased.
Table 3 depicts the total dose changes for varied bystander distances and data usages relative to non-user dose. Only the urban exposure scenarios were analyzed, given that, for suburban and rural scenarios, bystanders are unlikely to be very close by. The results show that a close bystander dominates the exposure from a nearby base station antenna for non-users. As soon as a user generates even small amounts of uplink data traffic (simulated by 100 MB/d), the effect of the bystander becomes negligible (<0.2 dB). The effect is the largest in macrocells (>5 dB for a bystander at 1 m versus 5 m), where the largest path losses are to be expected, and this is expected to decrease for mini and microcells (1 dB for a bystander at 1 m versus 5 m).
Table 4 summarizes the 95th percentile values that reflect the effect of a person’s own data usage on the total dose. The data reveal that even small amounts of data usage from a person’s own mobile phone dominates the total dose. A user with low data usage requirements experiences an increase in dose by 6–11 dB compared to a non-user. Moderate and heavy users increase their total dose by 6–25 dB and 25–40 dB, respectively, compared to non-users. The effect is within the same order of magnitude over all cell types and locations. This is most likely a result of the network architecture. Better indoor coverage can consistently lower the dose of data users, except for the urban microcell and no or low data usage. This effect can be attributed to the generally higher RSRP from the urban microcell than from indoor cells.
We performed a sensitivity analysis of the model output on the 95th percentile total dose for the input parameters: data usage, cell edge reduction, and indoor coverage. We analyzed the sensitivities one at a time, i.e., one input parameter was varied while the dose was averaged and varied over all other parameters sampled randomly. For indoor coverage of N = 1, the effect is a decrease of 24 dB compared to no indoor coverage. However, the sensitivity of this factor decreased sharply and non-linearly to only 4 dB for N = 0.5. It should be noted that, in this analysis, non-users are weighted at 25%, which is unrealistically high. The reason for this fast decrease is that we are analyzing for the 95th percentile or peak dose. With this metric, only if all locations can benefit from indoor coverage will the peak dose be lowered.
When reducing the cell edge by 6 dB, the average dose is reduced by 3.5 dB and by 8.5 dB for a 12-dB size reduction. The effect here is, again, governed by the fact that non-users are weighted at 25%. In particular, non-users experience an increase in exposure by reducing the cell edge.
For the factor usage, we find a dose increase from no usage of 7 dB for 100 MB/d to 20 dB for 1 GB/d, and 32 dB for 10 GB/d.
In summary, the sensitivity analysis shows that the users’ own usage behavior has the strongest effect on the personal peak dose, followed by indoor coverage.
4. Discussion
This study’s results are limited due to the network data that were used and the definition of the total dose, as stated in the Introduction. The results are also based on the currently relatively limited knowledge about the actual deployment and development of 5G. In this study, we do not consider the effect of upcoming massive multiple-input multiple-output (MIMO) and multi-user MIMO systems in 5G networks. MIMO usage is likely to improve link throughput in 5G networks and hence reduce local exposure for heavy users. However, due to space limitations in realistic handsets, we do not expect MIMO implementations with more than four antennas (4 × 4 MIMO) at frequencies <6 GHz, i.e., with a theoretical throughput increase of 6 dB in the uplink. In the downlink, massive MIMO configurations will be implemented. Locally, beam-steering in the downlink will result in temporal fluctuations of the incident field strength. Preliminary experiments suggest that the peak-to-average ratio is approximately 6 dB in 5G MIMO downlink scenarios [
9].
WLAN [
30] is not considered in this study, as WLAN indoor infrastructure can reduce the exposure to electromagnetic fields in ways similar to indoor 5G infrastructure by reducing the path loss between the access point and the user equipment. However, due to technological and deployment limitations, the exposure reduction by WLAN use is limited, and in fact, to date, WLAN is still a major source of exposure [
31].
The use of millimeter-wave frequencies in 5G mobile networks is not considered in this study. However, the use of millimeter waves would dramatically change the exposure compared to the current sub-6 GHz implementation: (i) millimeter waves would require a much denser base station network, (ii) exposure would be mainly superficial, of mainly the skin tissues, and (iii) it is further expected that the strong directivity and beamforming capability of handset antenna arrays would reduce the exposure due to one’s own device. A study similar to the current one would be required to estimate exposures for different usage scenarios.
The exposure from a user’s own handset is heavily dependent on the position of usage. In this study, this is partially accounted for by taking the averaged psaSAR value determined over all test positions. The use of mobile devices away from the body (e.g., by placing the device on a desk in front of the user) can reduce the exposure from a user’s own device by a factor much larger than 10. It is also not possible to draw conclusions about the actual exposure of sensitive organs like the human brain or even specific cells, as the exposure from a user’s own device is very local and thus highly dependent on the usage pattern. However, the use of higher frequencies is likely to reduce the exposure of deeper brain regions for the head-mounted use of mobile devices.
The study is also not designed to analyze any kind of direct biological effects due to exposure to electromagnetic fields. It may, however, be valuable for the modeling of doses in epidemiological studies.
5. Conclusions
The results of this study show that the absorption of energy by the human brain, resulting from exposure to the 3.6-GHz band, is reduced by a factor of >6 for the tissue-averaged SAR when compared to mobile networks operating at <1 GHz, and by a factor of >2 when compared to the frequency bands at 1.8–2 GHz. For deep brain regions, the reduction is much larger. The dose of these regions is reduced as a result of lower penetration depths at higher frequencies. Exposure close to surface structures, e.g., eyes, testicles, etc., can be higher. At the most exposed surface of the grey matter, the values remain approximately ±3 dB over all frequencies, whereas the area of high exposure is reduced.
The results of the Monte Carlo analysis show that for all users (except non-users), total exposure is dominated by a person’s own mobile device. Compared to a non-user, the exposure is increased for a light user (with 100 MByte uplink data per day) by 6–10 dB (or by a factor 4–10), for a moderate user (with 1 GByte uplink data per day) by 13–25 dB (or by a factor of 20– > 300), and for a heavy user by 25–40 dB (or a factor of 300– > 10000). The peak exposure of non-users is, furthermore, not defined by exposure to surrounding base stations but by the mobile devices of close bystanders in urban areas, resulting in up to a 6 dB (or a factor of four) higher exposure than from a nearby base station antenna. Reducing the size of the mobile cell leads to a decreased overall exposure by a factor of 2–10 for people who actively use their mobile devices. At the same time, the reduction in cell size might lead to a small increase by a factor of <2 in the exposure of non-users. The exposure of active users can be reduced by factors ranging from 4–600 by increasing indoor network coverage, which, in turn, will be linked to the increased exposure of non-users by a factor of 2–10. However, this increase is at a level that is a factor of 1000 lower than the typical absolute exposure of active users.
Since data from real networks with MIMO were not available, the effect of adaptive beam-forming antennas on the dose could only be discussed in this study and need to be quantitatively analyzed when 5G networks are fully established, and realistic data becomes available.
Author Contributions
Conceptualization, S.K. and N.K.; methodology, S.K. and S.P.; software, S.P.; validation, S.K., S.P. and N.K.; formal analysis, S.K; investigation, S.K.; resources, N.K.; data curation, S.P.; writing—original draft preparation, S.K.; writing—review and editing, S.K.; visualization, S.P.; supervision, N.K.; project administration, S.K.; funding acquisition, S.K. and N.K. All authors have read and agreed to the published version of the manuscript.
Funding
This research was funded by the Swiss Federal Office for the Environment.
Acknowledgments
The review and advice of Hugo Lehmann (Swisscom), Joe Wiart (Telecom Paristech), Q. Balzano (University of Maryland), and Sabine Regel (Sr Scientific).
Conflicts of Interest
The authors declare no conflict of interest. The funders had no role in the design of the study; in the collection, analyses, or interpretation of data; in the writing of the manuscript, or in the decision to publish the results.
Abbreviations
The following abbreviations are used in this manuscript:
| 4G | Fourth Generation Mobile Communication System |
| 5G | Fifth Generation Mobile Communication System |
| Ae | effective aperture area |
| CF | coupling factor |
| duty-cycle of the users own mobile data transmission |
| duty-cycle of the bystanders mobile data transmission |
| power control reduction factor |
| eff4G5G | factor describing the increase in spectral efficiency from LTE to 5G-NR |
| data4G5G | factor describing the increase in required data capacity from LTE to 5G |
| LTE | Long Term Evolution |
| MIDA | Multimodal Imaging-Based Detailed Anatomical |
| MIMO | Multiple Input Multiple Output |
| NR | New Radio |
| psaSAR10gmobile | 10 g peak spatial average SAR from own mobile phone measured at maximum output power |
| path loss |
| reference signal received power |
| S | power density |
| SAM | Specific Anthropomorphic Mannequin defined by Standardization for SAR evaluations |
| SAR10gmobile | SAR from own mobile phone |
| SAR10gbase station | SAR from base station antennas |
| SAR10gbystander | SAR caused by bystander mobile devices |
| TV | television |
| UE | user equipment |
| uplink radiation factor (loss) |
| wbaSAR | whole-body average SAR |
| WLAN | Wireless Local Area Network |
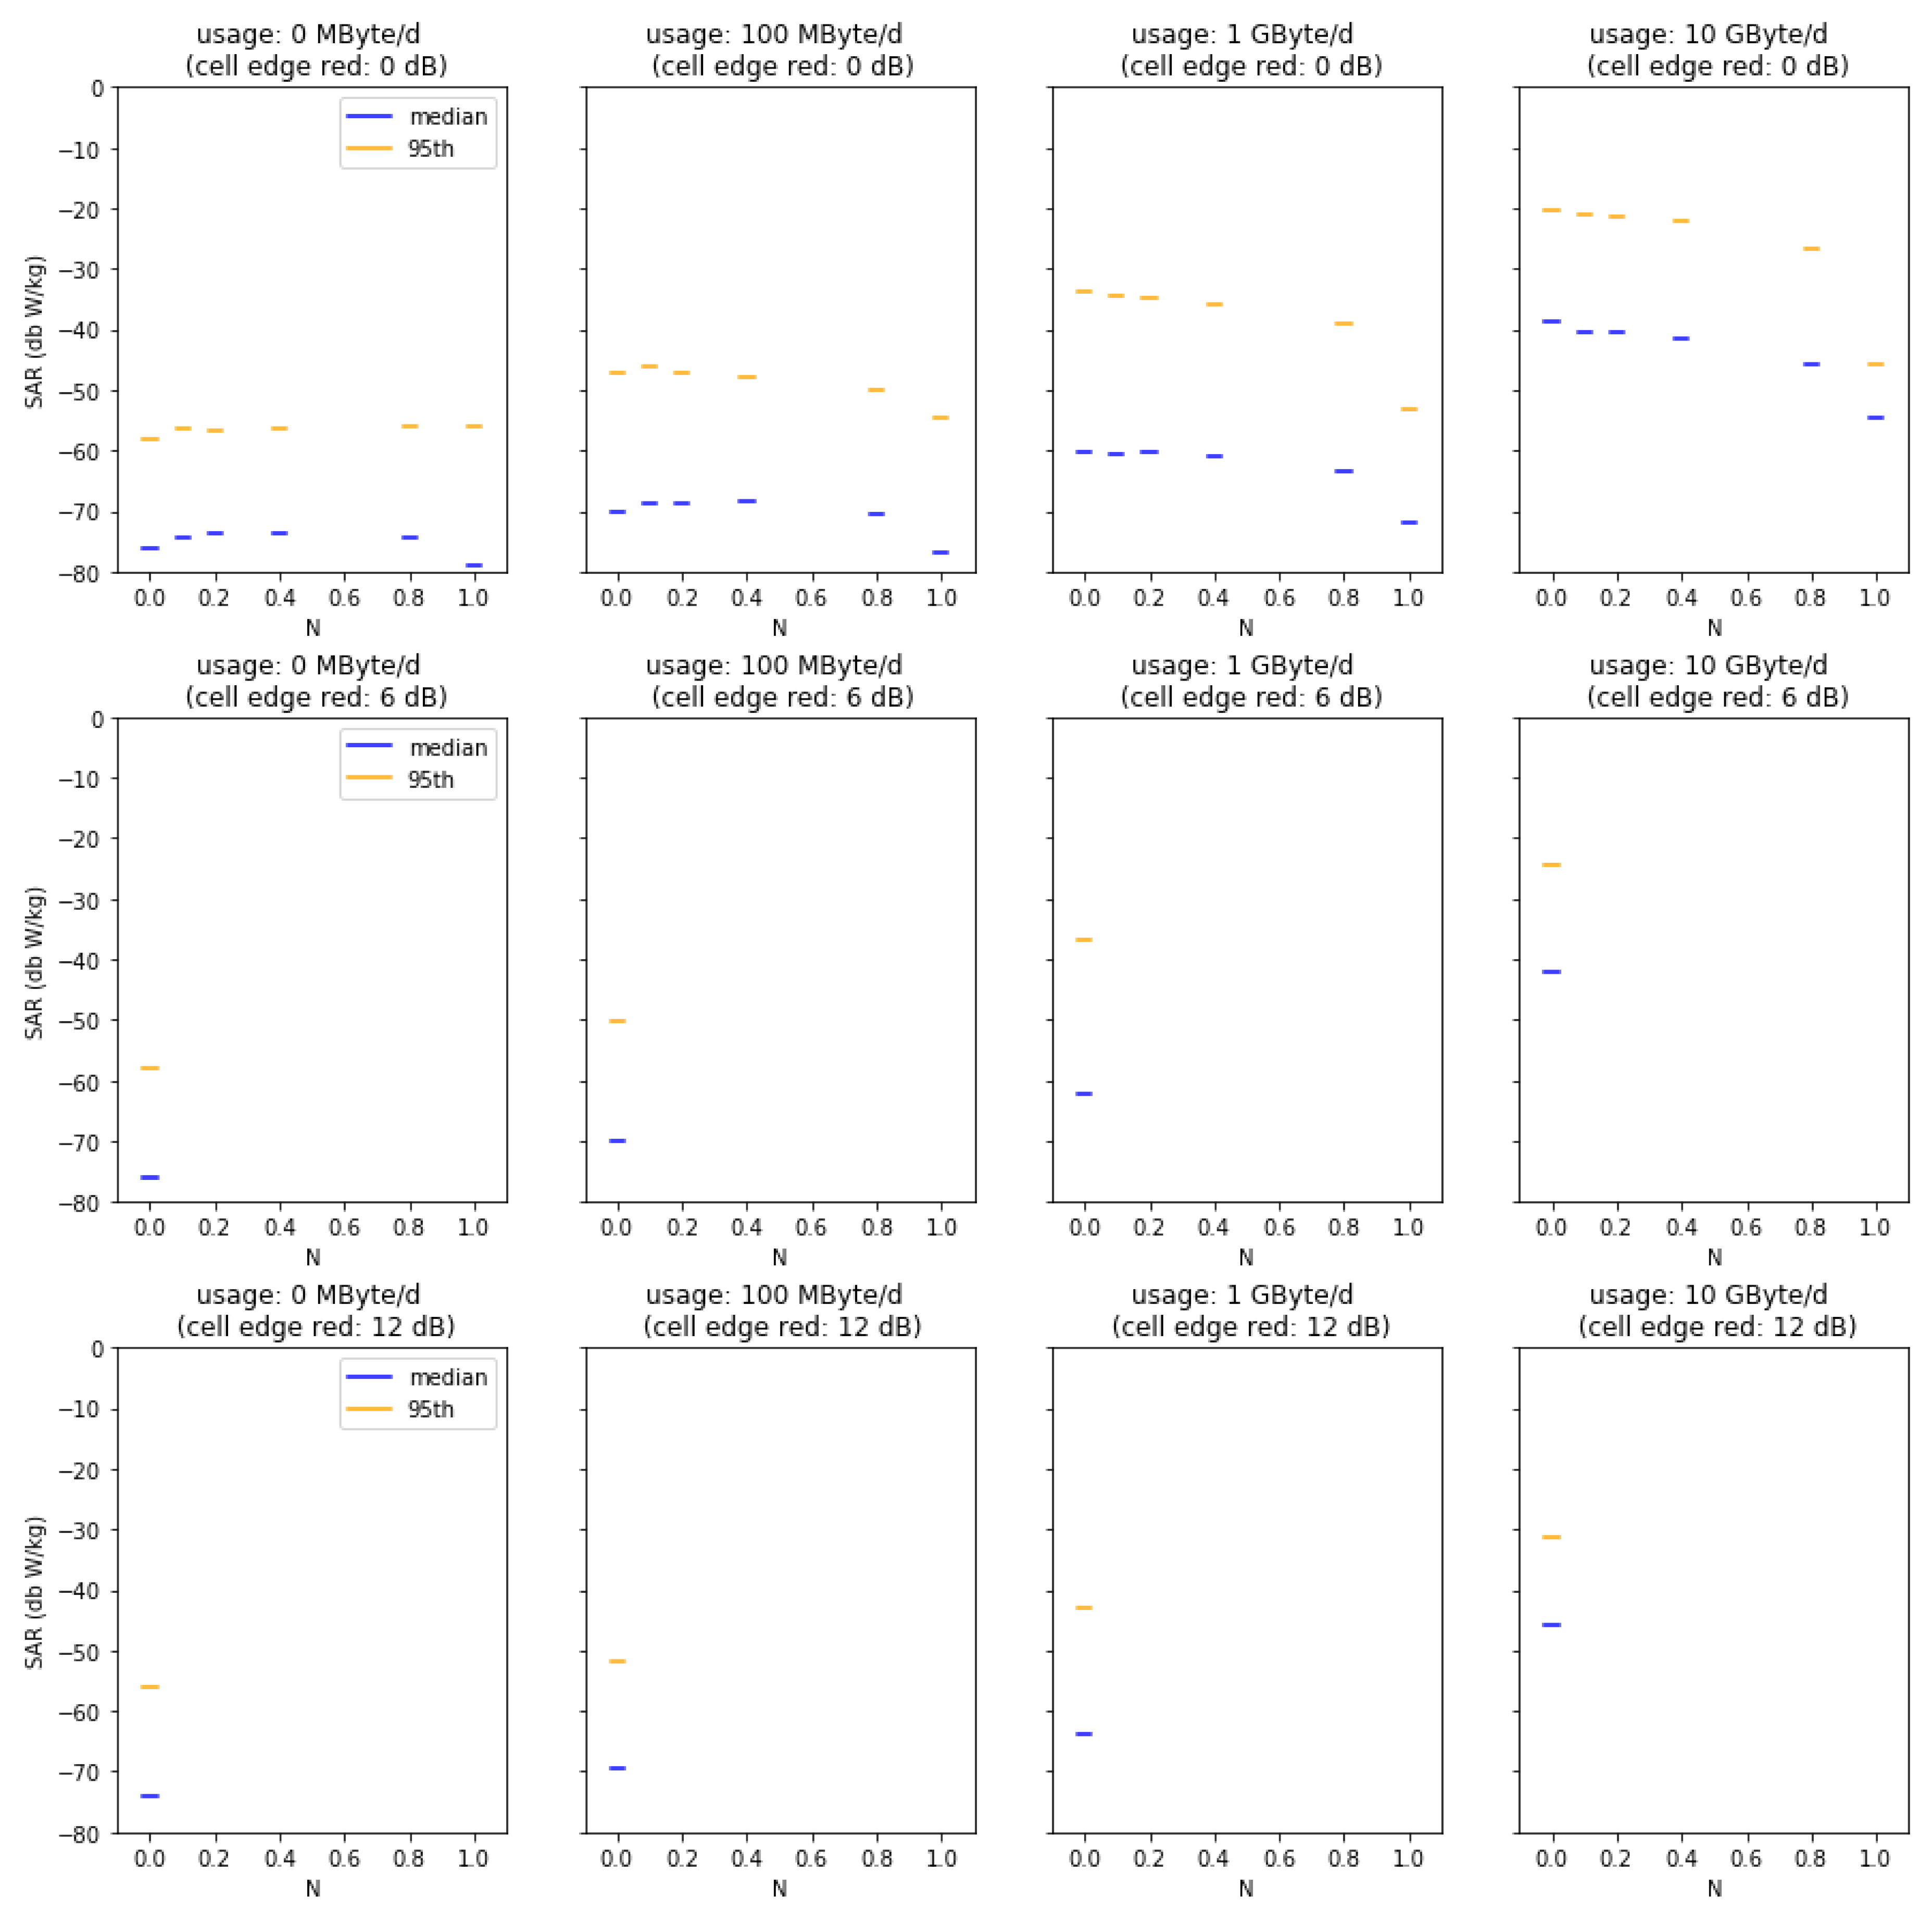
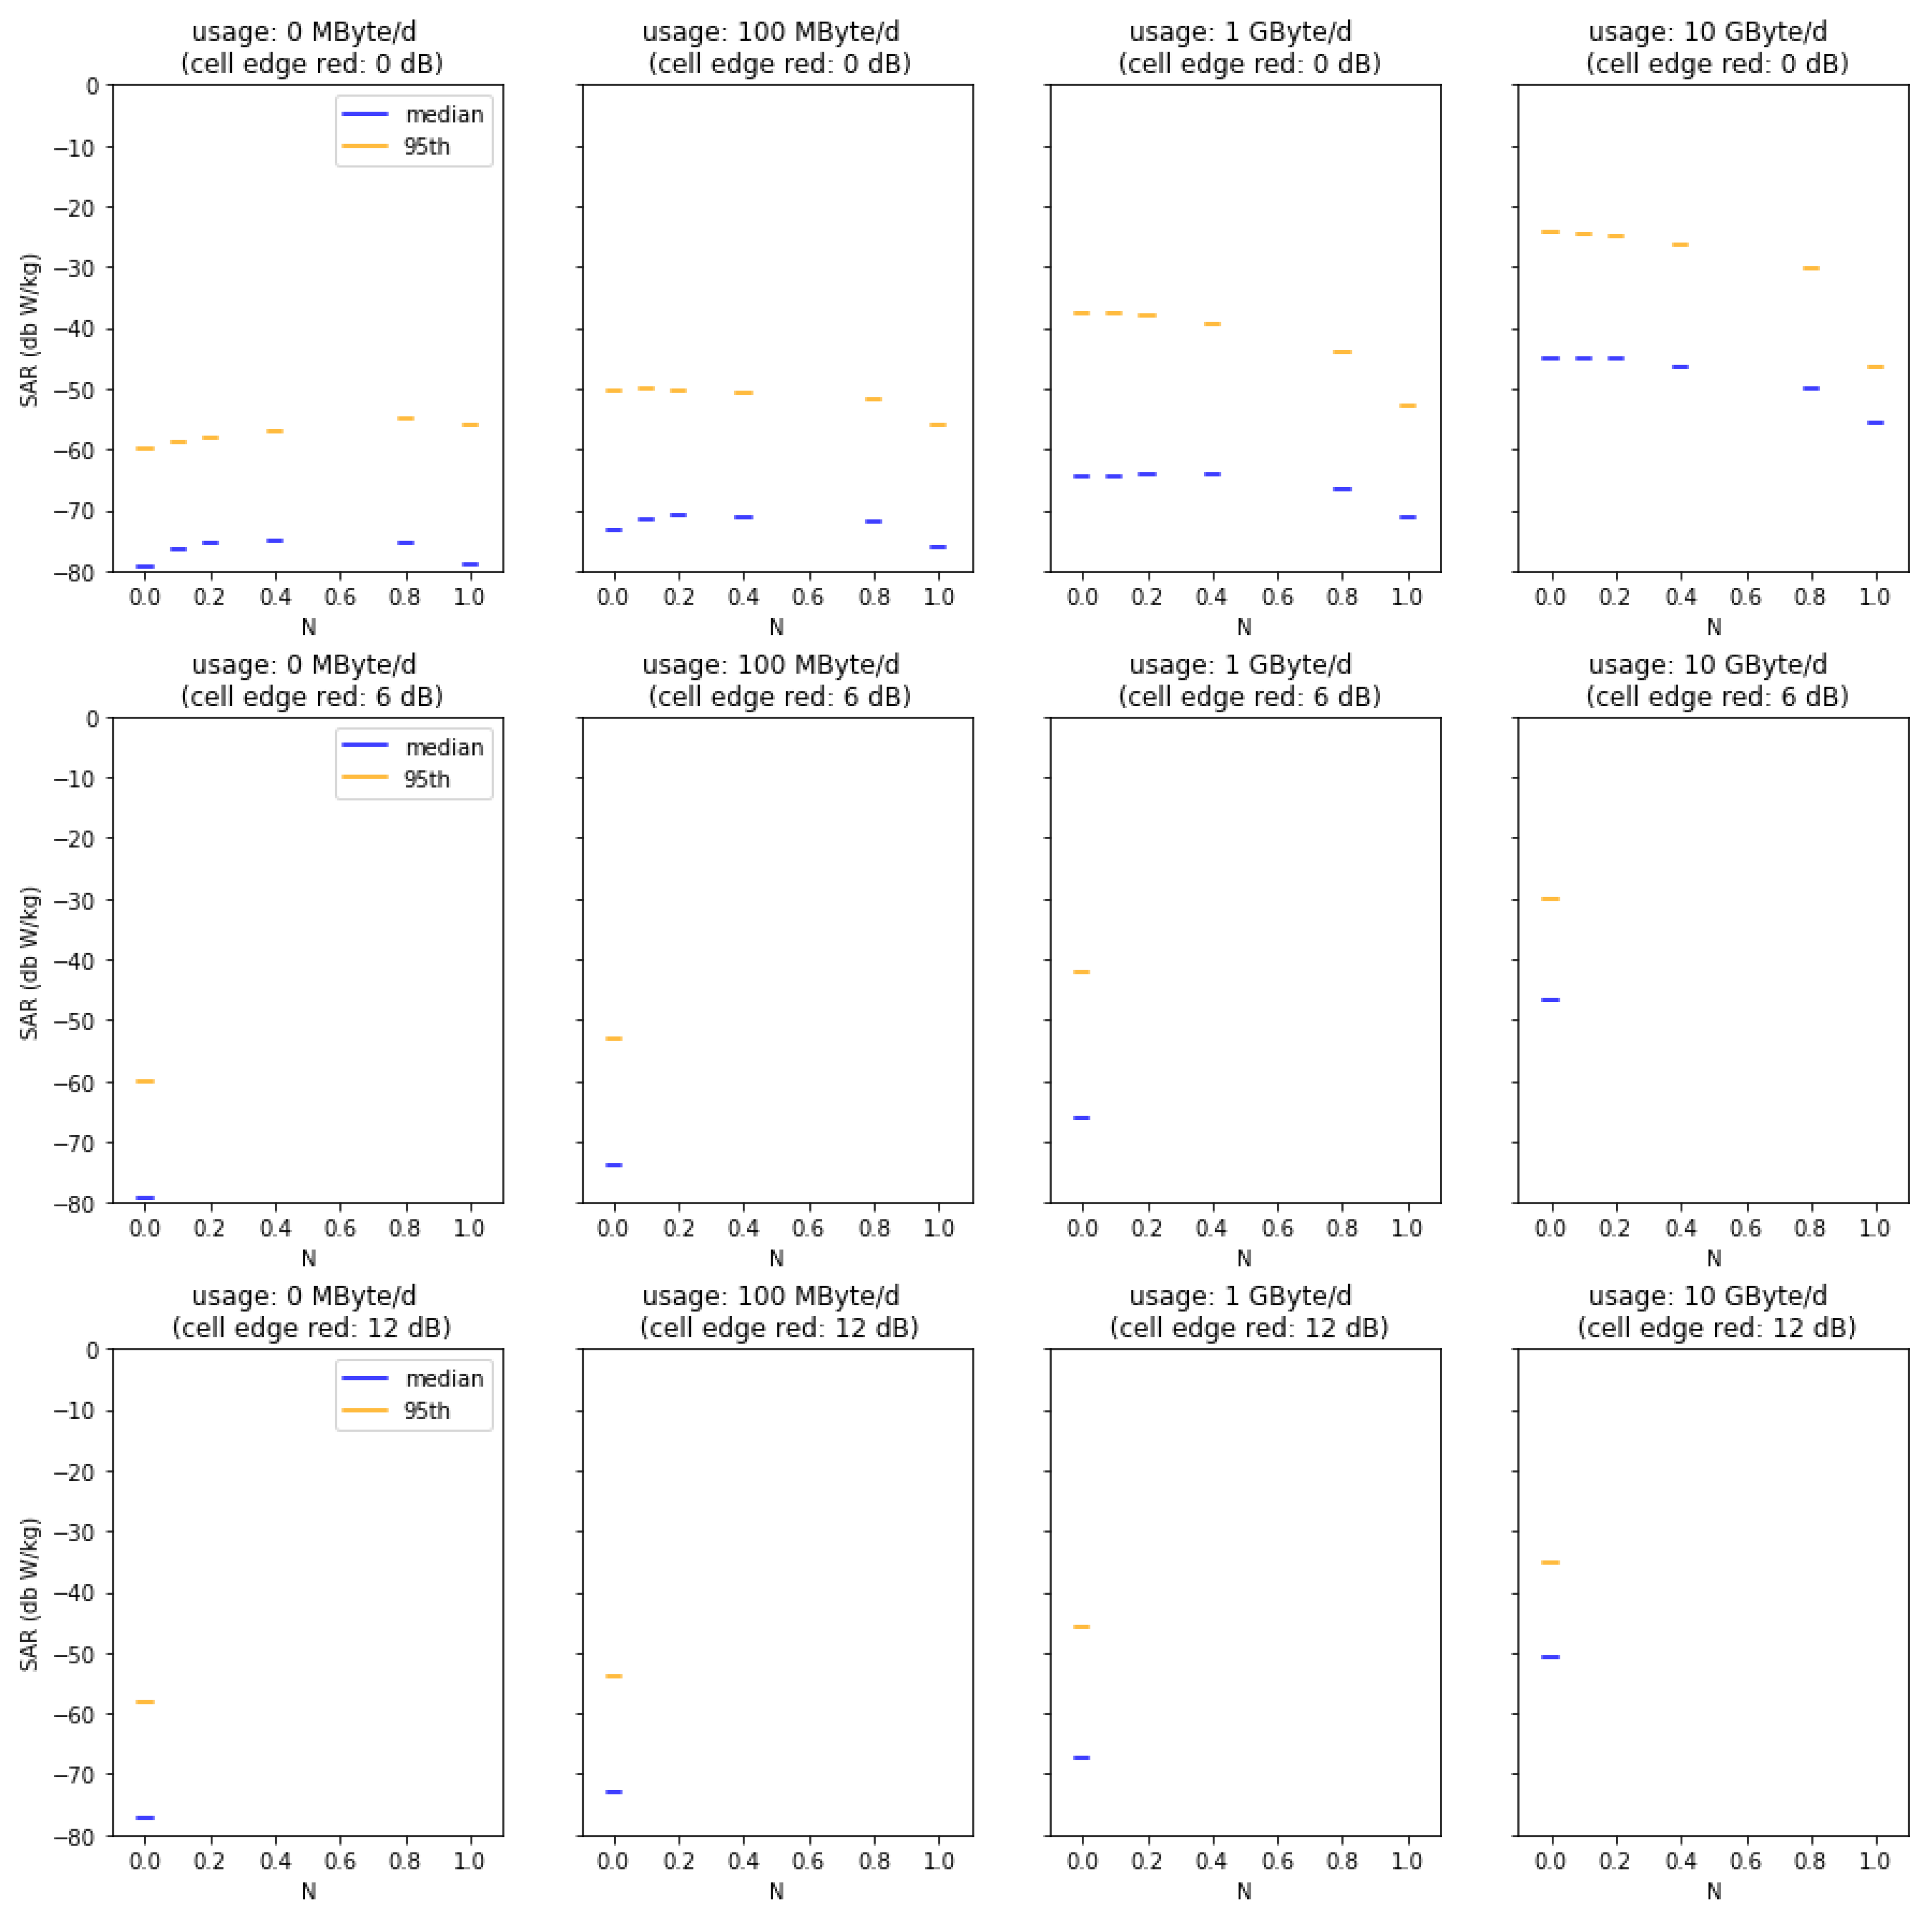
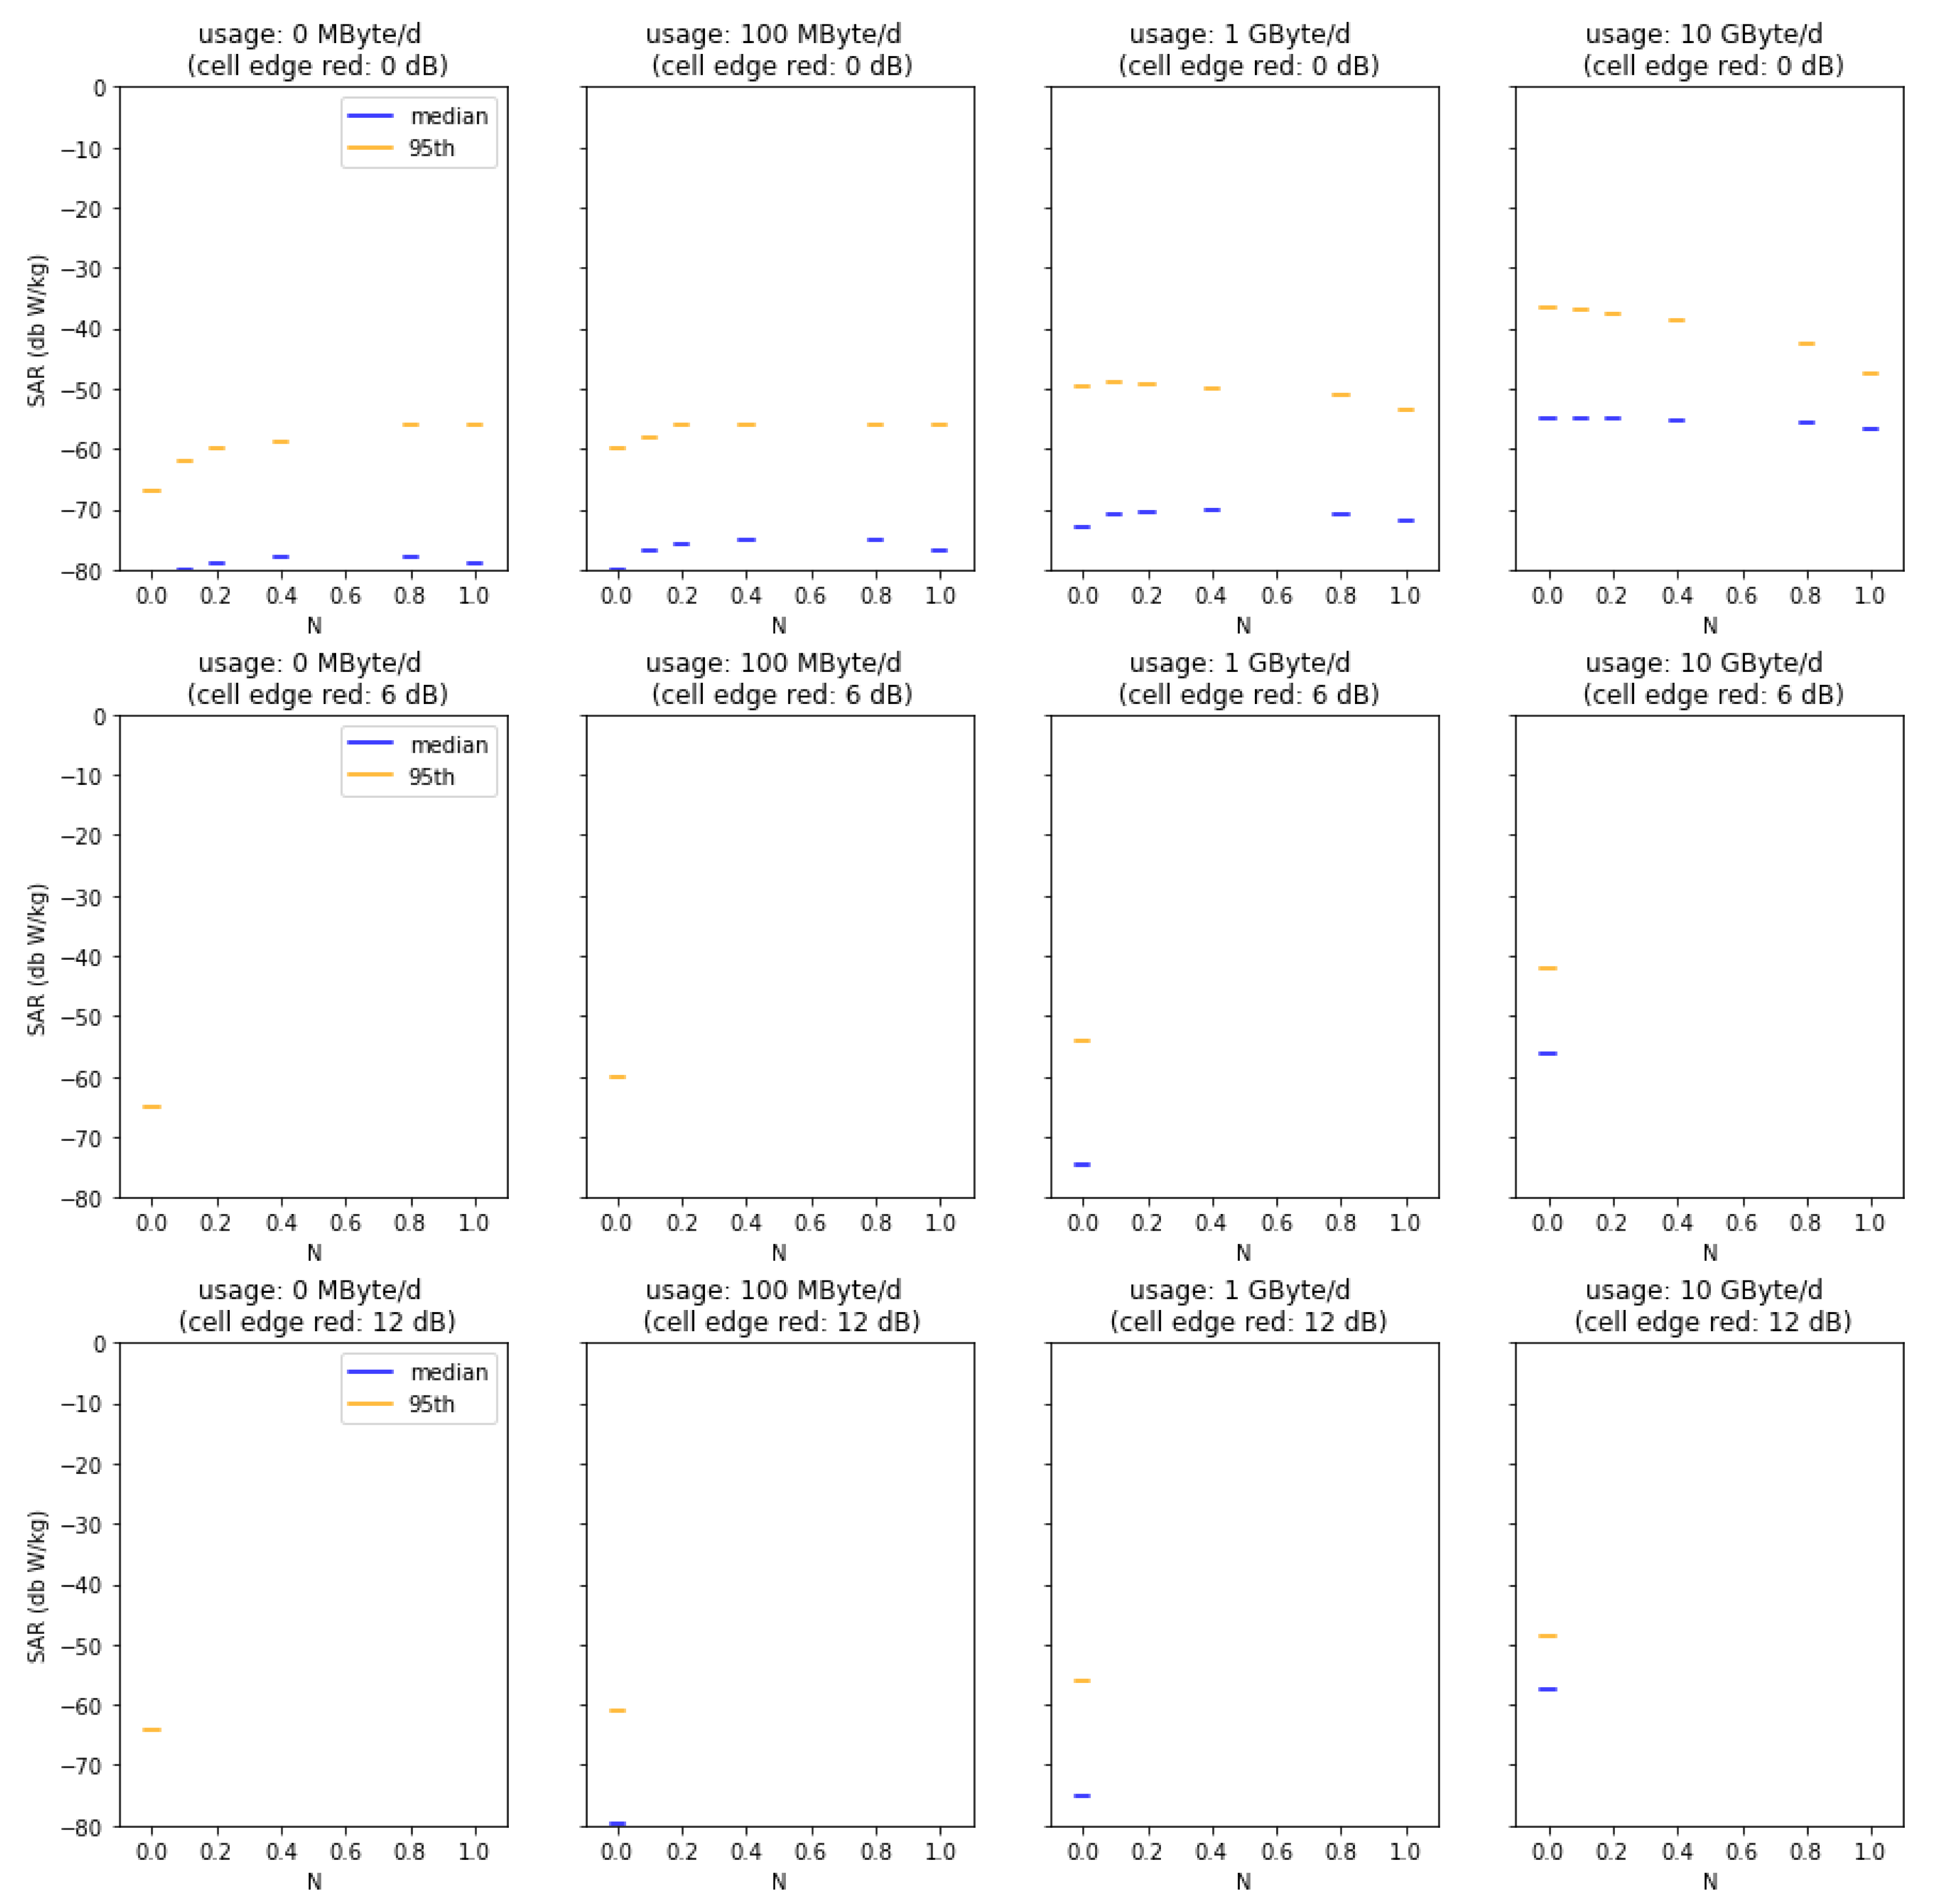
Appendix A
Figure A1,
Figure A2,
Figure A3,
Figure A4 and
Figure A5 summarize the results from our Monte Carlo analysis. Each figure presents the result for the median and the 95th percentile of dose, i.e., the localized 10 g SAR averaged over 6 min for a given geographical location and base station type. Subplots show increasing data usage (from left to right) and decreasing cell size (from top to bottom). Within the subplots, additional indoor coverage is presented by increasing
N (
N = 0 no additional indoor coverage,
N = 1 full indoor coverage).
Figure A1.
Median and 95th percentiles for varied usage, indoor coverage factor N, and cell size reductions in the rural cell scenario.
Figure A1.
Median and 95th percentiles for varied usage, indoor coverage factor N, and cell size reductions in the rural cell scenario.
Figure A2.
Median and 95th percentiles for varied usage, indoor coverage factor N, and cell size reductions in the suburban cell scenario.
Figure A2.
Median and 95th percentiles for varied usage, indoor coverage factor N, and cell size reductions in the suburban cell scenario.
Figure A3.
Median and 95th percentiles for varied usage, indoor coverage factor N, and cell size reductions in the urban-macro cell scenario.
Figure A3.
Median and 95th percentiles for varied usage, indoor coverage factor N, and cell size reductions in the urban-macro cell scenario.
Figure A4.
Median and 95th percentiles for varied usage, indoor coverage factor N, and cell size reductions in the urban-mini cell scenario.
Figure A4.
Median and 95th percentiles for varied usage, indoor coverage factor N, and cell size reductions in the urban-mini cell scenario.
Figure A5.
Median and 95th percentiles for varied usage, indoor coverage factor N, and cell size reductions in the urban-micro cell scenario.
Figure A5.
Median and 95th percentiles for varied usage, indoor coverage factor N, and cell size reductions in the urban-micro cell scenario.
References
- Colombi, D.; Thors, B.; Törnevik, C. Implications of EMF exposure limits on output power levels for 5G devices above 6 GHz. IEEE Antennas Wirel. Propag. Lett. 2015, 14, 1247–1249. [Google Scholar] [CrossRef]
- Thors, B.; Colombi, D.; Ying, Z.; Bolin, T.; Törnevik, C. Exposure to RF EMF from array antennas in 5G mobile communication equipment. IEEE Access 2016, 4, 7469–7478. [Google Scholar] [CrossRef]
- Zhao, K.; Ying, Z.; He, S. EMF exposure study concerning mmWave phased array in mobile devices for 5G communication. IEEE Antennas Wirel. Propag. Lett. 2015, 15, 1132–1135. [Google Scholar] [CrossRef]
- He, W.; Xu, B.; Gustafsson, M.; Ying, Z.; He, S. RF compliance study of temperature elevation in human head model around 28 GHz for 5G user equipment application: Simulation analysis. IEEE Access 2017, 6, 830–838. [Google Scholar] [CrossRef]
- Colombi, D.; Thors, B.; Törnevik, C.; Balzano, Q. RF energy absorption by biological tissues in close proximity to millimeter-wave 5G wireless equipment. IEEE Access 2018, 6, 4974–4981. [Google Scholar] [CrossRef]
- Neufeld, E.; Kuster, N. Systematic derivation of safety limits for time-varying 5G radiofrequency exposure based on analytical models and thermal dose. Health Phys. 2018, 115, 705–711. [Google Scholar] [CrossRef]
- Gosselin, M.C.; Kühn, S.; Crespo-Valero, P.; Cherubini, E.; Zefferer, M.; Christ, A.; Kuster, N. Estimation of head tissue-specific exposure from mobile phones based on measurements in the homogeneous SAM head. Bioelectromagnetics 2011, 32, 493–505. [Google Scholar] [CrossRef]
- Joshi, P.; Colombi, D.; Thors, B.; Larsson, L.E.; Törnevik, C. Output power levels of 4G user equipment and implications on realistic RF EMF exposure assessments. IEEE Access 2017, 5, 4545–4550. [Google Scholar] [CrossRef]
- Thors, B.; Furuskär, A.; Colombi, D.; Törnevik, C. Time-averaged realistic maximum power levels for the assessment of radio frequency exposure for 5G radio base stations using massive MIMO. IEEE Access 2017, 5, 19711–19719. [Google Scholar] [CrossRef]
- Joseph, W.; Verloock, L.; Goeminne, F.; Vermeeren, G.; Martens, L. Assessment of general public exposure to LTE and RF sources present in an urban environment. Bioelectromagnetics 2010, 31, 576–579. [Google Scholar] [CrossRef]
- Yigitel, M.A.; Incel, O.D.; Ersoy, C. Dynamic base station planning with power adaptation for green wireless cellular networks. EURASIP J. Wirel. Commun. Netw. 2014, 2014, 77. [Google Scholar] [CrossRef]
- Koutitas, G.; Samaras, T. Exposure minimization in indoor wireless networks. IEEE Antennas Wirel. Propag. Lett. 2010, 9, 199–202. [Google Scholar] [CrossRef]
- Plets, D.; Joseph, W.; Vanhecke, K.; Martens, L. Exposure optimization in indoor wireless networks by heuristic network planning. Prog. Electromagn. Res. PIER 2013, 139, 445–478. [Google Scholar] [CrossRef]
- Liu, N.; Plets, D.; Goudos, S.K.; Martens, L.; Joseph, W. Multi-objective network planning optimization algorithm: Human exposure, power consumption, cost, and capacity. Wirel. Networks 2015, 21, 841–857. [Google Scholar] [CrossRef]
- Liu, N.; Plets, D.; Vanhecke, K.; Martens, L.; Joseph, W. Wireless indoor network planning for advanced exposure and installation cost minimization. EURASIP J. Wirel. Commun. Netw. 2015, 2015, 199. [Google Scholar] [CrossRef]
- Ahlbom, A.; Bergqvist, U.; Bernhardt, J.H.; Cesarini, J.P.; Grandolfo, M.; Hietanen, M.; Mckinlay, A.F.; Repacholi, M.H.; Sliney, D.H.; Stolwijk, J.A.; et al. Guidelines for limiting exposure to time-varying electric, magnetic, and electromagnetic fields (up to 300 GHz). Health Phys. 1998, 74, 494–522. [Google Scholar]
- International Commission on Non-Ionizing Radiation Protection. Guidelines for limiting exposure to Electromagnetic Fields (100 kHz to 300 GHz). Health Phys. 2020, 118, 483–524. [Google Scholar] [CrossRef]
- IEEE. IEEE Standard for Safety Levels with Respect to Human Exposure to Electric, Magnetic, and Electromagnetic Fields, 0 Hz to 300 GHz; IEEE Std C95.1-2019 (Revision of IEEE Std C95.1-2005/ Incorporates IEEE Std C95.1-2019/Cor 1-2019); IEEE: Piscataway, NJ, USA, 2019; pp. 1–312. [Google Scholar]
- Berg, M.; Sonkki, M.; Salonen, E. Experimental study of hand and head effects to mobile phone antenna radiation properties. In Proceedings of the 2009 3rd European Conference on Antennas and Propagation, Berlin, Germany, 23–27 March 2009; pp. 437–440. [Google Scholar]
- Ilvonen, J.; Kivekas, O.; Holopainen, J.; Valkonen, R.; Rasilainen, K.; Vainikainen, P. Mobile Terminal Antenna Performance With the User’s Hand: Effect of Antenna Dimensioning and Location. IEEE Antennas Wirel. Propag. Lett. 2011, 10, 772–775. [Google Scholar] [CrossRef]
- Pelosi, M.; Franek, O.; Knudsen, M.B.; Christensen, M.; Pedersen, G.F. A Grip Study for Talk and Data Modes in Mobile Phones. IEEE Trans. Antennas Propag. 2009, 57, 856–865. [Google Scholar] [CrossRef]
- Kühn, S.; Jennings, W.; Christ, A.; Kuster, N. Assessment of induced radio-frequency electromagnetic fields in various anatomical human body models. Phys. Med. Biol. 2009, 54, 875. [Google Scholar] [CrossRef]
- Tomić, I.A.; Davidović, M.S.; Bjeković, S.M. On the downlink capacity of LTE cell. In Proceedings of the 2015 23rd Telecommunications Forum Telfor (TELFOR), Belgrade, Serbia, 24–26 November 2015; pp. 181–185. [Google Scholar]
- Qualcomm. Real-World User Experiences with Standalone 5G NR. Available online: https://www.qualcomm.com/news/onq/2018/06/26/real-world-user-experiences-standalone-5g-nr (accessed on 4 August 2020).
- Rohde and Schwarz. 3GPP Categories and Data Rates Up to Release 15. Available online: https://www.mobilewirelesstesting.com/wp-content/uploads/2018/11/3GPP_categories_and_data_rates_up_to_Rel_15_po_en_folded_5216-3943-82_v0100.pdf (accessed on 4 August 2020).
- Federal Communications Commission (FCC). Engineering & Technology—Laboratory Division—Equipment Authorization—FCC ID Search. Available online: https://www.fcc.gov/oet/ea/fccid (accessed on 4 August 2020).
- Iacono, M.I.; Neufeld, E.; Akinnagbe, E.; Bower, K.; Wolf, J.; Oikonomidis, I.V.; Sharma, D.; Lloyd, B.; Wilm, B.J.; Wyss, M.; et al. MIDA: A multimodal imaging-based detailed anatomical model of the human head and neck. PLoS ONE 2015, 10, e0124126. [Google Scholar] [CrossRef] [PubMed]
- Christ, A.; Kainz, W.; Hahn, E.G.; Honegger, K.; Zefferer, M.; Neufeld, E.; Rascher, W.; Janka, R.; Bautz, W.; Chen, J.; et al. The Virtual Family—development of surface-based anatomical models of two adults and two children for dosimetric simulations. Phys. Med. Biol. 2009, 55, N23. [Google Scholar] [CrossRef] [PubMed]
- IEC TC106. IEC 62209-1:2016: Measurement Procedure for the Assessment of Specific Absorption Rate of Human Exposure to Radio Frequency Fields from Hand-Held and Body-Mounted Wireless Communication Devices—Part 1: Devices Used Next to the Ear (Frequency Range of 300 MHz to 6 GHz); Technical Report; International Electrotechnical Commission: Geneva, Switzerland, 2016. [Google Scholar]
- IEEE. IEEE Standard for Information Technology—Telecommunications and Information Exchange between Systems Local and Metropolitan Area Networks—Specific Requirements—Part 11: Wireless LAN Medium Access Control (MAC) and Physical Layer (PHY) Specifications; IEEE Std 802.11-2016 (Revision of IEEE Std 802.11-2012); IEEE: Piscataway, NJ, USA, 2016; pp. 1–3534. [Google Scholar] [CrossRef]
- Plets, D.; Joseph, W.; Vanhecke, K.; Vermeeren, G.; Wiart, J.; Aerts, S.; Varsier, N.; Martens, L. Joint minimization of uplink and downlink whole-body exposure dose in indoor wireless networks. BioMed Res. Int. 2015, 2015, 943415. [Google Scholar] [CrossRef] [PubMed]
© 2020 by the authors. Licensee MDPI, Basel, Switzerland. This article is an open access article distributed under the terms and conditions of the Creative Commons Attribution (CC BY) license (http://creativecommons.org/licenses/by/4.0/).


