Article

Theranostic Nanoplatforms of Thiolated Reduced Graphene Oxide Nanosheets and Gold Nanoparticles

by
Pascal Tomasella
1,†,
Vanessa Sanfilippo
1,†,
Carmela Bonaccorso
1,
Lorena Maria Cucci
1,
Giuseppe Consiglio
2,
Angelo Nicosia
2,
Placido Giuseppe Mineo
2,
Giuseppe Forte
3 and
Cristina Satriano
1,*
1
Laboratory of Hybrid NanoBioInterfaces (NHBIL), Department of Chemical Sciences, University of Catania, Viale Andrea Doria 6, 95125 Catania, Italy
2
Department of Chemical Sciences, University of Catania, Viale Andrea Doria 6, 95125 Catania, Italy
3
Department of Pharmaceutical Sciences, University of Catania, Viale Andrea Doria 6, 95125 Catania, Italy
*
Author to whom correspondence should be addressed.
These authors contributed equally.
Appl. Sci. 2020, 10(16), 5529; https://doi.org/10.3390/app10165529
Submission received: 14 July 2020 / Revised: 1 August 2020 / Accepted: 3 August 2020 / Published: 10 August 2020
(This article belongs to the Special Issue World of Biosensing)

Abstract

:

Featured Application

Spherical and rod-shaped gold nanoparticles grown on graphene-based nanosheets provide tunable plasmonic features as well as cytotoxic effects on human neuroblastoma cells.

Abstract

In this study, graphene oxide (GO) and reduced-thiolated GO (rGOSH) were used as 2D substrate to fabricate nanocomposites with nanoparticles of gold nanospheres (AuNS) or nanorods (AuNR), via in situ reduction of the metal salt precursor and seed-mediated growth processes. The plasmonic sensing capability of the gold-decorated nanosheets were scrutinized by UV-visible (UV-VIS) spectroscopy. Attenuated total reflectance Fourier transform infrared spectroscopy (ATR-FTIR), thermogravimetric analyses (TGA), and atomic force microscopy (AFM) were performed in order to prove the actual reduction that occurred concomitantly with the thiolation of GO, the increase in the hydrophobic character as well as the size, and preferential gathering of the gold nanoparticles onto the nanosheet substrates, respectively. Moreover, the theoretical electronic and infrared absorption (UV-VIS and IR) spectra were calculated within a time-dependent approach of density functional theory (DFT). Eventually, in vitro cellular experiments on human neuroblastoma cells (SH-SY5Y line) were carried out in order to evaluate the nanotoxicity of the nanocomposites by the 3-(4,5-dimethylthiazol-2-yl)-2,5-diphenyltetrazolium bromide tetrazolium reduction (MTT) colorimetric assay. Results pointed out the promising potential of these hybrids as plasmonic theranostic platforms with different hydrophilic or hydrophobic features as well as cytotoxic effects against cancer cells.

Graphical Abstract

1. Introduction

Theranostics has a high potential to develop personalized medicine, since it combines diagnostic and therapeutic capabilities into a multicomponent platform, thus offering enhanced specific targeting, therapeutic efficacy, and real-time imaging of the therapeutic process [1]. Several classes of nanomaterials and hybrid nanocomposites, owing to their unique physicochemical properties, are currently exploited as theranostic nanoformulation, especially for cancer diagnosis and treatment [2,3].
Graphene, made up of sp2-hybridized carbon atoms monolayers arranged into hexagonal crystal lattice [4], has shown intriguing properties such as ultra-high specific area [5], high thermal [6] and electrical [7] conductivity, low charge-transfer resistance [8], high tensile strength [9], and elasticity [10]. Despite such promising outlook, so far, a wide use of graphene in nanomedicine has been limited by its superhydrophobic character, i.e., the poor solubility in aqueous solvent. The development of chemically or physically modified graphene-based materials, including graphene oxide (GO) and reduced graphene oxide (rGO), allows for a more versatile use of graphene with tailored properties for applications in biosensing, imaging, therapeutic, and drug delivery [11,12,13,14,15].
The main oxygen-containing functional groups on GO nanosheets are epoxides (C–O–C), phenolic hydroxyl (–OH), carboxylic (–COOH), and carbonyl groups (C=O), which provide polar properties to the graphene-based material. Indeed, due to these functionalities, GO nanosheets are hydrophilic and stable in aqueous media. It is commonly accepted that in GO the –COOH groups are mainly located at the edges, while –OH and C–O–C groups are located at the basal plane of the nanosheets [16].
The introduction of heteroatoms on GO, including nitrogen, sulfur, and boron moieties [17,18], as well as polymers [19], enzymes [20], semiconductor quantum-dots [21], and magnetic and metal nanoparticles [22,23,24] has been successfully demonstrated either via covalent or noncovalent interactions [25]. To note, the reduction of GO after its chemical modification provides the possibility to improve the electrical, physical, chemical, and biological properties of the nanosheets [26,27,28,29,30] and, at the same time, to modulate their stability in aqueous dispersion by preventing aggregation caused by Van der Waals and π-π stacking interactions [31]. In particular, the functionalization of GO and rGO with sulfur-containing moieties, either directly linked to the graphitic sp2 carbon lattice or via sulfur-containing organic molecules, e.g., cysteine, has been exploited extensively for application in catalysis, electrochemistry, imaging, and biosensing and for the implementation of hydrophobic drug nanocarriers [32,33,34,35,36]. To this respect, great attention has been given to the high stability of the covalent bond between gold and sulfur, usually mediated by thiol (–SH) groups [37].
Along with the applications of GO in nanomedicine and theranostics devices, contrasting results were obtained from different authors for its cytotoxicity. Indeed, the different cytotoxic effects of GO in several cellular lines (both in vivo and in vitro) [38,39,40,41] are generally attributed to the internalization of the nanosheets inside the cells’ matrix with the subsequent induction of reactive oxygen species’ (ROS) production. Moreover, it was demonstrated that either GO or rGO cause loss of cell adhesion, can induce apoptosis and subcellular organelles morphology modification, destruction of the membranes’ integrity, and DNA mutation [42,43]. To this regard, the cytotoxic effects of graphene oxide strongly depend on the physical-chemical characteristics of the nanosheets surface. Interestingly, rGO were found to be less toxic then bare GO, as tested with in vitro models [44] as well as with in vivo experiments, which did not induce thrombus formation caused by blood coagulation [45]. It has been reported that GO cytotoxicity is strictly dependent on the solution concentration, the ionic strength of the solvent, the absorption of plasma corona proteins, the nanoplates’ lateral size, and, most importantly, the number of oxygenated groups present on its surface [46,47,48]. Noteworthy, a direct correlation between the reduction degree of rGO and the cells’ viability was highlighted as result of lower interferences with the electron transport chain with oxygen surface groups of GO [49], which in turn prevents the donation of electrons to site I/II of the electron transport chain and thereby slows down the generation of ROS [50].
To note, during oxidation of the graphene layers of graphite to obtain GO, defects are generated, and oxidation occurs at these defect sites. The main possible oxygen-containing functionalities at defect sites are mainly ketone- and quinone-type groups; however, depending on the size of the defects, other functional groups can also be formed. The oxidation process also activates a side product formation during GO synthesis, referred to as oxidative debris (OD), which acts as a natural surfactant of the GO nanosheets in dispersions and affects agglomeration of graphene oxide layers, thus influencing significantly the stability of GO nanosheets in the suspension [51].
Plasmonic properties of gold nanoparticles (AuNPs) are commonly exploited in biomedical imaging and biosensing [24,52], in biochemistry [53], photothermal therapy [54] and anti-angiogenic applications [55,56,57,58] as a result of the easily tunability of the surface plasmon (SP) band by varying size, shape, or by gold surface modification [59,60,61].
Specifically, gold nanospheres (AuNS) and nanorods (AuNR) have attracted a great interest in nano-biotechnology because of their easily adjustable cytotoxicity by size control, dose, or the capping agent and stabilizer used, facile way of synthesis, and high sensitivity to the microenvironment change [62,63,64]. The integration of GO layers with gold(0) nanostructures, to obtain hybrids GO@Au nanocomposite biosensors, exhibits the dual advantage of increasing the sensing performance, due to the localized surface plasmon resonance (LSPR) property [65], and owning the intrinsic biological activities of nanogold [24,66].
Previous studies have shown that the presence of GO substrates negatively affects the stability of gold nanospheres and nanorods, the main mechanism proposed for the nanoparticle destabilization involving the disruption and stripping of the protective capping ligands by the GO through strong electrostatic interactions [67].
In this study, we proposed a new theranostic platform based on thiolated reduced graphene oxide and integrated with plasmonic spherical and rod-like gold nanoparticles. To the best of our knowledge, although several examples exist in literature on AuNP-decorated GO nanocomposites obtained by in situ growth methods, including green approaches [24,68,69], only few studies have focused on the functionalization of thiolated GO with gold nanoparticles [70].
To avoid uncontrolled reactions and to modulate the hydrophobic character, the OD was removed from the as-received pristine GO by a treatment referred to as base-washing of GO (bwGO) [71]. Reduced monothiolated GO (rGOSH) was synthetized by a selective substitution of epoxydic and hydroxylic groups with thiourea at high temperature (70 °C), after a brominating treatment. Meanwhile, the surface decoration with AuNS and AuNR was performed by in situ reduction of the metal salt precursor and seed-mediated growth processes, by using the GO dispersion as solvent, either bwGO or rGOSH.
The plasmonic-sensing capability of the nanohybrids, in comparison to bare AuNP and GO, were investigated by UV-visible (UV-VIS) spectroscopy. The physicochemical characterization of the nanocomposites was performed by attenuated total reflectance Fourier transform infrared spectroscopy (ATR-FTIR), thermogravimetric analyses (TGA) in nitrogen environment, and atomic force microscopy (AFM). The experimental spectroscopic studies were complemented by density functional theory (DFT)-based calculations. In vitro cellular experiments on human neuroblastoma cancer cells (SH-SY5Y line) were carried out to test the nanotoxicity of the GO@AuNP hybrids in the comparison with the respective single components of AuNP, bwGO, and rGOSH.

2. Materials and Methods

2.1. Chemicals

Graphene oxide (chemically exfoliated) in aqueous dispersion (0.4 wt.%) was purchased from Graphenea Inc., US. Sodium hydroxide (NaOH, ≥97%, pellet), hydrochloric acid (HCl, 37% in H2O), Thiourea (≥99%), hydrobromic acid (HBr, 48% volume ratio in H2O), ascorbic acid, gold(III) chloride trihydrate, cetyl-trimethylammonium bromide (CTAB), trisodium citrated dihydrate and silver nitrate (AgNO3) were purchased from Sigma-Aldrich (St. Louis, MO, USA). For all experiments, ultrapure water was used (18.2 mΩ·cm a 25 °C, total organic carbon (TOC) lower than 5 parts per billion (ppb), UltrapureMillipore® Water Type) and the glassware was cleaned with aqua regia (HCl: HNO3 1:3 volume ratio) and rinsed with ultrapure water before each use. For cellular experiments, Dulbecco’s Modified Eagle Medium (DMEM)-F12, penicillin-streptomycin, L-glutamine, fetal bovine serum (FBS), dimethyl sulfoxide (DMSO), Dulbecco’s phosphate-buffered saline (PBS), paraformaldehyde and 3-(4,5-dimethylthiazol-2-yl)-2,5-diphenyltetrazolium bromide (MTT) were purchased from Sigma-Aldrich.

2.2. Preparation of Base-Washed Graphene Oxide

The OD stripping from as-received GO was performed according to the procedure described by Thomas et al. [71]. Briefly, GO suspension was diluted with ultrapure ultrapure water to reach a concentration of 0.56 mg/mL. NaOH was added to the solution to a final concentration of 14×10−3 mM and then heated at 70 °C for 1 h under constant stirring. The obtained solution was centrifuged (30 min at 15,260× g Relative Centrifugal Force, RCF, room temperature, RT) (Eppendorf Centrifuge 5424) and the collected pellet was resuspended in ultrapure water and recentrifuged. The resultant dispersion was reprotonated with 14 mM HCl solution (1 h at 70 °C, under stirring) and, therefore, the pellet was collected and washed as before. The wet solid was lyophilized overnight to give bwGO powders. The bwGO was suspended in ultrapure water to reach a final concentration of 0.4 mg/mL with 120 min sonication (59 kHz, 25 °C) and then ultra-sonicated 2 h with a titanium cup-horn sonicator (Hielscher UP200Ht) at 200 W and 24 kHz to obtain bwGO120. The as-prepared suspension was centrifuged (20 min at 15,871× g RCF, RT) and the supernatant (bwGO120S), containing nanosheets of 200-nm average lateral size [72], and the pellet (bwGO120P) were lyophilized overnight.

2.3. Synthesis of Thiolated Reduced Graphene Oxide

The functionalization of GO was performed by a one-pot thiolation-reduction mechanism [34]. In summary, bwGO120S (3.25 mg) was suspended in ultrapure water to give a 1-mg/mL solution after sonication (120 min, 59 kHz, 25 °C) and then 220 µL of HBr were added under stirring (2 h at 30 °C). Subsequently, 220 mg of thiourea were added and the solution left to react for 24 h at 80 °C and then cooled at RT. After that, 2.2 mL of NaOH 4 mol dm−3 were added, and the mixture stirred for 30 min, past which the mixture was filtered and washed with water over a 0.2 µm polytetrafluoroethylene (PTFE) membrane. The solid collected was dried at 30 °C for 5 h to provide rGOSH.

2.4. Synthesis of Gold Nanospheres (AuNS)

Aqueous dispersions of AuNS were prepared by a modified Turkevich method [73]. Briefly, 2 mL of 1 mM gold(III) chloride dihydrate solution in ultrapure water were brought to boiling point on a hotplate under stirring, then 200 µL of trisodium citrate dihydrate solution (1% w/v) were quickly added and the mixture was vigorously stirred until it turned from yellow to deep red. The obtained colloidal dispersion was washed with ultrapure water through two centrifugation steps (15 min at 9766× g RCF, RT), in order to remove the excess of reactants. The average core diameter size (D) of citrate-capped AuNS was estimated by UV-VIS spectra, according to Equation (1):
λmax = 515.04 + 0.3647 D,
where λmax is the maximum absorption peak [74]. Therefore, the actual concentration of AuNS dispersion was calculated according to Equation (2):
ε =ADγ,
where ε (M−1 cm−1) is the extinction coefficient, D is the core diameter of the nanoparticles previously calculated, γ and A (in mol−1 dm3 cm−1) are experimental constants (γ = 3.30, A = 4.7 × 10⁴ or γ = 1.47, A = 1.6 · 108 for D ≤ 85 nm or D > 85 nm, respectively) [75]. Assuming the size monodispersity of spherical nanoparticles’ dispersion and uniform face-centered cubic (fcc) structure, the average number of gold atoms (N) for each nanosphere was calculated By Equation (3):
N = (πρD3)/(6M),
where ρ is the density for fcc gold (19.3 g/cm3) and M its atomic weight (197 g/mol) [76].

2.5. Synthesis of Gold Nanorods (AuNR)

Aqueous AuNR dispersions were obtained by seed-mediated surfactant-capped synthesis [77]. Cetyl trimethylammonium bromide-capped seeds (Seed@CTAB) were prepared as follow: 25 µL of 50 mM HAuCl4 were added to 4.7 mL of 0.1 CTAB solution, in water-bath kept to 30.5 °C, and gently stirred for 5 min. Subsequently, 300 µL of freshly prepared 10 mM sodium borohydride were added and vigorously stirred for 5 min, until color turned to brown-yellow. The growth solution was prepared by mixing 25 µL of 50 mM HAuCl4 to 2.5 mL of 0.1 M CTAB solution under stirring for 10 min, in 27.5 °C water-bath. Afterwards, 19 µL of 100 mM ascorbic acid (solution turned colorless) and 20 µL of 5 mM AgNO3 were added. Lastly, 30 µL of Seed@CTAB were added and the solution left undisturbed under vigorous stirring at 27.5 °C for 15 min. Turn in color was observed at the end of this time. The obtained colloidal dispersion was washed by reactants’ excess through two centrifugation steps (9766× g RCF, 15 min), with water washings, by keeping the temperature just above 27 °C. The actual concentration of AuNR dispersion was calculated using molar extinction coefficient ε (nM−1 cm−1) by Equation (4):
ε = 1.2λmax − 4.8,
where λmax is the maximum absorption of longitudinal plasmon resonance SPR peak [78], which position is affected, with a linear dependence, by the aspect ratio value [79], as shown in Equation (5):
λmax = 95R + 420.

2.6. Synthesis of Hybrid GO@AuNS and GO@AuNR

For the synthesis of hybrid GO@AuNS nanocomposites, a one-pot reduction/decoration method was used [24]. Briefly, 2 mL of 1mM HAuCl4 were heated to the boiling point under stirring. Then, 200 µL of trisodium citrate dihydrate solution (1% w/v), prepared in GO aqueous dispersion (0.3 mg/mL, both for bwGO120S and rGOSH), were quickly added and the mixture was vigorously stirred until it turned in color. The resultant dispersions were washed with two centrifugation steps (9766× g RCF, 15 min, RT) to remove reactants in excess.
For the synthesis of GO@AuNR nanohybrids, an in situ seed-mediated growth method was used, as described. Then, 70 µL of 1 mg/mL bwGO120S or rGOSH aqueous dispersions were mixed to 2.43 mL of 0.1 M CTAB solution under stirring for 5 min, in 27.5 °C water-bath. Afterwards, 25 µL of 50 mM HAuCl4 were added and stirred for 5 min. Next, 19 µL of 100 mM ascorbic acid (solution turned colorless) and 20 µL of 5 mM AgNO3, and finally 30 µL of Seed@CTAB solution were added to the mixture. The solution was maintained for 15 min under vigorous stirring at 27.5 °C. Turn in color was observed at the end of this time. To remove the excess of reactants, the resultant dispersions were purified by means of two centrifugation (9766× g RCF, 15 min, T ≥ 27 °C) and water-washing steps.

2.7. Physicochemical Characterization

2.7.1. UV-Visible (UV-VIS) and Attenuated Total Reflectance FTIR (ATR-FTIR) Spectroscopies

UV-VIS spectra of the aqueous dispersions were recorded using Perkins Elmer 2S spectrometer and quartz cuvettes with an optical path length of 0.1 cm. ATR-FTIR spectra were recorded in the range of 4000–400 cm−1, using Perkins Elmer 100 FTIR spectrometer equipped with ATR system and zinc selenide (ZnSe) crystal. In order to prepare the samples for FTIR, the pellets recovered after the procedure of purification of the nanoparticle dispersions described above were lyophilized by a freeze-drying process. Pure trisodium citrate and CTAB spectra were obtained by analyzing the as-purchased solid.

2.7.2. Thermogravimetric Analysis (TGA)

Thermogravimetric analyses were carried out on lyophilized powders by using a PerkinElmer Pyris TGA7 instrument. Experiments were run in the temperature range of 50–800 °C, with a heating rate of 10 °C min−1 and under nitrogen flow (60 mL min−1). The samples to test were prepared as lyophilized powders of the dispersions purified as described above.

2.7.3. Atomic Force Microscopy (AFM)

Topographic AFM images were acquired using a Cypher S instrument (Asylum Research, Oxford Instruments, Santa Barbara, CA) operating in dynamic contact mode (also called intermittent contact, AC mode or tapping mode) tapping AC mode and equipped with XY scanner with scan range of 30/40 μm (closed/open loop). Silicon tetrahedral tips, mounted on rectangular 30 μm long cantilevers, were purchased from Olympus (AC240TS, Oxford Instruments). The probes had nominal spring constant of 2 N/m and driving frequencies of 70 kHz. Samples were prepared by dropping 10 μL of bwGO, rGOSH, AuNS, AuNR, and hybrids’ aqueous dispersion on a freshly cleaved muscovite mica (Ted Pella, Inc.). After 5 min of incubation at RT, samples were washed with 1 mL of Millipore water and dried under a gentle nitrogen flow.

2.8. Computational Studies

The surface of graphene oxide was built by following the analyses of Klinowski et al. [80], with a random distribution of hydroxyl and epoxy groups on both planar sides of the GO sheet. The rGOSH was obtained by substituting oxygen atoms with sulphur atoms. A fcc gold unit cell was built by replicating it 3 × 3 × 3 along the unit cell edge length (a b c) in the three crystallographic directions. From the supercell, we obtained a rod-shaped Au nanoparticle with diameter of 1 nm and length of 2.5 nm and 135 atoms that was generated by using the build nanostructure tools included in the MS Materials Studio package.
All the calculations were performed by Gaussian 09 software at Density Functional Theory (DFT) level. The dispersion-corrected functional M06L [81] was used together with the 6-31G (d) basis set for GO and reduced monothiolated GO, whereas AuNR was described at the semi-empirical (SE) PM6 level [82]. UV-VIS and IR spectra were calculated within the time-dependent DFT approach.

2.9. Cell Cultures

SH-SY5Y tumoral neuroblastoma cells were cultured in DMEM-F12 supplemented with 10% (v/v) FBS, glutamine 2 mM, 100 UI penicillin/ 0.1 mg/mL streptomycin. Cells were grown in tissue culture-treated Corning® flasks (Sigma-Aldrich, St. Louis, MO) under a humidified atmosphere of air/CO2 (95:5) at 37 °C in an incubator (Heraeus Hera Cell 150C incubator). The cytotoxicity of the samples was tested on neuroblastoma tumor cells (SH-SY5Y). The cells were plated into a 96-multiwell plate in complete medium at a density of 15 · 103 cells per well. Afterward, cells were treated for 24 h, in medium supplemented with 1% (v/v) FBS, with bwGO120S, rGOSH at the two concentrations of 1.35 µg/mL and 0.54 µg/mL, respectively, and the nanosystems, namely, AuNS, AuNR, the hybrids bwGO@NS, bwGO@NR, rGOSH@NS, and rGOSH@NR, by diluting 20 and 50 times the lyophilized samples resuspended at the concentration of 1 mg/mL in MilliQ water. Cytotoxicity was determined at 37 °C, by using the tetrazolium dye 3-(4,5-dimethylthiazol-2-yl)-2,5-diphenyltetrazolium bromide (MTT) [83]. After 90 min of incubation, the enzymatic reduction of MTT to the insoluble purple formazan product was detected by dissolving the crystals with 100 μL of dimethyl sulfoxide and thus measuring the absorbance at 570 nm by Varioscan spectrophotometer (Varioskan® Flash Spectral Scanning Multimode Readers, Thermo Scientific). The experiments were performed in triplicate and the results are presented as the means ± standard error of mean (SEM). The statistical analysis was performed by student’s t-test.

3. Results and Discussions

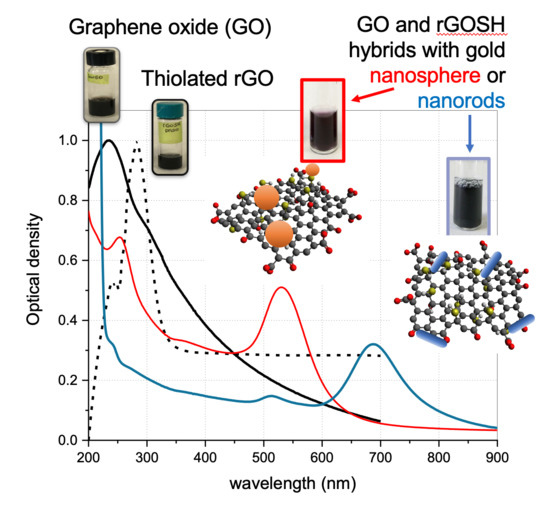
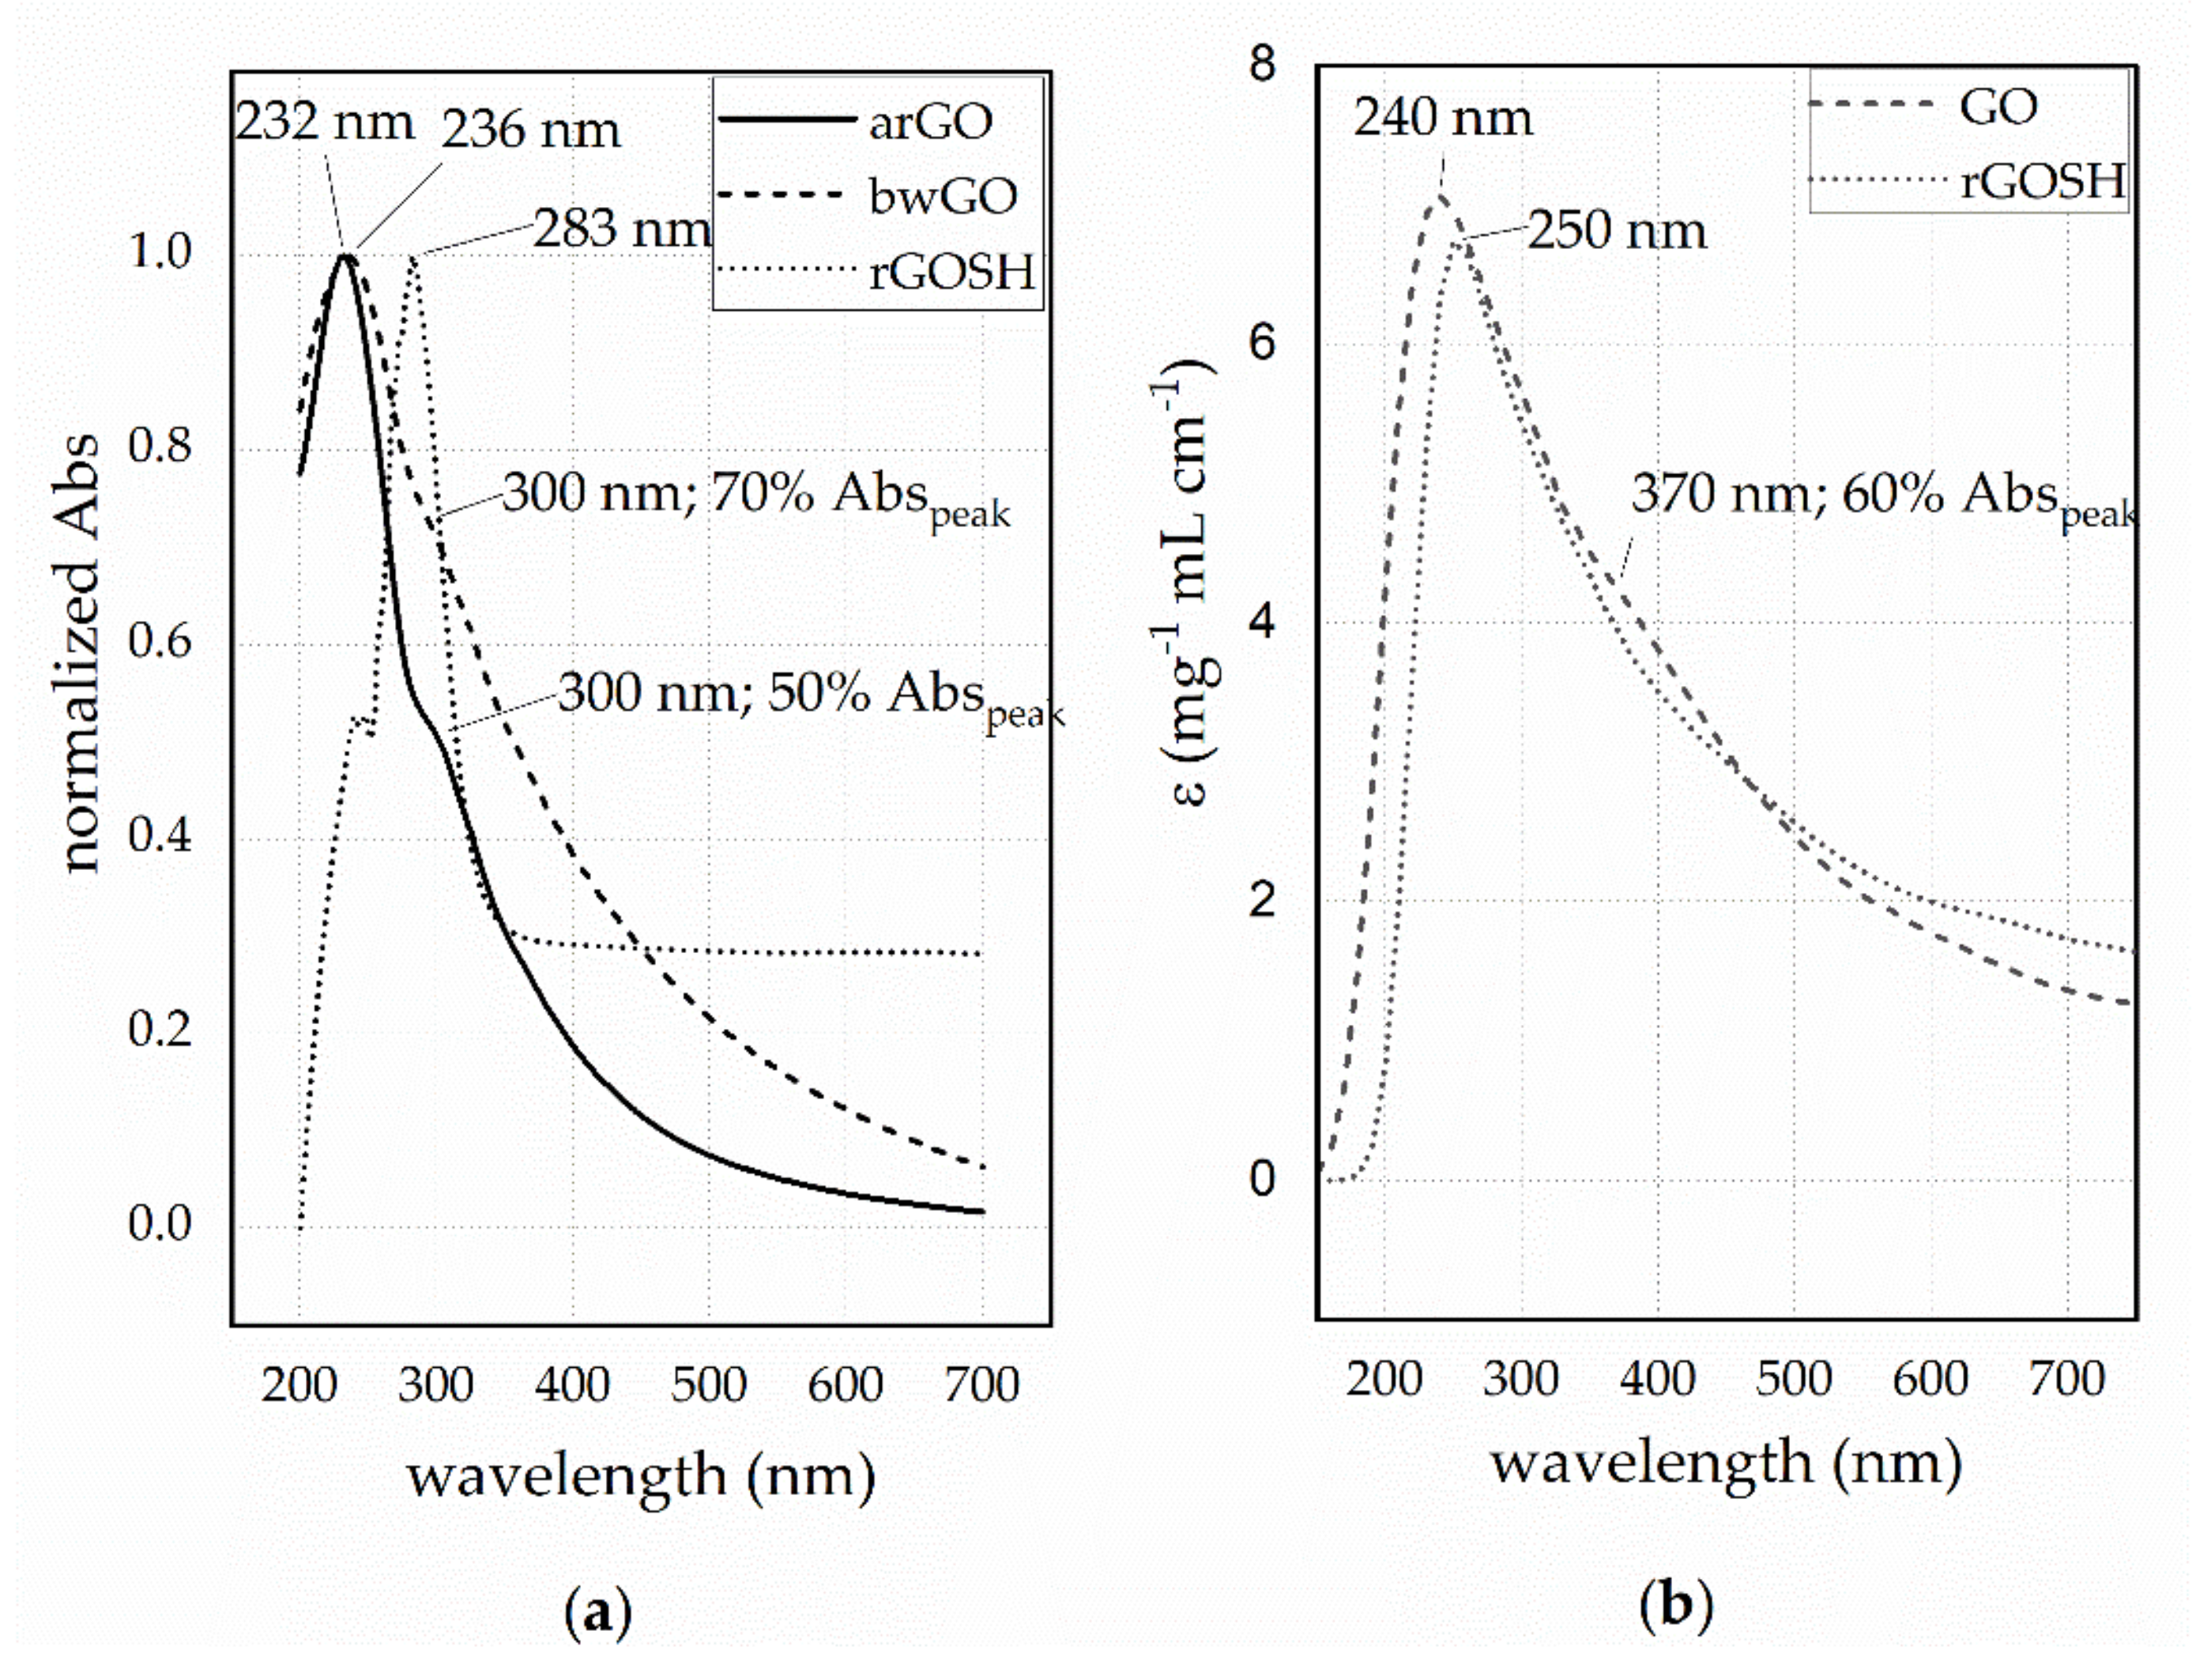
3.1. Physicochemical Characterisation UV-Visible Characterization of GO-Based Nanosheet Dispersions and Plasmonic Nanoplatforms

From all UV-VIS spectroscopic studies, carried out in the comparison of thiolated reduced graphene oxide with graphene oxide, it can be inferred that the optical absorption of GO is dominated by the π→π* plasmon peak near 230 nm (Figure 1).
Figure 1a displays the experimental spectra of as-received pristine GO (arGO) as well as of GO after the base-wash treatment (bwGO) and the functionalization with thiol groups (rGOSH). The as-received GO exhibits an absorption peak centered at 232 nm, attributed to π→π* transition of aromatic C=C bonds and a shoulder at 300 nm, attributed to n→π* transition of carboxyl and other carbonyl and hydroxyl auxochromes [84]. The base-wash treatment on GO was expected to increase the hydrophobic character of the GO by the desorption of OD from the nanosheets’ surface [71], which decreased the number of oxygen-containing groups and produced a partial restoration of the π conjugated systems. Accordingly, the spectrum of bwGO displayed a redshift to 236 nm of the π→π* transition band accompanied by an increased broadening. No significant differences were observed in the n→π* absorption shoulder, except in the relative intensity increase (from about 50% to about 70%) compared to the peak of the π→π* transition. Since the latter depends on two kinds of conjugative effects, related, respectively, to nanometer-scale sp2 clusters and linking chromophore units such as C=C, C=O and C–O bonds [85], it was inferred that the change of the UV-VIS absorption relative intensity of n→π* to π→π* transition in bwGO in comparison with arGO was caused by the decreased conjugative effect of chromophore aggregation, which mostly influenced the π→π* plasmon peak [17].
Finally, the UV-VIS spectrum of rGOSH sample showed the disappearance of the shoulder at around 300 nm and the absorption peak associated with the aromatic bonds significantly redshifted to 282 nm. The bathochromic effect, which is characteristic of the electrical continuity of the nanosheets and enhanced restoration of π-aromatic bonds [86], was a result of the brominating treatment at elevated temperature, which provided the reduction of the bwGO [87]. Indeed, it was demonstrated that the thiolation reaction produced hydrosulfide byproduct (H2S), which, in turn, reduced GO partially to rGO, inducing a redshift in the UV-VIS absorption [32].
Noteworthy, the lower solubility of rGOSH than hydrophilic bwGO, and the tendency of the dispersion to aggregate in water (which required the samples to be dispersed in DMSO), ruled out the increased hydrophobicity of the nanosheets as further mark of the graphene oxide reduction.
Within the limits determined by the semi-empirical approach, the calculated UV-visible spectra, reported in Figure 1b, were in good agreement with experimental data. In particular, the theoretical UV-VIS spectrum of GO showed the peak related to the π→π* transitions at 240 nm, which was slightly redshifted than the experimental finding (at 236 nm), while the expected n→π* absorption near 300 nm was calculated at 370 nm. Additionally, theoretical data showed a εshoulderpeak ratio of about 0.6. As to the calculated spectrum of rGOSH, an absorption peak of the π→π* transitions was found at 250 nm, but again no significant spectral evidence of n→π* transitions.
Table 1, which gives the molar extinction coefficients at the peak and shoulder wavelengths’ positions as estimated from the experimental spectra and calculated by the computational method, confirms the qualitative trend discussed above.
Thermogravimetric studies confirmed the substantial structural modification of bwGO and rGOSH compared to the pristine GO. Indeed, the TGA curves reported in Figure 2 show different ranges of temperature and weight loss in the typical three steps, namely: (1) the low-temperature region (first step, from 50 to 110 °C), corresponding to the loss of physiosorbed water; (2) the intermediate-temperature interval (second step, from 110 to 350 °C), due to the loss of the unstable oxygen moieties (i.e., carboxylic groups); (3) the high-temperature region (third step, above 360 °C and up to 800 °C), assigned to degradation of the most stable functionalities (such as residual oxygenated groups and thiolated moieties) (see the quantitative analysis in Table 2.
The TGA curve of pristine GO exhibited a loss of physiosorbed water corresponding to 4.2% of weight loss. The structural modification expected in GO due to the base-washing procedure was confirmed by the higher release of physiosorbed water (7.6% weight loss during the first step), which suggested a weaker interaction of the water molecules on the bwGO (more hydrophobic) purely driven by hydrogen bonds and hence a dominant role of the attractive Van der Waals dispersive interactions than arGO. Moreover, the efficient stripping of OD can be ruled out by the lower weight loss during the second step (about 22.8% and 44.5% for bwGO and arGO, respectively). As to the third degradation step, it disclosed comparable weight losses both in arGO (10.7%) and bwGO (11.6%). To note, the first step of the TGA curve for rGOSH exhibited the lowest weight loss in the adsorbed water content (‘only’ 2.9% desorbed mass), thus evidencing a completely different binding mode of the water molecules onto the reduced GO in comparison with arGO and bwGO samples.
Also, as expected by the reduction that occurred upon the hydrobromic treatment of GO during the one-pot synthesis of thiolated GO, the second degradation step in the TGA curve for rGOSH sample was barely visible (7.6%). On the other hand, because of the presence of the sulfhydryl groups onto the reduced GO sheets, rGOSH exhibited the highest weight loss in the third degradation step (51.0%, i.e., considerably higher than the corresponding weight loss measured for arGO and bwGO), leaving a residue of 34.5%.
The structural changes of bwGO and rGOSH in the comparison with arGO were confirmed by infrared spectroscopy analyses (Figure 3).
In Figure 3a, the experimental ATR-FTIR spectra of arGO, bwGO, and rGOSH samples are shown. The IR spectrum of pristine GO demonstrates the presence of –OH (at 3392 cm−1), carboxyl –C=O and –C–O (stretching modes at 1737 cm−1 and 1425 cm−1, respectively), aromatic –C=C (at 1622 cm−1), epoxy O–C–O (bending modes at 874 cm−1), and C-OH phenolic stretching (at 1050 cm−1), indicating the existence of oxygen-containing groups on the GO sheets [88]. The C-H stretching modes at 3222 cm−1 are also visible.
Upon the base-wash treatment of GO, a diminished intensity in both the epoxy (at 874 cm−1) and the hydroxy (at 1050 cm−1) vibrational mode bands were observed, concomitantly with the appearance of a band at 1228 cm−1, attributed to the C–O–C stretching, and a redshift to 1580 cm−1 and to 1716 cm−1 of the aromatic –C=C and of C=O stretching modes, respectively. These findings are characteristic of the deoxygenated surface, which occurred with the removal of OD and subsequent restoration of conjugation in the π-aromatic system [89].
After the brominating and thiolation treatments, it was expected that the hydroxyl (–OH) and carboxylic (–COOH) functional groups of GO would be transformed into sulphur-containing moieties, including thiol (–SH), for the most part, but also thiocarboxylic (–COSH) or dithiocarbonxylic (–CSSH) groups [32]. Accordingly, for rGOSH sample, the absorption broadband in the wavenumber region around 3400 cm−1 disappeared, which revealed the absence of OH group after reduction. In general, all C–O vibrational modes were no longer observed in the rGOSH spectrum and the peak belonging the –C=C vibrational mode was redshifted to 1565 cm−1 [90]. The weak S-H stretching band was barely visible at 2667 cm−1 [89].
The calculated IR spectra in Figure 3b confirmed the trend observed in the experimental spectra, i.e., the disappearance in rGOSH sample of the peaks due to the O-H stretch modes (3600–3400 cm−1 region), the appearance of S-H stretching at 2770 cm−1, and the redshift of C=C stretching mode (1570 cm−1 vs. 1580 cm−1 in GO sample). Moreover, in the fingerprint region, 2000–800 cm−1, where several convoluted bands were superimposed on a broader absorbance, significant changes in the spectral feature were visible for rGOSH compared to GO, including the decrease of epoxide stretch at 1260 cm−1 [91] and a significant absorption by C–S stretching modes at 720 cm−1 [92].
The hybrid graphene-plasmonic gold nanoparticle nanocomposites were fabricated by a one-pot synthetic process through the reduction of the precursor metal salt in the aqueous dispersions of base-washed GO or thiolated reduced GO nanosheets.
Figure 4 shows the UV-VIS spectra of graphene-based hybrids with gold nanosphere (AuNS, Figure 4a) and nanorods (AuNR, Figure 4b), in the comparison with the spectra of the corresponding nanoparticles alone. To note, for all hybrid samples, the optical absorption of GO was buried by the spectral features of the gold nanoparticles, which instead maintained or even enhanced their plasmonic-sensing capability in the AuNS@GO and AuNR@GO nanocomposites.
The absorption spectrum of metal nanoparticles with diameters between 3–100 nm is characterized by a strong band caused by collective excitation of free electrons, which is usually ascribed to the surface plasmon resonance phenomenon. This absorption band is very sensitive to the structure of the particle and the nature of the surrounding environment, namely the size and shape of the nanosystem, and the presence of the ligands as well as the solvent in which the particles are dispersed [93].
Spherical gold nanoparticles having a diameter between 12 and 40 nm show an absorption peak in the visible region, at 520–530 nm, which gradually redshifts as the size of the nanoparticle increases [74]. Accordingly, Figure 4a shows that citrate capped AuNS exhibited a plasmon peak centered at 525 nm, which corresponds to spherical nanoparticles with an optical diameter of about 27 nm (Table 3). As to the NPs grown in the presence of bwGO or rGOSH, in both cases the SPR band of the hybrid was slightly broader and redshifted by about 5 nm, suggesting an effective interaction of the AuNS with the GO sheets, which provided new relaxation pathways to the free electrons on the metal nanosystems [67].
When the shape of AuNPs changed from spheres to rods (Figure 4b), the SP signal was split into two bands: A strong peak in the near-infrared (NIR) region (716 nm), corresponding to electron oscillations along the long axis, referred to as longitudinal band, and a weak band in the visible region at a wavelength similar to that of spherical gold (512 nm) due to the transverse electronic oscillation [94]. Interestingly, a blueshift of about 28 nm and 29 nm for the longitudinal plasmon band, respectively, of bwGO@AuNR and rGOSH@AuNR, indicated that the aspect ratio of AuNRs was significantly reduced when the seed-mediated growth process occurred in the presence of GO nanosheets. To note, for the rGOSH@AuNR hybrid the SP band at ~512 nm almost completely disappeared and the longitudinal plasmon band decreased in intensity, thus evidencing electronic and optical interference of GO on the plasmonic nanostructures [67].
In order to remove the excess of reactant, especially the CTAB used for the growth of nanorods, the nanocomposite systems were purified by centrifugation and water-washing steps (see Materials and Methods section) and characterized by UV-VIS spectroscopy (Figure 5).
The spectra in Figure 5 demonstrate: (1) The efficiency of the methodology, which collected most of the plasmonic particles in the pellets, while the supernatants were optically transparent; (2) the general stability of the prepared particles upon aggregation, with minor shifts (bathochromic for AuNS and GO@AuNS, hypsochromic for AuNR and GO@AuNR, respectively) in the plasmon wavelengths measured for most of the tested conditions.
Figure 6 illustrates the morphology of GO@AuNP nanocomposites, with spherical and rod-like nanoparticles detected most preferentially at the basal plane and at the edge of the nanosheets, respectively. The cross-sectional view of the typical AFM height images indicated a length over the longitudinal and transversal axes of AuNRs, respectively, of about 70 and 28 nm, while for AuNS a diameter of about 30 nm was measured, according to the electronic spectroscopy analyses. Moreover, substrate-dependent effects in the size and circularity of the nanoparticles grown in the presence of bwGO or rGOSH were disclosed by the quantitative study of the AFM height micrographs, as estimated by the values of particle average height, z, and aspect ratio, r, respectively (Table 4).
In particular, an opposite size change trend but a similar increase in circularity were displayed both by bwGO@AuNS (Figure 6b) and rGOSH@AuNS (Figure 6c), compared to the citrate-capped gold nanospheres (Figure 6a). On the other hand, a bimodal distribution of circularity was found for AuNRs with both rod-like and spherical-grown seeds (Figure 6d), which was maintained in bwGO@AuNR (Figure 6e) but not on rGOSH@AuNR (Figure 6f), where mostly spherical nanoparticles were detected. To note, residues of the CTAB used to assist the seed-mediated growth of the nanorods were clearly detected, especially for the sample of AuNR (see arrows in Figure 6d), since the cationic surfactant strongly interacted.
The infrared spectra analyses also confirmed the strong association of the gold nanoparticles to the GO substrates in the GO@AuNP nanocomposites (Figure 7).
As to the hybrids of GO and AuNS, the experimental spectra in Figure 7a disclose significant shifts in the bands associated to the asymmetric and symmetric stretching modes of the citrate carboxylate (–COO) moieties, interpreted as due to the unidentate covalent bond formation between oxygen atom of citrate –COO moieties and gold atoms on the nanoparticle surface [95]. In particular, in the ATR-FTIR spectra of citrate-capped AuNS, bwGO@AuNS, and rGOSH@AuNS, the peaks for the –COO asymmetric stretching modes were visible, respectively, at 1560, 1569 and 1556 cm−1, largely redshifted in comparison to the original peak position in the citrate at 1582 cm−1 [96]. On the other hand, the peak for carboxylate symmetric stretching at 1388 cm−1 in the citrate reference sample was found at 1398 cm−1 for both AuNS and bwGO@AuNS, while it was slightly shifted to 1391 cm−1 in the rGOSH@AuNS spectrum. Noteworthy, a weak absorption at 676 cm−1, attributed to the O-Au bond stretching mode, was visible in the AuNS spectrum [97]. Also, the characteristic features of C=O carboxylic and carbonylic vibrational modes of GO were discernable in the bwGO@AuNS and rGOSH@AuNS spectra at 1702 and 1701 cm−1, respectively. Moreover, characteristic C-O and C-H vibrational modes were quite visible in the GO@AuNS spectra below 1200 cm−1 as well as the weak absorption attributed to S-H stretching mode (at 2664 cm−1) in the rGOSH spectrum [98].
The experimental IR spectra of CTAB-capped AuNR and of the hybrids with GO showed the characteristic absorption peaks of CTAB, with no significant shifts compared to CTAB alone, indicating the likely presence of unbound CTAB on the gold surface (Figure 7b). Specifically, the spectrum of CTAB showed the strong absorption bands attributed to the symmetric and asymmetric C–H stretching modes at 2916 and 2849 cm−1, respectively. Furthermore, the asymmetric and symmetric C-H scissoring of CH2 of the hydrocarbon tail of CTAB were visible at 3017 and 1488 cm−1 [99]. The peaks at 1463 and 1473 cm−1 were characteristic of CH3–N+ scissoring modes [100], while the C–N stretching mode exhibited a peak at 960 cm−1, as well as the vibrational mode at 719 cm−1 corresponding to the bending of more than four adjacent CH2 groups [101].
As to the calculated IR spectra, Figure 7b shows that the presence of AuNR on the surface of GO or rGOSH induced both hyperchromic and bathochromic shifts for the stretching modes of O-H (at 3490 cm−1) or S-H (at 2730 cm−1), respectively. To note, the computational approach unravels enhanced vibrational modes for the GO@AuNP hybrids that are commonly observed in surface enhanced Raman scattering (SERS) [102], such as graphitic band (at 1570 cm−1), representative of the sp2 hybridized network of carbon in GO and C=C bonds at 1510 cm−1 in rGOSH, respectively.

3.2. Biological Characterization of GO and GO@AuNP Nanocomposite Platforms

The theranostic capabilities of the fabricated GO@AuNP were tested in terms of cytotoxicity on human neuroblastoma cells (SH-SY5Y line).
The cell viability results from MTT assays demonstrated that the cells’ treatment with bwGO and rGOSH at the tested conditions did not induce cytotoxic effects (Figure 8). Such results are in agreement with literature data, which evidence only a slight cytotoxicity on SH-SY5Y cells for treatments with GO at concentrations lower than 80 µg/mL and a decrease (about 20% than control untreated) in the cell viability after 96-h treatment with 100 µg/mL GO [24,103].
As to the cellular treatments with the nanoparticles, after 24 h of cells’ incubation with AuNS or hybrid GO@AuNS, still no significant toxicity was detected (Figure 8a). On the contrary, the cellular treatments with AuNR or GO@AuNR induced a viability decrease of about 80% with respect to the control untreated cells (Figure 8b).
To note, the size, shape, and surface functional groups are pivotal to drive bioavailability, uptake, subcellular distribution, metabolism, and degradation of the nanoparticle. In particular, according to many reports, gold nanoparticles in the size range of 4–18 nm, upon capping with agents like citrate, cysteine, glucose, and biotin, are nontoxic in several cell lines, including leukemia cells (nanoparticle concentration up to 200 micromolar (µM), neuroblastoma and brain glioblastoma (nanoparticle concentration lower than 10 nanomolar [57,58]), and human immune system cells (nanoparticle concentration up to 100 micromolar [104]).
On the other hand, the synthesis of rod-like gold nanoparticles used in the present work required a seed-mediated approach based on the use of CTAB cationic surfactant [105], which formed a bilayer at the nanoparticle surface, which can be toxic to cells even at sub-micromolar dose [106]. Moreover, CTAB drives the growth and the formation of the rod [107] and, simultaneously, inferring also a positive charge to the nanoparticle [108]. However, the bilayer structure of CTAB on the AuNRs has been demonstrated being able to generate defects on the cell membrane, inducing cell death [109]. Moreover, as a cationic surfactant, CTAB itself can easily pass through the cell membrane and target mitochondria, thus causing apoptosis [110]. It has been demonstrated that the cellular toxicity of CTAB-capped gold nanoparticles is significantly reduced when the nanoparticles are centrifuged and washed with water, to remove unbound CTAB [111].
Although all the dispersions with rod-like gold nanoparticles used in this study were purified by centrifugation and water-washing (repeated a limited number of times for avoiding excessive aggregation) to remove the CTAB in excess (see Materials and Methods), the AFM and FTIR results discussed above rule out the presence of a significant residual amount of unbound CTAB. Hence, even if the concentrations of GO samples, nanorods, and related hybrid nanocomposites were scaled down for the cellular treatments, in comparison with the corresponding cellular experiments with AuNS, the cellular treatments either with bwGO@AuNR or rGOSH@AuNR nanocomposites resulted as still highly cytotoxic against the tumor cell line used in the present experiments.

4. Conclusions

In this work, nanocomposite 2D theranostic platforms based on graphene and gold nanoparticles were scrutinized by a combination of experimental techniques (including electronic and vibrational spectroscopies, thermogravimetric analyses, and atomic force microscopy) and computational methods. The surface functional groups on the graphene oxide and thiolated reduced graphene oxide substrates, and the resulting hydrophobic character, were demonstrated to drive the growth and the optical response of plasmonic gold nanosphere or nanorods fabricated by a simple, one-pot, chemical reduction process from the metal salt precursor. The cytotoxic effects tested on a human neuroblastoma cell line showed the promising potential of these systems as theranostic platforms in cancer therapy.

Author Contributions

Conceptualization, P.T. and C.S.; experimental investigation, P.T., V.S., C.B., L.M.C., G.C., A.N., and P.G.M.; theoretical investigation, G.F.; data curation, P.T., V.S., and L.M.C.; writing—original draft preparation, P.T. and V.S.; writing—review and editing, C.S. All authors have read and agreed to the published version of the manuscript.

Funding

This research was partially funded by the Italian Ministry of Education, Universities and Research (MIUR) (PRIN call, project code: 2017WBZFHL), the ERA-NET Cofund “M-ERA-NET 2” call (Project name “SmartHyCAR”, number: 4274), and University of Catania (call: Piano della Ricerca di Ateneo, Linea di Intervento 2, 2018–2020 and GRABIO projects).

Acknowledgments

C.S. acknowledges the Consorzio Interuniversitario di Ricerca in Chimica dei Metalli nei Sistemi Biologici (CIRCMSB), Bari, Italy.

Conflicts of Interest

The authors declare no conflict of interest.

References

  1. Onaciu, A.; Jurj, A.; Moldovan, C.; Berindan-Neagoe, I. Theranostic Nanoparticles and Their Spectrum in Cancer. In Engineered Nanomaterials Safety; Intech. Open: London, UK, 2019. [Google Scholar]
  2. Lammers, T.; Aime, S.; Hennink, W.E.; Storm, G.; Kiessling, F. Theranostic Nanomedicine. Acc. Chem. Res. 2011, 44, 1029–1038. [Google Scholar] [CrossRef] [PubMed]
  3. Di Pietro, P.; Strano, G.; Zuccarello, L.; Satriano, C. Gold and Silver Nanoparticles for Applications in Theranostics. Curr. Top. Med. Chem. 2016, 16, 3069–3102. [Google Scholar] [CrossRef] [PubMed]
  4. Allen, M.J.; Tung, V.C.; Kaner, R.B. Honeycomb Carbon: A Review of Graphene. Chem. Rev. 2010, 110, 132–145. [Google Scholar] [CrossRef] [PubMed]
  5. Li, X.; Chen, Y.; Cheng, Z.; Jia, L.; Mo, S.; Liu, Z. Ultrahigh specific surface area of graphene for eliminating subcooling of water. Appl. Energy 2014, 130, 824–829. [Google Scholar] [CrossRef]
  6. Balandin, A.A.; Ghosh, S.; Bao, W.; Calizo, I.; Teweldebrhan, D.; Miao, F.; Lau, C.N. Superior Thermal Conductivity of Single-Layer Graphene. Nano Lett. 2008, 8, 902–907. [Google Scholar] [CrossRef] [PubMed]
  7. Meric, I.; Han, M.Y.; Young, A.F.; Ozyilmaz, B.; Kim, P.; Shepard, K.L. Current saturation in zero-bandgap, top-gated graphene field-effect transistors. Nat. Nanotechnol. 2008, 3, 654–659. [Google Scholar] [CrossRef]
  8. Shao, Y.; Wang, J.; Wu, H.; Liu, J.; Aksay, I.A.; Lin, Y. Graphene Based Electrochemical Sensors and Biosensors: A Review. Electroanalysis 2010, 22, 1027–1036. [Google Scholar] [CrossRef]
  9. Lee, G.H.; Cooper, R.C.; An, S.J.; Lee, S.; van der Zande, A.; Petrone, N.; Hammerberg, A.G.; Lee, C.; Crawford, B.; Oliver, W.; et al. High-Strength Chemical-Vapor-Deposited Graphene and Grain Boundaries. Science 2013, 340, 1073–1076. [Google Scholar] [CrossRef]
  10. Sakhaee-Pour, A. Elastic properties of single-layered graphene sheet. Solid State Commun. 2009, 149, 91–95. [Google Scholar] [CrossRef]
  11. Kuila, T.; Bose, S.; Khanra, P.; Mishra, A.K.; Kim, N.H.; Lee, J.H. Recent advances in graphene-based biosensors. Biosens. Bioelectron. 2011, 26, 4637–4648. [Google Scholar] [CrossRef]
  12. Li, J.-L.; Tang, B.; Yuan, B.; Sun, L.; Wang, X.-G. A review of optical imaging and therapy using nanosized graphene and graphene oxide. Biomaterials 2013, 34, 9519–9534. [Google Scholar] [CrossRef] [PubMed]
  13. Liu, J.; Dong, J.; Zhang, T.; Peng, Q. Graphene-based nanomaterials and their potentials in advanced drug delivery and cancer therapy. J. Control. Release 2018, 286, 64–73. [Google Scholar] [CrossRef] [PubMed]
  14. Wang, Y.-W.; Fu, Y.-Y.; Peng, Q.; Guo, S.-S.; Liu, G.; Li, J.; Yang, H.-H.; Chen, G.-N. Dye-enhanced graphene oxide for photothermal therapy and photoacoustic imaging. J. Mater. Chem. B 2013, 1. [Google Scholar] [CrossRef] [PubMed]
  15. Yang, K.; Feng, L.; Shi, X.; Liu, Z. Nano-graphene in biomedicine: Theranostic applications. Chem. Soc. Rev. 2013, 42, 530–547. [Google Scholar] [CrossRef]
  16. Eng, A.Y.S.; Chua, C.K.; Pumera, M. Refinements to the structure of graphite oxide: Absolute quantification of functional groups via selective labelling. Nanoscale 2015, 7, 20256–20266. [Google Scholar] [CrossRef]
  17. Di Pietro, P.; Forte, G.; D’Urso, L.; Satriano, C. The hybrid nanobiointerface between nitrogen-doped graphene oxide and lipid membranes: A theoretical and experimental study. AIMS Mater. Sci. 2016, 4, 43–60. [Google Scholar] [CrossRef]
  18. Di Pietro, P.; Forte, G.; Snyders, R.; Satriano, C.; Bittencourt, C.; Thiry, D. Sulphur functionalizion of graphene oxide by radiofrequency plasma. Plasma Process. Polym. 2020. [Google Scholar] [CrossRef]
  19. Nguyen, L.H.; Nguyen, T.D.; Tran, V.H.; Dang, T.T.H.; Tran, D.L. Functionalization of reduced graphene oxide by electroactive polymer for biosensing applications. Adv. Nat. Sci. Nanosci. Nanotechnol. 2014, 5. [Google Scholar] [CrossRef] [Green Version]
  20. Jung, J.H.; Cheon, D.S.; Liu, F.; Lee, K.B.; Seo, T.S. A Graphene Oxide Based Immuno-biosensor for Pathogen Detection. Angew. Chemie Int. Ed. 2010, 49, 5708–5711. [Google Scholar] [CrossRef]
  21. Zeng, X.; Tu, W.; Li, J.; Bao, J.; Dai, Z. Photoelectrochemical Biosensor Using Enzyme-Catalyzed in Situ Propagation of CdS Quantum Dots on Graphene Oxide. ACS Appl. Mater. Interfaces 2014, 6, 16197–16203. [Google Scholar] [CrossRef]
  22. Wang, C.; Ravi, S.; Garapati, U.S.; Das, M.; Howell, M.; Mallela, J.; Alwarappan, S.; Mohapatra, S.S.; Mohapatra, S. Multifunctional chitosan magnetic-graphene (CMG) nanoparticles: A theranostic platform for tumor-targeted co-delivery of drugs, genes and MRI contrast agents. J. Mater. Chem. B 2013, 1. [Google Scholar] [CrossRef] [PubMed]
  23. Subrahmanyam, K.S.; Manna, A.K.; Pati, S.K.; Rao, C.N.R. A study of graphene decorated with metal nanoparticles. Chem. Phys. Lett. 2010, 497, 70–75. [Google Scholar] [CrossRef]
  24. Cucci, L.; Naletova, I.; Consiglio, G.; Satriano, C. A Hybrid Nanoplatform of Graphene Oxide/Nanogold for Plasmonic Sensing and Cellular Applications at the Nanobiointerface. Appl. Sci. 2019, 9, 676. [Google Scholar] [CrossRef] [Green Version]
  25. Gao, W. The Chemistry of Graphene Oxide. In Graphene Oxide; Springer Science and Business Media LLC: Berlin/Heidelberg, Germany, 2015; pp. 61–95. [Google Scholar]
  26. Wang, Y.; Li, Z.; Wang, J.; Li, J.; Lin, Y. Graphene and graphene oxide: Biofunctionalization and applications in biotechnology. Trends Biotechnol. 2011, 29, 205–212. [Google Scholar] [CrossRef]
  27. Pei, S.; Cheng, H.-M. The reduction of graphene oxide. Carbon 2012, 50, 3210–3228. [Google Scholar] [CrossRef]
  28. Shen, J.; Shi, M.; Ma, H.; Yan, B.; Li, N.; Hu, Y.; Ye, M. Synthesis of hydrophilic and organophilic chemically modified graphene oxide sheets. J. Colloid Interface Sci. 2010, 352, 366–370. [Google Scholar] [CrossRef]
  29. Rajagopalan, B.; Chung, J.S. Reduced chemically modified graphene oxide for supercapacitor electrode. Nanoscale Res. Lett. 2014, 9. [Google Scholar] [CrossRef]
  30. Nurunnabi, M.; Parvez, K.; Nafiujjaman, M.; Revuri, V.; Khan, H.A.; Feng, X.; Lee, Y.-k. Bioapplication of graphene oxide derivatives: Drug/gene delivery, imaging, polymeric modification, toxicology, therapeutics and challenges. RSC Adv. 2015, 5, 42141–42161. [Google Scholar] [CrossRef]
  31. Xu, L.Q.; Wang, L.; Zhang, B.; Lim, C.H.; Chen, Y.; Neoh, K.-G.; Kang, E.-T.; Fu, G.D. Functionalization of reduced graphene oxide nanosheets via stacking interactions with the fluorescent and water-soluble perylene bisimide-containing polymers. Polymer 2011, 52, 2376–2383. [Google Scholar] [CrossRef]
  32. Pham, C.V.; Eck, M.; Krueger, M. Thiol functionalized reduced graphene oxide as a base material for novel graphene-nanoparticle hybrid composites. Chem. Eng. J. 2013, 231, 146–154. [Google Scholar] [CrossRef]
  33. Orth, E.S.; Fonsaca, J.E.S.; Almeida, T.G.; Domingues, S.H.; Ferreira, J.G.L.; Zarbin, A.J.G. Functionalized graphene oxide as a nanocatalyst in dephosphorylation reactions: Pursuing artificial enzymes. Chem. Commun. 2014, 50, 9891–9894. [Google Scholar] [CrossRef] [PubMed]
  34. Chua, C.K.; Pumera, M. Monothiolation and Reduction of Graphene OxideviaOne-Pot Synthesis: Hybrid Catalyst for Oxygen Reduction. ACS Nano 2015, 9, 4193–4199. [Google Scholar] [CrossRef] [PubMed]
  35. Pereira de Sousa, I.; Buttenhauser, K.; Suchaoin, W.; Partenhauser, A.; Perrone, M.; Matuszczak, B.; Bernkop-Schnürch, A. Thiolated graphene oxide as promising mucoadhesive carrier for hydrophobic drugs. Int. J. Pharm. 2016, 509, 360–367. [Google Scholar] [CrossRef] [PubMed]
  36. Shahzad, F.; Zaidi, S.A.; Koo, C.M. Highly sensitive electrochemical sensor based on environmentally friendly biomass-derived sulfur-doped graphene for cancer biomarker detection. Sens. Actuators B Chem. 2017, 241, 716–724. [Google Scholar] [CrossRef]
  37. Häkkinen, H. The gold–sulfur interface at the nanoscale. Nat. Chem. 2012, 4, 443–455. [Google Scholar] [CrossRef]
  38. Ryoo, S.-R.; Kim, Y.-K.; Kim, M.-H.; Min, D.-H. Behaviors of NIH-3T3 Fibroblasts on Graphene/Carbon Nanotubes: Proliferation, Focal Adhesion, and Gene Transfection Studies. ACS Nano 2010, 4, 6587–6598. [Google Scholar] [CrossRef]
  39. Zhi, X.; Fang, H.; Bao, C.; Shen, G.; Zhang, J.; Wang, K.; Guo, S.; Wan, T.; Cui, D. The immunotoxicity of graphene oxides and the effect of PVP-coating. Biomaterials 2013, 34, 5254–5261. [Google Scholar] [CrossRef]
  40. Liao, K.-H.; Lin, Y.-S.; Macosko, C.W.; Haynes, C.L. Cytotoxicity of Graphene Oxide and Graphene in Human Erythrocytes and Skin Fibroblasts. ACS Appl. Mater. Interfaces 2011, 3, 2607–2615. [Google Scholar] [CrossRef]
  41. Akhavan, O.; Ghaderi, E. Toxicity of Graphene and Graphene Oxide Nanowalls Against Bacteria. ACS Nano 2010, 4, 5731–5736. [Google Scholar] [CrossRef]
  42. Chatterjee, N.; Eom, H.-J.; Choi, J. A systems toxicology approach to the surface functionality control of graphene–cell interactions. Biomaterials 2014, 35, 1109–1127. [Google Scholar] [CrossRef]
  43. Vallabani, N.V.S.; Mittal, S.; Shukla, R.; Pandey, A.; Dhakate, S.; Pasricha, R.; Dhawan, A. Toxicity of Graphene in Normal Human Lung Cells (BEAS-2B). J. Biomed. Nanotechnol. 2011, 7, 106–107. [Google Scholar] [CrossRef] [PubMed]
  44. Park, S.; Mohanty, N.; Suk, J.W.; Nagaraja, A.; An, J.; Piner, R.D.; Cai, W.; Dreyer, D.R.; Berry, V.; Ruoff, R.S. Biocompatible, Robust Free-Standing Paper Composed of a TWEEN/Graphene Composite. Adv. Mater. 2010, 22, 1736–1740. [Google Scholar] [CrossRef] [PubMed]
  45. Singh, S.K.; Singh, M.K.; Kulkarni, P.P.; Sonkar, V.K.; Grácio, J.J.A.; Dash, D. Amine-Modified Graphene: Thrombo-Protective Safer Alternative to Graphene Oxide for Biomedical Applications. ACS Nano 2012, 6, 2731–2740. [Google Scholar] [CrossRef] [PubMed]
  46. Hu, W.; Peng, C.; Lv, M.; Li, X.; Zhang, Y.; Chen, N.; Fan, C.; Huang, Q. Protein Corona-Mediated Mitigation of Cytotoxicity of Graphene Oxide. ACS Nano 2011, 5, 3693–3700. [Google Scholar] [CrossRef]
  47. Seabra, A.B.; Paula, A.J.; de Lima, R.; Alves, O.L.; Durán, N. Nanotoxicity of Graphene and Graphene Oxide. Chem. Res. Toxicol. 2014, 27, 159–168. [Google Scholar] [CrossRef]
  48. Wang, A.; Pu, K.; Dong, B.; Liu, Y.; Zhang, L.; Zhang, Z.; Duan, W.; Zhu, Y. Role of surface charge and oxidative stress in cytotoxicity and genotoxicity of graphene oxide towards human lung fibroblast cells. J. Appl. Toxicol. 2013, 33, 1156–1164. [Google Scholar] [CrossRef]
  49. Das, S.; Singh, S.; Singh, V.; Joung, D.; Dowding, J.M.; Reid, D.; Anderson, J.; Zhai, L.; Khondaker, S.I.; Self, W.T.; et al. Oxygenated Functional Group Density on Graphene Oxide: Its Effect on Cell Toxicity. Part. Part. Syst. Charact. 2013, 30, 148–157. [Google Scholar] [CrossRef]
  50. Xu, M.; Zhu, J.; Wang, F.; Xiong, Y.; Wu, Y.; Wang, Q.; Weng, J.; Zhang, Z.; Chen, W.; Liu, S. Improved In Vitro and In Vivo Biocompatibility of Graphene Oxide through Surface Modification: Poly(Acrylic Acid)-Functionalization is Superior to PEGylation. ACS Nano 2016, 10, 3267–3281. [Google Scholar] [CrossRef]
  51. Aliyev, E.; Filiz, V.; Khan, M.M.; Lee, Y.J.; Abetz, C.; Abetz, V. Structural Characterization of Graphene Oxide: Surface Functional Groups and Fractionated Oxidative Debris. Nanomaterials 2019, 9, 1180. [Google Scholar] [CrossRef] [Green Version]
  52. Qian, X.; Peng, X.-H.; Ansari, D.O.; Yin-Goen, Q.; Chen, G.Z.; Shin, D.M.; Yang, L.; Young, A.N.; Wang, M.D.; Nie, S. In vivo tumor targeting and spectroscopic detection with surface-enhanced Raman nanoparticle tags. Nat. Biotechnol. 2007, 26, 83–90. [Google Scholar] [CrossRef]
  53. Chen, J.; Saeki, F.; Wiley, B.J.; Cang, H.; Cobb, M.J.; Li, Z.-Y.; Au, L.; Zhang, H.; Kimmey, M.B.; Li, X.; et al. Gold Nanocages: Bioconjugation and Their Potential Use as Optical Imaging Contrast Agents. Nano Lett. 2005, 5, 473–477. [Google Scholar] [CrossRef] [PubMed]
  54. Hussein, E.; Zagho, M.; Nasrallah, G.; Elzatahry, A. Recent advances in functional nanostructures as cancer photothermal therapy. Int. J. Nanomed. 2018, 13, 2897–2906. [Google Scholar] [CrossRef] [PubMed] [Green Version]
  55. Verde, V.; Longo, A.; Cucci, L.M.; Sanfilippo, V.; Magrì, A.; Satriano, C.; Anfuso, C.D.; Lupo, G.; La Mendola, D. Anti-Angiogenic and Anti-Proliferative Graphene Oxide Nanosheets for Tumor Cell Therapy. Int. J. Mol. Sci. 2020, 21, 5571. [Google Scholar] [CrossRef] [PubMed]
  56. Di Pietro, P.; Caporarello, N.; Anfuso, C.D.; Lupo, G.; Magrì, A.; La Mendola, D.; Satriano, C. Immobilization of Neurotrophin Peptides on Gold Nanoparticles by Direct and Lipid-Mediated Interaction: A New Multipotential Therapeutic Nanoplatform for CNS Disorders. ACS Omega 2017, 2, 4071–4079. [Google Scholar] [CrossRef] [Green Version]
  57. Cucci, L.M.; Munzone, A.; Naletova, I.; Magrì, A.; La Mendola, D.; Satriano, C. Gold nanoparticles functionalized with angiogenin-mimicking peptides modulate cell membrane interactions. Biointerphases 2018, 13. [Google Scholar] [CrossRef]
  58. Naletova, I.; Cucci, L.M.; D’Angeli, F.; Anfuso, C.D.; Magrì, A.; La Mendola, D.; Lupo, G.; Satriano, C. A Tunable Nanoplatform of Nanogold Functionalised with Angiogenin Peptides for Anti-Angiogenic Therapy of Brain Tumours. Cancers 2019, 11, 1322. [Google Scholar] [CrossRef] [Green Version]
  59. Khlebtsov, N.; Dykman, L. Biodistribution and toxicity of engineered gold nanoparticles: A review of in vitro and in vivo studies. Chem. Soc. Rev. 2011, 40, 1647–1671. [Google Scholar] [CrossRef]
  60. Khlebtsov, N.G.; Trachuk, L.A.; Mel’nikov, A.G. The effect of the size, shape, and structure of metal nanoparticles on the dependence of their optical properties on the refractive index of a disperse medium. Opt. Spectrosc. 2005, 98, 77–83. [Google Scholar] [CrossRef]
  61. Murphy, C.J.; Jana, N.R. Controlling the aspect ratio of inorganic nanorods and nanowires. Adv. Mater. 2002, 14, 80–82. [Google Scholar] [CrossRef]
  62. Zhou, J.; Ralston, J.; Sedev, R.; Beattie, D.A. Functionalized gold nanoparticles: Synthesis, structure and colloid stability. J. Colloid Interface Sci. 2009, 331, 251–262. [Google Scholar] [CrossRef]
  63. Pingarrón, J.M.; Yáñez-Sedeño, P.; González-Cortés, A. Gold nanoparticle-based electrochemical biosensors. Electrochim. Acta 2008, 53, 5848–5866. [Google Scholar] [CrossRef]
  64. Pan, Y.; Neuss, S.; Leifert, A.; Fischler, M.; Wen, F.; Simon, U.; Schmid, G.; Brandau, W.; Jahnen-Dechent, W. Size-Dependent Cytotoxicity of Gold Nanoparticles. Small 2007, 3, 1941–1949. [Google Scholar] [CrossRef]
  65. Hutter, E.; Fendler, J.H. Exploitation of Localized Surface Plasmon Resonance. Adv. Mater. 2004, 16, 1685–1706. [Google Scholar] [CrossRef]
  66. Xu, C.; Wang, X.; Zhu, J. Graphene−Metal Particle Nanocomposites. J. Phys. Chem. C 2008, 112, 19841–19845. [Google Scholar] [CrossRef]
  67. Pan, H.; Low, S.; Weerasuriya, N.; Wang, B.; Shon, Y.-S. Morphological transformation of gold nanoparticles on graphene oxide: Effects of capping ligands and surface interactions. Nano Converg. 2019, 6. [Google Scholar] [CrossRef] [PubMed]
  68. Kadiyala, N.K.; Mandal, B.K.; Ranjan, S.; Dasgupta, N. Bioinspired gold nanoparticles decorated reduced graphene oxide nanocomposite using Syzygium cumini seed extract: Evaluation of its biological applications. Mater. Sci. Eng. C 2018, 93, 191–205. [Google Scholar] [CrossRef]
  69. Sun, B.; Wu, J.; Cui, S.; Zhu, H.; An, W.; Fu, Q.; Shao, C.; Yao, A.; Chen, B.; Shi, D. In situ synthesis of graphene oxide/gold nanorods theranostic hybrids for efficient tumor computed tomography imaging and photothermal therapy. Nano Res. 2016, 10, 37–48. [Google Scholar] [CrossRef]
  70. González-Domínguez, J.M.; Colusso, A.; Litti, L.; Ostric, A.; Meneghetti, M.; Da Ros, T. Thiolated Graphene Oxide Nanoribbons as Templates for Anchoring Gold Nanoparticles: Two-Dimensional Nanostructures for SERS. ChemPlusChem 2019, 84, 862–871. [Google Scholar] [CrossRef]
  71. Thomas, H.R.; Day, S.P.; Woodruff, W.E.; Vallés, C.; Young, R.J.; Kinloch, I.A.; Morley, G.W.; Hanna, J.V.; Wilson, N.R.; Rourke, J.P. Deoxygenation of Graphene Oxide: Reduction or Cleaning? Chem. Mater. 2013, 25, 3580–3588. [Google Scholar] [CrossRef]
  72. Consiglio, G.; Di Pietro, P.; D’Urso, L.; Forte, G.; Grasso, G.; Sgarlata, C.; Cossement, D.; Snyders, R.; Satriano, C. Surface tailoring of polyacrylate-grafted graphene oxide for controlled interactions at the biointerface. J. Colloid Interface Sci. 2017, 506, 532–542. [Google Scholar] [CrossRef]
  73. Turkevich, J.; Stevenson, P.C.; Hillier, J. A study of the nucleation and growth processes in the synthesis of colloidal gold. Discuss. Faraday Soc. 1951, 11. [Google Scholar] [CrossRef]
  74. He, Y.Q.; Liu, S.P.; Kong, L.; Liu, Z.F. A study on the sizes and concentrations of gold nanoparticles by spectra of absorption, resonance Rayleigh scattering and resonance non-linear scattering. Spectrochim. Acta Part A Mol. Biomol. Spectrosc. 2005, 61, 2861–2866. [Google Scholar] [CrossRef]
  75. Navarro, J.R.G.; Werts, M.H.V. Resonant light scattering spectroscopy of gold, silver and gold–silver alloy nanoparticles and optical detection in microfluidic channels. Analyst 2013, 138, 583–592. [Google Scholar] [CrossRef]
  76. Zhang, H.; Hussain, I.; Brust, M.; Cooper, A.I. Emulsion-Templated Gold Beads Using Gold Nanoparticles as Building Blocks. Adv. Mater. 2004, 16, 27–30. [Google Scholar] [CrossRef]
  77. Nikoobakht, B.; El-Sayed, M.A. Preparation and Growth Mechanism of Gold Nanorods (NRs) Using Seed-Mediated Growth Method. Chem. Mater. 2003, 15, 1957–1962. [Google Scholar] [CrossRef]
  78. Orendorff, C.J.; Murphy, C.J. Quantitation of Metal Content in the Silver-Assisted Growth of Gold Nanorods. J. Phys. Chem. B 2006, 110, 3990–3994. [Google Scholar] [CrossRef]
  79. Lee, K.-S.; El-Sayed, M.A. Dependence of the Enhanced Optical Scattering Efficiency Relative to That of Absorption for Gold Metal Nanorods on Aspect Ratio, Size, End-Cap Shape, and Medium Refractive Index. J. Phys. Chem. B 2005, 109, 20331–20338. [Google Scholar] [CrossRef]
  80. He, H.; Klinowski, J.; Forster, M.; Lerf, A. A new structural model for graphite oxide. Chem. Phys. Lett. 1998, 287, 53–56. [Google Scholar] [CrossRef]
  81. Zhao, Y.; Truhlar, D.G. A new local density functional for main-group thermochemistry, transition metal bonding, thermochemical kinetics, and noncovalent interactions. J. Chem. Phys. 2006, 125. [Google Scholar] [CrossRef] [Green Version]
  82. Stewart, J.J.P. Optimization of parameters for semiempirical methods V: Modification of NDDO approximations and application to 70 elements. J. Mol. Model. 2007, 13, 1173–1213. [Google Scholar] [CrossRef] [Green Version]
  83. Naletova, I.; Satriano, C.; Curci, A.; Margiotta, N.; Natile, G.; Arena, G.; La Mendola, D.; Nicoletti, V.G.; Rizzarelli, E. Cytotoxic phenanthroline derivatives alter metallostasis and redox homeostasis in neuroblastoma cells. Oncotarget 2018, 9, 36289–36316. [Google Scholar] [CrossRef] [PubMed] [Green Version]
  84. Fan, Z.-J.; Kai, W.; Yan, J.; Wei, T.; Zhi, L.-J.; Feng, J.; Ren, Y.-m.; Song, L.-P.; Wei, F. Facile Synthesis of Graphene Nanosheets via Fe Reduction of Exfoliated Graphite Oxide. ACS Nano 2010, 5, 191–198. [Google Scholar] [CrossRef] [PubMed]
  85. Lai, Q.; Zhu, S.; Luo, X.; Zou, M.; Huang, S. Ultraviolet-visible spectroscopy of graphene oxides. AIP Adv. 2012, 2. [Google Scholar] [CrossRef]
  86. Wang, Y.; Shi, Z.; Yin, J. Facile Synthesis of Soluble Graphene via a Green Reduction of Graphene Oxide in Tea Solution and Its Biocomposites. ACS Appl. Mater. Interfaces 2011, 3, 1127–1133. [Google Scholar] [CrossRef]
  87. Chua, C.K.; Pumera, M. Renewal of sp2 bonds in graphene oxides via dehydrobromination. J. Mater. Chem. 2012, 22. [Google Scholar] [CrossRef]
  88. Guo, Z.; Wang, S.; Wang, G.; Niu, Z.; Yang, J.; Wu, W. Effect of oxidation debris on spectroscopic and macroscopic properties of graphene oxide. Carbon 2014, 76, 203–211. [Google Scholar] [CrossRef]
  89. Thomas, H.R.; Marsden, A.J.; Walker, M.; Wilson, N.R.; Rourke, J.P. Sulfur-Functionalized Graphene Oxide by Epoxide Ring-Opening. Angew. Chem. Int. Ed. 2014, 53, 7613–7618. [Google Scholar] [CrossRef]
  90. Mei, X.; Ouyang, J. Ultrasonication-assisted ultrafast reduction of graphene oxide by zinc powder at room temperature. Carbon 2011, 49, 5389–5397. [Google Scholar] [CrossRef]
  91. Frogley, M.D.; Wang, C.; Cinque, G.; Barber, A.H. Polarised infrared microspectroscopy of edge-oriented graphene oxide papers. Vib. Spectrosc. 2014, 75, 178–183. [Google Scholar] [CrossRef] [Green Version]
  92. Rao, C.N.R.; Venkataraghavan, R.; Kasturi, T.R. Contribution to the Infrared Spectra of Organosulphur Compounds. Can. J. Chem. 1964, 42, 36–42. [Google Scholar] [CrossRef]
  93. Amendola, V.; Meneghetti, M.; Stener, M.; Guo, Y.; Chen, S.; Crespo, P.; García, M.A.; Hernando, A.; Pengo, P.; Pasquato, L. Physico-Chemical Characteristics of Gold Nanoparticles. In Comprehensive Analytical Chemistry; Elsevier BV: Amsterdam, The Netherlands, 2014; Volume 66, pp. 81–152. [Google Scholar]
  94. Hu, C.; Rong, J.; Cui, J.; Yang, Y.; Yang, L.; Wang, Y.; Liu, Y. Fabrication of a graphene oxide–gold nanorod hybrid material by electrostatic self-assembly for surface-enhanced Raman scattering. Carbon 2013, 51, 255–264. [Google Scholar] [CrossRef]
  95. Wulandari, P.; Nagahiro, T.; Fukada, N.; Kimura, Y.; Niwano, M.; Tamada, K. Characterization of citrates on gold and silver nanoparticles. J. Colloid Interface Sci. 2015, 438, 244–248. [Google Scholar] [CrossRef] [PubMed]
  96. Strathmann, T.J.; Myneni, S.C.B. Speciation of aqueous Ni(II)-carboxylate and Ni(II)-fulvic acid solutions: Combined ATR-FTIR and XAFS analysis. Geochim. Cosmochim. Acta 2004, 68, 3441–3458. [Google Scholar] [CrossRef]
  97. Tyagi, H.; Kushwaha, A.; Kumar, A.; Aslam, M. A Facile pH Controlled Citrate-Based Reduction Method for Gold Nanoparticle Synthesis at Room Temperature. Nanoscale Res. Lett. 2016, 11. [Google Scholar] [CrossRef] [PubMed] [Green Version]
  98. Khalilzadeh, B.; Shadjou, N.; Afsharan, H.; Eskandani, M.; Nozad Charoudeh, H.; Rashidi, M.-R. Reduced graphene oxide decorated with gold nanoparticle as signal amplification element on ultra-sensitive electrochemiluminescence determination of caspase-3 activity and apoptosis using peptide based biosensor. Bioimpacts 2016, 6, 135–147. [Google Scholar] [CrossRef] [PubMed] [Green Version]
  99. Sui, Z.; Chen, X.; Wang, L.; Chai, Y.; Yang, C.; Zhao, J. An Improved Approach for Synthesis of Positively Charged Silver Nanoparticles. Chem. Lett. 2005, 34, 100–101. [Google Scholar] [CrossRef]
  100. Viana, R.B.; da Silva, A.B.F.; Pimentel, A.S. Infrared Spectroscopy of Anionic, Cationic, and Zwitterionic Surfactants. Adv. Phys. Chem. 2012, 2012, 1–14. [Google Scholar] [CrossRef] [Green Version]
  101. Su, G.; Yang, C.; Zhu, J.-J. Fabrication of Gold Nanorods with Tunable Longitudinal Surface Plasmon Resonance Peaks by Reductive Dopamine. Langmuir 2015, 31, 817–823. [Google Scholar] [CrossRef]
  102. Ferrari, A.C.; Basko, D.M. Raman spectroscopy as a versatile tool for studying the properties of graphene. Nat. Nanotechnol. 2013, 8, 235–246. [Google Scholar] [CrossRef] [Green Version]
  103. Lv, M.; Zhang, Y.; Liang, L.; Wei, M.; Hu, W.; Li, X.; Huang, Q. Effect of graphene oxide on undifferentiated and retinoic acid-differentiated SH-SY5Y cells line. Nanoscale 2012, 4. [Google Scholar] [CrossRef]
  104. Shukla, R.; Bansal, V.; Chaudhary, M.; Basu, A.; Bhonde, R.R.; Sastry, M. Biocompatibility of Gold Nanoparticles and Their Endocytotic Fate Inside the Cellular Compartment: A Microscopic Overview. Langmuir 2005, 21, 10644–10654. [Google Scholar] [CrossRef] [PubMed]
  105. Sau, T.K.; Murphy, C.J. Seeded High Yield Synthesis of Short Au Nanorods in Aqueous Solution. Langmuir 2004, 20, 6414–6420. [Google Scholar] [CrossRef] [PubMed]
  106. Aillon, K.L.; Xie, Y.; El-Gendy, N.; Berkland, C.J.; Forrest, M.L. Effects of nanomaterial physicochemical properties on in vivo toxicity. Adv. Drug Deliv. Rev. 2009, 61, 457–466. [Google Scholar] [CrossRef] [PubMed] [Green Version]
  107. Nikoobakht, B.; El-Sayed, M.A. Evidence for Bilayer Assembly of Cationic Surfactants on the Surface of Gold Nanorods. Langmuir 2001, 17, 6368–6374. [Google Scholar] [CrossRef]
  108. Murphy, C.J.; Sau, T.K.; Gole, A.; Orendorff, C.J. Surfactant-Directed Synthesis and Optical Properties of One-Dimensional Plasmonic Metallic Nanostructures. MRS Bull. 2011, 30, 349–355. [Google Scholar] [CrossRef]
  109. Wang, L.; Jiang, X.; Ji, Y.; Bai, R.; Zhao, Y.; Wu, X.; Chen, C. Surface chemistry of gold nanorods: Origin of cell membrane damage and cytotoxicity. Nanoscale 2013, 5. [Google Scholar] [CrossRef]
  110. Ito, E.; Yip, K.W.; Katz, D.; Fonseca, S.B.; Hedley, D.W.; Chow, S.; Xu, G.W.; Wood, T.E.; Bastianutto, C.; Schimmer, A.D.; et al. Potential Use of Cetrimonium Bromide as an Apoptosis-Promoting Anticancer Agent for Head and Neck Cancer. Mol. Pharmacol. 2009, 76, 969–983. [Google Scholar] [CrossRef] [Green Version]
  111. Connor, E.E.; Mwamuka, J.; Gole, A.; Murphy, C.J.; Wyatt, M.D. Gold Nanoparticles Are Taken Up by Human Cells but Do Not Cause Acute Cytotoxicity. Small 2005, 1, 325–327. [Google Scholar] [CrossRef]
Figure 1. (a) Experimental UV-VIS spectra normalized to the π→π* absorbance peak of as-received graphene oxide (arGO, in water, solid line), base-washed GO (bwGO, in water, dashed line), and thiolated reduced GO (rGOSH, in dimethyl sulfoxide DMSO, dotted line). (b) Theoretical UV-VIS spectra of GO and rGOSH from semi-empirical computational calculations.
Applsci 10 05529 g001
Figure 2. TGA curves recorded under nitrogen flow for the lyophilized powers of as-received GO (solid line), base-washed GO (dashed line), and thiolated reduced GO (dotted line).
Applsci 10 05529 g002
Figure 3. Infrared spectra of rGOSH in the comparison with GO: (a) Experimental attenuated total reflection-FTIR (ATR-FTIR) spectra of pristine GO, base-washed GO, and thiolated reduced GO; (b) calculated IR spectra of GO and thiolated reduced GO.
Applsci 10 05529 g003
Figure 4. UV-VIS spectra for as-prepared samples of: (a) citrate-capped gold nanospheres (AuNS, wine line) and hybrids with base-washed GO (bwGO@AuNS, red line) or thiolated reduced GO (rGOSH@AuNS, orange line); (b) cetyl trimethylammonium bromide-capped gold nanorods (AuNR, cyan line) and bwGO@AuNR (light blue line) or rGOSH@AuNR (navy line) hybrids.
Applsci 10 05529 g004
Figure 5. UV-VIS spectra of the different nanocomposite dispersions, before and after the two centrifugation steps for (a) AuNS (wine), (b) bwGO@AuNS (red), (c) rGOSH@AuNS (orange), (d) AuNR (cyan), (e) bwGO@AuNR (light blue), (f) rGOSH@AuNR (navy).
Applsci 10 05529 g005
Figure 6. AFM micrographs of amplitude (top panels), height (middle panels, z scale = 15 nm), and section analysis curves (bottom panels) of: (a) AuNS, (b) bwGO@AuNS, (c) rGOSH@AuNS, (d) AuNR, (e) bwGO@AuNR, (f) rGOSH@AuNR. Arrows point to surfactant residues adsorbed on the mica substrates.
Applsci 10 05529 g006
Figure 7. Infrared spectra of rGOSH in the comparison with GO: (a) Experimental ATR-FTIR spectra of citrate-capped AuNS and hybrid GO@AuNS samples in the comparison with trisodium citrate; (b) experimental and calculated IR spectra of AuNR and GO@AuNR hybrids in the comparison with cetyl trimethylammonium bromide (CTAB) surfactant.
Applsci 10 05529 g007
Figure 8. Cell viability of SH-SY5Y cells after 24-h incubation with the dispersion of gold nanospheres (a) or nanorods (b) as well as the corresponding nanocomposite with bwGO and rGOSH. The (*) p < 0.05, (**) p < 0.01 (***) p < 0.001, vs. untreated (CTRL), (#) p < 0.05, (##) p < 0.01, (###) p < 0.001, (####) p < 0.0001 vs. bwGO and rGOSH (student’s t-test).
Applsci 10 05529 g008
Table 1. Calculated molar extinction coefficients from the experimental UV-visible spectra of as-received GO (140 × 10−3 mg/mL in water), base-washed GO (20 × 10−3 mg/mL in water), and thiolated reduced GO (10 × 10−3 mg/mL in DMSO) and from the computational analysis.
ExperimentalTheoretical
Sampleεpeak (π→π*)
(mg−1 mL cm−1)
εshoulder (n→π*)
(mg−1 mL cm−1)
εpeak (π→π*)
(mg−1 mL cm−1)
εshoulder (n→π*)
(mg−1 mL cm−1)
arGO71.737.0--
bwGO24.518.27.15.1
rGO-SH47.0-6.7-
Table 2. Characteristic weight loss (%) as function of temperature steps calculated from TGA analyses for as-received GO, base-washed GO, and thiolated reduced GO.
Step 1Step 2Step 3
Sample(Δ °C)Weight Loss (%)(Δ °C)Weight Loss (%)(Δ °C)Weight Loss (%)Residue
at 800 °C (%)
arGO50–1104.2111–30044.5360–45010.734.0
bwGO50–1107.6120–30022.8460–61011.640.6
rGO-SH50–1102.9150–3407.6430–80051.034.5
Table 3. Optical parameters of wavelength at the maximum of absorbance (λmax) full width at half maximum (FWHM), optical diameter (D) and aspect ratio (R) calculated from the surface plasmon (SP) bands of AuNS, AuNR, and their hybrids with bwGO and rGOSH, according to Equations (1)–(5) in Materials and Methods section.
Sampleλmax (nm)FWHM (nm)D (nm)/R
AuNS5255327
bwGO@AuNS5306341
rGOSH@AuNS5306241
AuNR716111 3.12
bwGO@AuNR68986 2.83
rGOSH@AuNR687- 2.81
Table 4. Average height (z, in nm) and aspect ratio (r) values calculated from the atomic force microscopy (AFM) micrographs images recorded in AC mode in air for the different samples.
Samplez (nm)r
AuNS14 ± 20.75 ± 0.02
bwGO@AuNS12 ± 20.98 ± 0.02
rGOSH@AuNS15 ± 20.88 ± 0.02
AuNR6 ± 2
6 ± 2
0.60 ± 0.02
0.88 ± 0.02
bwGO@AuNR8 ± 2
7 ± 2
0.60 ± 0.02
0.84 ± 0.02
rGOSH@AuNR7 ± 20.98 ± 0.02

