Abstract
Atomic force microscopy is employed to study the influence of the motion of a glycerol solution through a coiled (spiral-wound) polymeric communication pipe on the aggregation state of a protein, with the example of a horseradish peroxidase (HRP) enzyme. The measuring cell with the buffered solution of the protein was placed within the experimental setup over the pipe coil, through which glycerol was pumped. It is demonstrated that, in such a system, the flow of a non-aqueous liquid (glycerol) leads to a change in the physicochemical properties of a protein, whose solution was incubated in the measuring cell placed over the coil. Namely, changes in both the adsorbability onto mica and the aggregation state of the model HRP protein were observed. As glycerol-containing liquids are commonly used in biosensor operations, the results reported herein can be useful to the development of biosensor systems, in which polymeric communications are employed in sample delivery and thermal stabilization systems. The data obtained herein can also be of use for the development of specified hydrodynamic models.
1. Introduction
In biosensors and bioreactors, flow-based systems are commonly employed for the delivery of reagents [1,2], as well as for mass [3] and heat exchange [4]. For these purposes, aqueous or non-aqueous media can be employed, depending on the process’s design. In connection with this, in a number of papers, an occurrence of a triboelectric generation of charge upon the motion of liquid media along solid surfaces was demonstrated [5,6,7,8,9,10,11,12]. Such a triboelectric effect is known to occur upon the motion of both water and aqueous solutions [5,6,7,8,9,10,11,12], as well as of various non-aqueous liquids [13,14], including glycerol [14].
A triboelectric effect consists of a generation of electric charges in a material during friction. This generation represents contact electricity (electrization), where one material becomes electrically charged after its frictional contact with another material. Upon the frictional contact, a charge redistribution occurs. The mechanism of the appearance of triboelectric charges was explained by Helmholtz [15]. Namely, it is supposed that a charge transfer from one object to another object occurs upon their contact. This way, an electric field in an interface appears. This field is called a double layer, and the voltage within this layer is called contact voltage. Friction upon the electrization favors an increase in the area of the double layers. A triboelectric effect can occur upon friction between the following solid and/or liquid media: dielectric/dielectric; semiconductor/semiconductor; metal/metal (of different densities); metal/dielectric; liquid dielectric/liquid dielectric; liquid dielectric/metal; and liquid dielectric/solid dielectric. An example illustrating the latter case is the occurrence of the triboelectric effect upon the motion of water through a polymeric communication [5,16]; the motion of glycerol along a dielectric surface is also the same case [14].
As mentioned above, the motion of water along polymeric surfaces leads to a triboelectric generation of charge. The latter has been shown to influence the properties of biological macromolecules. Namely, the motion of water through biosensor communication pipes [16] and the flow of water through injectors into the biosensor measuring cell [17] were reported to influence the physicochemical properties of proteins. So, it was demonstrated that an electric charge is generated upon the injection of a protein solution through a polypropylene tip [17]. Such a generation of charge leads to an increase in the specific charge per protein molecule while decreasing its concentration, which correlates with a decrease in the protein detection limit, achievable with the biosensor system, down to 10−17 M [17]. Moreover, in our recent study, the flow of water through coiled communication pipes, located near the measuring cell containing a solution of horseradish peroxidase (HRP) protein, was shown to have an effect on the protein’s aggregation state [16]. Such a phenomenon was ascribed to the influence of an electromagnetic field induced upon the motion of water through the coiled communication pipe, owing to the triboelectric generation of charge. Such a generation of charge upon the flow of water through injectors was discussed in several studies [5,9,18].
Similar to water, glycerol represents an important substance widely used in biochemical studies of biological objects. As regards glycerol, its importance to biochemical research is determined by two factors. The first one is that glycerol is widely employed in studies of solutions of biological objects. For instance, glycerol was used to optimize the viscosity of solutions and the diffusivity of reagents in biosensors [19], as an emollient [20], and as a surfactant for the treatment of a sensor chip surface [21,22]. On the other hand, as was noted above, glycerol and glycerol-based solutions are commonly used in biosensor experiments involving proteins [2,19,22]. In addition, glycerol-containing solutions are used in studies of enzymes; namely, enzymes are dissolved in glycerol-containing solutions to preserve their native structure [23,24,25,26]. In the course of operations with such biological objects, the glycerol-containing solutions are aspirated and injected into a measuring cell using injectors. With respect to bioreactors and biosensors, it has to be noted that injector nozzles, communication pipes, and thermal stabilization tubing pipes in flow-based systems are often fabricated not only from metal, but also from various polymeric materials [1,2]. In this way, polydimethyl siloxane [27,28,29,30], polytetrafluoroethylene (Teflon [31]), polymethyl metacrylate [32], and nylon [33] represent typical polymers used for the fabrication of biosensor fluidic sections. Upon the motion of glycerol-containing solutions through polymeric fluidic lines, a charge is expected to be generated at the expense of the above-mentioned triboelectric effect, similar to the case with aqueous solutions.
The second factor is that glycerol-containing liquids can be employed as heat-transfer agents for thermal stabilization of biosensor measurement systems [34]. This is particularly important in the instrumentation of systems operating in extreme field conditions in a wide range of temperatures (from negative to positive ones), depending only on the glycerol content. This is possible due to the unique properties of glycerol, since the freezing point of such a heat-transfer fluid can be varied in a very broad range, from −43.5 °C (for 66.7% w/w glycerol solution [35]) to 17 °C (100% glycerol) [36]. As was mentioned above, the flowing of glycerol-containing solutions through the pipes of thermal stabilization systems is expected to cause a triboelectric effect, i.e., a generation of an electric charge. The latter, in its turn, should induce an electric field that can extend well beyond these communications, influencing protein solutions in biosensor systems or bioreactors.
The present study is aimed at determining the influence of the flow of glycerol through a coiled polymeric pipe on the physicochemical properties of the HRP solution in the measuring cell, which is located in the vicinity of the coiled pipe.
The HRP enzyme was employed as a model object, since this protein was comprehensively characterized in the literature [37,38,39,40,41,42,43,44,45,46,47]. The molecular weight of HRP, which represents a heme-containing enzyme glycoprotein [37,38], is known to be 40 to 44 kDa [38,39]. The HRP molecule contains 18–27% carbohydrate chains, stabilizing its structure [38,40,41]. It is known that many enzymes, including peroxidase [42], form aggregates. Similar to our previous studies [16,48], atomic force microscopy (AFM) has been employed for the visualization of the effect of an electromagnetic field on proteins with the example of HRP macromolecules, which were adsorbed from the analyzed solution onto the atomically smooth surface of a mica substrate. AFM allows one to register a signal from even single-surface-adsorbed macromolecules, and this extremely high sensitivity has allowed us to detect minor changes in the properties of HRP macromolecules. In the present study, using AFM, it was found that the flow of glycerol (similar to water flow [16]) through the flow-based system influences the physicochemical properties of HRP macromolecules; namely, it induces changes in the HRP aggregation state and in its adsorbability onto the mica surface. The data obtained herein can be used in the development of biosensor systems intended for the diagnosis of socially relevant diseases (such as oncological and infectious ones). Our results can also be useful for the development of biosensors operating in a broad temperature range for the registration of changes in physiochemical properties of target proteins associated with these diseases. The effects observed in our experiments can also be taken into account for the development of models of fluid dynamics.
2. Materials and Methods
Reagents: Peroxidase from horseradish (HRP-C; Cat.# P6782) was obtained from Sigma (St. Louis, MO, USA). In the experiments, we used a 0.1 μM solution of HRP in a 2 mM PBSD buffer (Pierce, DC, USA), prepared by sequential ten-fold dilution of a 10−5 M stock solution. The latter was prepared by dissolving 0.15 mg of an initial HRP preparation in 0.375 mL of the same buffer. At each dilution step, the protein solution was incubated in a shaker at 23 °C and 600 rpm for 30 min. In each experiment, 1 mL of 0.1 μM HRP solution was used.
Ultrapure water (with a resistivity of 18.2 MΩ × cm), used throughout the study, was obtained with a Simplicity UV system (Millipore, Molsheim, France).
Glycerol (used as a working liquid to be pumped through the flow section of the experimental setup) was purchased from Glaconchemic GmbH (Germany).
2.1. Experimental Setup
The experimental setup is schematically shown in Figure 1. The setup included a model of a flow section of a biosensor with a coiled communication pipe and a measuring cell.
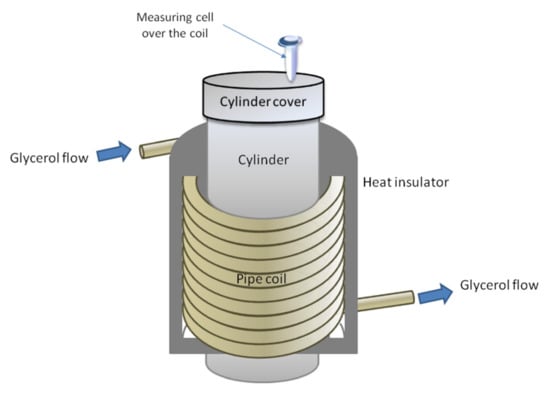
Figure 1.
Experimental setup for studying the influence of glycerol flow through a coiled communication pipe on the physicochemical properties of horseradish peroxidase (HRP). The measuring cell was placed over the coil.
A KAN-therm PE-RT/AL/PE-RT pipe (KAN-therm, Poland) fabricated from armed polyethylene was used as a communication pipe. This pipe was fabricated from a more durable material than silicone (used in our previous study [16]) and hence could be successfully used in experiments with warm glycerol, as glycerol is a much more viscous liquid. The pipe coil’s dimensions were as follows: a coil diameter of 25 cm, a coil height of 40 cm, and an inner diameter of the pipe of 1.5 cm. To provide sufficient intensity of the glycerol flow through the pipe, the glycerol in the flow-based system was warmed to 65 °C to provide better flowability [49]. At the same time, the coiled pipe was covered with a thermal shield (a layer of metallized, foamed polypropylene) to avoid undesired heating of the measuring cell with the test protein solution, whose temperature remained unchanged and was maintained at a level of 23 °C. To supply glycerol into the flow-based system, a BE-G 20 HP0.8 gear pump was employed. The volumetric flow rate of glycerol was 8.7 L/min.
In control experiments, the cell with the HRP solution was placed far from the experimental setup (at a distance of 10 m) for 40 min (analogously to [16]). After that, the measurements were performed analogously to the working experiments.
2.2. AFM Sensor Measurements
The AFM sensing experiments were carried out according to a previously developed technique, reported in our recent papers [16,48]. Briefly, to visualize HRP macromolecules, they were deposited from the test protein solution onto the freshly cleaved bare muscovite mica sheets (SPI, Inc.; West Chester, PA, USA) using the direct surface adsorption method [50]. The mica sheet was immersed in 1 mL of 0.1 μM HRP solution in 2 mM of Dulbecco’s modified phosphate-buffered saline (PBSD buffer), which was incubated in the cell either over the coil or far from the experimental setup (the latter corresponds to control experiments). A detailed description of the technique employed, the AFM signal and data processing, and the acquisition of AFM images can be found in our recent paper [48]. Briefly, the AFM images were recorded in tapping mode in air employing a Titanium multimode atomic force microscope (which pertains to the equipment of “Human Proteome” Core Facility of the Institute of Biomedical Chemistry, supported by Ministry of Education and Science of Russian Federation, agreement 14.621.21.0017, unique project ID RFMEFI62117X0017; NT-MDT, Zelenograd, Russia) equipped with NSG10 cantilevers (“TipsNano”, Zelenograd, Russia; 47 to 150 kHz resonant frequency, 0.35 to 6.1 N/m force constant). The AFM signal processing, digitization, and acquisition of AFM images was performed with Nova AFM signal and data processing software (NT-MDT, Zelenograd, Russia). Further processing of the so-obtained AFM data and calculation of the objects on the imaged AFM substrate surface was performed using specialized AFM data processing software, developed at the Institute of Biomedical Chemistry (Rospatent Registration No.: 2010613458). Final data processing, the calculation of the density functions, and the calculation of the number of surface-adsorbed objects, normalized per 400 µm2 area, were performed with Microsoft Excel software (Microsoft Inc., Fort Collins, CO, USA).
Analogously to [51], the absolute number of surface-adsorbed particles, normalized per 400 µm2 area (which corresponds to sixteen 25 µm2 scans), N400 was calculated as follows:
where N is the number of objects registered within one experiment; n is the number of scans performed within one experiment; and Sfr is the scan area (µm2).
N400 = N × 400/(n × Sfr)
To analyze the data on heights of the visualized objects, the distribution of the relative number of objects with height (density function) ρ(h) was calculated [51,52]:
where Nh is the number of imaged proteins with height h, and N is the total number of imaged objects.
ρ(h) = (Nh/N) × 100%
3. Results
Figure 2 displays typical AFM images of the mica surface with HRP macromolecules adsorbed from the tested solutions, and corresponding cross section profiles indicated by the blue lines in the images. Figure 3 displays the density function plots of the distribution of the imaged objects with height ρ(h) and the number of visualized particles normalized per 400 µm2 area plotted, based on AFM data summarized for each sample.
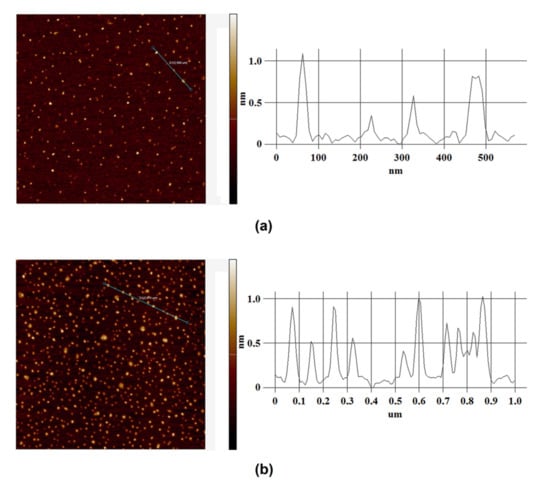
Figure 2.
Results of AFM analysis for HRP solutions: typical AFM images of the mica surface with adsorbed HRP particles (left) and corresponding cross section profiles indicated by the blue lines in the AFM images (right). The measuring cell (containing HRP solution) was placed either far away at a 10 m distance from the polymeric pipe coil (control experiment) (a) or within the experimental setup over the coil (b). The scan size of each AFM image is 2 µm × 2 µm, and the Z scale is 1.1 nm (a) and 1.2 nm (b).
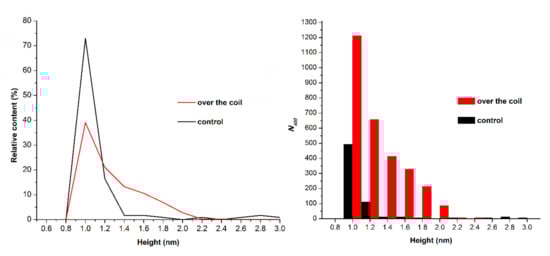
Figure 3.
Results of the processing of data obtained upon the AFM analysis of HRP solutions: typical plots of the distribution of the imaged objects with height ρ(h) (left) and the number of visualized particles normalized per 400 µm2 area (right). The measuring cell (containing HRP solution) was placed either far away at a 10 m distance from the polymeric pipe coil (control experiment, black line and bars), or within the experimental setup over the coil (red line and bars).
As seen from Figure 2a, in the control experiment, when the cell containing HRP solution was placed far away from the polymeric pipe coil, the protein was adsorbed onto the mica surface in the form of compact objects. The ρ(h) plot (Figure 3, black line) indicates that the height of the objects goes up from 0.8 to 2.0 nm, and the maximum number of molecules have a height of 1.0 ± 0.2 nm. This height value is comparable with that reported in our previous papers [16,48,53]. Thus, it can be concluded that the objects with a height of ~1.0 nm, observed upon AFM scanning, can be attributed to HRP monomers. The height value obtained herein for HRP monomers, adsorbed from buffered solutions, is somewhat lower than that observed in our previously reported experiments with the use of salt-free HRP solutions in ultrapure deionized water [16,48,53]. In the latter case, the height of monomeric HRP was determined to be ~1.6 nm. The decrease in the height of monomeric HRP adsorbed from the buffer solution—in comparison with that obtained upon the use of salt-free HRP solutions—is supposed to be connected with an influence of the buffer on an increased screening of the interaction between the AFM probe and the substrate’s surface (both of which are charged negatively). This effect can cause an increased impact of the AFM probe on the protein molecules — upon using similar parameters of AFM scanning mode.
Figure 2b displays typical AFM images obtained in working experiments when the HRP solution in the cell was placed over the coil with flowing glycerol (Figure 1). The analysis of the ρ(h) function obtained for this sample (Figure 3, left panel, red line) indicates that the height of the objects goes up from 0.8 to 2.2 nm, and the distribution maximum is 1.0 ± 0.2 nm, which coincides with the value obtained for the control sample (Figure 3, left panel, black line). However, a significant increase in the contribution to the right wing of the distribution (i.e., an increased number of objects with heights from 1.2 to 2.0 nm) was observed. The appearance of objects with increased heights on the mica surface indicates an increase in the protein aggregation rate in the analyzed solution. These data are in agreement with those reported in our previous study on the influence of water flow on HRP in a salt-free aqueous solution.
Figure 3 (right panel) shows absolute numbers of objects (N400) adsorbed on the mica surface. As seen from the distribution plot in Figure 3, an increase in the number of adsorbed objects was observed for the sample incubated in the experimental setup. That is, the number of objects adsorbed on a 400 µm2 area amounted to 3014, while in the control experiment this number was only 676.
4. Discussion
It should be emphasized that glycerol is a non-aqueous liquid with low conductivity [54]. At the same time, for glycerol, the generation of a charge upon its motion along solid surfaces is also characteristic [14]. Owing to this phenomenon, glycerol flow can well induce electromagnetic fields, whose influence on solutions of proteins can lead to their aggregation. In our experiments, the circulating flow of glycerol through a coiled polymeric communication led to a change in the aggregation state of the HRP protein, whose solution was placed in the vicinity of the coiled communication pipe.
The change in HRP adsorbability onto the mica surface can be connected to a rearrangement of the surface structure of the protein. The change in the HRP aggregation state can, in turn, be explained in the following way. Firstly, the aforementioned rearrangement of the protein’s surface structure can cause protein aggregation in the solution. Secondly, this rearrangement can lead to a change in the interactions of HRP globules with the mica substrate’s surface to provide minimum energy to the “adsorbed protein–substrate surface” system, thus inducing protein aggregation on this surface. The increase in the HRP aggregation state is apparently caused by a combination of both of the above-listed mechanisms.
The results obtained herein should be taken into account in the development of biosensors operating in a wide temperature range in field conditions. Our results are also intended for use in the biochemistry of enzyme systems. Taking into account that the aggregation state of enzymes represents an important factor in the functioning of the brain, our results should also be considered in the development of biosensors intended for the diagnosis of neurodegenerative diseases. Moreover, the aggregation state of a protein in the measuring cell impacts the measured kinetic parameters (rate and equilibrium constants) of the interaction between partner proteins, which are associated with oncological and infectious diseases. For these reasons, our results can also be useful for the development of highly sensitive bioanalytical systems for the diagnosis of cancer and infectious diseases, and for modeling the interaction of proteins with receptors in a wide temperature range.
5. Conclusions
An AFM-based sensor was employed to study the influence of motion of glycerol through coiled communications on the aggregation state of proteins exemplified with the enzyme HRP. It is demonstrated that the motion of glycerol through such communications causes changes in both the aggregation state and the adsorbability of HRP onto a mica surface. These data should be taken into account in experiments with enzymes that can function as a mixture of oligomeric structures, as well as in the development of biosensors and bioreactors.
Author Contributions
Conceptualization, Y.D.I. and V.Y.T.; methodology, Y.D.I., T.O.P. and V.S.Z.; software, V.S.Z.; validation, V.S.Z., A.N.N. and A.A.L.; formal analysis, A.N.N. and A.A.L.; investigation, T.O.P., I.D.S., A.F.K., I.A.I., A.A.V. and V.S.Z.; resources, V.Y.T., A.N.N. and A.A.L.; data curation, A.F.K., I.A.I. and A.A.V.; writing—original draft preparation, T.O.P. and I.D.S.; writing—review and editing, Y.D.I.; visualization, T.O.P. and I.D.S.; supervision, Y.D.I.; project administration, Y.D.I.; funding acquisition, Y.D.I. All authors have read and agreed to the published version of the manuscript.
Funding
The work was performed in the framework of the Program for Basic Research of State Academies of Sciences for 2013–2020.
Acknowledgments
The study has been performed in accordance with the work plan for the Consortium Agreement concluded with the aim of the development of a world-class scientific center “Digital Biodesign and Personalized Health Care” (27 April 2020).
Conflicts of Interest
The authors declare no conflict of interest.
References
- Lovecchio, J.; Gargiulo, P.; Luna, J.L.V.; Giordano, E.; Sigurjónsson, Ó.E. A standalone bioreactor system to deliver compressive load under perfusion flow to hBMSC-seeded 3D chitosan-graphene templates. Sci. Rep. 2019, 9, 16854. [Google Scholar] [CrossRef]
- Life Science Group. ProteOn XPR36 Experimental Design and Application Guide; Bulletin 6414 Rev. B; Bio-Rad Laboratories Inc.: Hercules, CA, USA, 2019. [Google Scholar]
- Schumpe, A.; Deckwer, W.-D. Viscous media in tower bioreactors: Hydrodynamic characteristics and mass transfer properties. Bioprocess Eng. 1987, 2, 79–94. [Google Scholar] [CrossRef]
- Doran, P.M. Heat transfer. In Bioprocess Engineering Principles, 2nd ed.; Doran, P.M., Ed.; Academic Press, Elsevier Ltd.: Kidlington, Oxford, UK, 2013; pp. 333–377. [Google Scholar]
- Choi, D.; Lee, H.; Im, D.J.; Kang, I.S.; Lim, G.; Kim, D.S.; Kang, K.H. Spontaneous electrical charging of droplets by conventional pipetting. Sci. Rep. 2013, 3, 1–7. [Google Scholar] [CrossRef] [PubMed]
- Ivanov, Y.D.; Kozlov, A.F.; Galiullin, R.A.; Ivanova, N.D.; Tatur, V.Y.; Ziborov, V.S.; Yushkov, E.S.; Pleshakova, T.O. Generation and accumulation of charge in a flow system for detecting protein markers of diseases. Patol. Fiziol. I Eksperimental’naya Ter. (Pathol. Physiol. Exp. Ther. Rus. J.) 2017, 61, 167–175. [Google Scholar]
- Stetten, A.Z.; Golovko, D.S.; Weber, S.A.L.; Butt, H.-J. Slide electrification: Charging of surfaces by moving water drops. Soft Matter 2019, 15, 8667–8679. [Google Scholar] [CrossRef] [PubMed]
- Burgo, T.A.L.; Galembeck, F.; Pollack, G.H. Where is water in the triboelectric series? J. Electrost. 2016, 80, 30–33. [Google Scholar] [CrossRef]
- Ivanov, Y.D.; Kozlov, A.F.; Galiullin, R.A.; Tatur, V.Y.; Ivanova, N.D.; Ziborov, V.S. Influence of chip materials on charge generation in flowing solution in nanobiosensors. Appl. Sci. 2019, 9, 671. [Google Scholar] [CrossRef]
- Xu, W.; Zheng, H.; Liu, Y.; Zhou, X.; Zhang, C.; Song, Y.; Deng, X.; Leung, M.; Yang, Z.; Xu, R.X. A droplet-based electricity generator with high instantaneous power density. Nature 2020, 578, 392–396. [Google Scholar] [CrossRef] [PubMed]
- Zhao, L.; Liu, L.; Yang, X.; Hong, H.; Yang, Q.; Wang, J.; Tang, Q. Cumulative charging behavior of water droplets driven freestanding triboelectric nanogenerator toward hydrodynamic energy harvesting. J. Mater. Chem. A 2020, 8, 7880–7888. [Google Scholar] [CrossRef]
- Haque, R.I.; Arafat, A.; Briand, D. Triboelectric effect to harness fluid flow energy. J. Phys. Conf. Ser. 2019, 1407, 012084. [Google Scholar] [CrossRef]
- Balmer, R. Electrostatic Generation in Dielectric Fluids: The Viscoelectric Effect. In Proceedings of the WTC2005 World Tribology Congress III, Washington, DC, USA, 12–16 September 2005. Paper No. WTC2005-63806. [Google Scholar] [CrossRef][Green Version]
- Tanasescu, F.; Cramariuc, R. Electroststica în Technica; Editura Technica: Bucuresti, Romania, 1977. [Google Scholar]
- Berezin, A.A. Electrification of solid materials. In Handbook of Electrostatic Processes; Chang, J.S., Kelly, A.J., Crowley, J.M., Eds.; CRC Press: New York, NY, USA, 2018; pp. 25–38. [Google Scholar]
- Ivanov, Y.D.; Pleshakova, T.O.; Shumov, I.D.; Kozlov, A.F.; Romanova, T.S.; Valueva, A.V.; Tatur, V.Y.; Stepanov, I.N.; Ziborov, V.S. Investigation of the influence of water motion in a flow-based system on an enzyme aggregation state with an atomic force microscopy sensor. Appl. Sci. 2020, 10, 4560. [Google Scholar] [CrossRef]
- Ivanov, Y.D.; Pleshakova, T.; Маlsagovа, K.; Kozlov, A.; Kaysheva, A.; Kopylov, A.; Izotov, A.; Andreeva, E.; Kanashenko, S.; Usanov, S.; et al. Highly sensitive protein detection by combination of atomic force microscopy fishing with charge generation and mass spectrometry analysis. FEBS J. 2014, 281, 4705–4717. [Google Scholar] [CrossRef]
- Touchard, G.; Patzek, T.W.; Radke, C.J. A physicochemical explanation for flow electrification in low-conductivity liquids. IEEE Trans. Ind. Appl. 1996, 32, 1051–1057. [Google Scholar] [CrossRef]
- Vijayendran, R.A.; Ligler, F.S.; Leckband, D.E. A computational reaction-diffusion model for the analysis of transport-limited kinetics. Anal. Chem. 1998, 71, 5405–5412. [Google Scholar] [CrossRef]
- Ang, L.F.; Por, L.Y.; Yam, M.F. Development of an Amperometric-Based Glucose Biosensor to Measure the Glucose Content of Fruit. PLoS ONE 2015, 10, e0111859. [Google Scholar] [CrossRef]
- Patskovsky, S.; Jacquemart, R.; Meunier, M.; De Crescenzo, G.; Kabashin, A.V. Phase-sensitive spatially-modulated surface plasmon resonance polarimetry for detection of biomolecular interactions. Sens. Actuat. B Chem. 2008, 133, 628–631. [Google Scholar] [CrossRef]
- Ralph, E.C.; Hall, J. An SPR-based analysis of cGAS substrate KD and steady-state KM values. Methods Enzymol. 2019, 625, 61–76. [Google Scholar] [CrossRef] [PubMed]
- Bradbury, S.L.; Jakoby, W.B. Glycerol as an enzyme-stabilizing agent: Effects on aldehyde dehydrogenase. Proc. Natl. Acad. Sci. USA 1972, 69, 2373–2376. [Google Scholar] [CrossRef] [PubMed]
- Silva, C.; Martins, M.; Jing, S.; Fu, J.; Cavaco-Paulo, A. Practical insights on enzyme stabilization. Crit. Rev. Biotechnol. 2018, 38, 335–350. [Google Scholar] [CrossRef]
- Rigoldi, F.; Donini, S.; Giacomina, F.; Sorana, F.; Redaelli, A.; Bandiera, T.; Parisini, E.; Gautieri, A. Thermal stabilization of the deglycating enzyme Amadoriase I by rational design. Sci. Rep. 2018, 8, 3042. [Google Scholar] [CrossRef]
- Kaur, H.; Kumar, S.; Verma, N. Enzyme-based Colorimetric and Potentiometric Biosensor for Detecting Pb (II) Ions in Milk. Braz. Arch. Biol. Technol. 2014, 57, 613–619. [Google Scholar] [CrossRef]
- Nightingale, A.M.; Leong, C.L.; Burnish, R.A.; Hassan, S.U.; Zhang, Y.; Clough, G.F.; Boutelle, M.G.; Voegeli, D.; Niu, X. Monitoring biomolecule concentrations in tissue using a wearable droplet microfluidic-based sensor. Nat. Commun. 2019, 10, 2741. [Google Scholar] [CrossRef]
- Liu, C.; Cui, D.; Li, H. A hard–soft microfluidic-based biosensor flow cell for SPR imaging application. Biosens. Bioelectron. 2010, 26, 255–261. [Google Scholar] [CrossRef] [PubMed]
- Zaytseva, N.V.; Goral, V.N.; Montagna, R.A.; Baeumner, A.J. Development of a microfluidic biosensor module for pathogen detection. Lab Chip 2005, 5, 805–811. [Google Scholar] [CrossRef] [PubMed]
- Tamanaha, C.R.; Whitman, L.J.; Colton, R.J. Hybrid macro–micro fluidics system for a chip-based biosensor. J. Micromech. Microeng. 2002, 12, N7–N17. [Google Scholar] [CrossRef]
- Martin, K.; Henkel, T.; Baier, V.; Grodrian, A.; Schön, T.; Roth, M.; Köhler, J.M.; Metze, J. Generation of larger numbers of separated microbial populations by cultivation in segmented-flow microdevices. Lab Chip 2003, 3, 202–207. [Google Scholar] [CrossRef]
- Salim, A.; Lim, S. Review of Recent Metamaterial Microfluidic Sensors. Sensors 2018, 18, 232. [Google Scholar] [CrossRef]
- Poscia, A.; Mascini, M.; Moscone, D.; Luzzana, M.; Caramenti, G.; Cremonesi, P.; Valgimigli, F.; Bongiovanni, C.; Varalli, M. A microdialysis technique for continuous subcutaneous glucose monitoring in diabetic patients (part 1). Biosens. Bioelectron. 2003, 18, 891–898. [Google Scholar] [CrossRef]
- Daly, G.C. Heat Transfer Fluid. U.S. Patent 2008/0315152 A1, 25 December 2008. [Google Scholar]
- Ross, H.K. Cryoscopic Studies - Concentrated Solutions of Hydroxy Compounds. Ind. Eng. Chem. 1954, 46, 601–610. [Google Scholar] [CrossRef]
- Lane, L.B. Freezing Points of Glycerol and Its Aqueous Solutions. Ind. Eng. Chem. 1925, 17, 924. [Google Scholar] [CrossRef]
- Veitch, N.C. Horseradish peroxidase: A modern view of a classic enzyme. Phytochemistry 2004, 65, 249–259. [Google Scholar] [CrossRef]
- Welinder, K.G. Amino acid sequence studies of horseradish peroxidase. amino and carboxyl termini, cyanogen bromide and tryptic fragments, the complete sequence, and some structural characteristics of horseradish peroxidase C. Eur. J. Biochem. 1979, 96, 483–502. [Google Scholar] [CrossRef]
- Davies, P.F.; Rennke, H.G.; Cotran, R.S. Influence of molecular charge upon the endocytosis and intracellular fate of peroxidase activity in cultured arterial endothelium. J. Cell Sci. 1981, 49, 69–86. [Google Scholar]
- Shannon, L.M.; Kay, E.; Lew, J.Y. Peroxidase isozymes from horseradish roots I. Isolation and physical properties. J. Biol. Chem. 1966, 241, 2166–2172. [Google Scholar] [PubMed]
- Tams, J.W.; Welinder, K.G. Mild chemical deglycosylation of horseradish peroxidase yields a fully active, homogeneous enzyme. Anal. Biochem. 1995, 228, 48–55. [Google Scholar] [CrossRef]
- Ignatenko, O.V.; Sjölander, A.; Hushpulian, D.M.; Kazakov, S.V.; Ouporov, I.V.; Chubar, T.A.; Poloznikov, A.A.; Ruzgas, T.; Tishkov, V.I.; Gorton, L.; et al. Electrochemistry of chemically trapped dimeric and monomeric recombinant horseradish peroxidase. Adv. Biosens. Bioelectron. 2013, 2, 25–34. [Google Scholar]
- Metzler, D.E. Biochemistry: The Chemical Reactions of Living Cells; Academic Press: Oxford, UK, 1970. [Google Scholar]
- Rogozhin, V.V.; Kutuzova, G.D.; Ugarova, N.N. Inhibition of horseradish peroxidase by N-ethylamide of o-sulfobenzoylacetic acid. Bioorganic Chem. 2000, 26, 156–160. [Google Scholar]
- Gavrilenko, T.I.; Ryzhkova, N.A.; Parkhomenko, A.N. Myeloperoxidase and its role in the development of coronary heart disease. Ukr. J. Cardiol. 2014, 4, 119–126. [Google Scholar]
- Sun, J.; Sun, F.; Xu, B.; Gu, N. The quasi-one-dimensional assembly of horseradish peroxidase molecules in presence of the alternating magnetic field. Coll. Surf. A Physicochem. Eng. Asp. 2010, 360, 94–98. [Google Scholar] [CrossRef]
- Sun, J.; Zhou, H.; Jin, Y.; Wang, M.; Gu, N. Magnetically enhanced dielectrophoretic assembly of horseradish peroxidase molecules: Chaining and molecular monolayers. Chem. Phys. Chem. 2008, 9, 1847–1850. [Google Scholar] [CrossRef] [PubMed]
- Ivanov, Y.D.; Pleshakova, T.O.; Shumov, I.D.; Kozlov, A.F.; Ivanova, I.A.; Valueva, A.V.; Tatur, V.Y.; Smelov, M.V.; Ivanova, N.D.; Ziborov, V.S. AFM imaging of protein aggregation in studying the impact of knotted electromagnetic field on a peroxidase. Sci. Rep. 2020, 10, 9022. [Google Scholar] [CrossRef]
- Segur, J.B.; Oberstar, H.E. Viscosity of Glycerol and Its Aqueous Solutions. Ind. Eng. Chem. 1951, 43, 2117–2120. [Google Scholar] [CrossRef]
- Kiselyova, O.I.; Yaminsky, I.V.; Ivanov, Y.D.; Kanaeva, I.P.; Kuznetsov, V.Y.; Archakov, A.I. AFM study of membrane proteins, cytochrome P450 2B4, and NADPH–Cytochrome P450 reductase and their complex formation. Arch. Biochem. Biophys. 1999, 371, 1–7. [Google Scholar] [CrossRef]
- Pleshakova, T.O.; Kaysheva, A.L.; Bayzyanova, J.M.; Anashkina, A.S.; Uchaikin, V.F.; Shumov, I.D.; Ziborov, V.S.; Konev, V.A.; Archakov, A.I.; Ivanov, Y.D. Advantages of aptamers as ligands upon protein detection by AFM-based fishing. Anal. Methods 2017, 9, 6049–6060. [Google Scholar] [CrossRef]
- Pleshakova, T.O.; Kaysheva, A.L.; Shumov, I.D.; Ziborov, V.S.; Bayzyanova, J.M.; Konev, V.A.; Uchaikin, V.F.; Archakov, A.I.; Ivanov, Y.D. Detection of hepatitis C virus core protein in serum using aptamer-functionalized AFM chips. Micromachines 2019, 10, 129. [Google Scholar] [CrossRef]
- Ivanov, Y.D.; Danichev, V.V.; Pleshakova, T.O.; Shumov, I.D.; Ziborov, V.S.; Krokhin, N.V.; Zagumenniy, M.N.; Ustinov, V.S.; Smirnov, L.P.; Archakov, A.I. Irreversible chemical AFM-based fishing for the detection of low-copied proteins. Biochem. Suppl. Ser. B Biomed. Chem. 2013, 7, 46–61. [Google Scholar] [CrossRef]
- Adio, S.A.; Sharifpur, M.; Meyer, J.P. Investigation into effective viscosity, electrical conductivity, and pH of γ-Al2O3-glycerol nanofluids in Einstein concentration regime. Heat Transf. Eng. 2015, 36, 1241–1251. [Google Scholar] [CrossRef]
© 2020 by the authors. Licensee MDPI, Basel, Switzerland. This article is an open access article distributed under the terms and conditions of the Creative Commons Attribution (CC BY) license (http://creativecommons.org/licenses/by/4.0/).