Article

A Method to Supervise the Effect on Railway Radio Transmission of Pulsed Disturbances Based on Joint Statistical Characteristics

1
Institute of Electromagnetic Compatibility, Beijing Jiaotong University, Beijing 100044, China
2
Beijing Engineering Research Center of EMC and GNSS Technology for Rail Transportation, Beijing 100044, China
*
Author to whom correspondence should be addressed.
Appl. Sci. 2020, 10(14), 4814; https://doi.org/10.3390/app10144814
Submission received: 8 June 2020 / Revised: 4 July 2020 / Accepted: 9 July 2020 / Published: 13 July 2020
(This article belongs to the Special Issue Monitoring and Maintenance Systems for Railway Infrastructure)

Abstract

:
Radiocommunication systems between train and trackside (RSTT) carry essential information for train operations between on-board radio equipment and the related radio infrastructure located along the trackside, such as the train control, voice dispatching, command, operational information as well as the monitoring data. In a high-speed railway environment, the electromagnetic interference (EMI) has been a major threat to RSTT, and may result in critical security issues for railway transportation and even passengers. Given the complex scenario of the high-speed railway, it is significant to monitor the impact of disturbances in order to guarantee the quality of RSTT. On one hand, RSTT operate in a complex electromagnetic environment where transient disturbances coexist with permanent ones, and they both vary dramatically while the train is running. On the other hand, various radiocommunication technologies have been used for railway applications, featuring forward error-correction codes to resist EMI. Therefore, this paper puts forward a novel approach to evaluate the impact on radio transmission based on the joint statistical characteristics of time-varying EMI. This approach applies a dynamic effective signal-to-interference-plus-noise ratio mapping model to establish the relation between the block error performance of on-board radio and the joint statistical characteristics of disturbances with a mutual information-based metric. Simulations on radio transmission using Turbo coding and low-density-parity-check coding under various interferences indicate that this approach is effective to evaluate the degradation of transmission signal with forward error-correction coding due to EMI with different characteristics.

Graphical Abstract

1. Introduction

Railway radiocommunication systems between train and trackside (RSTT) carry train control, voice dispatching, command, operational information as well as monitoring data between on-board radio equipment and the related radio infrastructure located along the trackside. In a high-speed railway (HSR) system, RSTT provide improved railway traffic control, passenger safety and improved security for train operations [1]. Therefore, RSTT are considered as “mission critical” for train operations in general and the management of train emergency situations [2]. For example, among the dispatching communication functionalities specified for railway, the Global System for Mobile Communications-Railway (GSM-R) [3] provides a railway emergency call service (REC) for drivers and signalers to alert all trains when part of route assigned to them may be occupied and collision risk occurs, so that they can immediately start lowering the speed or braking, depending on the operational rules [4]. The GSM-R REC service has helped to save lives and mitigate the severe consequences of rail accident in many cases [5,6]. Therefore, the availability of the GSM-R frequencies is essential for safe and interoperable operations [7].
Unfortunately, railway infrastructures operate in a harsh and complex electromagnetic (EM) environment, where interferences are generated both inside and outside the HSR system. While supporting train operations, the electric traction system and high-power electrical appliances radiate strong electromagnetic emission under some unavoidable circumstances, such as the arcs generated during the separation of the pantograph and the contact wire [8]. Additionally, railway is distributed through the public domain and exposed to EM sources at various places, such as public radio transmission equipment [9]. In the HSR EM environment, the EM disturbances can hardly be eliminated from the source, nor be prevented through the coupling path. Thus, the on-board RSTT devices are extremely vulnerable to the surrounding EM disturbances, which may cause transmission errors and even lead to critical communication failures [10]. The communication failures directly cause the operational consequences of the rail network, such as jammed traffic and major delays, which may further result in bad economic and commercial effect [6] and even potential threat to the safety of passengers [11]. The degradation of communication availability or quality due to interferences is not acceptable [12]. Therefore, in order to guarantee the reliability of communication services, the impact of EM disturbances on RSTT should be monitored and supervised.
Since the degradation of RSTT caused by different types of interferences is quite different, it is essential to consider the variety of disturbances in the HSR system. There have been several methodologies put forward to monitor the interference effect on RSTT based on the different measuring methods of received disturbances, such as classification based on the time-domain waveform [13], simulation and calculation based on the amplitude probability distribution (APD) detector [14] and the instantaneous frequency histogram [15]. Among these measuring methods, APD reflects the time-domain statistics of EMI and it can capture the dynamic behavior of a time-varying EMI with the measuring apparatus specified in the standards [16]. Besides, as a standard emission limit for EMI sources [17], APD is effective to analyze the effect of interferences. Therefore, statistics stand out as the suitable measuring methodology to characterize the disturbances in the complex HSR environment and to analyze the impact on RSTT.
Previous research has proved that the statistics of EMI in the time-domain are directly related to the error performance of digital radiocommunication systems with different modulation and coding schemes (MCSs). Some of them has focused on the interfered digital modulation signals, and the maximum bit error probability of the radio receiver was derived based on the APD of arbitrary interference [18,19,20], without consideration of the forward error correction (FEC) coding gain. As the coding gain is closely related to the signal-to-interference-plus-noise ratio (SINR) of a code block, which is determined by both the amplitude and duration of a burst, the impact on RSTT with FEC is much more complex than digital modulation signals. Since APD cannot provide information on the time patterns of a disturbance, the evaluation is usually limited to particular circumstances. For example, a method that maps the coding gain to the impulsiveness correction factor (ICF) was proposed to evaluate the performance degradation [21,22,23]. However, this method is only effective in the case of impulsive noise and requires prior simulation related to the statistics of EMI. As for the scenario of HSR environment where transient and permanent disturbances both exist, the acquisition of ICF would take lots of time-consuming simulation work and may cause a large error due to the various statistics of disturbances, so it can not be used to give a real-time evaluation of RSTT performance.
In this paper, a novel approach is proposed to evaluate the impact on RSTT of the complex interferences based on the time-domain statistics. Since the disturbances are generally regarded as pulses, the pulse duration and amplitude are both major factors that influence the performance of radio services. Therefore, we use the pulse duration distribution (PDD) and APD jointly to characterize EMI, in order to analyze the system performance in a pulsed noise environment. Furthermore, a dynamic effective SINR mapping model is proposed to establish the relation between the block error performance of on-board radio and the joint statistical characteristics of disturbances with a mutual information (MI)—based metric.
This paper is organized as follows. In Section 2, we propose the methodology to supervise the interference effect of RSTT, and a general dynamic MI-effective SINR mapping (MI-ESM) model is proposed based on the statistical characteristics of pulsed disturbances. Then, in Section 3, a MI-based metric is analyzed to indicate the interference impact on encoded transmission under time-varying disturbances. Furthermore, the impact on RSTT by different disturbances is analyzed based on the APD and PDD in Section 4. The evaluation result is verified by the simulation in Section 5. Section 6 concludes the paper.

2. Problem Formulation

In this section, we propose a novel method to detect and supervise the degradation of RSTT caused by the EMI. As the on-site interferences are regarded as a series of pulses, they can be characterized by the statistics of amplitude and width. In this situation, the relation between the impact on RSTT and the interference measurement is established through a MI-based method.

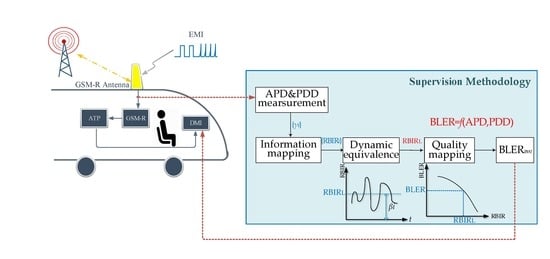
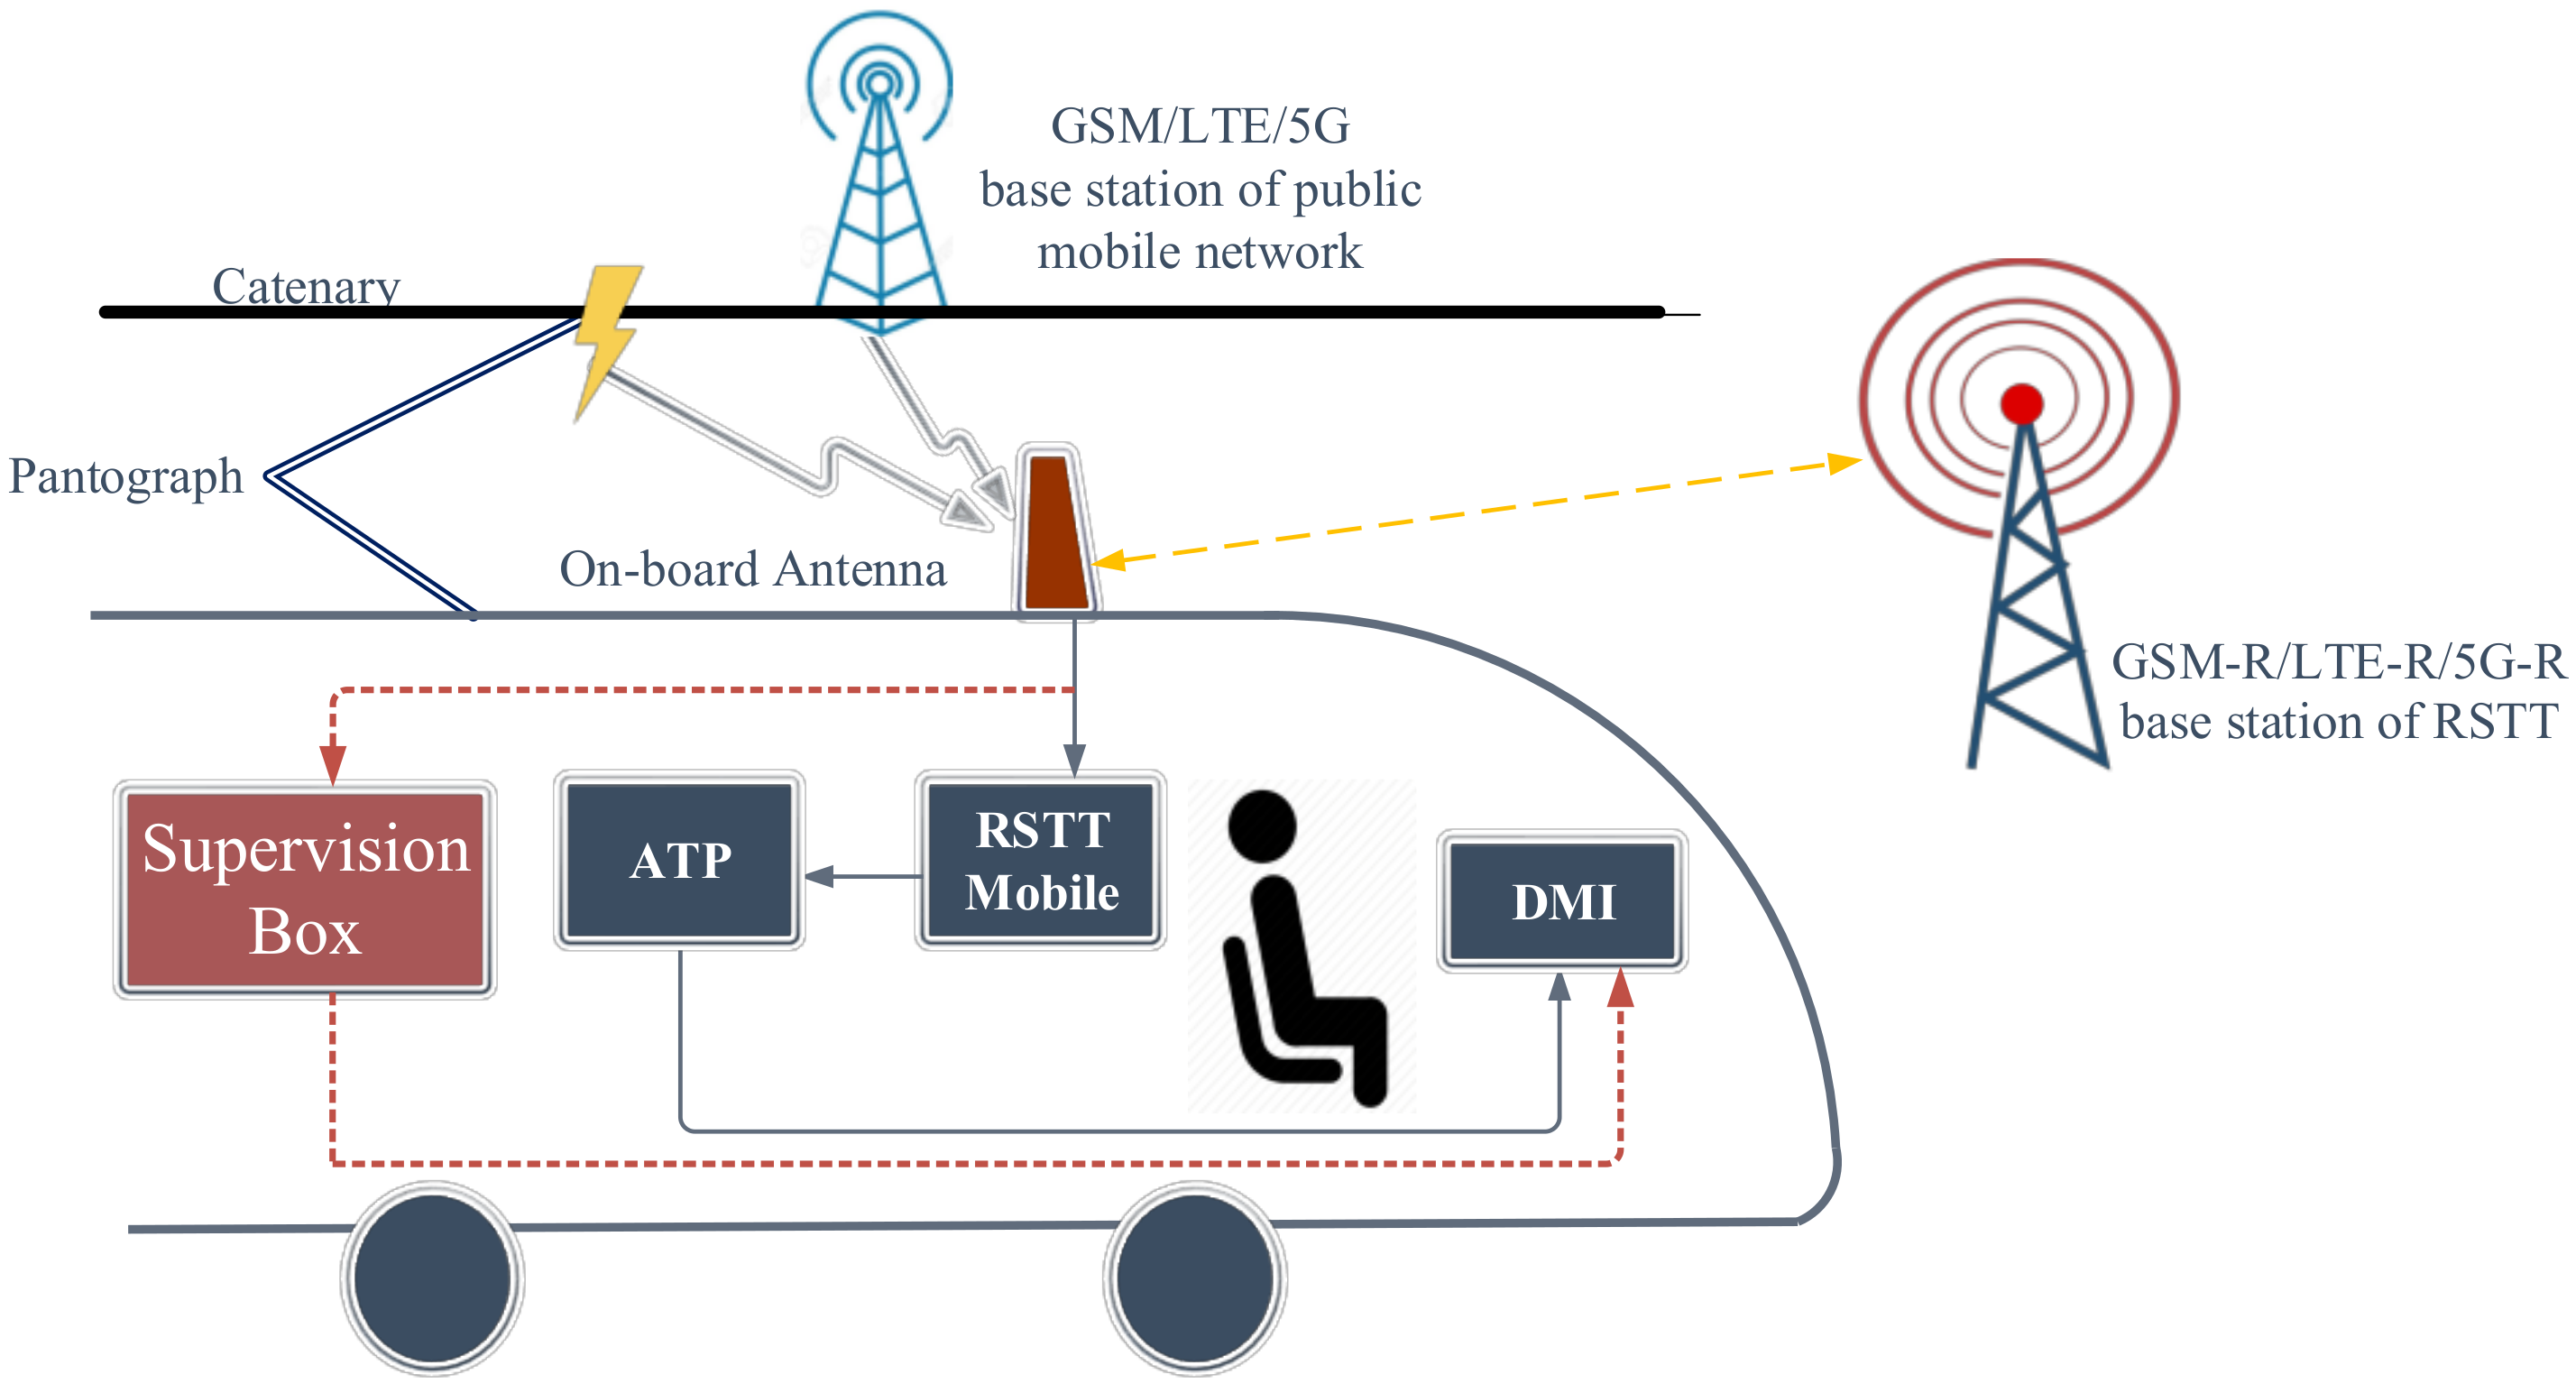
2.1. Supervising Methodology of RSTT

To supervise the interference impact on RSTT during the train operations, an on-board supervision methodology for communication quality is proposed, as illustrated in Figure 1. In this method, the disturbances at the input of the receiving antenna ought to be monitored through a coupler, independent of the existing radio receiver. Thus, the performance degradation of the RSTT transmission can be estimated based on the measurement of disturbances. Furthermore, in comparison with the specified requirements in related regulations, it could be determined whether the disturbance is intense enough to threaten the reliability of RSTT [13]. By this means, the operator could get knowledge of the real-time quality of radio transmission, and even receive an early warning before the communication blackout occurs through the driver–machine interface (DMI). The question then becomes: how to establish the relation between the measurement of EMI and real-time performance degradation of interfered radio transmission.
Practically, RSTT are responsible for wireless data and voice communication between the train and the station for different railway applications. As stringent requirements for reliability, availability, safety and security are various for different train operations, numerous radiocommunication technologies have been used for railway operational applications and various MCSs have been adopted. For instance, as for dispatching, train control and other operational safety-related and efficiency needs of railway transportation systems, RSTT usually takes the form of dedicated mobile radio systems, such as GSM-R and Long-Term Evolution-Railway (LTE-R). Moreover, the technologies used for train-positioning applications are based on radar and short-range radio, while the wireless local area network (WLAN) is used for train remote and surveillance applications [1].
In the complex HSR environment, RSTT suffer from disturbances with diverse statistical characteristics. On board moving trains, the radio receiver is mainly interfered with by transient disturbances occurring between the catenary and the pantograph, as well as permanent disturbances coming from the public mobile network base stations [7], as shown in Figure 1. On-site measurements of typical EMI in the GSM-R frequency band have been performed at the output port of a GSM-R antenna, and the results are shown in Figure 2. The pantograph arcing disturbance, shown in Figure 2a (with data from [24]), is the most typical interference generated in the HSR system. It has a wide frequency range up to several GHz, covering most working bands of the RSTT (with data from [25]). Besides, the on-board antenna of some RSTT network, like GSM-R and LTE-R, is usually fixed on the roof of the train close to the catenary, which makes it prone to emission from the sliding contact between the pantograph and the catenary. In addition, the signal from the public base station near the railroad is a critical external disturbance when it uses the adjacent frequency band of the railway radio service, as shown in Figure 2b [26]. This usually happens when the train is operating in the vicinity of a city, where the number of base stations and users of public mobile network significantly increases. Generally, both transient and permanent disturbances can be modeled as a series of pulses with a repeated cycle Tp, pulse amplitude Ai and pulse width Wi in the time domain, expressed as
n t = n w t + i = 0 A i p t i T p W i
where nw(t) refers to the background additive white Gaussian noise (AWGN), and p(t) is the unit rectangular pulse function that refers to the single burst. As in (1), both impulsive and non-impulsive disturbances can be characterized by the statistics of pulse amplitude and width. Therefore, statistical parameters APD and PDD are jointly used to describe and characterize the interferences within the operating frequency bands of RSTT.
Generally, the interference effect on RSTT depends both on the MCS of the transmitted signal and the statistical characteristics of the received disturbance. Considering the diversity of disturbances as well as RSTT signals, especially with the coding gain of FEC codes, the impact on radio transmission differs widely. Therefore, a universal method is required to evaluate the real-time transmission quality in such a complex situation.

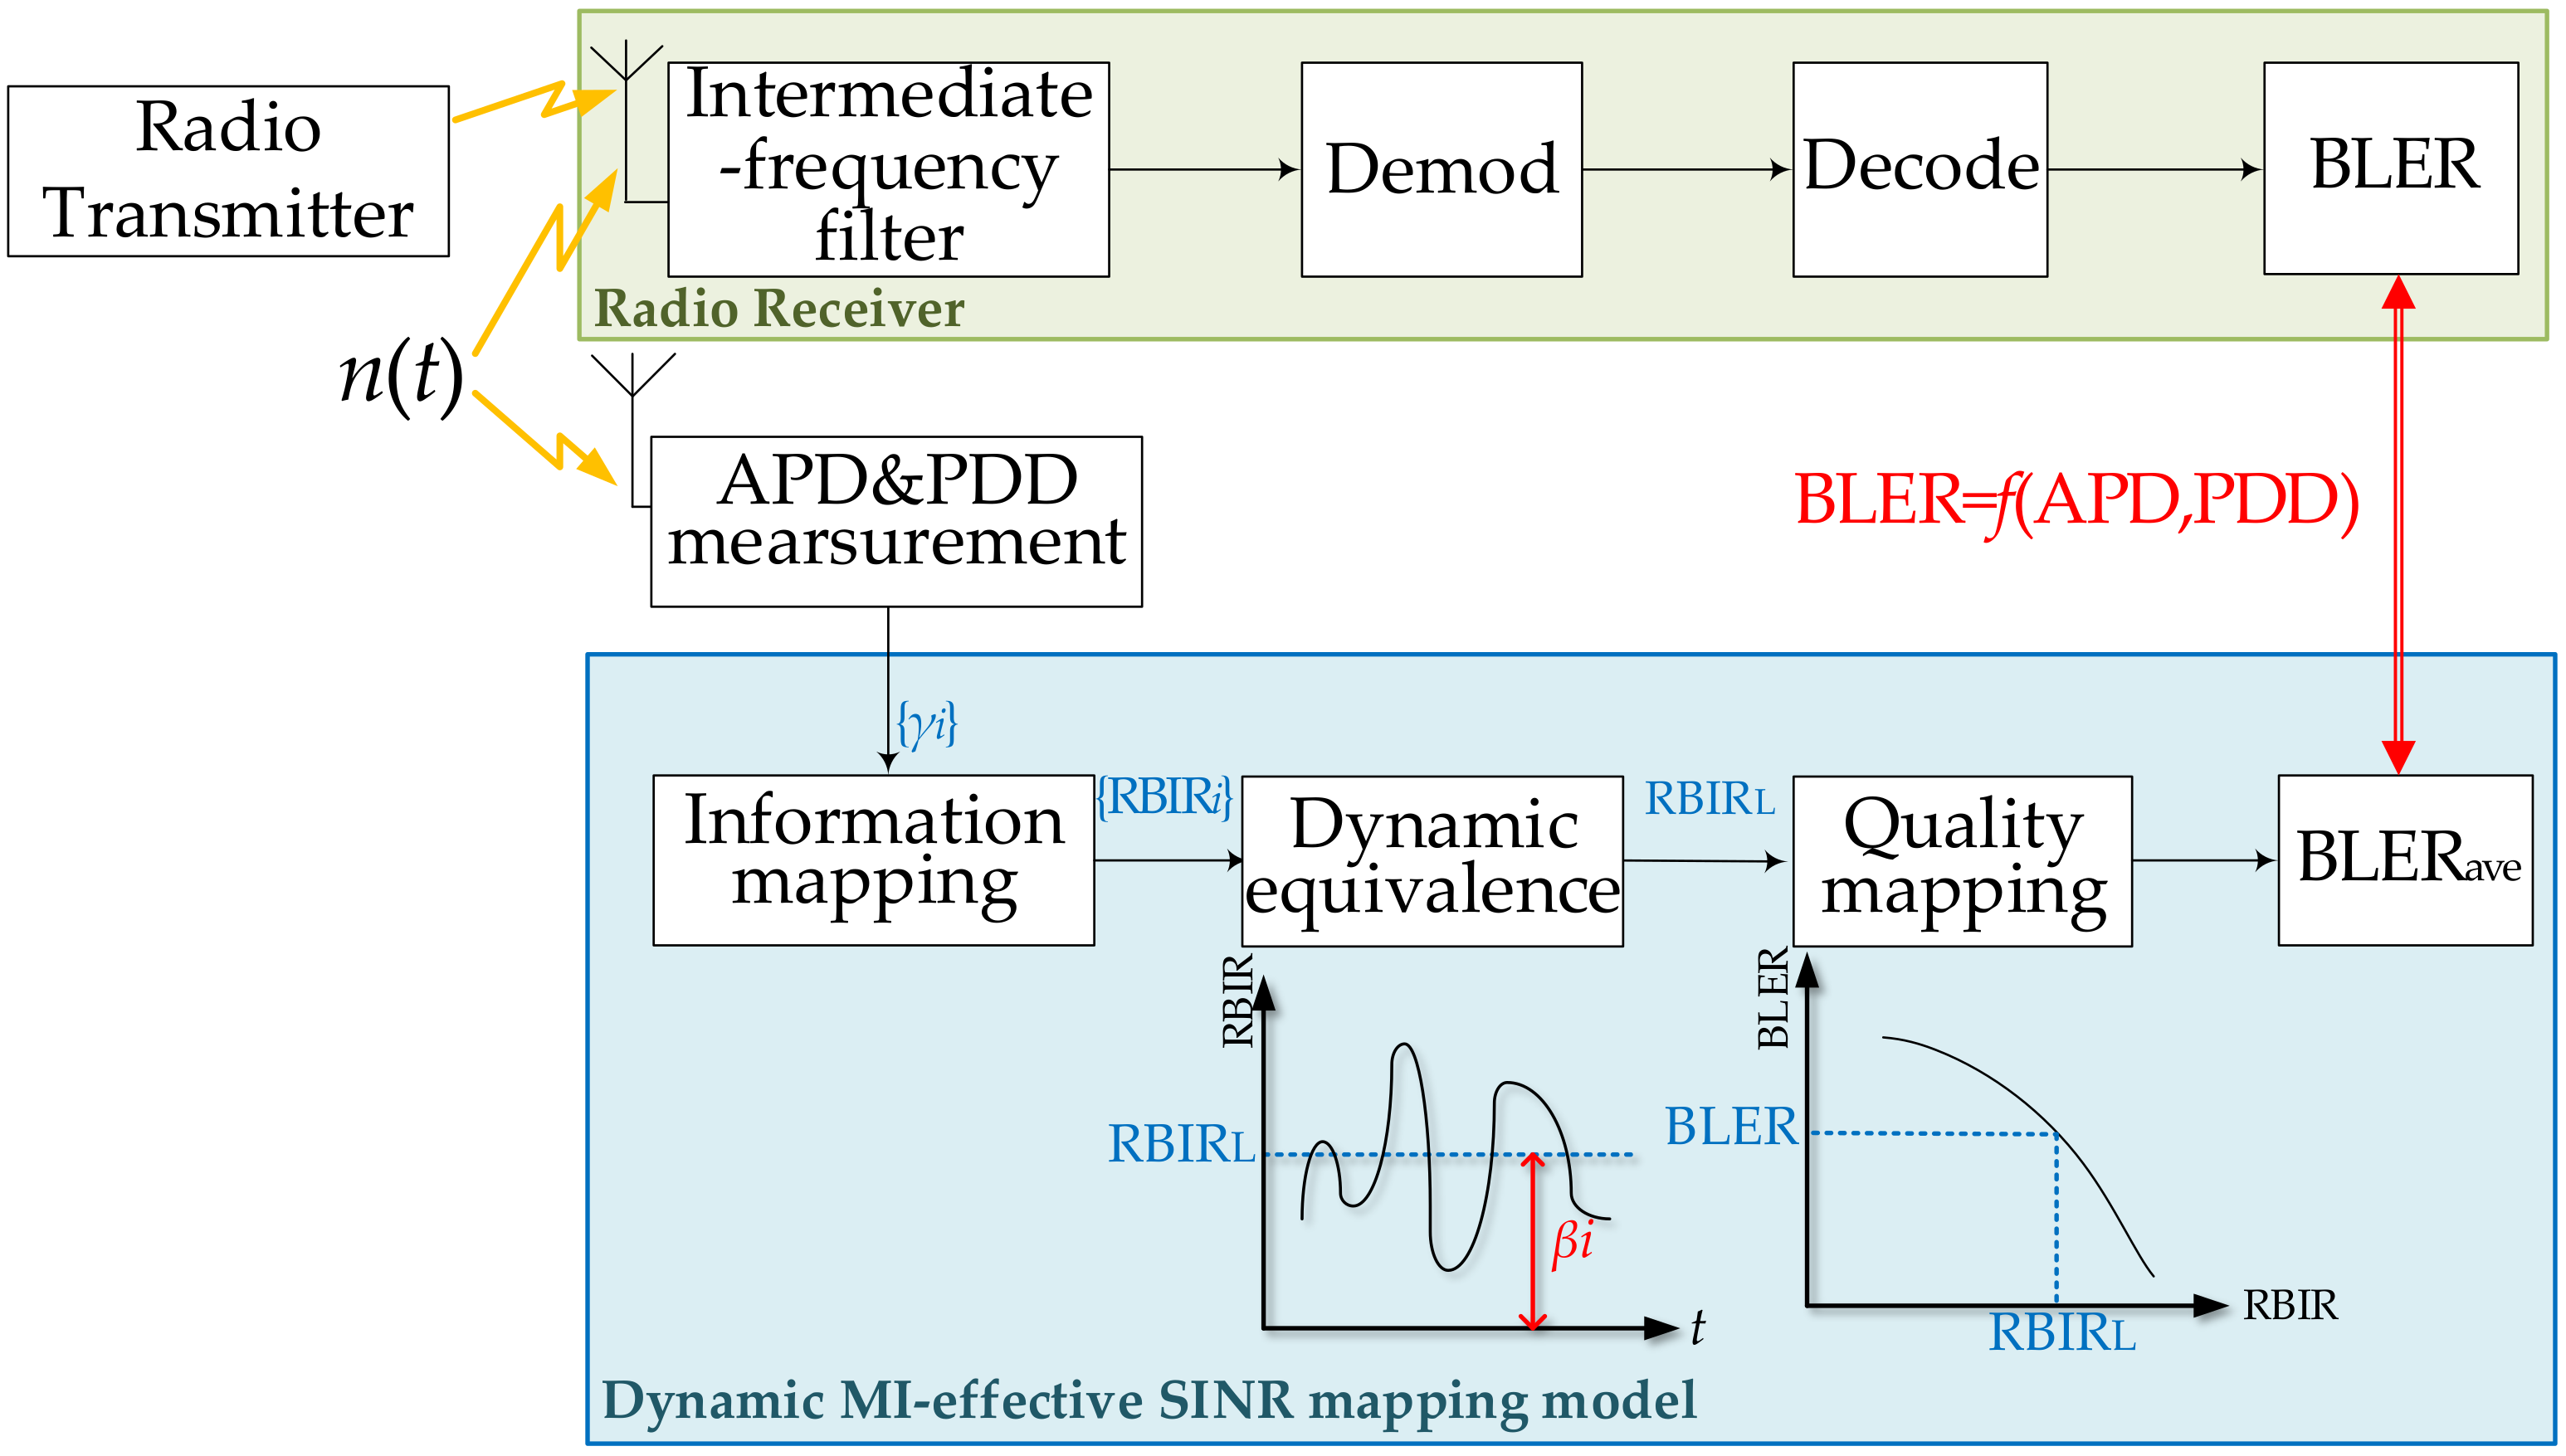
2.2. MI-Based Method to Evaluate the Impact on RSTT of Time-Varying Interference

For the RSTT, reliability is among the most significant quality indicators closely related to train operation, and many security measures are considered based on the assumption of transmission error [1]. Thus, the block error rate (BLER) is taken as the criterion to indicate the effect of the pulsed disturbing noise on the RSTT using FEC codes. Therefore, to evaluate the impact on RSTT with different MCSs, the BLER of the on-board receiver should be achieved instantly based on the real-time statistical measurement of complex disturbances. As the coding gain of radio transmission in a stable fading channel is usually implemented by the MI-ESM algorithm [27], the MI metric is quite an effective channel quality indicator (CQI) to map the interference properties to the BLER performance. However, in the HSR environment, due to the fast movement of trains and the impulsive nature of EM disturbance sources, the RSTT performance changes in accordance with the dynamic interference, and it is almost impossible to obtain the corresponding BLER with a variable MI metric. As a result, an equivalent CQI is required for the time-varying EMI, through which the transmission quality can be derived.
Therefore, a dynamic quality model is proposed to achieve the MI-based CQI of transmission under time-varying disturbances, as illustrated in Figure 3. Firstly, the performance metric of every single code block is obtained by information mapping, based on the statistical characteristics of EMI. It is important to note that the APD and PDD of disturbance n(t) should be measured using the equivalent bandwidth of the railway wireless service to be monitored [17]. According to MI-ESM algorithm, a received bit information rate (RBIR) is defined as the CQI to indicate the transmission quality. Then, a novel metric, long-term effective RBIR (RBIRL), is put forward to reflect the general transmission performance in the presence of the dynamic disturbance. To combine the RBIR of each block in time-varying situations, RBIRL is achieved by the weighted sum of the RBIR series. Therefore, the RBIRL is the equivalent CQI of RBIR in a stable channel. Since RBIRL can be mapped to the average BLER (BLERave) through the look-up table under the AWGN channel, the quality of the radio transmission is thus evaluated by the RBIRL value.

3. Information Mapping of Encoded Radio Transmission under Time-Varying Disturbance

In this section, an MI-based CQI is obtained to evaluate the impact on RSTT based on the joint statistical characteristics of disturbances. We first map the statistics of the disturbances during a single code block to RBIR, which indicates the quality of digital transmission using the FEC codes. Furthermore, due to the presence of dynamic EMI in the HSR environment, a method based on nonlinear optimization is proposed to obtain the equivalent metric RBIRL from a series of RBIR values.

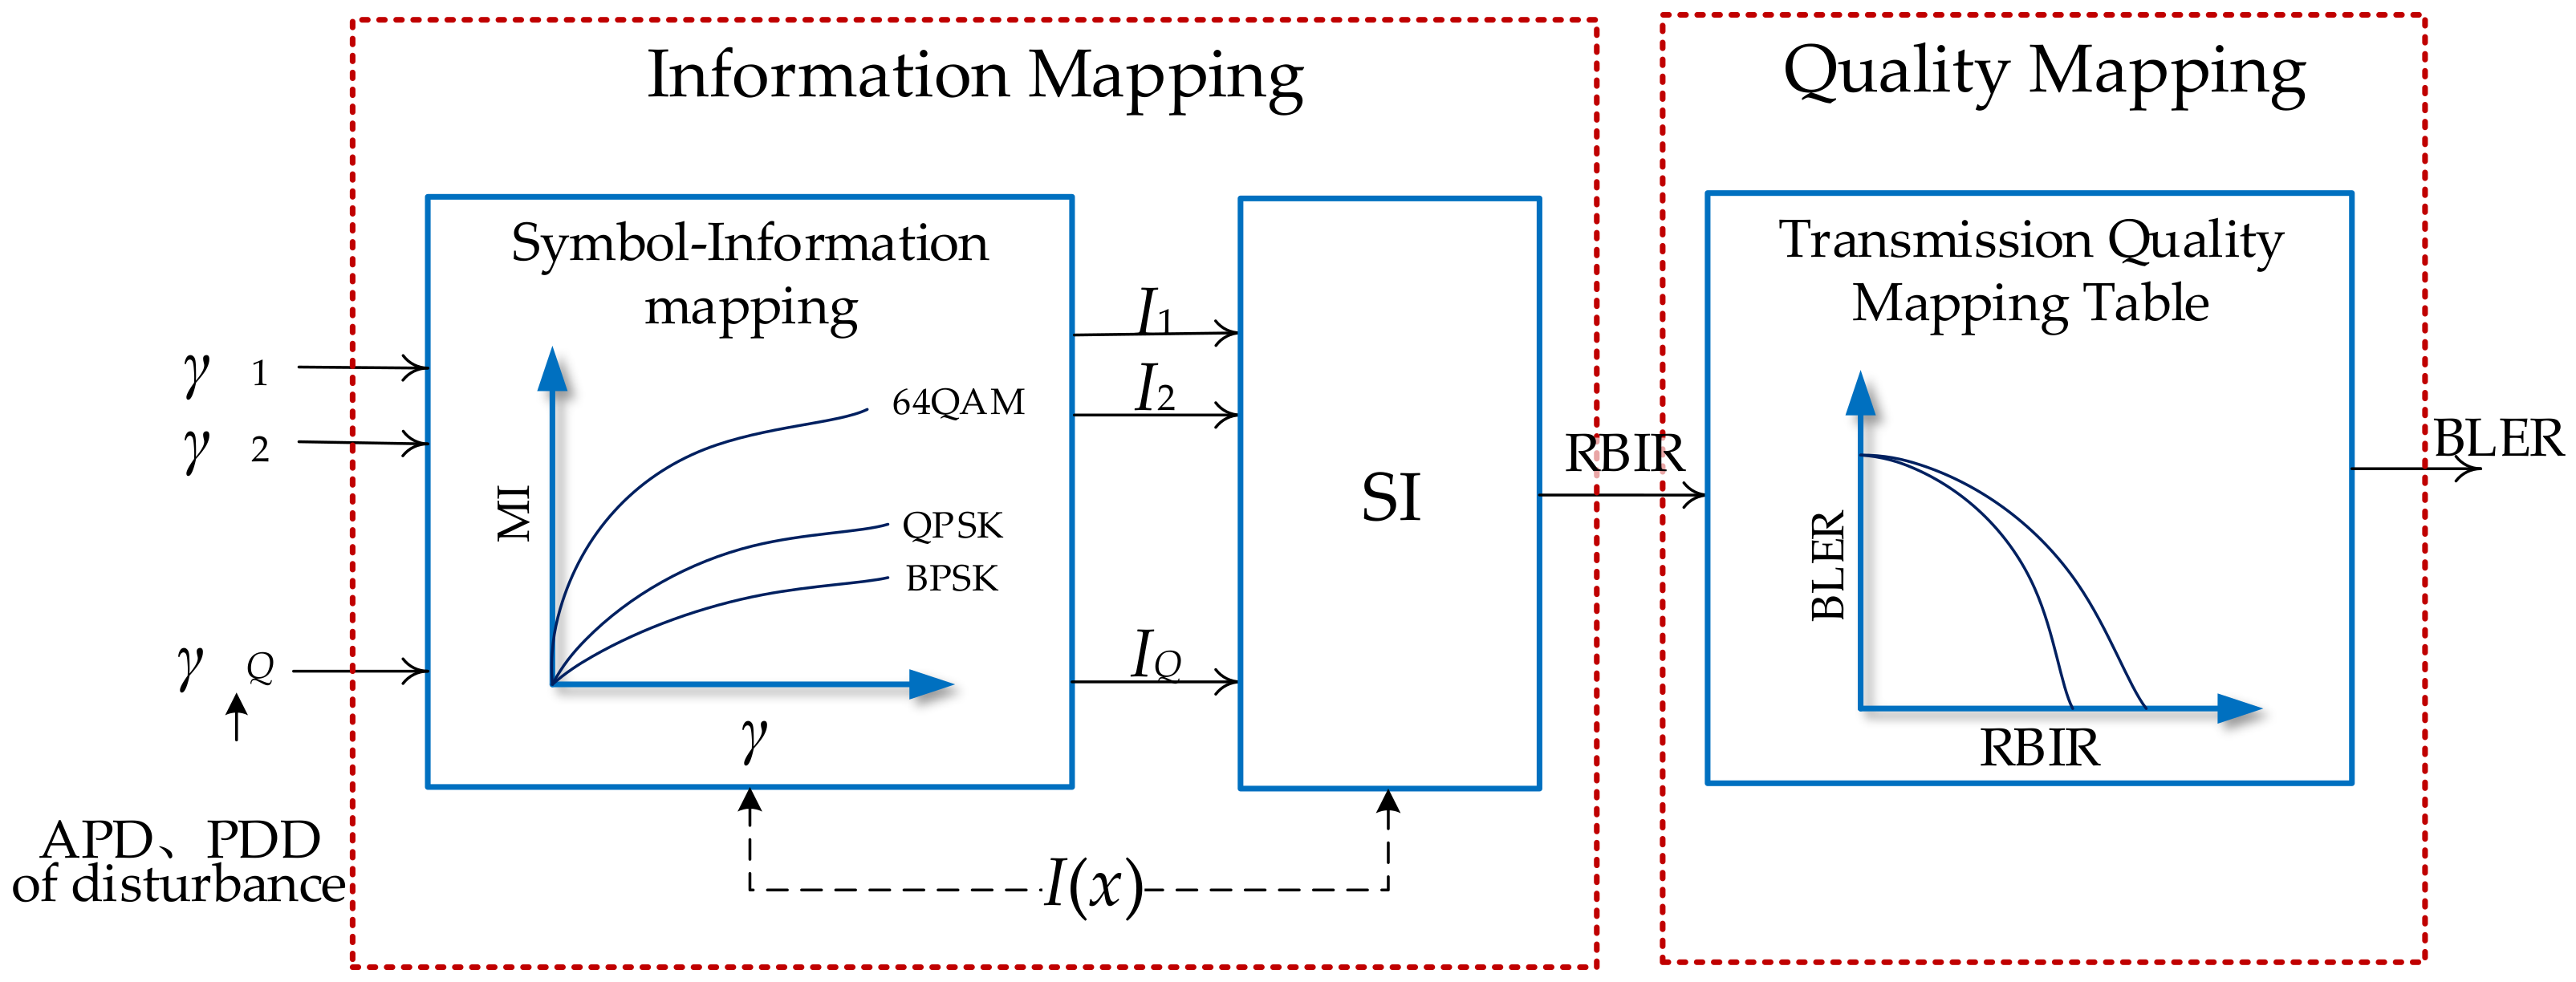
3.1. Information Mapping Based on MI-ESM

Assuming that an information stream is encoded by some FEC codes into blocks of length Q symbols. Given the finite-alphabet transmitted constellation Q = {qi} (i = 1,2, …, M), the symbols of Q are chosen according to a uniform probability distribution. To evaluate the interference effect on a single code block, the mutual information-based quality model is shown in Figure 4.
For RSTT, each symbol of the received signal can be expressed as
y = h x + n
where h is the channel gain, x refers to the transmitted signal, and n refers to the stochastic disturbance in the HSR environment. The symbol mutual information (SI) of each symbol is defined as
S I = I X ; Y = i p y q i P ( q i ) log 2 p y q i p y d y
where qi represents the i-th (i = 1,2, …, M) symbol in the transmitted constellation Q .
To calculate the SI of a transmitted symbol, the corresponding SINR of this symbol should be determined in the first place. For modern FEC codes combined with interleaving technology, like turbo codes and low-density-parity-check (LDPC) codes, it is typically reasonable to assume a uniform distribution of the errors within a code block [28]. In order to deal with the problem of interleaved codes in a non-Gaussian channel, the block-fading channel model [29,30] is adopted. The block-fading channel represents a memoryless channel with random channel gain or random interference that is constant for a block of symbols, and then changes to a new independent value from a block to another [31]. That means, the SINR of each symbol in this block remains the same despite the burst noise. Therefore, the effective symbol SINR of the received symbol qi is:
γ i = q i 2 σ w 2 + σ A 2
where σw and σA refer to the standard deviation of AWGN and the pulsed interference, respectively. Since the background AWGN is relatively weak compared to the pulses, the effective noise power of this symbol can be estimated by the average power of noise during one code block:
σ e 2 = σ w 2 + σ A 2 0 n 2 · d A P D n n
where n is limited to the noise within a single code block length. To simplify the calculation, the signal information when transmitting symbol qi is approximate as [32]
S I i σ e , m = log 2 1 M j = 1 M exp d i j 2 / σ e 2 3 exp d i j 2 / 4 σ e 2
where m is the number of information bits that compose the i-th symbol, and dij denotes the Euclidean measure between the i-th and j-th signal points in the constellation Q .
Furthermore, RBIR is computed from the SI value of symbols comprising a code block [33], which is obtained from the SINR γk during one block. Thus, RBIR is given as [34]
R B I R = k = 1 Q S I γ k k = 1 Q m k = E S I k E m k
where SIk is the mutual information of the k-th (k = 1,2, …, Q) transmitted symbol in the block.

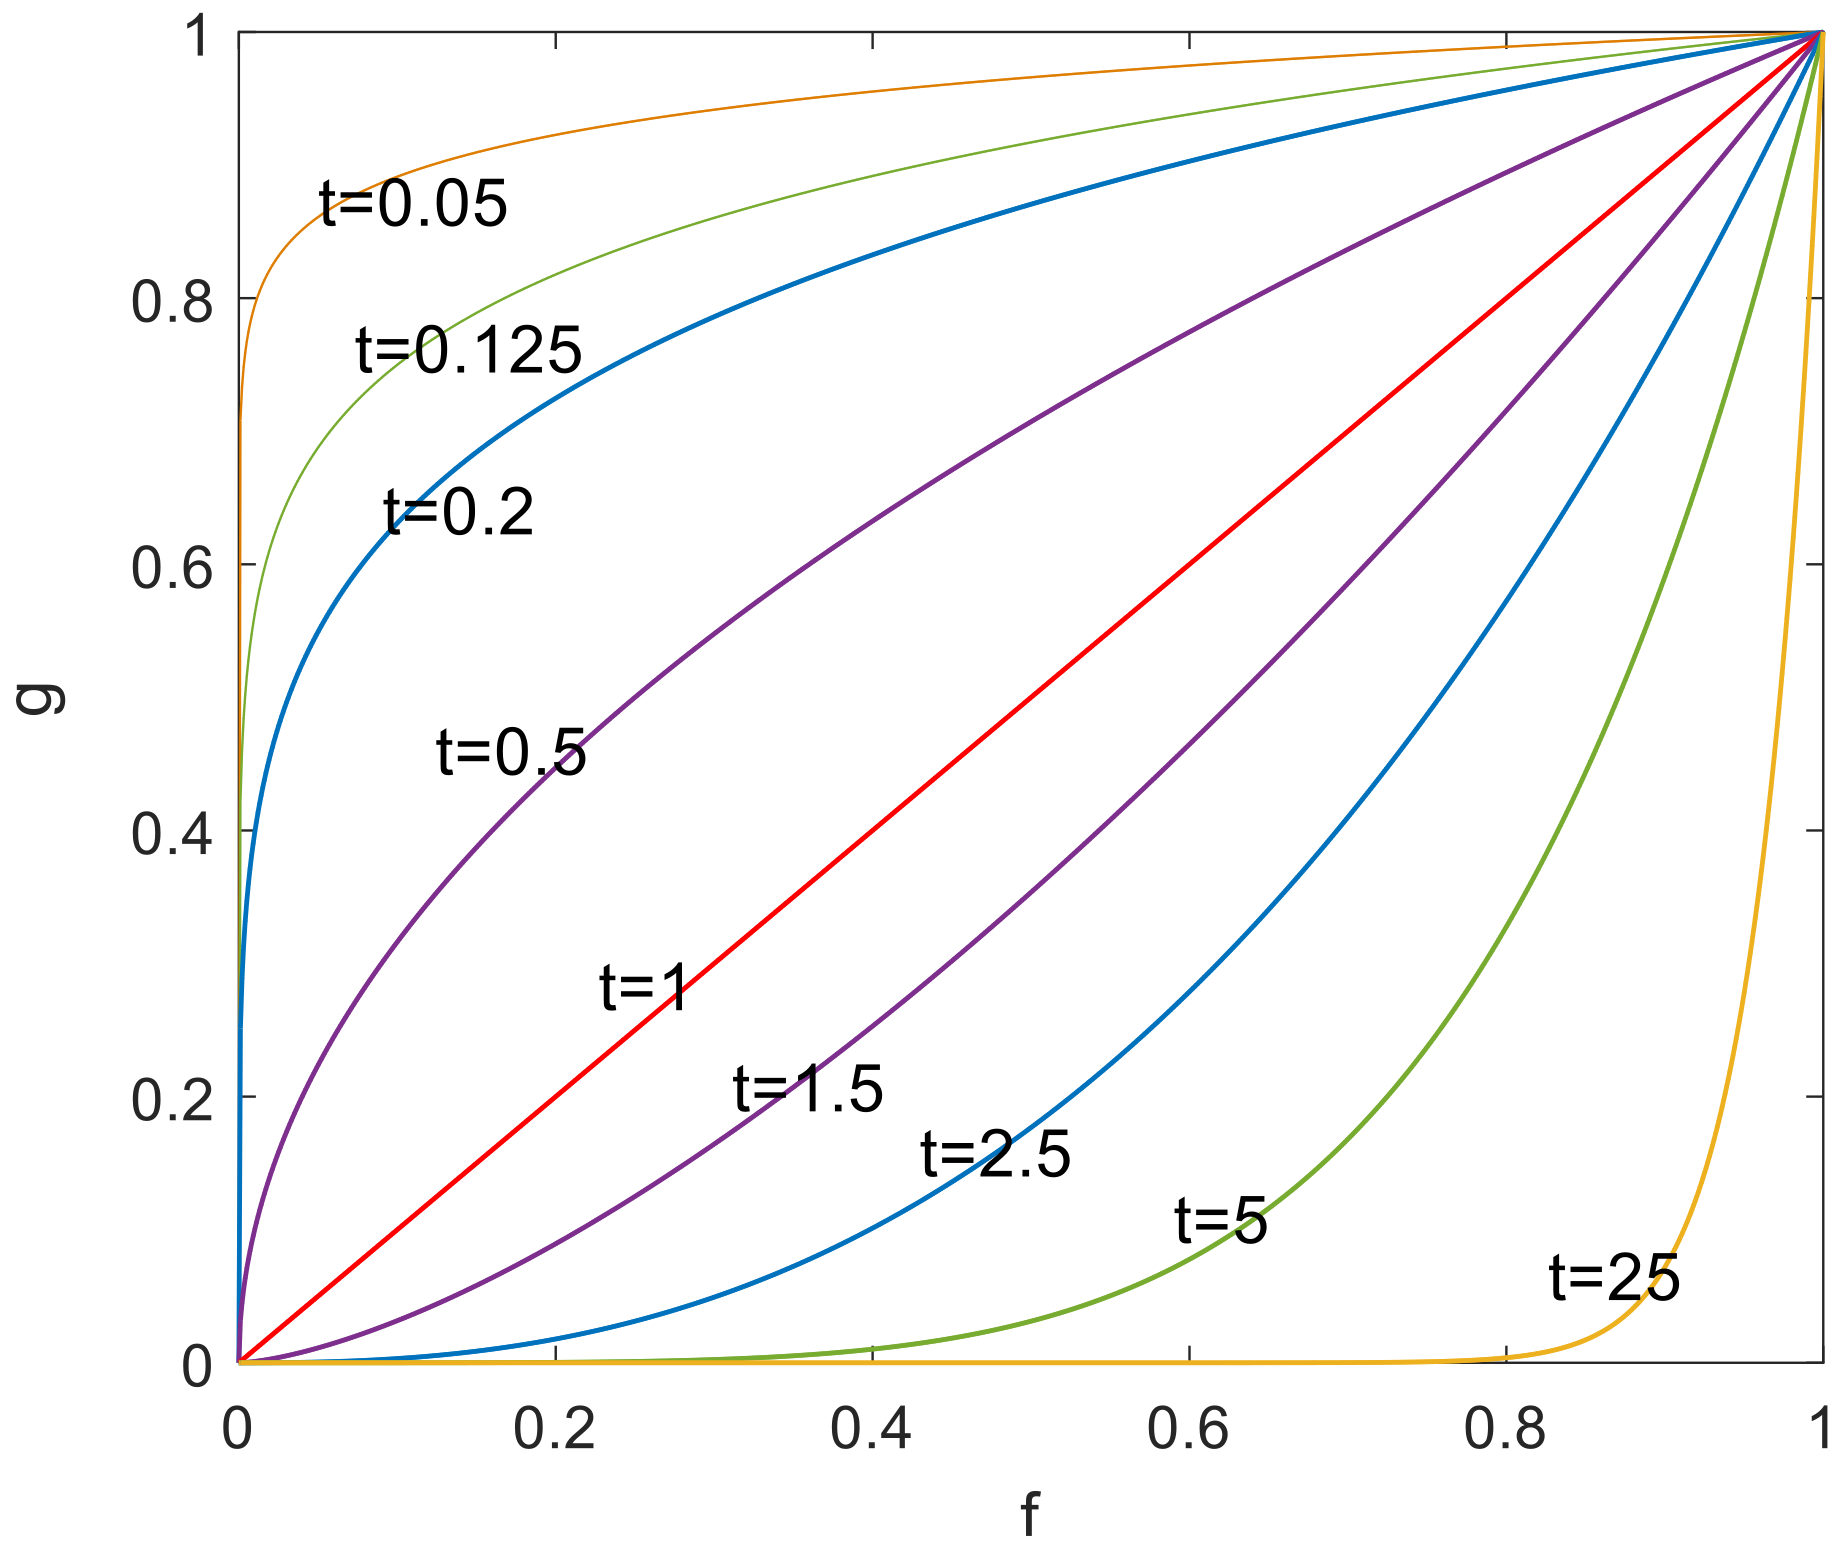
3.2. Long-Term Coded RBIR under Time-Varying Disturbance Based on Nonlinear Optimization

Assuming the number of code blocks affected during the interference is NBL and RBIR-to-BLER mapping in AWGN channel is fR2B(RBIR), the average BLER of these NBL blocks is denoted as B L E R a v e = i = 1 N B L f R 2 B R B I R i N B L . To guarantee the validity of dynamic equivalence, RBIRL is defined as the inverse mapping of BLERave in the AWGN channel, expressed as
R B I R L f R 2 B 1 B L E R a v e
Given the RBIR series of each code blocks under the disturbance, i.e., {RBIRi} (i = 1,2, …, NBL), the RBIRL of the radio receiver should be obtained by
R B I R L = 1 N B L i = 1 N B L β i R B I R i
where {βi} (i = 1,2, …, NBL) is the weighting coefficient of the i-th RBIR. Therefore, the major problem is to find a proper parameter {βi} that could map the RBIR of successive blocks to a long-term equivalent metric RBIRL.
As stated in (8), the RBIRL is closely related to fR2B(RBIR). Generally, it can be approximated as a parametric function related to the encoding parameters such as the block size and coding rate (BCR) [32], expressed as
B L E R = f R 2 B R B I R = 0.5 e r f c R B I R b B C R 2 c c o d c B C R
where erfc(x) stands for the Gaussian complementary error function. The parameters bBCR and cBCR mainly depend on the code rate and block size, respectively, while the adjusting factor ccod denotes the practical coding loss from the Shannon limit determined by the type of channel codes [27]. Due to the nonlinearity of erfc(x), it is appropriate to apply the optimally nonlinear weighting method [35] so as to achieve the coefficients {βi}. Intuitively, code blocks with different RBIR make a different contribution to BLERave, so βi cannot have a linear relation with BLER. Therefore, to specify the relation between RBIR and βi, a parametric function g(fR2B(RBIR),t) is brought in to describe the contribution of the i-th block, where the argument t is the key factor that determines the degree of nonlinear. In this problem, function g is defined as
g = f R 2 B R B I R , t t = f R 2 B t ,   t 0 ,
The function g is illustrated in Figure 5. As is shown, in the case of t = 1, β is in proportion to fR2B(RBIR), just referring to the linear relation. As for t > 1, the data block with the worse error performance has a higher weight, and vice versa. In fact, t is mainly dependent on the function fR2B(RBIR) other than the value of RBIR [35].
Therefore, the weighting coefficient βi is in the form of:
β i = g i k = 1 N B L g k = f R 2 B t R B I R i k = 1 N B L f R 2 B t R B I R k
The error between the estimated BLER from the RBIRL and the exact BLERave is expressed as e = B L E R a v e f R 2 B R B I R L . Based on MSE (minimum squared error) principle, {βi} is determine by
β i = arg min t 0 ,   e 2 = arg min t 0 , i = 1 N B L f R 2 B R B I R i N B L f R 2 B i = 1 N B L f R 2 B t R B I R i R B I R i N B L k = 1 N B L f R 2 B t R B I R k 2
(13) reaches the optimal solution when de2/dt = 0. It is very difficult to get the accurate analytical solution of t in consideration of erfc(x), so we turned to approximate the numeric results instead.
Assuming that fR2B(x) = 0.5erfc(x), Figure 6 shows the value of the BLER MSE as the variation of t, when {RBIRi} obey different distributions. It indicates that t = 0.26–0.28 when the squared error reaches the minimum, irrelevant with the number of blocks. Therefore, we specify t = 0.27 and the approving result is achieved.
Consequently, by substituting t = 0.27 into (12), the average long-term coded RBIRL is expressed as
R B I R L = i = 1 N B L R B I R i e r f c R B I R i b B C R 2 c c o d c B C R 0.27 i = 1 N B L e r f c R B I R i b B C R 2 c c o d c B C R 0.27

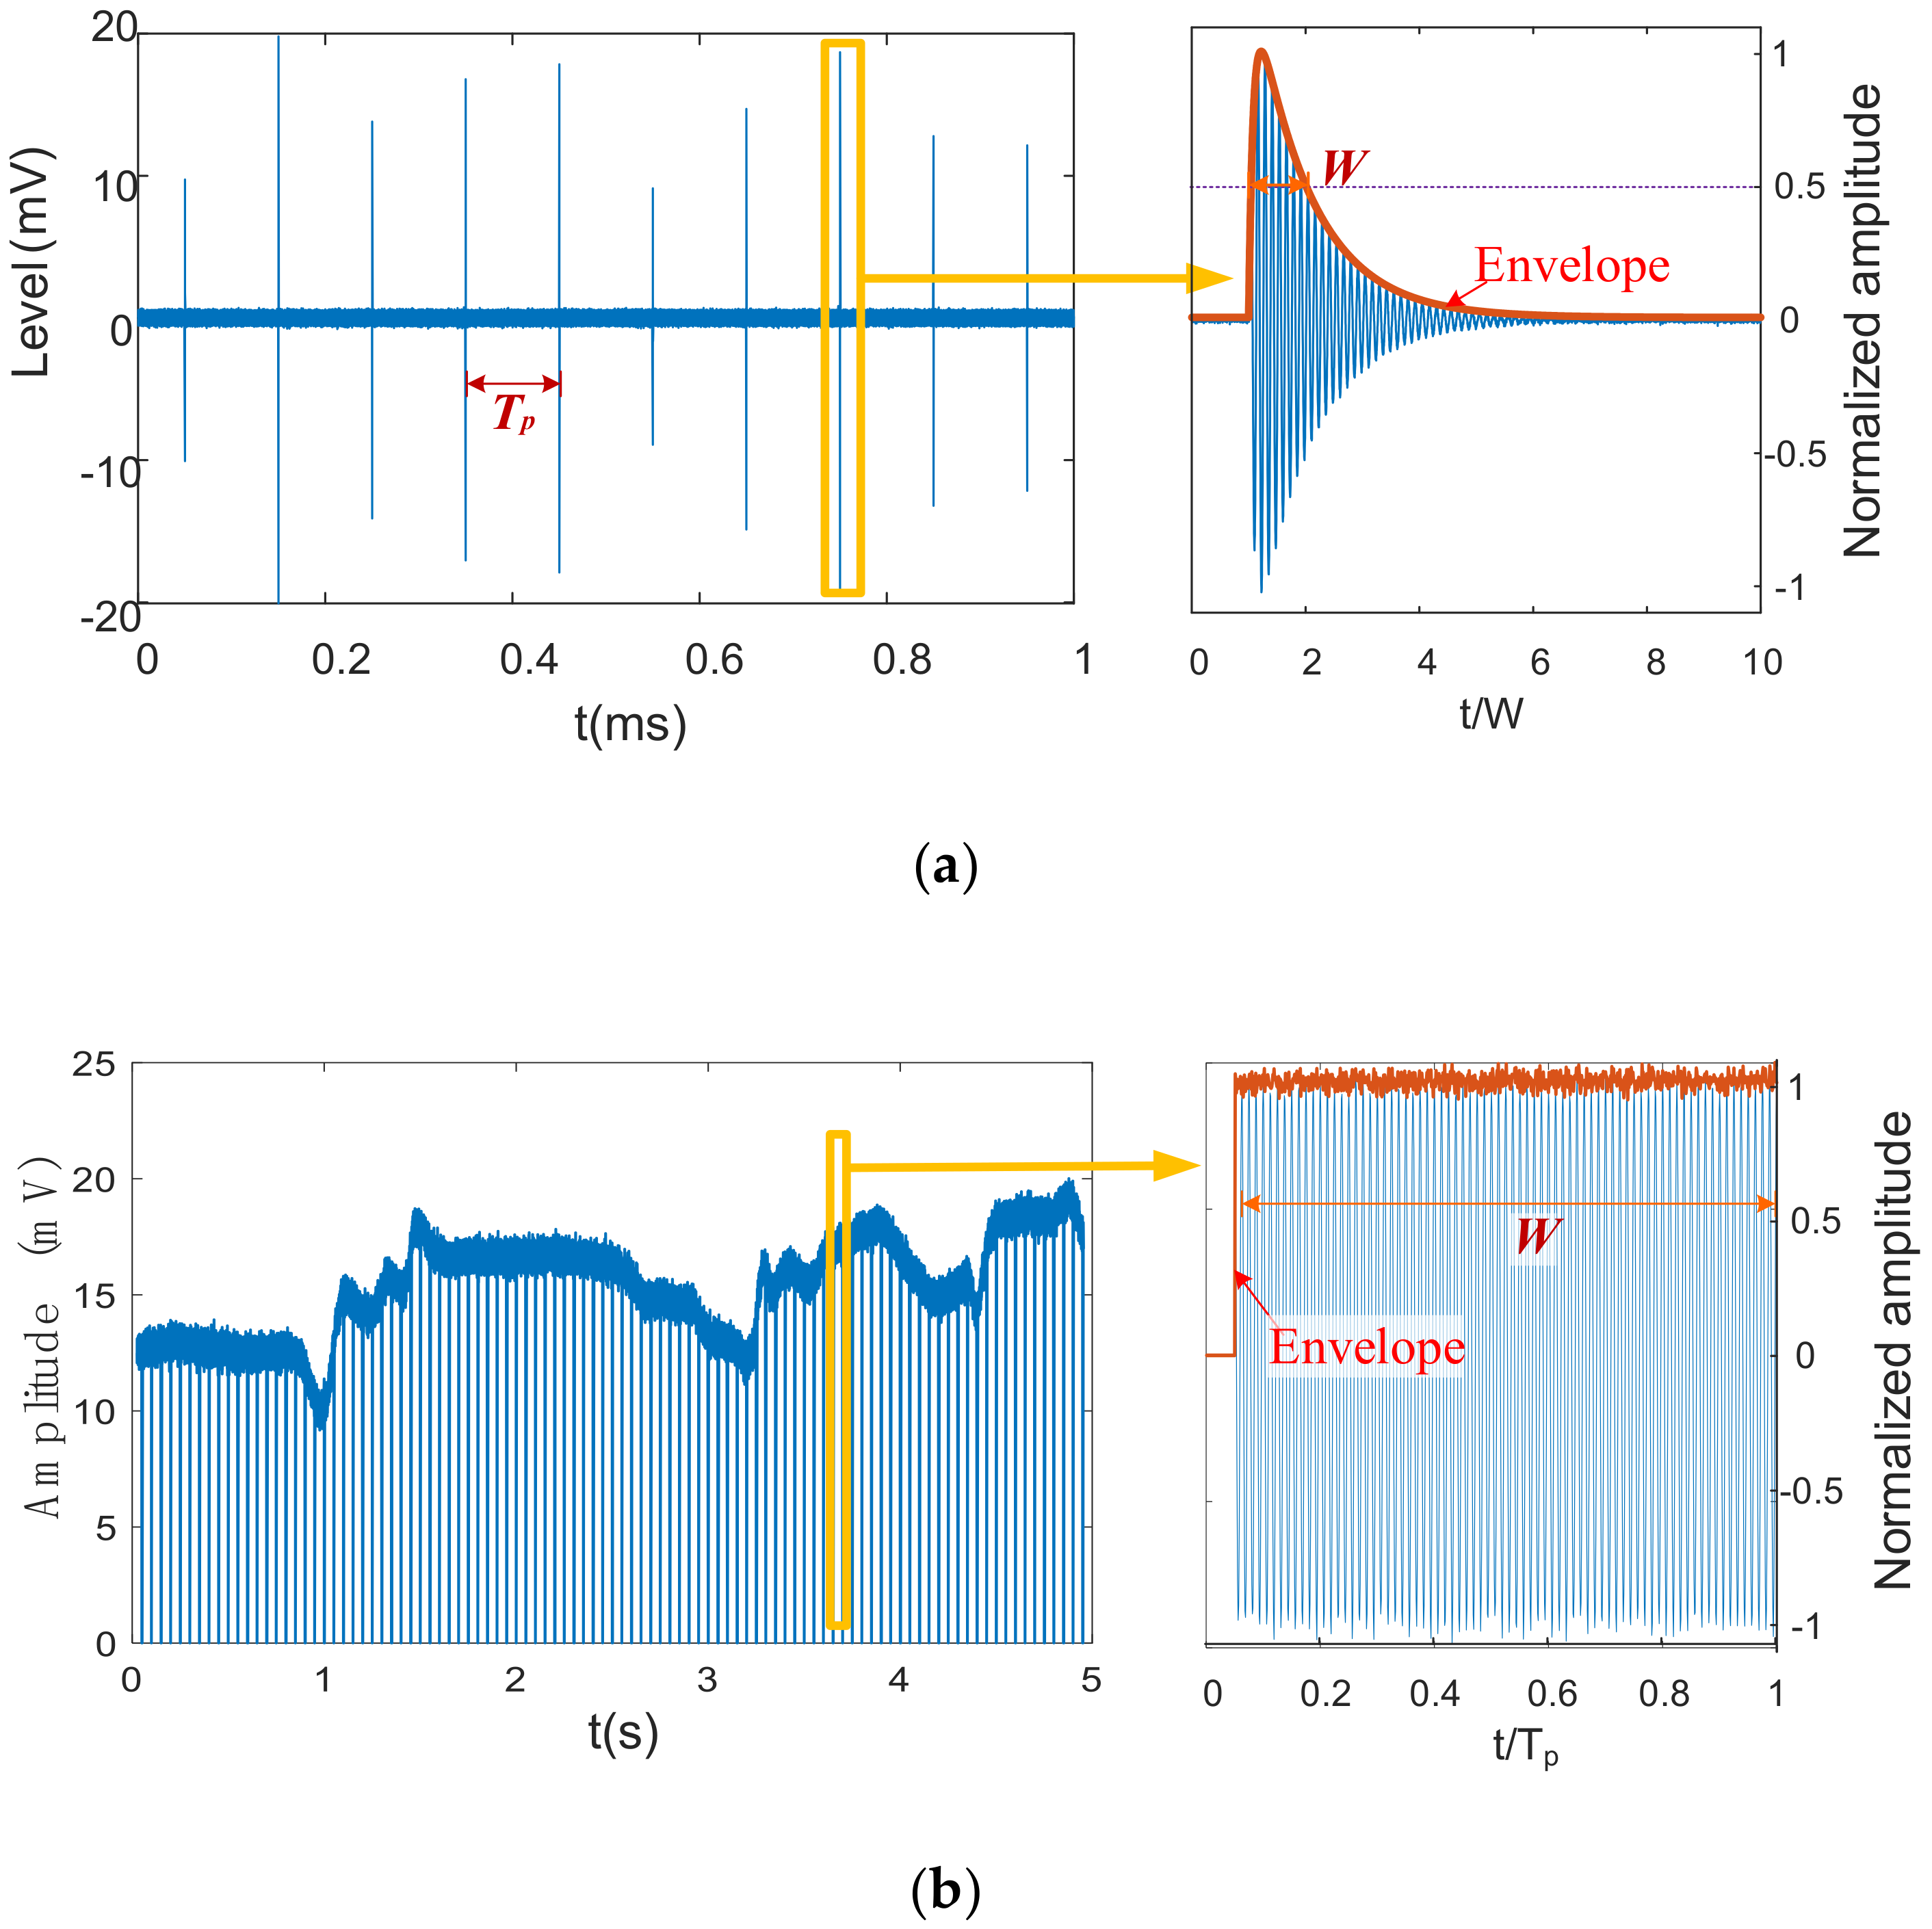
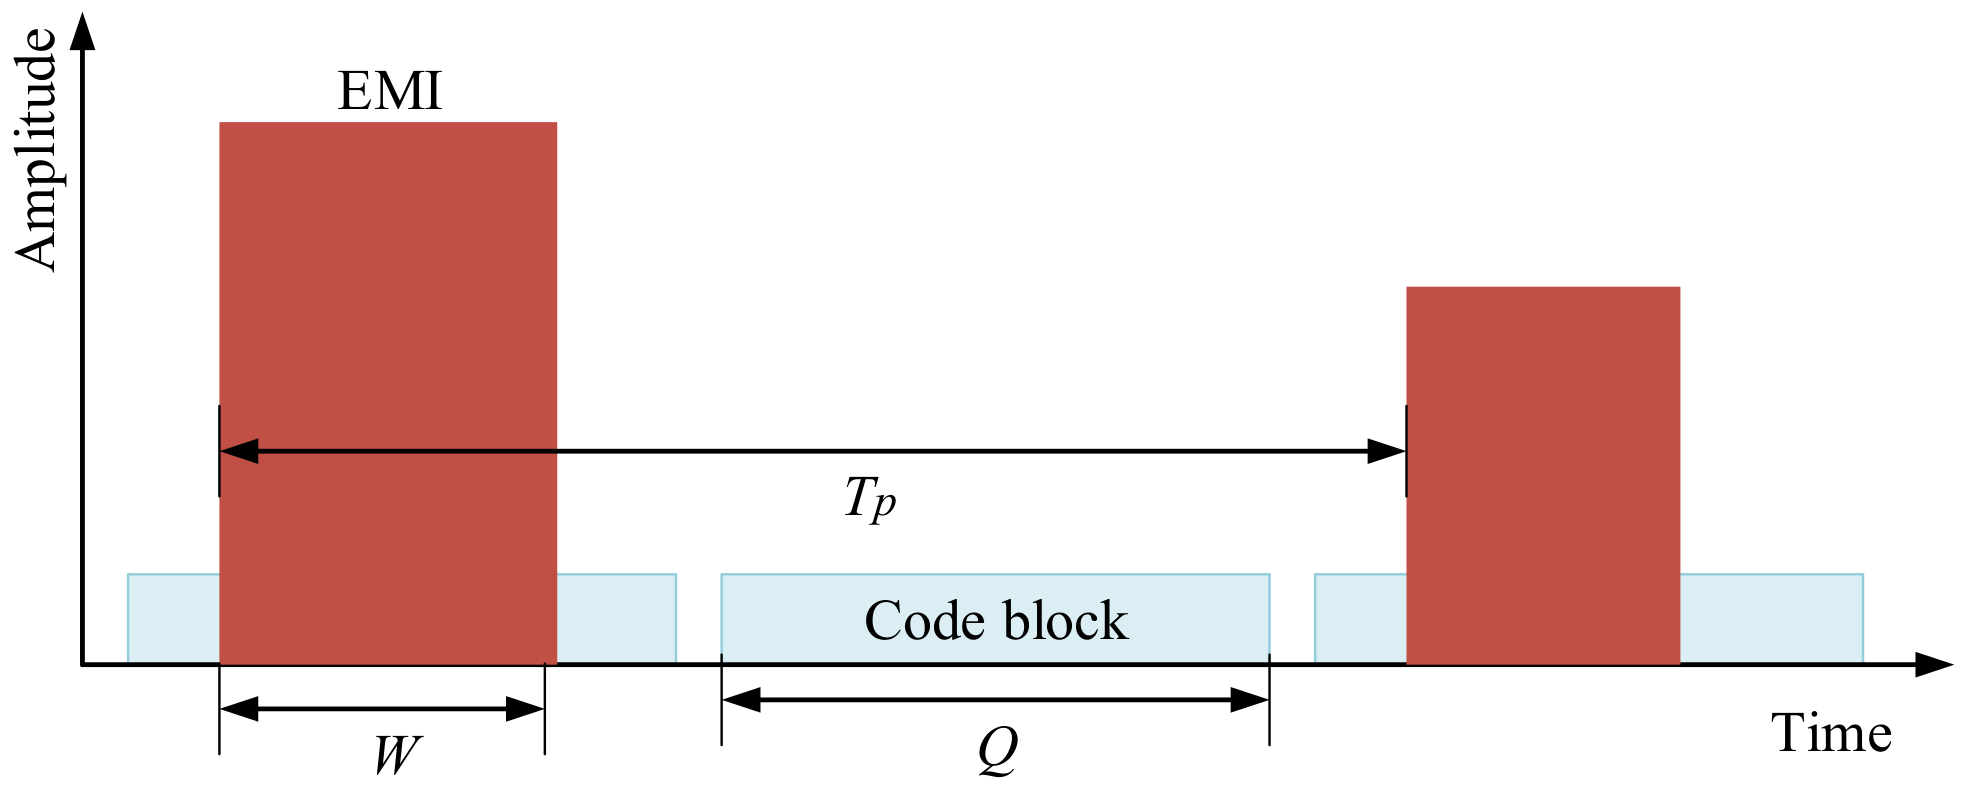
4. Impact on Encoded RSTT under Pulsed Disturbances in HSR Environment

In this section, the impact of pulsed disturbances on the encoded railway radio transmission is analyzed. Each RBIR(σe) value of the received signal and its corresponding probability is analyzed, based on the statistical characteristics of disturbances, and the RBIRL is obtained according to (14). Thus, the BLER of the on-board receiver is then achieved as a metric of radio transmission performance through the RBIRL.
As for the pulsed disturbances affecting the RSTT, the width mainly depends on the time-domain property of the sources, while the amplitude is also influenced by the coupling path. As a result, the amplitude is usually arbitrarily distributed without specific rules, and the width is discretely distributed. Therefore, the bursts could be grouped according to the pulse width {Wi}(i = 0,1, …, NW), where Wi = 0 refers to the AWGN, and the amplitude of pulses in each group is arbitrarily distributed. Given the time allowance θ, the probability of each burst set whose pulse width W W i θ , W i + θ is:
p i = Pr W i θ < W < W i + θ = 0 W i θ W i + θ d P D D r , τ d A P D r
and the corresponding APD of each burst set is:
A P D W i r = r W i θ W i + θ d P D D r , τ d A P D r 0 W i θ W i + θ d P D D r , τ d A P D r
Since the sum of the interference power in one code block determines the actual transmission error, and the relative position of burst hardly affects the error-correcting capability of the FEC encoding [36], the pulse length and amplitude in every code block under n(t) should be analyzed to obtain the RBIR value. As for the RBIR of blocks containing pulsed interference, the number, the width and the amplitude of the bursts in one block are crucial factors. To distinguish the situation where affected blocks containing a different number of bursts, the relation between Tp and code block length Q should be taken into account. Thus, the calculation of RBIRL is discussed in the following three cases.
  • Case TpQ
As shown in Figure 7, each code block contains almost one burst, and the ratio of the block that contains a burst with the pulse width Wi is:
α i = p i 1 p 0 , i = 1 , 2 , N W 0 , i = 0
the effective noise of blocks which contain a burst with a pulse width Wi and amplitude r is:
σ e W i , r = Q W i Q 0 r 2 · d A P D W 0 r + W i Q r 2
2.
Case Tp >> Q
As shown in Figure 8, there is a chance that some blocks are not influenced by the pulses, and their probability is α0, with the noise power to be σ 0 2 = 0 r 2 · d A P D W 0 r . The other code blocks contain only one burst, so the ratio of the blocks that contain a burst with width Wi is αi, expressed as
α i = Q p i T p 1 p 0 , i = 1 , 2 , N W 1 Q T p , i = 0
and the corresponding effective value of noise is the same with (18).
3.
Case Tp << Q
As shown in Figure 9, the number of bursts in one code block is almost K = Q / T p , where x denotes the smallest integer greater than or equal to x. It is assumed that the width and amplitude of bursts in the one block is the same. Therefore, the ratio of the blocks that contain bursts with the pulse width Wi is the same with (19), and the effective noise of the blocks that contain a burst with a pulse width Wi and an amplitude r is:
σ e K W i , r = Q K W i Q 0 r 2 · d A P D W 0 r + K W i Q r 2
Generally, the total RBIRL during n(t) is expressed as
R B I R L = i = 0 N W α i r R B I R σ e W i , r e r f c R B I R σ e W i , r b B C R 2 c B C R c c o d 0.27 d A P D W i r i = 1 N W α i r e r f c R B I R σ e W i , r b B C R 2 c B C R c c o d 0.27 d A P D W i r
where ccod, bBCR and cBCR are decided by the coding scheme. In this way, the BLERave during the disturbance n(t) is obtained by (10).

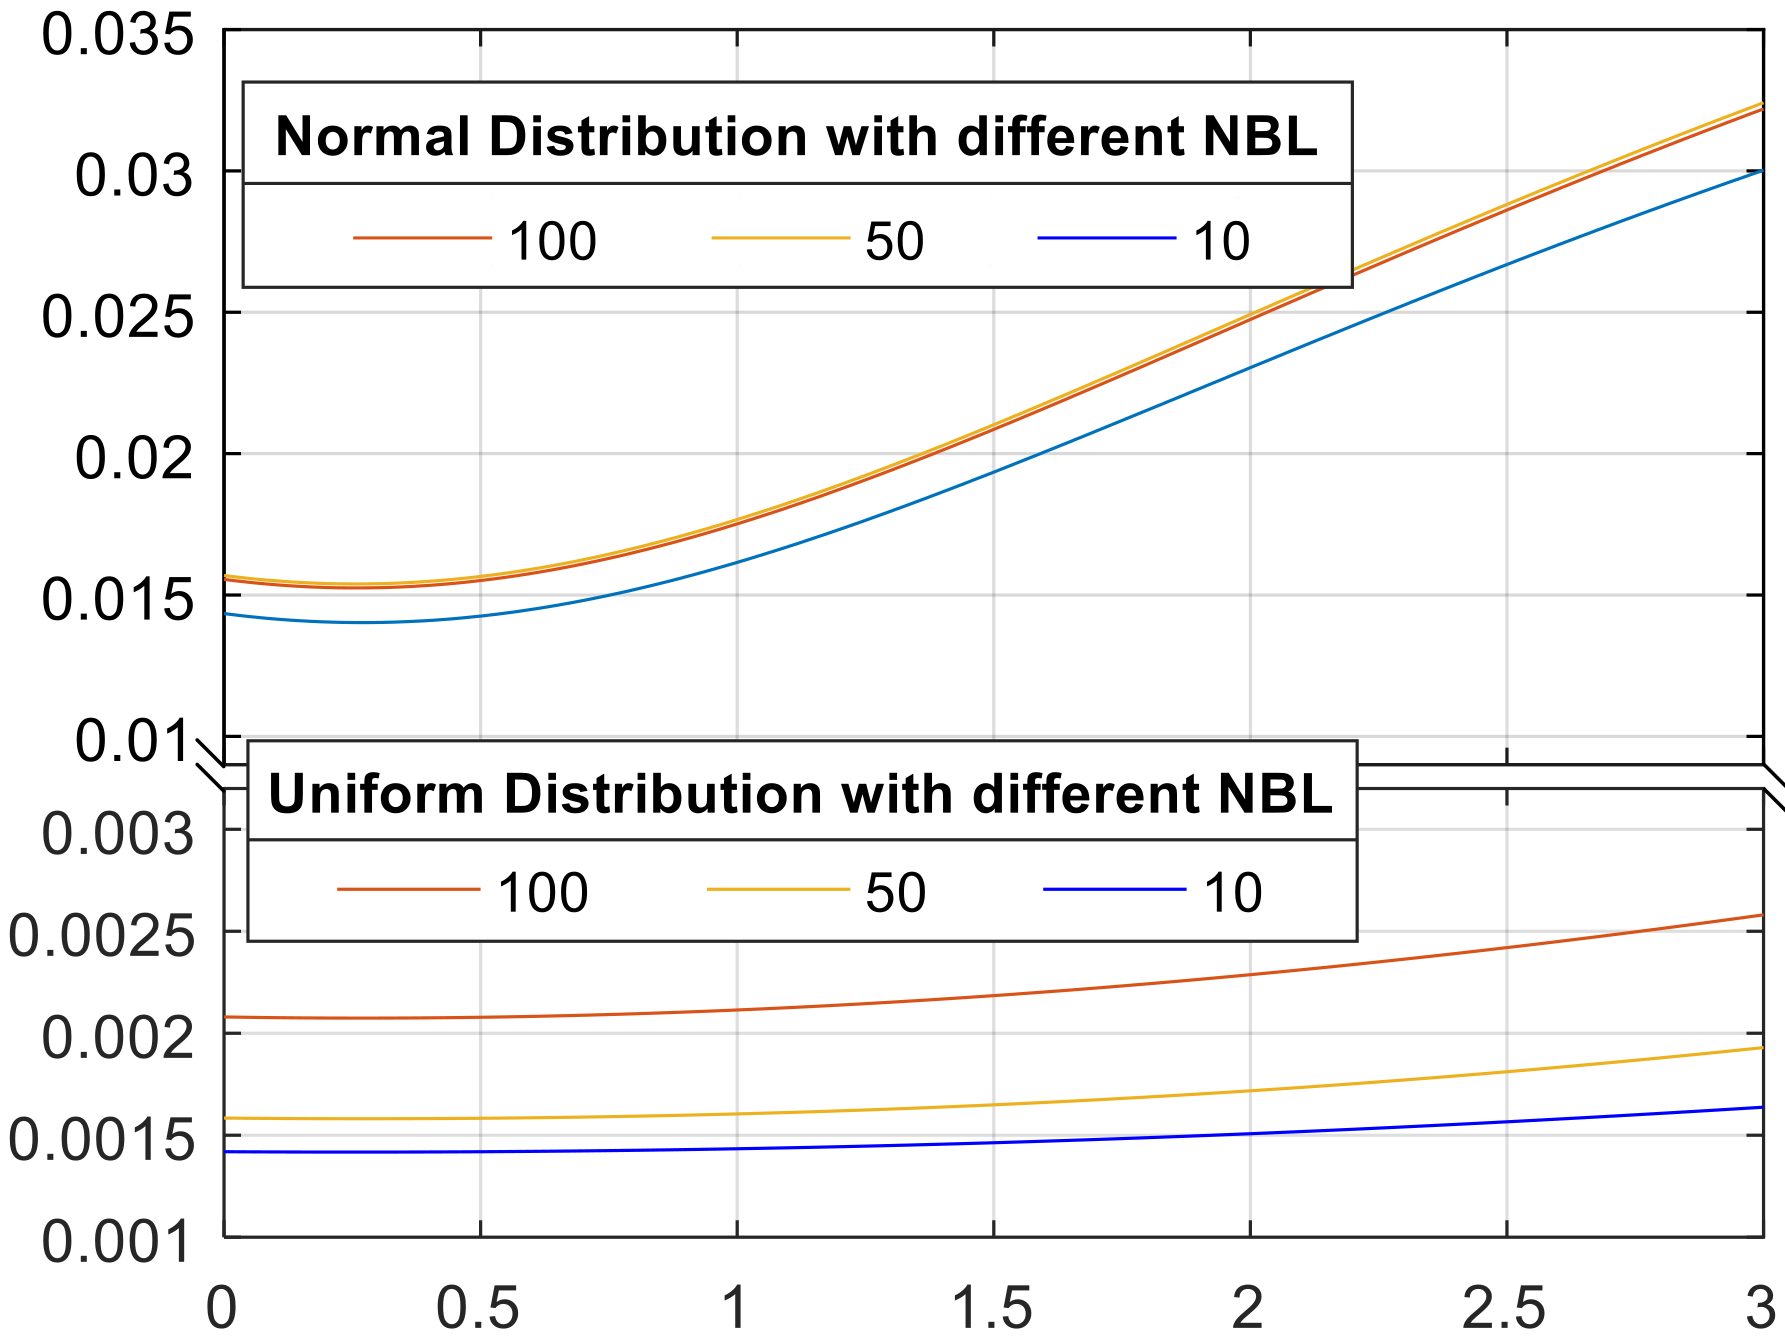
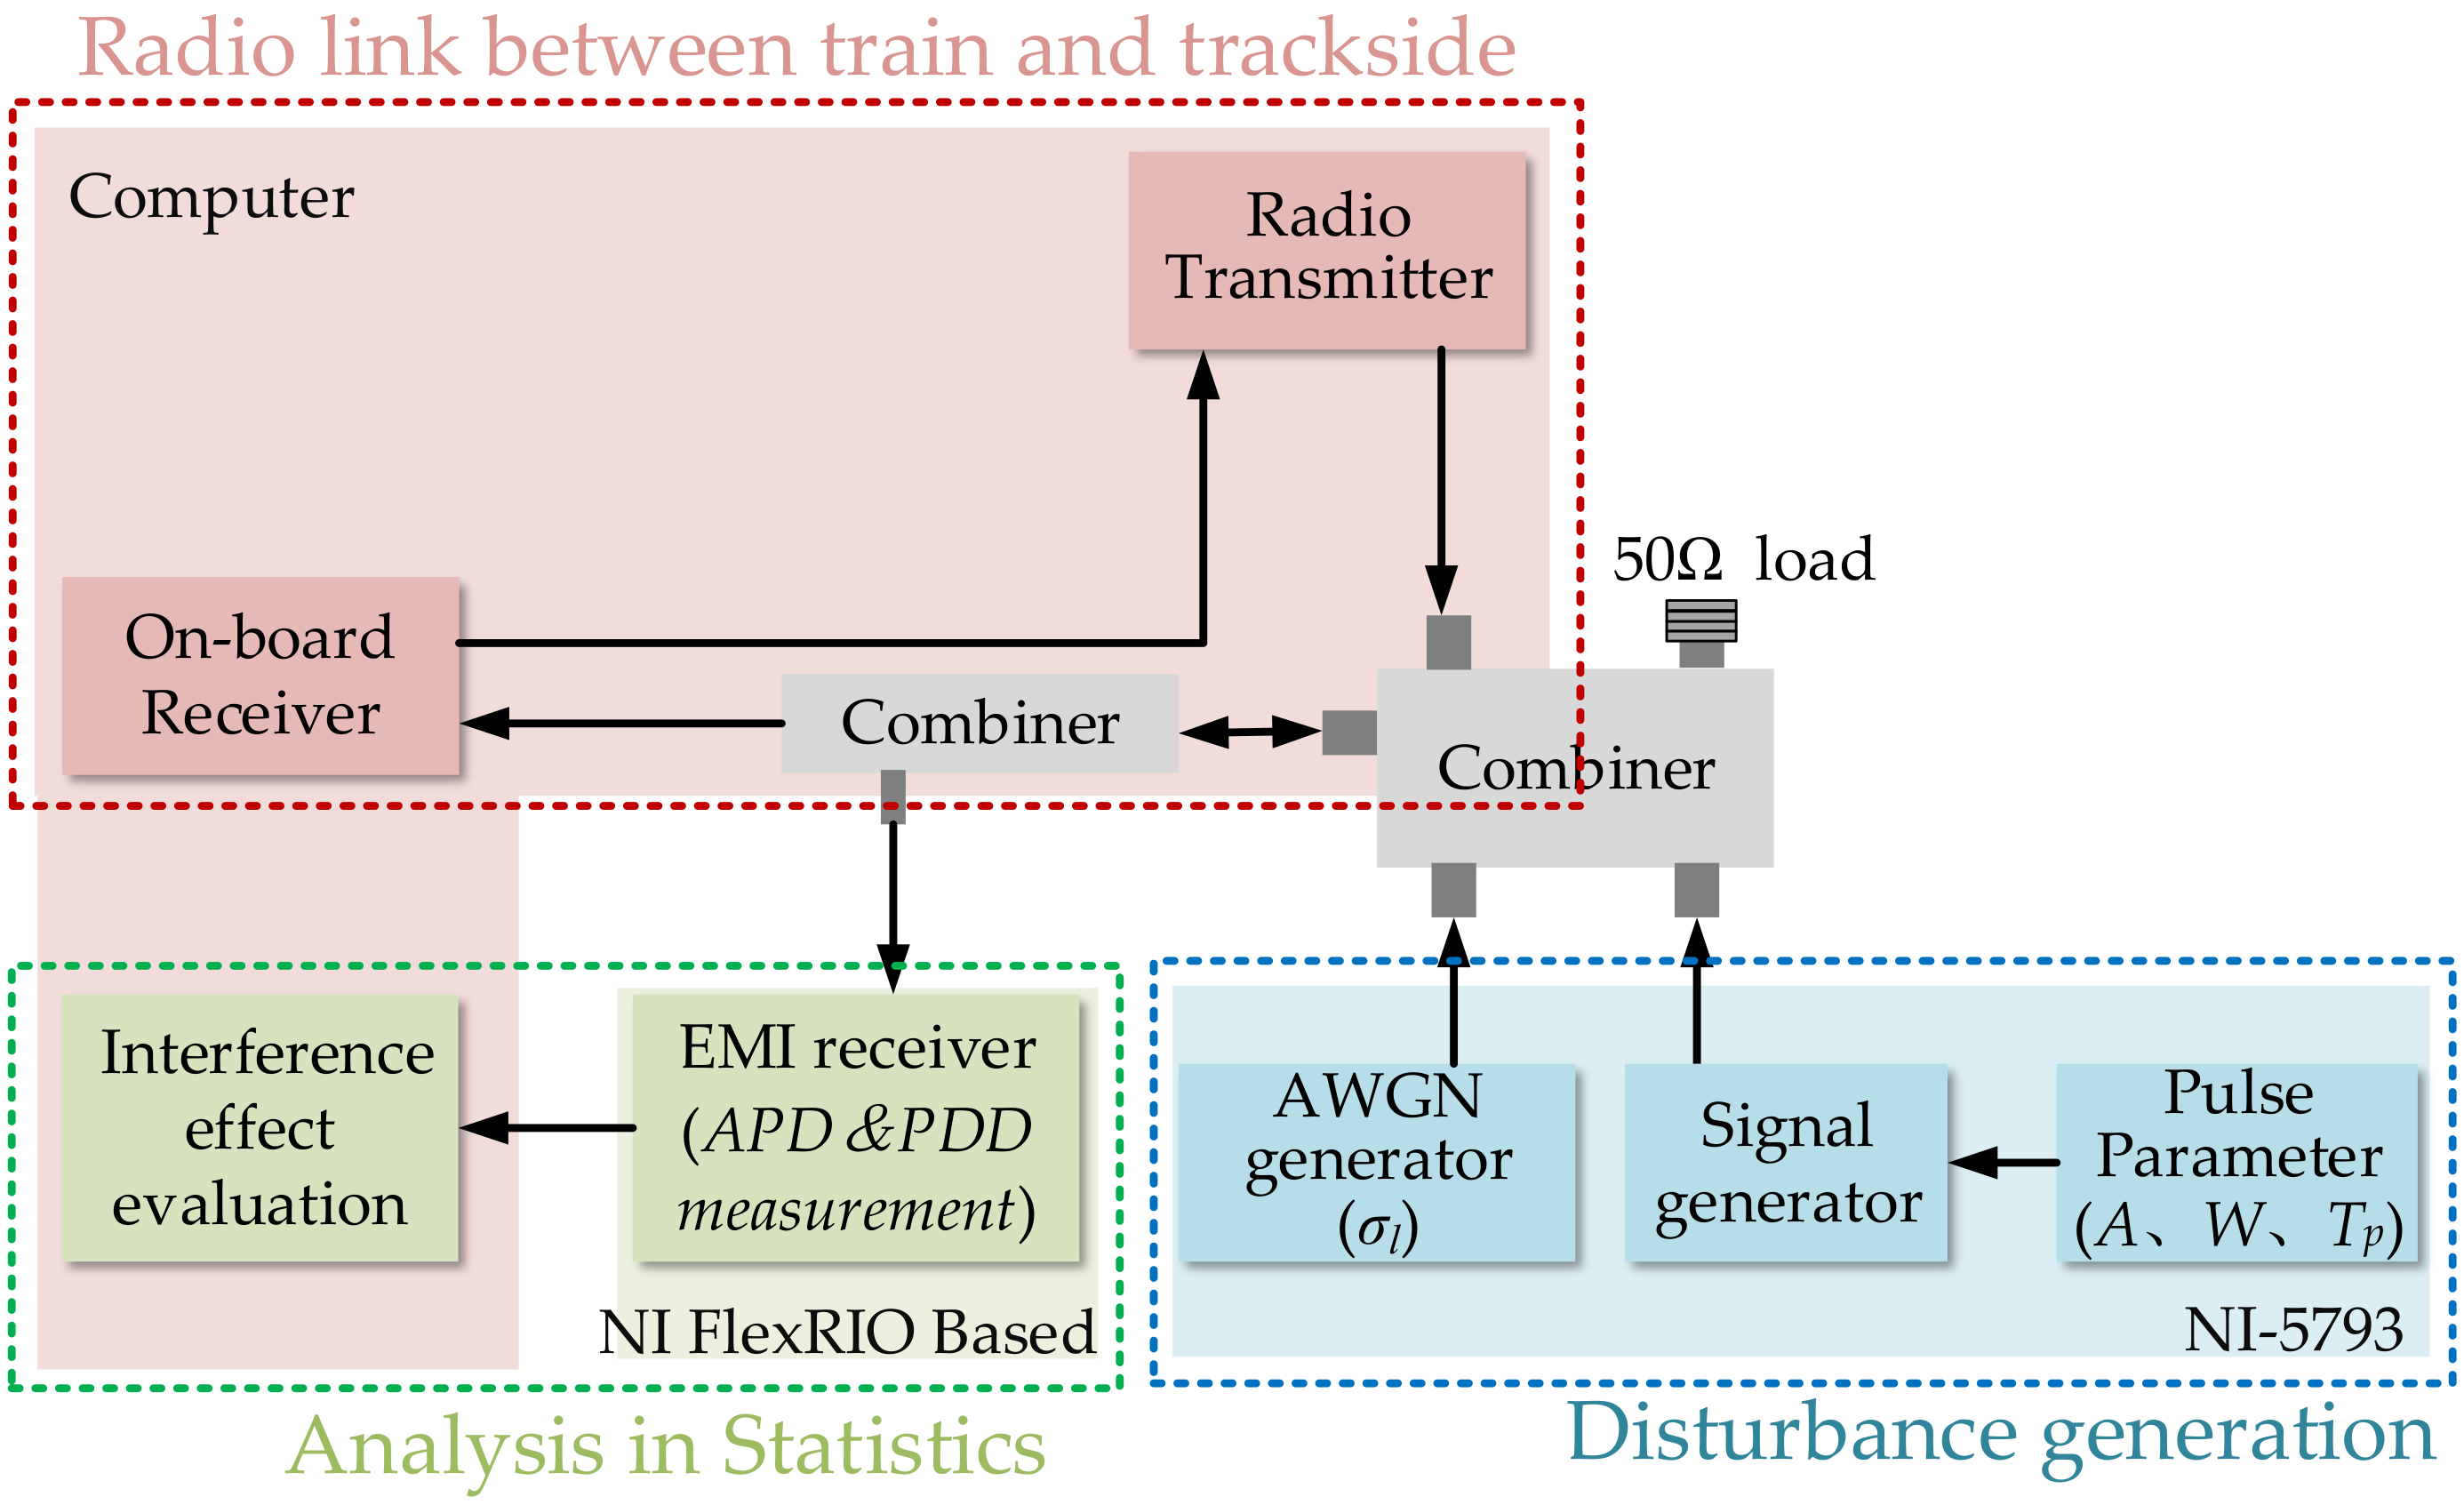
5. Simulation and Discussion

In this section, the hardware-in-the-loop simulation is used to verify the proposed method to evaluate the interference effect of the pulsed disturbances on RSTT. During this process, we assume that the intermediate-frequency filter of the APD measurement is the same as that of a radio receiver, and the channel symbols of one coding block are modulated in the same way.
The test bench employed in this simulation is presented in Figure 10, aiming to test the interference effect of RSTT in a high-speed railway environment.
  • The radio transmission is established in the MATLAB (MathWorks, Natick, Massachusetts, USA, version R2016b) simulation platform of the computer, as well as the performance evaluation based on statistics;
  • The EM disturbance is generated by the National Instruments (NI) NI-5793 radiofrequency transmitter (National Instruments, Austin, Texas, USA) adapter module, which can generate arbitrary waveform;
  • The EMI receiver is built on NI FlexRIO architectures, composed of PXIe-1082 chassis, NI 5792 radiofrequency receiver adapter module, PXIe-7966R FPGA module and PXIe-8135 PXI Controller.
The signal generator produces pulses with the amplitude of A, the width of W and the repetition cycle of Tp, and the pulses and the AWGN make up the mixed disturbance coupled to the radio transmission. Without a loss of generality, we assume A obeys Gaussian distribution with the variance of σh2, and the variance of is AWGN σl2. Thus, the APD curve of the mixed disturbance is demonstrated as
A P D n n = ρ erf n 2 σ h + 1 ρ erf n 2 σ l
where ρ = W/Tp refers to the duty ratio of the pulses. An example of the pulsed disturbance is shown in Figure 11 when σl = 1, σh = 10, and ρ = 0.1. In particular, the APD curves of interferences are the same if they have equal ρ, σl and σh, so they can be distinguished by PDD under this circumstance, as illustrated in Figure 12.
In order to cover the typical cases of interfered encoded RSTT, the interference effect of disturbances with different statistical characteristics in the time domain should be taken into consideration. Nowadays, a turbo code specified by the 3rd Generation Partnership Project (3GPP) is widely used in GSM-R and LTE-R systems. Besides, the LDPC code is now used in WLAN and will be applied to 5G-R. Therefore, these popular FEC coding schemes are used in this simulation. As for the disturbances, we set the signal-to-noise ratio of AWGN to be constant SNRl = −5 dB, and observed the predicted transmission error at each σh level, with a different W and Tp. According to the analysis above, we set the block-length to be Q = 256 symbols and the pulse cycle to be Tp = 0.1Q, Tp = 1.5Q, Tp = 20Q with a duty ratio of ρ = 0.1 and ρ = 0.9, corresponding to disturbances from different sources. The BLER performance is estimated by a dynamic MI-based model. For each transmitted symbol, the varying SINR values caused by pulsed disturbances are mapped to instantaneous RBIR by the basic MI-based model. The statistics of block errors are collected and the effective RBIRL is computed to look up the BLER from the AWGN curve.
Figure 13 shows the simulated results of a rate-2/3 turbo code with 16QAM radio signal in the case of ρ = 0.1 and ρ = 0.9, respectively, and Figure 14 shows the simulated results of LDPC code. From Figure 13a, although the interferences of different repetition cycles have the same APD when SNRh = 2 dB, the difference between their BLER is as large as almost two orders of magnitude. Therefore, a single APD parameter is not sufficient to evaluate the performance accurately, and may result in considerable errors. In addition, comparing Figure 13a,b, we can see that the smaller the duty ratio is, the larger error the APD method leads to, which is caused by the assumption of a uniform distribution of errors within a code word.
We can see that estimated BLER curves based on the MI-based model are close to the actual decoding error rate. As shown in Figure 13a, the maximum SINR errors at 1% BLER with different Tp are 1.2, 0.8 and 0.05 dB respectively. That is to say, as for the RBIRL-based model, the evaluation error tends to decrease as the Tp increases, because the pulsed interference is more likely to be approximated as two independent AWGN parts, which reduces the accidental and incidental effect of the burst interferences.

6. Conclusions

As the EMI has been a major threat to the reliability of railway communication systems, this paper proposed a novel methodology to supervise the real-time performance of RSTT under disturbances in the HSR environment. Based on the joint statistical characteristics of pulsed interference, a dynamic MI model is proposed to predict the degradation of RSTT using FEC codes. This model transforms joint time-domain statistical characteristics, i.e., APD and PDD of disturbances, to an MI metric through which the average BLER is obtained. According to the simulation results, the method based on joint statistical characteristics is valid under different interferences, even if they have the same distribution of amplitude, and the maximum estimated SINR errors at 1% BLER are no greater than 1.2 dB. That is to say, this method is effective in more complex situations where transmitted signals with various MCSs are affected with different disturbances, as shown in Table 1. Moreover, since this method does not require prior statistical information of the disturbance, it has the potential to be applied to the performance evaluation of disturbances in more practical applications, such as real-time supervising, risk analysis and early warning in the future.

Author Contributions

Conceptualization, J.Z., Y.W. and X.G.; methodology, J.Z. and X.G.; validation, J.Z. and X.G.; investigation, J.Z. and Y.W.; writing—original draft preparation, X.G.; writing—review and editing, J.Z., Y.W., and D.Z. All authors have read and agreed to the published version of the manuscript.

Funding

This research was funded by the National Natural Science Foundation of China (No. U1734203) and Beijing Municipal Science & Technology Commission (No. Z181100001018032).

Acknowledgments

The authors wish to thank the reviewers for their valuable comments and suggestions concerning this manuscript.

Conflicts of Interest

The authors declare no conflicts of interest.

References

  1. ITU. ITU-R M.2418-0 Description of Railway Radiocommunication Systems between Train and Trackside (RSTT); ITU: Geneva, Switzerland, 2017. [Google Scholar]
  2. UIC GSM-R Operators Group, UIC Code 951. GSM-R System Requirements Specification (SRS). In UIC Eirene Technology Report, Version 15.3.0; UIC: France, Paris, 2012. [Google Scholar]
  3. He, R.; Ai, B.; Wang, G.; Guan, K.; Zhong, Z.; Molisch, A.F.; Briso-Rodriguez, C.; Oestges, C.P. High-Speed Railway Communications: From GSM-R to LTE-R. IEEE Veh. Technol. Mag. 2016, 11, 49–58. [Google Scholar] [CrossRef]
  4. Pawlik, M.; Siergiejczyk, M.; Gago, S. European rail transport management system mobile transmission safety analysis. In Risk, Reliability and Safety: Innovating Theory and Practice; Walls, L., Revie, M., Bedford, T., Eds.; CRC Press: London, UK, 2017; pp. 1791–1794. [Google Scholar]
  5. RAIB. RAIB Report 11/2017 Derailment due to a Landslip, and Subsequent Collision; RAIB: Watford, UK, 2017.
  6. Johnsen, S.O.; Veen, M. Risk assessment and resilience of critical communication infrastructure in railways. Cognit. Technol. Work 2013, 15, 95–107. [Google Scholar] [CrossRef]
  7. EU. 2012/88/EU Commission Decision of 25 January 2012 on the Technical Specification for Interoperability Relating to the Control-Command and Signalling Subsystems of the Trans-European Rail System (Notified under Document C(2012) 172); Publications Office of the EU: Luxembourg, 2012. [Google Scholar]
  8. Ma, L.; Wen, Y.; Marvin, A.; Karadimou, E.; Armstrong, R.; Cao, H. A Novel Method for Calculating the Radiated Disturbance from Pantograph Arcing in High-Speed Railway. IEEE Trans. Veh. Technol. 2017, 66, 8734–8745. [Google Scholar] [CrossRef] [Green Version]
  9. UIC. 8736-2.0 Assessment Report on GSM-R Current and Future Radio Environment; International Union of Railways: Paris, France, 2014. [Google Scholar]
  10. Dudoyer, S.; Deniau, V.; Slimen, N.; Adriano, R. Susceptibility of the GSM-R transmissions to the railway electromagnetic environment. In Signalling and Security in Railway; Perpinya, X., Ed.; IntechOpen: London, UK, 2012; pp. 503–522. [Google Scholar]
  11. RAIB. RAIB Report 29/2014 Unauthorised Entry of a Train onto a Single Line at Greenford; RAIB: Watford, UK, 20 March 2014.
  12. UIC. UIC O-8740 Report on the UIC Interference Field Test Activities in UK; UIC: France, Paris, 2013. [Google Scholar]
  13. Dudoyer, S.; Deniau, V.; Ambellouis, S.; Heddebaut, M.; Mariscotti, A. Classification of Transient EM Noises Depending on their Effect on the Quality of GSM-R Reception. IEEE Trans. Electromagn. Compat. 2013, 55, 867–874. [Google Scholar] [CrossRef]
  14. Pous, M.; Azpúrua, M.A.; Silva, F. Measurement and Evaluation Techniques to Estimate the Degradation Produced by the Radiated Transients Interference to the GSM System. IEEE Trans. Electromagn. Compat. 2015, 57, 1382–1390. [Google Scholar] [CrossRef] [Green Version]
  15. Du, H.; Wen, C.; Li, W. A new method for detecting and early-warning in-band interference of the GSM-R network. In Proceedings of the IEEE 17th International Conference on Communication Technology (ICCT), Chengdu, China, 27–30 October 2017; pp. 800–804. [Google Scholar]
  16. International Electrotechnical Commission. CISPR 11:2015/AMD2:2019 Amendment 2, Industrial Scientific and Medical Equipment—Radio-Frequency Disturbance Characteristics—Limits and Methods of Measurement; International Electrotechnical Commission: Geneva, Switzerland, 2019. [Google Scholar]
  17. International Electrotechnical Commission. CISPR 16-1-1:2019 Specification for Radio Disturbance and Immunity Measuring Apparatus and Methods—Part 1-1: Radio Disturbance and Immunity Measuring Apparatus—Measuring Apparatus; International Electrotechnical Commission: Geneva, Switzerland, 2019. [Google Scholar]
  18. Matsumoto, Y.; Gotoh, K. An Expression for Maximum Bit Error Probability Using the Amplitude Probability Distribution of an Interfering Signal and Its Application to Emission Requirements. IEEE Trans. Electromagn. Compat. 2013, 55, 983–986. [Google Scholar] [CrossRef]
  19. Matsumoto, Y.; Wiklundh, K. Evaluation of Impact on Digital Radio Systems by Measuring Amplitude Probability Distribution of Interfering Noise. IEICE Trans. Commun. 2015, 98, 1143–1155. [Google Scholar] [CrossRef] [Green Version]
  20. Geng, X.; Wen, Y.; Zhang, J. An APD-Based Evaluation on the Effect of Transient Disturbance over Digital Transmission. Chin. J. Electron. 2020, 29, 57–65. [Google Scholar] [CrossRef]
  21. Tengstrand, S.Ö.; Axell, E.; Fors, K.; Linder, S.; Wiklundh, K. Efficient evaluation of communication system performance in complex interference situations. In International Symposium on Electromagnetic Compatibility; IEEE: Angers, France, 2017; pp. 1–6. [Google Scholar]
  22. Eliardsson, P.; Axell, E.; Komulainen, A.; Wiklundh, K.; Tengstrand, S.Ö. A Practical method for BEP estimation of convolutional coding in impulse noise environments. In Proceedings of the IEEE Military Communications Conference, Norfolk, VA, USA, 12–14 November 2019; pp. 1–6. [Google Scholar]
  23. Wiklundh, K.C. An approach to using amplitude probability distribution for emission limits to protect digital radio receivers using error-correction codes. IEEE Trans. Electromagn. Compat. 2010, 52, 223–229. [Google Scholar] [CrossRef]
  24. Ma, L. The Radiated Characteristics of Pantograph Arcing in High-Speed Railway. Ph.D. Thesis, Beijing Jiaotong University, Beijing, China, 2017. [Google Scholar]
  25. Midya, S.; Bormann, D.; Mazloom, Z.; Schutte, T.; Thottappillil, R. Conducted and radiated emission from pantograph arcing in AC traction system. In Proceedings of the IEEE Power & Energy Society General Meeting, Calgary, AB, Canada, 26–30 July 2009; pp. 1–8. [Google Scholar]
  26. Hammi, T.; Slimen, N.B.; Deniau, V.; Rioult, J.; Dudoyer, S. Comparison between GSM-R coverage level and EM noise level in railway environment. In Proceedings of the 9th International Conference on Intelligent Transport Systems Telecommunications, Lille, France, 20–22 October 2009; pp. 123–128. [Google Scholar]
  27. Lei, W.; Shiauhe, T.; Almgren, M. A fading-insensitive performance metric for a unified link quality model. In Proceedings of the IEEE Wireless Communications and Networking Conference, Las Vegas, NV, USA, 3–6 April 2006; pp. 2110–2114. [Google Scholar]
  28. Goldsmith, A. Wireless Communications, 4th ed.; Cambridge University Press: Cambridge, UK, 2005; pp. 214–244. [Google Scholar]
  29. Fabregas, A.; Caire, G. Coded modulation in the block-fading channel: Coding theorems and code construction. IEEE Trans. Inf. Theory 2006, 52, 91–114. [Google Scholar] [CrossRef]
  30. Goldsmith, A.; Medard, M. Capacity of Time-Varying Channels with Causal Channel Side Information. IEEE Trans. Inf. Theory 2007, 53, 881–899. [Google Scholar] [CrossRef] [Green Version]
  31. Zummo, S.A. Coding and Channel Estimation for Block Fading Channels. Ph.D. Thesis, University of Michigan, Ann Arbor, MI, USA, 2003. [Google Scholar]
  32. Zhang, J.; Chen, S.; He, Q. An Estimation of Achievable Rate for Digital Transmissions over MIMO Channels. Commun. Netw. 2015, 7, 8–12. [Google Scholar] [CrossRef] [Green Version]
  33. Zheng, H.; Wu, M.; Choi, Y.; Himayat, N.; Zhang, J.; Zhang, S.; Jalloul, L. Link performance abstraction for ML receivers based on RBIR metrics. In IEEE 802.16 Broadband Wireless Access Working Group; IEEE: Atlanta, GA, USA, 2007. [Google Scholar]
  34. Zhang, J. Research on Link Performance Cognition and Channel Status Information Feedback. Ph.D. Thesis, Beijing Jiaotong University, Beijing, China, 2009. [Google Scholar]
  35. Pan, J.; Li, W.; Xing, X. Optimally nonlinear weighting method for light-spot positioning. Opt. Tech. 2006, 5, 685–687. [Google Scholar]
  36. Zhang, J. Performance Analysis of Turbo Code in Frequency Hopping Communication and Realization in Wireless Communication System; Beijing University of Posts and Telecommunications: Beijing, China, 2018. [Google Scholar]
Figure 1. Illustration of the radiocommunication systems between train and trackside (RSTT) monitoring scheme at the on-board train. ATP: automatic train protection; DMI: driver–machine interface; GSM: Global System for Mobile Communications; LTE: long-term evolution.
Applsci 10 04814 g001
Figure 2. Example of the on-site measurement of disturbances in the Global System for Mobile Communications-Railway (GSM-R) band in the time-domain, (a) the pantograph arcing emission disturbance with data from [24] and (b) the interference from the GSM signal in the adjacent channel with data from [26].
Applsci 10 04814 g002
Figure 3. Illustration of the quality model under time-varying disturbance. BLER: block error rate; PDD: pulse duration distribution; RBIR: received bit information rate.
Applsci 10 04814 g003
Figure 4. Illustration of an MI-based quality model. SI: symbol mutual information.
Applsci 10 04814 g004
Figure 5. Illustration of the nonlinear weighting function g = f R 2 B t .
Applsci 10 04814 g005
Figure 6. Squared error of the BLER with t in the different distributions of the RBIR.
Applsci 10 04814 g006
Figure 7. Illustration of the case that the repeated cycle Tp is nearly equal to the length of the code block Q. EMI: electromagnetic interference.
Applsci 10 04814 g007
Figure 8. Illustration of the case that the repeated cycle Tp is much larger than the length of code block Q.
Applsci 10 04814 g008
Figure 9. Illustration of the case that the repeated cycle Tp is much smaller than the length of the code block Q.
Applsci 10 04814 g009
Figure 10. Test bench employed in the simulation.
Applsci 10 04814 g010
Figure 11. An example of the time-domain waveforms of the pulsed disturbance when σl = 1, σh = 10, ρ = 0.1, and the repeated cycle is Tp = 20Q, Tp = 1.5Q, Tp = 0.1Q, respectively.
Applsci 10 04814 g011
Figure 12. APD and PDD plots of the pulsed disturbances shown in Figure 11: (a) the same APD of all disturbances; (b) the PDD when Tp = 20Q, ρ = 0.1; (c) the PDD when Tp = 1.5Q, ρ = 0.1; and (d) the PDD when Tp = 0.1Q, ρ = 0.1.
Applsci 10 04814 g012
Figure 13. Simulation for the dynamic MI-based model, Long-Term Evolution (LTE) Turbo code (2/3 rate), 16QAM under different duty ratio (a) ρ = 0.1; (b) ρ = 0.9.
Applsci 10 04814 g013
Figure 14. Simulation for the dynamic MI-based model, IEEE802.16 LDPC code (2/3 rate), 16QAM under different duty ratio (a) ρ = 0.1; (b) ρ = 0.9.
Applsci 10 04814 g014
Table 1. Comparison of the proposed method based on statistical characteristics with previous work. ICF: impulsiveness correction factor; FEC: forward error correction.
Method to Monitor InterferenceModulation SchemeFEC Coding SchemeImpulsive DisturbanceNon-Impulsive Disturbance
Classification [7]
Instantaneous frequency histogram [15]
APD without ICF [14]
APD with ICF [17]
APD and PDD

